
Abstract
This article is an attempt at evaluating the progress in higher education attainment in India, using an innovative approach of reading such progress in terms of varying attainments by age cohorts (older to younger). In addition, characteristic differentials are accounted for in the evaluation of such progress. It reveals that group disparities tend to be lower among the younger age cohorts, and the pattern of social and gender disparities appears to be different in the rural and urban sectors. Gender disparity disappears in the youngest age cohort for the urban sector, while it remains significant in the rural sector, with a reasonable rural–urban disparity in overall progress in higher education. The urban female is perhaps the largest beneficiary of expansion in higher education, while the rural female remains most deprived and has benefitted the least.
Introduction
The relevance of higher education has received renewed attention in India in recent times, given the emphasis on a knowledge economy. India’s advantage of a sizeable young population with the potential to reap the demographic dividend calls for an emphasis on educating and skilling its youth. In today’s information society, where knowledge drives economic growth and development, the attainment of higher education serves as a pre-requisite for the production of knowledge, its dissemination, and its absorption. Education is a pre-requisite for better human capital, helping in knowledge production. The potential benefit of higher education has been unequivocally echoed worldwide (Birdsall & Londoño, 1997; Hamdan et al., 2020; Hanushek, 2016; World Bank, 1994, 2000, 2002). Every nation is encouraged to invest in higher education to have the benefits of research and development around the world. The significance of higher education in shaping the future development trajectory of the nation has made the government of India adopt several policy initiatives since independence, resulting in considerable expansion of higher education infrastructure and enrolment (Tilak, 2015). Such an expansion has its own challenges in terms of differentials and disparities that have emerged with regard to the attainment of higher education across regions, gender, and caste groups. While disparities are common to many development outcomes, their manifestation in education, particularly in general and higher education, serves to compromise on the expected dividend described above.
With this premise, this article is an effort at reading progress in higher education in India in consideration of its distributional features across the broad axis of gender, caste, and residence. Education is a typical outcome that is realised at a certain age and stage in life; therefore, its evaluation across age cohorts provides information on its temporal dimension. For a better depiction of education progress and its associated characteristic disparity, age-specific analysis of educational outcomes appears more relevant. Therefore, the evaluation of progress is made here by comparing the higher educational attainment of the older cohorts with the younger ones. Such a comparison is based on the rationale of educational attainment being conditioned by educational opportunities, which is relatively better for the younger age cohorts compared with their older counterparts. The higher education opportunities accessible at an individual’s college-going age shape the prospect of his/her higher educational attainment. Hence, the proposed analysis here informs on the temporal trends in attainment of higher education in India along with its characteristic divides that may help develop responsive, viable, and effective policy measures to realise the desirable progress in higher education with inclusive features. The input information for this purpose is the Periodic Labour Force Survey (PLFS) 2017–2018 conducted by the National Sample Survey Organisation, Ministry of Statistics and Programme Implementation (MoSPI), Government of India. This was an all-India representative survey based on a stratified multi-stage sampling design covering 102,113 households and enumerating 433,339 individuals.
Progress in Higher Education
Generally, attainment of graduation and above is referred to as higher education. Therefore, the level of higher education is described in terms of the graduation attainment rate, that is, the proportion of individuals having at least a graduation degree. This proportion is presented in Table 1 over the years to gauge the educational progress in India. The graduation completion rate in India has risen from 3.8 per cent in 2004–2005 to 7.7 per cent in 2017–2018 for the entire population. However, this increase is manifested differently when conditioned by age, like it increased from 5.7 per cent to 10.4 per cent for the population of age 15 plus and 6.4 per cent to 10.8 per cent for the population of age 25 plus. This indicates that an effective comparison of this indicator depends on consideration of the effective age of attainment of graduation. Therefore, graduation rates should be compared only for the population of effective age, that is, aged 25 and above.
Percentage of People with Educational Qualification Graduation and Above.
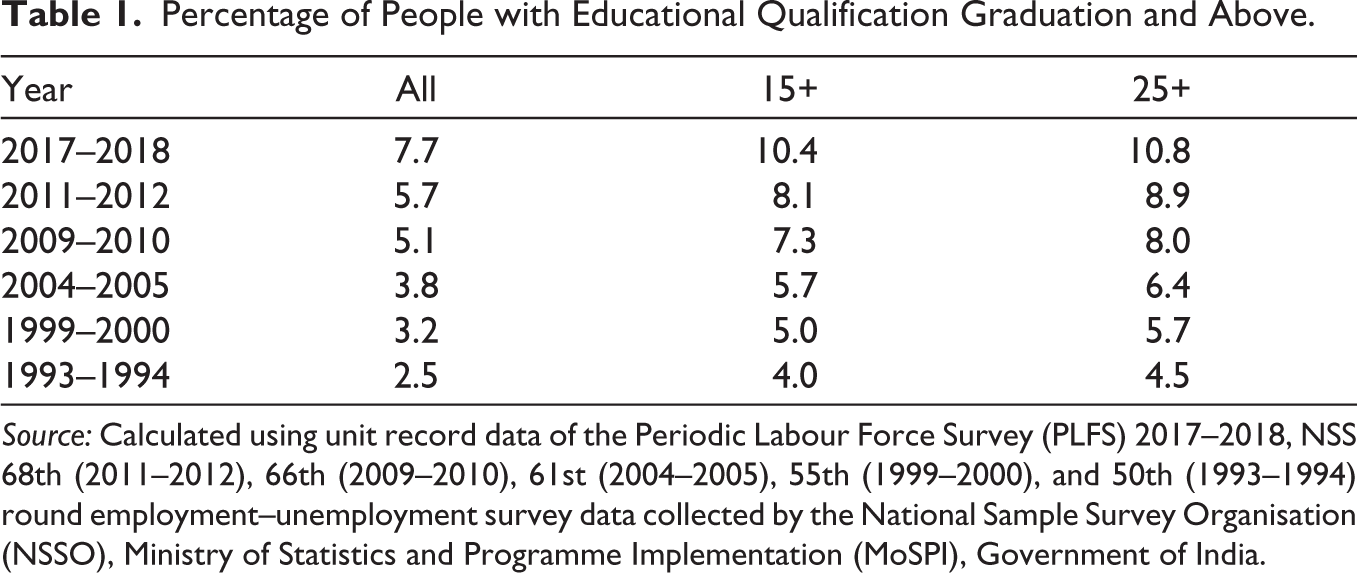
Source: Calculated using unit record data of the Periodic Labour Force Survey (PLFS) 2017–2018, NSS 68th (2011–2012), 66th (2009–2010), 61st (2004–2005), 55th (1999–2000), and 50th (1993–1994) round employment–unemployment survey data collected by the National Sample Survey Organisation (NSSO), Ministry of Statistics and Programme Implementation (MoSPI), Government of India.
The expansion of higher education is not, however, indicated by changes in the stock of graduates. The limitation is primarily caused by the differential likelihood of attaining higher education between generations, as educational attainment happens at an age and stage in life. Even without further expansion of higher education facilities, the overall graduation attainment of the whole population tends to rise if every older generation suffers lower graduation attainment than their younger counterparts at any given moment in time. While a study of educational progress is required to inform about the expansion of educational opportunities, it can also be captured by comparing the educational achievements of the younger generation to those of the older generation.
Therefore, when one inspects the completion rate of graduation in the age cohort (25–29), that is, 20.1 per cent, followed by the consecutive 5-year older age cohorts, it becomes apparent that there is a systematic improvement in the graduation completion rate over the years ( Table 2 ). Further, it also informs on the extent of required improvement to be made towards accomplishing a 50 per cent graduation completion rate as planned by the government (Ministry of Education, 2020) in the New Education Policy (NEP). Table 2 presents the progress in graduation completion rate over the age cohort, wherein this has moved from 5.9 per cent for the oldest age cohort (65–69) to 20.1 per cent for the youngest age cohort (25–29), revealing a trend of 40 years of progress.
Percentage of People Who Completed Graduation.
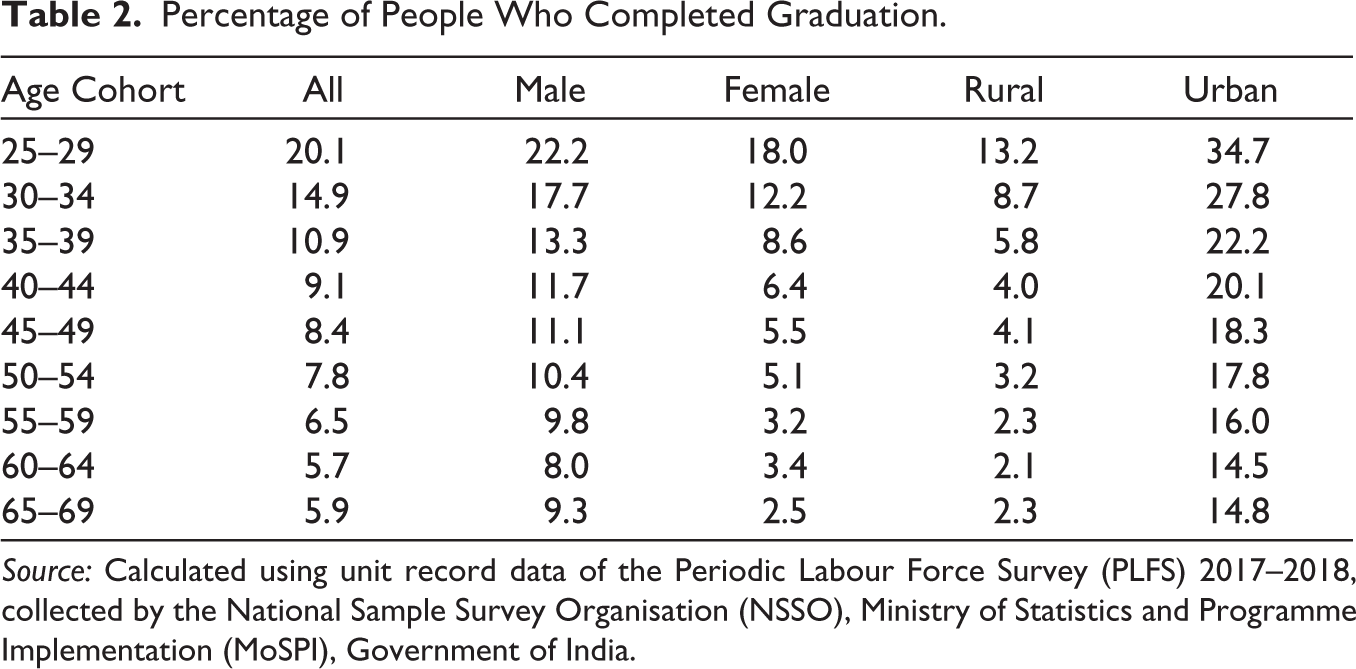
Source: Calculated using unit record data of the Periodic Labour Force Survey (PLFS) 2017–2018, collected by the National Sample Survey Organisation (NSSO), Ministry of Statistics and Programme Implementation (MoSPI), Government of India.
These proportions depict a systematic pattern over the age cohorts, with greater share of graduates among the younger cohorts compared to their older counterparts. This is primarily due to the greater access to education in recent times, benefitting the younger cohorts compared with the older ones. In the social sciences, this is known as the cohort effect (or generation effect). A cohort (generation) is described here as a group of people who were born in the same year or period and hence get older over time. Older cohorts are less educated than younger cohorts in almost every nation because education is concentrated in the younger cohorts and most education systems have expanded over time.
The age cohort-based analysis of attainment of higher education, graduation, and above is therefore an appropriate means of evaluating the progress in higher education. Age-specific analysis remains the most appropriate tool to examine the expansion in higher education over a longer period, using information collected at one specific point in time, that is, the PLFS 2017–2018 in the present case. In the present analysis, age cohort (65–69) is considered as the oldest age cohort and (25–29) as the youngest one. It provides the dynamics of higher education progress over a period of 40 years. The age cohort 65–69 is composed of those individuals born during 1948–1953, and the age cohort 25–29 is composed of those born during 1987–1993. These definitions of age cohorts provide information about the changes in the likelihood of being highly educated for individuals born at intervals of every 5 years. It also helps in gauging the scale of improvement in the outcome of interest. When compared to older age cohorts, the graduate attainment rate of the youngest age cohort indicates the expansion of opportunities in higher education. Once the youngest age cohort achieves an optimum point where no more improvement is feasible, the only way to experience general educational improvement is through age cohort replacement. The age-specific examination of progress in higher education in India remains unexplored, although it has been attempted for literacy (Shukla & Mishra, 2014a, 2017, 2019a) and measuring progress in mean years of schooling (Shukla & Mishra, 2019b). Shukla (2021) attempted to analyse progress in educational attainment at the national level using 2011 Census data. However, a detailed investigation of group disparities in higher education over the age cohort is presently unavailable.
Disparity in Higher Education
Evaluation of any aspect of development remains incomplete without analysing differences across various subgroups of the population. It not only helps in the valuation of the aggregate performance but also helps in the assessment of the implied welfare through an inclusive lens. Discounting the distributional feature and making assessment based on any aggregate measure may often be inadequate and misleading on occasions. The Human Development Report (HDR)-1995, published by United Nations Development Programme (UNDP), presented the group disparity-adjusted Human Development Index (HDI). This attempt was made to give prominence to the gender disparity and its implications on overall reading development. The report treated gender inequality as one of several possible inter-group inequalities and based its analysis on the common assumption in economics that individuals and societies have an aversion to inequality. If two societies had the same average achievement, aversion to inequality would mean that the society with the lower inter-group inequality should be socially preferable to the one having the similar average achievement with larger inequality.
It is well known that educational attainment in India is not homogeneous across different subgroups of the population. Sector of origin (rural–urban), gender (male–female), and social groups are the commonly addressed topics of group disparity in education. Table 2 presents the graduation completion rate by gender (male–female) and sector (rural–urban) across the age cohort. It has been noted that the graduation completion rate is improving over the age cohorts for both sexes and sectors. Among males, it has risen from 9.3 per cent among individuals belonging to the age cohort (65–69) to 22.2 per cent among those belonging to the age cohort (25–29), and the similar shift among females was from 2.5 per cent to 18.0 per cent. This clearly conveys the male advantage in graduation completion rate over time, even though there is systematic improvement in this outcome among females as well. However, male–female disparity, measured in terms of the simple ratio of male to female graduation completion rate, declines over the age cohort. While this remained the widest for the age cohort (65–69), it has substantially narrowed for the age cohort (25–29). Based on residential classifications, the rural sector manifests an improvement of 2.3 per cent to 13.2 per cent as against the urban sector with a shift from 14.8 per cent to 34.7 per cent. This undoubtedly depicts the rural disadvantage despite a decrease in rural–urban differences, measured in terms of the simple ratio of urban to rural graduation completion rate over the age cohort. However, there remains a large rural–urban disparity for the youngest age cohort.
Another important dimension of reading group disparity is social disparity. The social group identity comprises four groups—Others, other backward class (OBC), scheduled castes (SCs), and scheduled tribes (STs). In the present analysis, SCs and STs are combined into a single group, SC/ST. It is widely acknowledged that people belonging to the OBC group are at a disadvantage when compared to ‘Others’, and SCs/STs are at a disadvantage when compared to the OBCs in almost every aspect of development (Panagariya & More, 2014; Shukla & Mishra, 2014b; Tilak, 2015). The graduation completion rate for three subgroups—‘Others’, ‘OBC’, and ‘SC/ST’—are presented in Figure 1 , which reveals a systematic improvement in the graduation completion rate over the age cohort. It is noted that the graduation completion rate for social group ‘Others’ is higher than that of OBCs, followed by the SCs/STs. The disparity between ‘Others’ and other two social groups is quite large, while disparity between the OBCs and SCs/STs is less. It is also observed that the graduation completion rate improves at a faster pace for the age cohort younger than 40–44 years in comparison to the older cohort. The graduation completion rate improved from 11.9 per cent in the age cohort (65–69) to 29.7 per cent in the age cohort (25–29) for the social group ‘Others’, from 3.9 per cent to 19.1 per cent for the OBCs and for the SCs/STs, it increased from 2.0 per cent to 12.3 per cent.
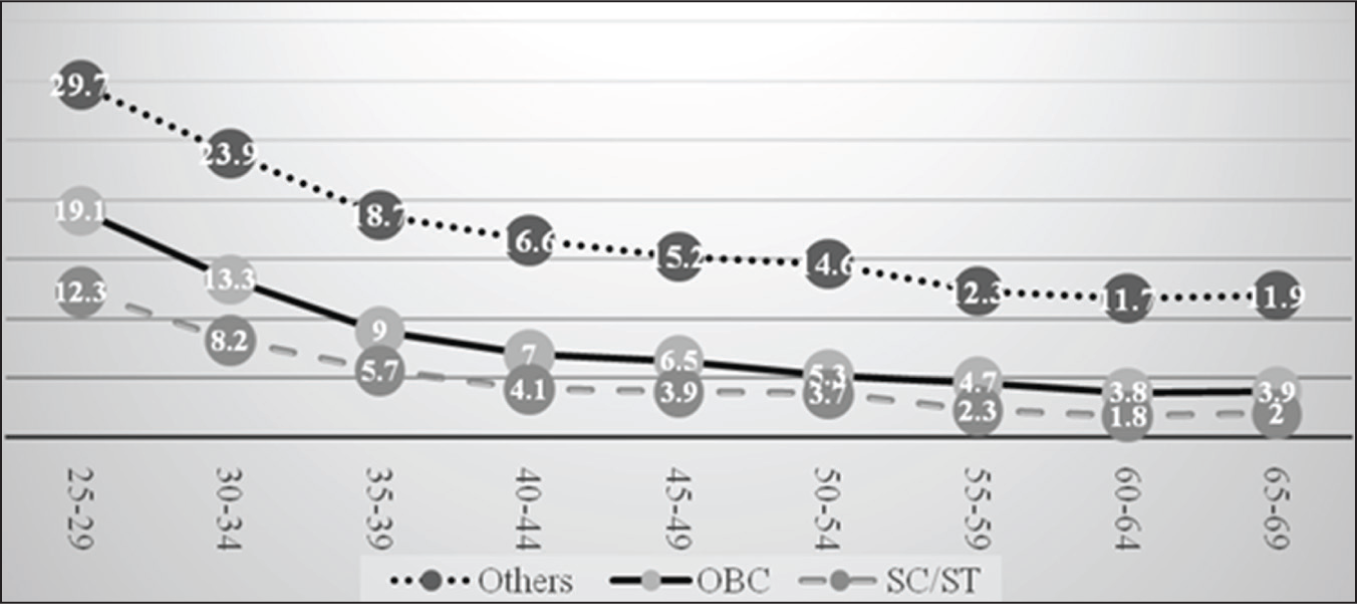
Source: Computed from unit record data of the Periodic Labour Force Survey (PLFS) 2017–2018, collected by the National Sample Survey Organisation (NSSO), Ministry of Statistics and Programme Implementation (MoSPI), Government of India.
The analysis of group deprivation/achievement based on the categorisation of groups across a single dimension overlooks the fact that the advantage/disadvantages get significantly intensified when read across intersectional identity groups. For example, the graduation completion rate among a group of individuals advantaged in terms of gender and sector of origin is larger than the group of individuals advantaged across any single dimension. The measurement of group disparity can, therefore, be enhanced by analysing groups formulated as a combination of multiple characteristics/identities. The incorporation of such concern in analysis would not only help us to discern the characteristics/identities that are linked with graduation completion rate, but also inform us on the extent to which the aggregate achievement masks the observed disparity across groups.
Considering two binary classifications—gender (male–female) and sector of origin (rural–urban), we can obtain four disjoint and mutually exclusive groups: urban male, urban female, rural male, and rural female. Figure 2 presents the graduation completion rate over the age cohort for four disjoint subgroups: rural male, rural female, urban male, and urban female. The graduation completion rates across four subgroups offer a better understanding of group disparity in this outcome. All four subgroups registered an increase in graduation completion rate over the age cohorts, but with a differential pace. The urban female registered the fastest and most consistent improvement compared with the other three subgroups. All the subgroups did show remarkable improvements for the age cohorts younger than 40–44. In fact, the urban females display a clear advantage over other subgroups, particularly for the youngest age cohort of 25–29 years. The gender disparity in this outcome in the rural sector is quite in contrast with the urban scene, as this disparity has widened among the younger cohorts as opposed to the older cohorts.
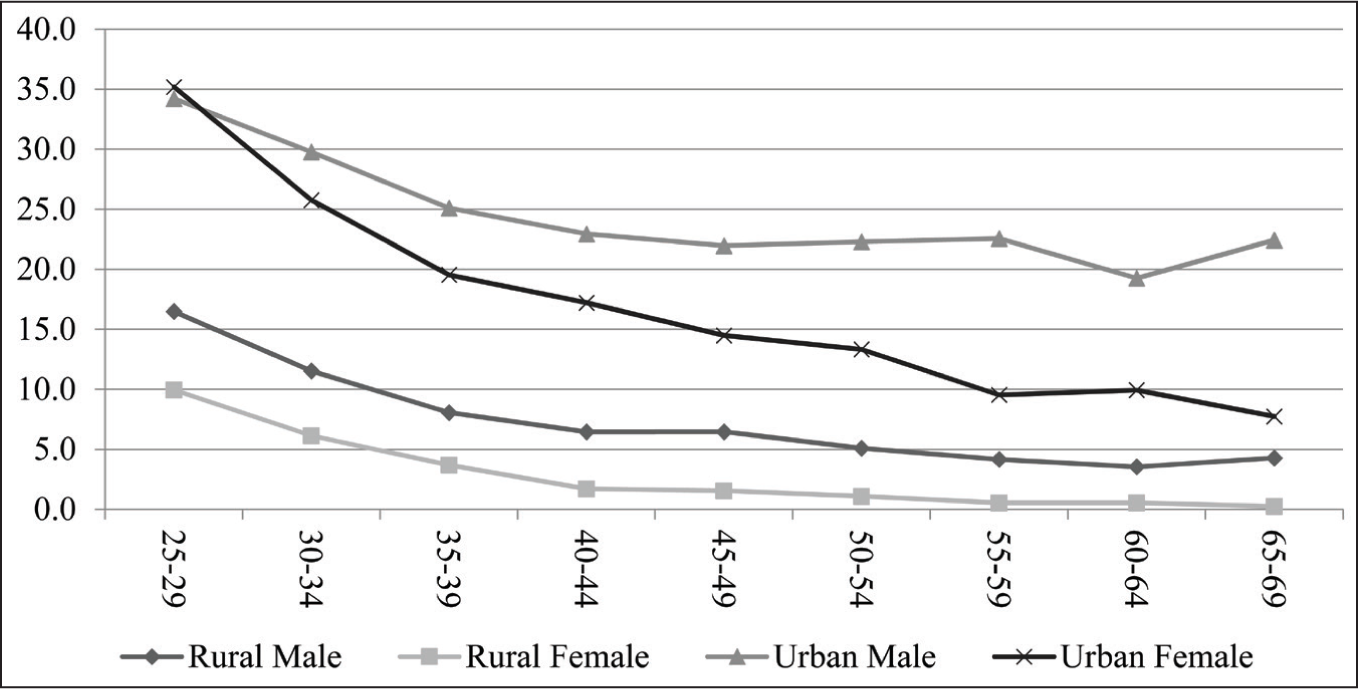
Source: Computed from unit record data of the Periodic Labour Force Survey (PLFS) 2017–2018, collected by the National Sample Survey Organisation (NSSO), Ministry of Statistics and Programme Implementation (MoSPI), Government of India.
The analysis of graduation completion rate among the population of the youngest age cohorts (25–29) based on a four-fold classification reveals two important observations: (a) Males having an advantage over females no longer hold in the urban sector; (b) gender disparity in graduation completion rate is only a rural phenomenon now. These two observations contest the perception about the gender disparity revealed by the analysis based on binary classification.
The comparative analysis of urban females and rural males deserves exploration. Both of these subgroups experience similar degrees of disadvantages. The former is disadvantaged by being female and the latter by being rural. It is observed that urban females are far ahead of rural males in terms of graduation completion rate. Moreover, the disparity between both subgroups continuously increases over the age cohorts. For the population belonging to the youngest age cohort (25–29), the graduation completion rate of urban female is more than twice that of rural male. Therefore, it can be inferred from the analysis that the urban females are perhaps the largest beneficiary of expansion in higher education. The rural female remains the most deprived subgroup over the age cohorts and has benefitted the least.
By incorporating social groups (‘Others’, ‘OBC’, and ‘SC/ST’), with gender (‘male’ and ‘female’) and the sector of origin (‘rural’ and ‘urban’), a set of 12 mutually exclusive and completely exhaustive subgroups can be formed: six in each sector, rural and urban. For the rural sector, they are denoted as RMO (rural, male, Others), RFO (rural, female, Others), RMB (rural, male, OBC), RFB (rural, female, OBC), RMS (rural, male, SC/ST), and RFS (rural, female, SC/ST). For the urban sector, they are denoted as UMO (urban, male, Others), UFO (urban, female, Others), UMB (urban, male, OBC), UFB (urban, female, OBC), UMS (urban, male, SC/ST), and UFS (urban, female, SC/ST).
Figure 3 presents the graduation completion rate over the age cohort for the six subgroups of the rural population. It is clearly observed that RMO appears to be the best-off subgroup, and RFS remains the worst-off subgroup in the rural population over the age cohort. The differences in graduation completion rate between the best-off and worst-off subgroups among the rural population increase from the oldest age cohort (65–69) to the youngest age cohort (25–29). It should be highlighted here that for a long time RFS and RFB subgroups did not register any significant progress. The RMO is far ahead of other subgroups in the rural sector. The RMB and RFO are at similar levels. In each social group in the rural sector, males are at advantage with respect to their female counterparts. On the basis of graduation completion rate in the youngest age cohorts (25–29), these six subgroups of rural population are arranged in the following sequence: RMO, RMB, RFO, RMS, RFB, and RFS, where RMO has the highest graduation completion rate and RFS the least. One of the important observations to be noted here is that males of every social group are in a relatively advantageous position with respect to females of immediate better-off social subgroup. Males from OBC (RMB) are in a relatively advantageous situation compared to females from the ‘Other’ groups. Males from SC/ST (RMS) are in a relatively advantageous situation compared to females from the ‘OBC’ (RFB) group.
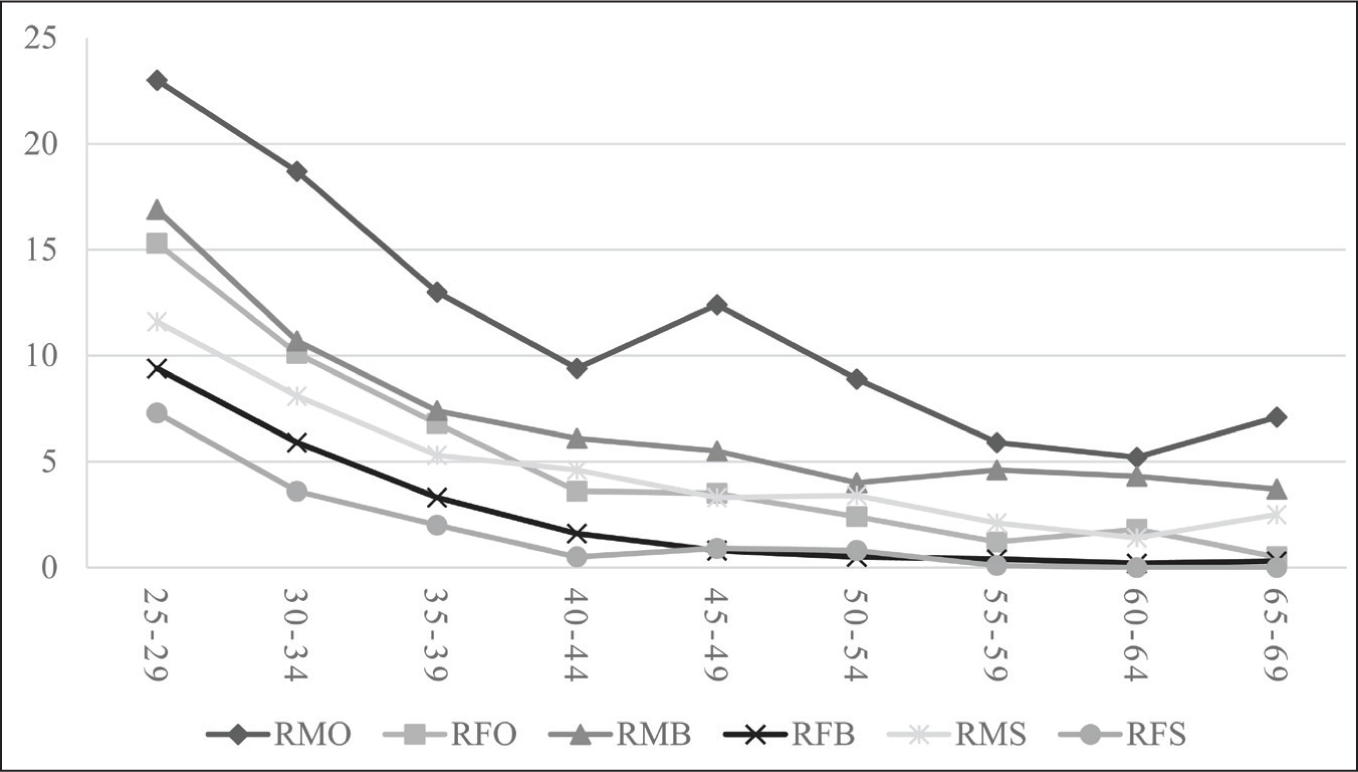
Source: Calculated from unit record data of the Periodic Labour Force Survey (PLFS) 2017–2018, collected by the National Sample Survey Organisation (NSSO), Ministry of Statistics and Programme Implementation (MoSPI), Government of India.
Going by Figure 4 , urban India observes a higher graduation completion rate of females than males for the social groups ‘Others’ and ‘OBC’ among the population of the youngest age cohorts (25–29). The pattern is opposite for the social group SC/ST, where males have a higher graduation completion rate than females, though the gap is quite small. The improvement in graduation completion rate among females is faster than that of males. It is true for all three social groups. There is quite a large gap across the three social groups. The graduation completion rate is highest for Others (41.9 per cent), followed by OBC (33.0 per cent) and SC/ST (23.3 per cent).
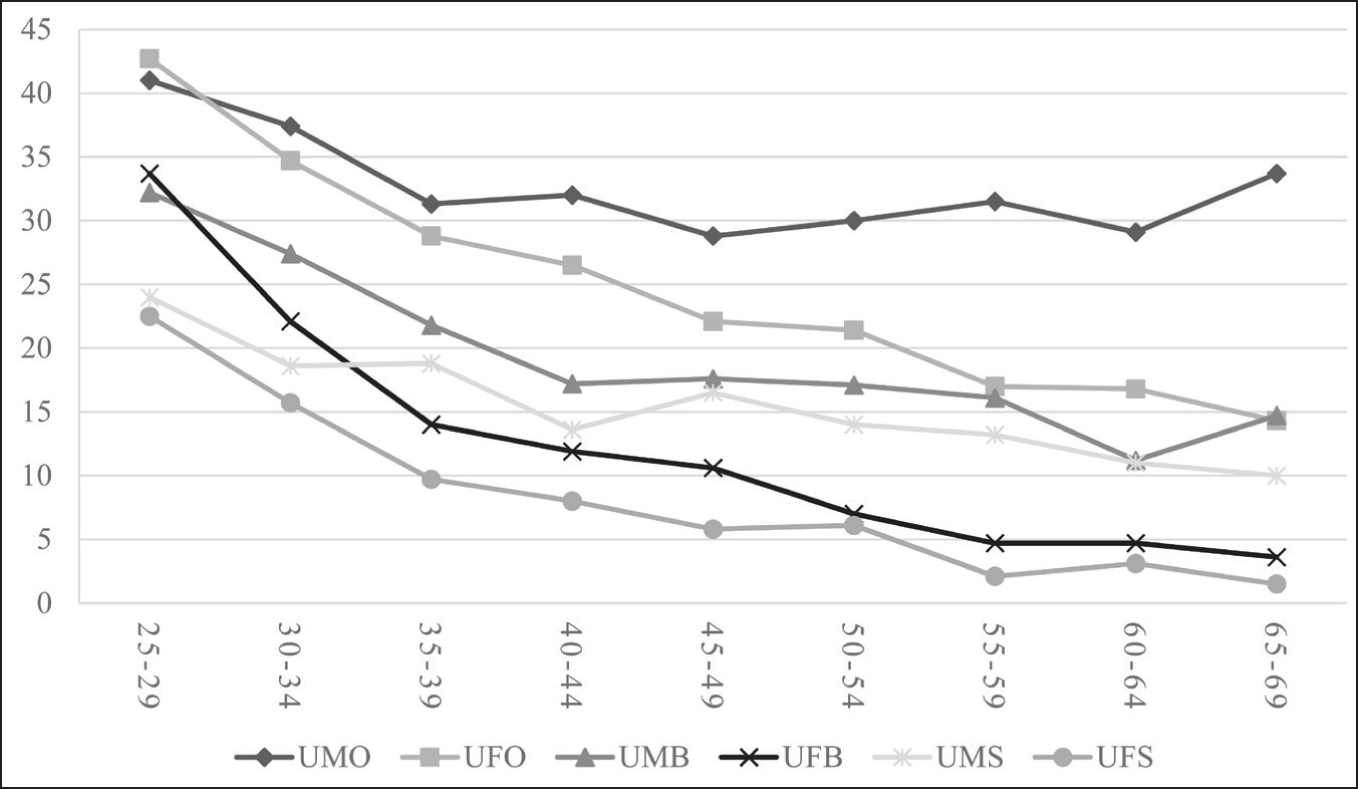
Source: Computed from unit record data of the Periodic Labour Force Survey (PLFS) 2017–2018, collected by the National Sample Survey Organisation (NSSO), Ministry of Statistics and Programme Implementation (MoSPI), Government of India.
The group disparity in graduation completion rate can be measured simply as a ratio of graduation completion rate of the concerned subgroup in relation to the most privileged subgroup. This is represented by the GCR m /GCR j , where ‘m’ is the most privileged group and ‘j’ is the relevant group. The formula is popularly used to measure the gender disparity in gross enrolment ratio (GER). The value of the index is presented in Table 3 .
Group Disparity Index for Graduation Completion Rate.
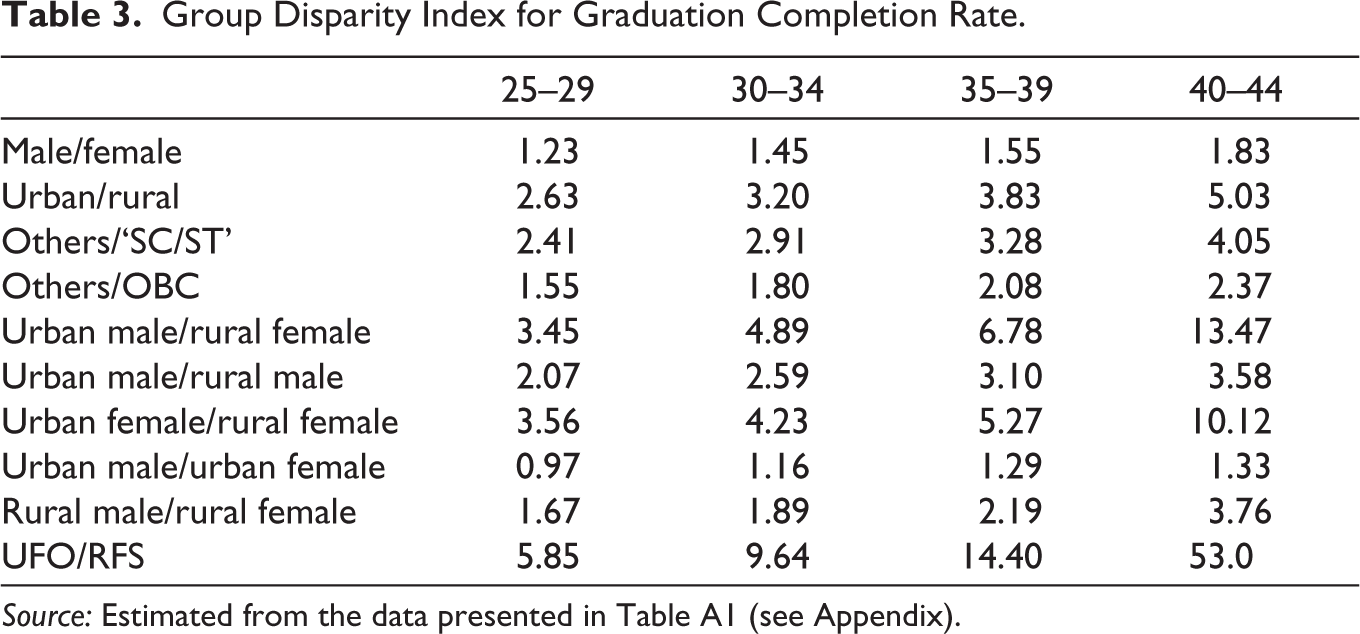
Source: Estimated from the data presented in Table A1 (see Appendix).
The observed characteristic disparity between groups when read in binaries remains lower, as displayed in Table 3 . However, such disparity has a consistent pattern of improvement over time, as indicated by the comparison over age cohorts. For instance, the comparison over the 5-year age cohorts displays a consistent decline in this disparity, and the least is observed among the youngest age cohort, irrespective of any characteristics. Based on the observed divide, the gender-based divide is the lowest as against the residential and caste divide in this phenomenon. However, the notable distinction relates to the rate of improvement in this divide being greater with reference to caste and residence. Given this observation, it is rather important to go beyond the binaries to read divides or their associated improvement over time. On this count, the magnitude of gender divide widens when read within caste and residence categories. Such an observation cautions against reading the gender divide in aggregate, but in consideration of other characteristic attributes. For instance, if we read the residential divide for males and females independently, the rural–urban divide is large in case of females when compared with males. Further considering gender along with residence, the largest gap is between urban males and rural females. This is despite the fact that females have an advantage over males in urban areas. Similar to the comparison in consideration of social groups, the largest gap is observed between urban females belonging to other social groups and rural females in SC/ST category. This is revealing the significance of intersectional categories that widen the divide and help identify the group for focused intervention towards attaining convergence. The only encouraging feature of this enquiry refers to improvement in every characteristic group.
Figure 5 presents the information on the graduation attainment rate of the youngest age cohort (25–29) for all 12 subgroups of the population. The groups are arranged in descending order of the group-specific graduation attainment rate. The overall graduation completion rate of the nation for the youngest age cohort (25–29) is 20.1 per cent, presenting a wide characteristic variation with the two polar extremes, the UFO and RFS groups, having graduation completion rates of 42.2 per cent and 7.3 per cent, respectively. An average figure of 20.1 per cent hides this enormous difference experienced by the best-off group and worst-off groups. The graduation completion rate of the former group is nearly six times as large as that of the latter group. The first five best-off subgroups are from the urban sector, followed by the best-off subgroup (RMO) of the rural sector. Graduation completion rate for the best-off rural subgroup (RMO) is quite similar to the worst-off urban subgroup (UFS). This demonstrates the clear advantage of the urban sector over the rural sector in terms of graduation completion rate.
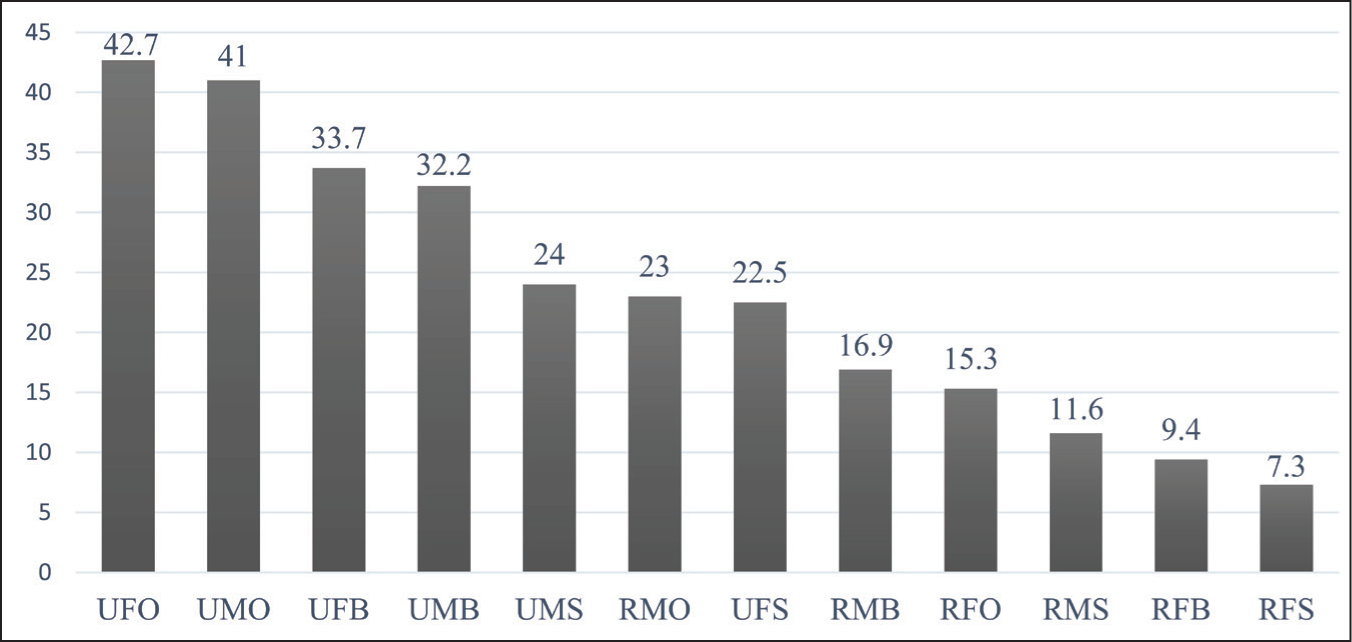
Source: Calculated using unit record data from the Periodic Labour Force Survey (PLFS) 2017–2018, gathered by the National Sample Survey Organisation (NSSO), Ministry of Statistics and Programme Implementation (MoSPI), Government of India.
Interstate Disparity
A similar exposition of progress in graduation completion rates made across the Indian states is presented in Table 4 . Here, the graduation completion rates are presented over the age cohorts, and the range is considered as a measure of progress. Such a range is derived from the difference in graduation completion rate between the ages 25–29 and 65–69 that accounts for a performance of about 40 years. Based on this computation, Tamil Nadu and Telangana stand out as the best-performing states, where the proportion of graduates increased by 24 and 24.2 percentage point, respectively. Kerala, Himachal Pradesh, and Uttarakhand also recorded impressive improvements in graduation completion rates, which increased by 21.2, 20.2, and 20.0 percentage point, respectively. The states of Assam and West Bengal have the lowest improvement in terms of graduation completion rates. Here, the proportion of graduates increased by 5 percentage point from the oldest to the youngest age cohort. The other states with the lowest educational expansion are Chhattisgarh, Odisha, and Bihar.
Graduation Completion Rate Across Indian States over the Age Cohorts.
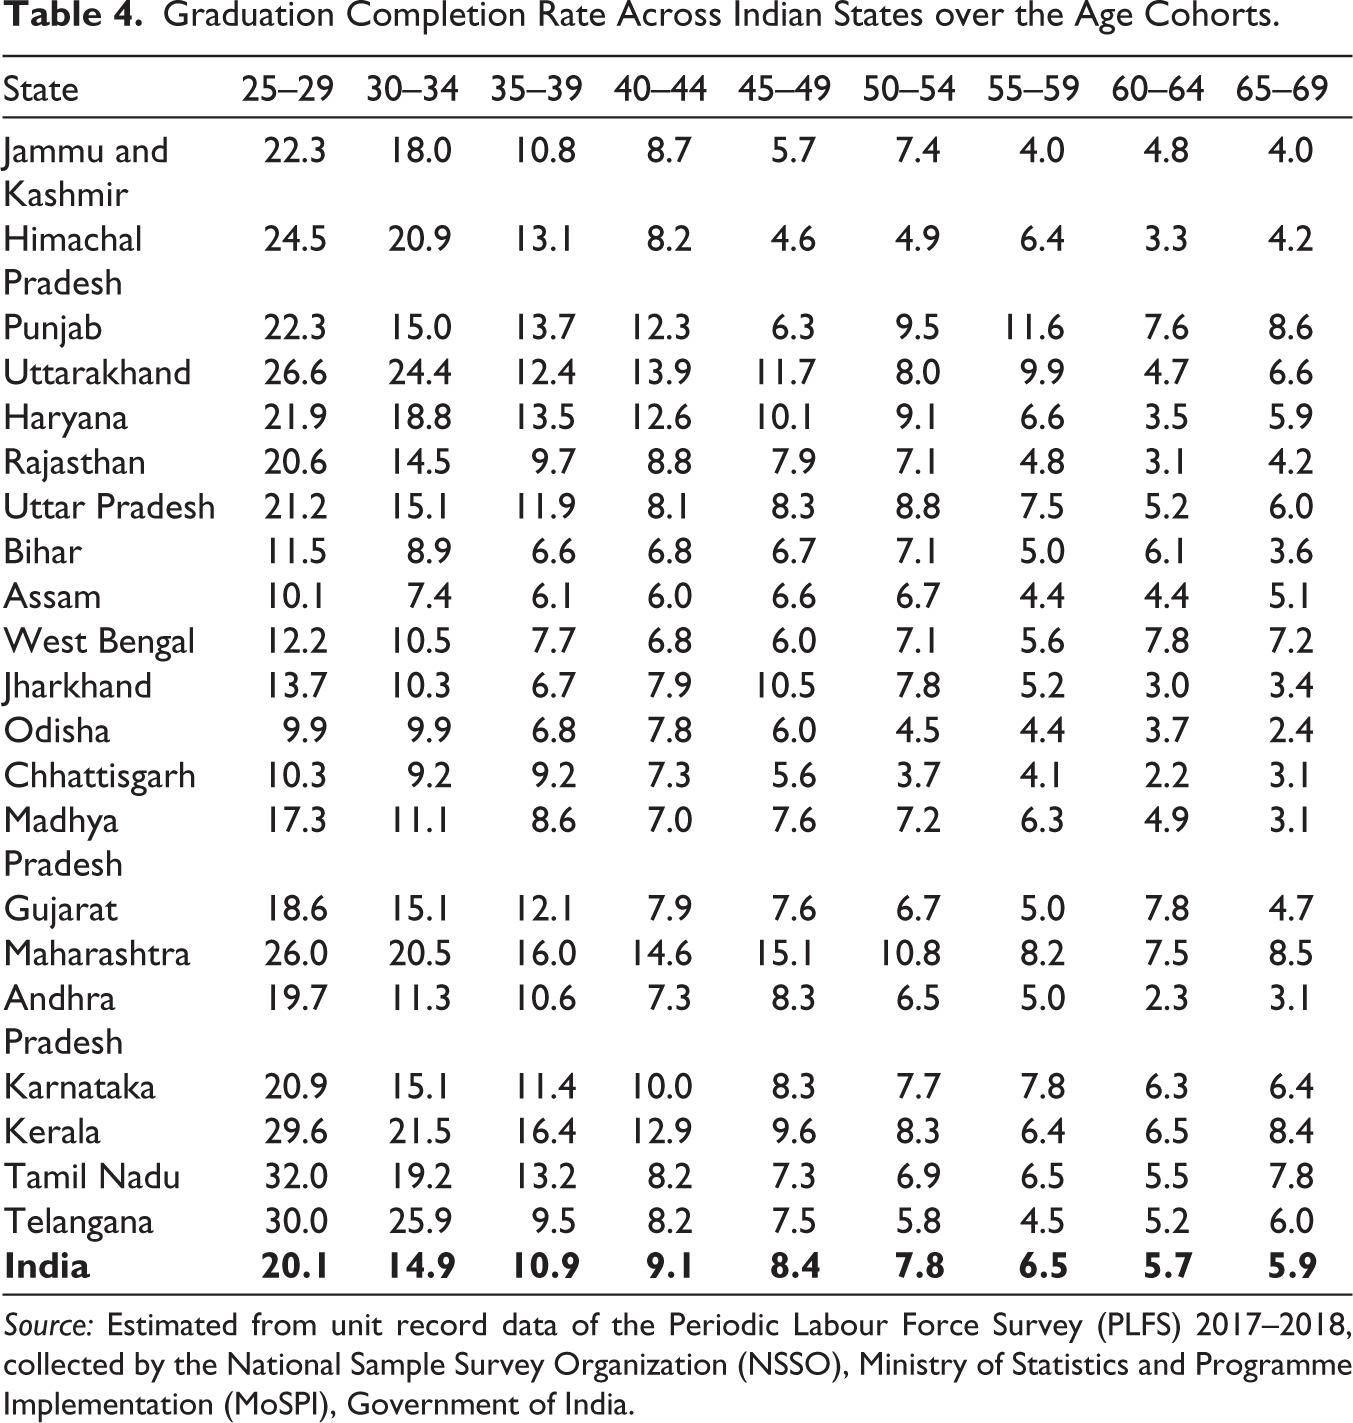
Source: Estimated from unit record data of the Periodic Labour Force Survey (PLFS) 2017–2018, collected by the National Sample Survey Organization (NSSO), Ministry of Statistics and Programme Implementation (MoSPI), Government of India.
Slow educational performance indicated by the proportion of graduates in the poorest states (Assam, Chhattisgarh, Odisha, and Bihar) presents the exclusionary nature of educational expansion. The state of West Bengal presents a case with a high level of initial educational attainment but slow progress. Therefore, the relative ranking of West Bengal among the major Indian states fell from 5th for the oldest age cohort (65–69) to 17th in the youngest age cohort (25–29).
The educational level of the youngest age cohort is more crucial for policy formulation than the educational attainment of the population as a whole. It is the educational attainment of the younger age cohort that determines the pace and direction of the future prospects of the trajectory. The prevailing level of educational attainment of the younger age cohort is the result of the resources invested in education. The better-educated younger age cohort has its own positive externalities on the older generation, which help them adopt the new technologies necessary for upward economic mobility. The model put forward by Galor and Tsiddon (1997) predicts a positive relationship between intergenerational educational mobility and income growth.
The graduate completion rate for the youngest age group (25–29) varies greatly across states. There is a significant disparity between the best-performing and worst-performing states. On the one hand, there are states like Tamil Nadu (32.0 per cent), Telangana (30.0 per cent), and Kerala (29.5 per cent) that have graduation completion rates near or above 30 per cent for the youngest age cohort, while on the other hand, there are states like Odisha (9.9 per cent), Assam (10.1 per cent), Chhattisgarh (10.3 per cent), Bihar (11.5 per cent), West Bengal (12.2 per cent), and Jharkhand (13.7 per cent) that have graduation completion rates that are very low.
The overall graduation completion rate of the nation for the youngest age cohort (25–29) is 20.1 per cent, which amounts to a wider range represented by the states of Tamil Nadu and Odisha with 32.2 per cent and 9.9 per cent, respectively. An average figure of 20.1 per cent therefore masks such regional differences that undoubtedly are a derivative of the mismatch between infrastructure and the demand for higher education. Apart from the wider range of differences in graduation attainment, it is also pertinent to note the kind of progress made by the states in reading this outcome across age cohorts. The lowest magnitude of performance for the state of Odisha is accompanied by a four-fold improvement during the 40-year period. In fact, some states like Andhra Pradesh, Madhya Pradesh, Rajasthan, and Himachal Pradesh too have made five to six-fold improvements in this outcome.
Another alternative exposition of characterising advantage/disadvantage in terms of graduation completion rate in contrast with the national performance places states with the degrees of such advantage/disadvantage. Table 5 presents such an outcome measured by the GCR s /GCR I , where ‘s’ is the state and ‘I’ is the nation. It is estimated by the age cohorts. Numerically, a value higher than 1.0 represents an advantage and a value lower than 1.0 represents a disadvantage; however, for the simplification of analysis, we have considered the value 0.98 to 1.03 equivalent to the national average (neither advantage/disadvantage).
Graduation Parity Index with Respect to India.
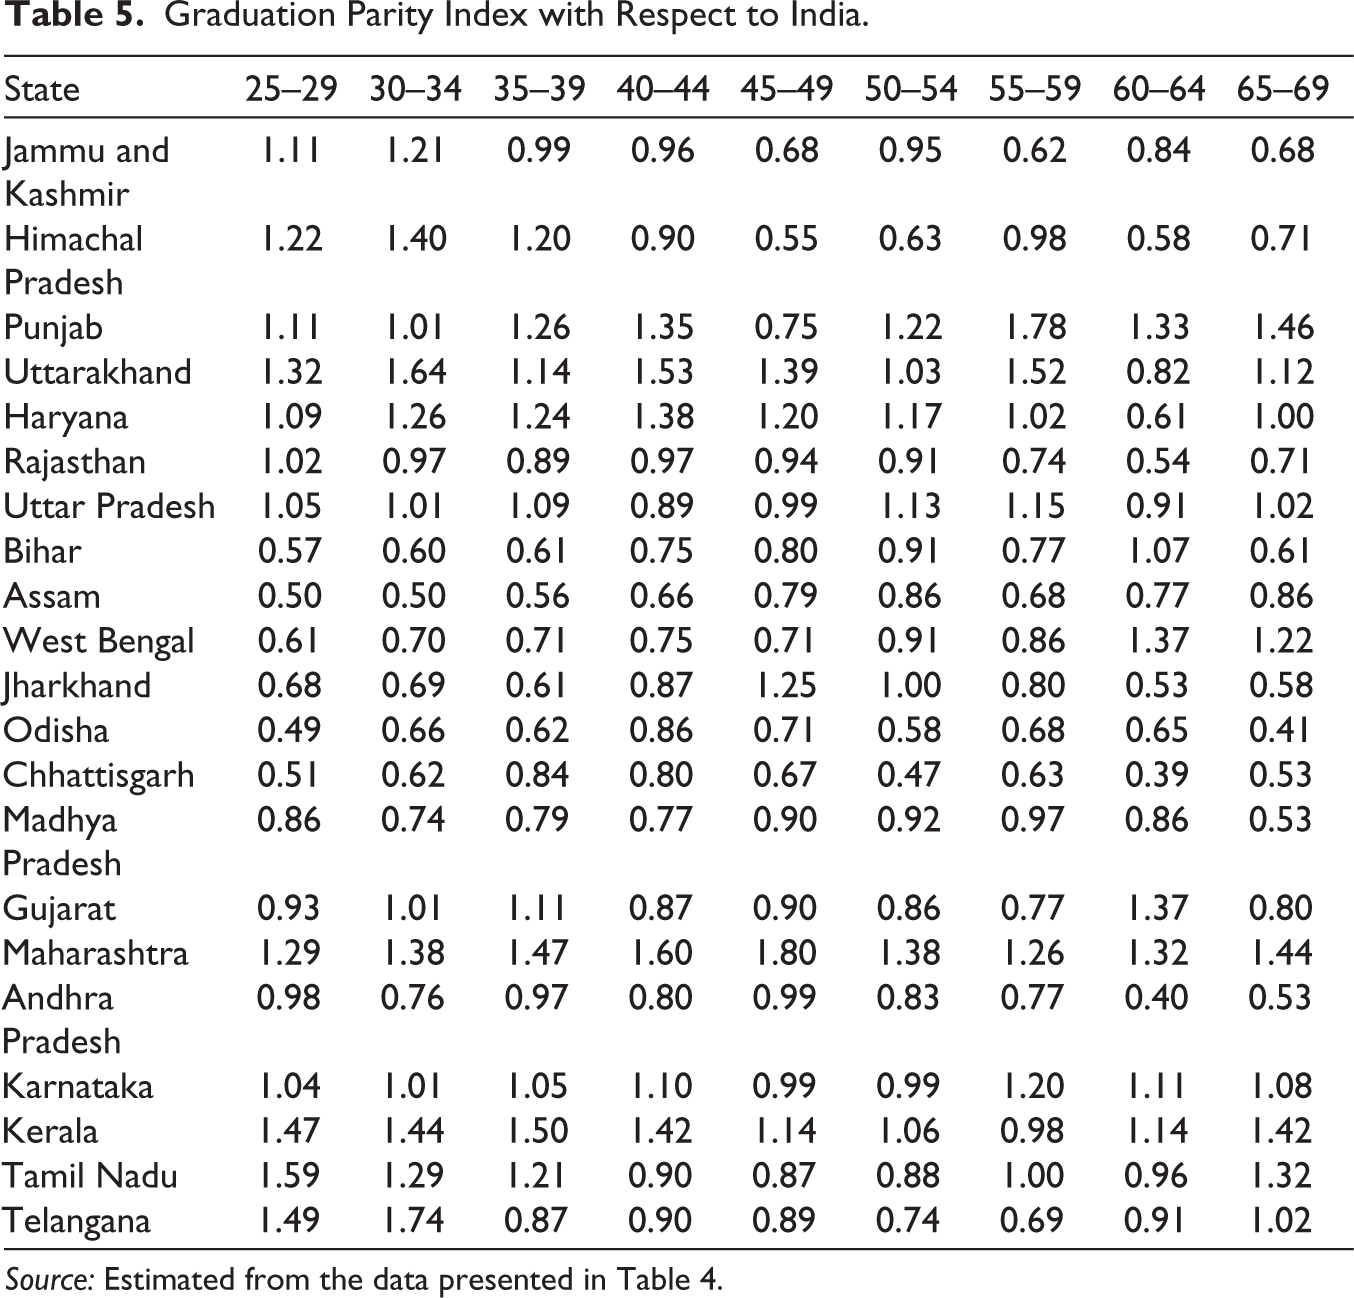
Source: Estimated from the data presented in Table 4.
According to progress in graduation completion rate, the states presented in Table 5 can be grouped in three categories. First, those states have a graduation completion rate higher and/or equal to the national average for most of the age cohorts. These are Punjab, Uttarakhand, Haryana, Uttar Pradesh, Maharashtra, Karnataka, and Kerala. These states have been in an advantageous position in comparison to the national average for a long period. Second, the states have a higher graduation completion rate in comparison to the national average for younger age cohorts. The states of Jammu and Kashmir, Himachal Pradesh, Tamil Nadu, Telangana, and Rajasthan qualify for this group. These states have improved their situation in comparison to the national average. Rajasthan remained disadvantaged for a long period but became equivalent to the national average only for the youngest age cohort. Bihar, Assam, West Bengal, Jharkhand, Odisha, Chhattisgarh, Madhya Pradesh, Gujarat, and Andhra Pradesh fall in third category. These states remain disadvantaged with respect to the national average over the age cohorts, although their intensity of disadvantage differs. The states of Odisha, Assam, West Bengal, and Chhattisgarh are far below the national average. Moreover, their disadvantages with respect to the national average increased for the younger age cohort.
The analysis of graduation completion rate presents a clear development divide among Indian states. On the one hand, there are states progressing faster than the national average, and on the other hand, there are states progressing slower than the national average. The states with slow progress have a large pool of non-graduate population, while the states with better progress have a large share of older population with graduate qualifications. This phenomenon may result in a widening development divide among the rich and poor states. It is well established in the literature that education is closely linked with various aspects of development (Hannumand & Buchmann, 2005). As a result, disparities in education may lead to disparities in other elements of development.
Conclusion
The article indicates that mapping higher education achievement over age cohorts provides an in-depth understanding of educational advancement. It provides information on how the likelihood of being highly educated has changed for each age cohort of the population. It allows for the comparison of any age cohort’s higher education attainment rate with other age cohorts in the population. The information obtained from this study would be more useful for policy formulation and analysis than that provided by previous studies. For example, if the policy goal is to improve gender equity, it is vital to know whether the observed disparity is due to the older or younger age cohort. Furthermore, despite the use of a single data point, this article presents a long-term view of educational progress.
Based on an examination of PLFS 2017–2018 data, it is clear that higher education attainment in India has been improving over the age cohorts. There is a clear rural–urban divide in graduation completion rates, with rural disadvantage. As regards gender disparity in this outcome, it is more of a rural phenomenon. Surprisingly, there is a female advantage in this regard in the urban sector. Social disparity is observed to be different in the rural and urban sectors. In the urban sector, there is clear dominance of ‘Other’ over OBC and OBC over SC/ST. This is not the case in the rural sector. In the rural sectors, ‘Other males’ dominate over ‘OBC males’, ‘OBC males’ dominate over ‘Other females’, and ‘SC/ST males’ dominate over ‘OBC females’.
The article demonstrates that rather than using binary classification, it is possible to gain a better understanding of group disparities in graduation completion rate by analysing it for 12 disjointed subgroups of the population. There is a huge gap in graduation completion rates between the best-off (UFO) subgroup (42.2 per cent) and the worst-off (RFS) subgroup (7.3 per cent) of the population. An average figure of 20.1 per cent hides this enormous difference experienced by the best-off and worst-off groups.
The interstate analysis of graduation completion rate over the age cohorts presents a wide disparity among Indian states. Some states are progressing faster than the national average, while others are progressing slower. This phenomenon may lead to an increasing educational divide among the states. This may further translate into various other aspects of the developmental divide.
Discussion and Policy Suggestions
In a country where a major share of population (68 per cent) still lives in rural areas, the lower graduation completion rate of the rural population does have a bearing on the overall educational attainment of the country. Therefore, it would be near impossible to materialise the goal of higher education without addressing the educational aspirations of rural folk, particularly in poor states.
According to the 2011 Census, there were as many as 112.8 million children aged 0–4. By 2031, they will attain the age of 20–24, becoming potential candidates to participate in higher education. In 2018–2019, 37.4 million students were enroled in higher education institutions (Ministry of Education, 2019); it needs to be increased to 56.4 million if 50 per cent enrolment has to be achieved. Therefore, enrolment capacities of higher education institutions require massive expansion.
The potential candidates to acquire higher education are disproportionately represented by rural people. According to the 2011 Census, out of a total of 112.8 million children aged 0–4, 82.9 million (73.5 per cent) live in rural areas.
Expansion of higher education facilities needs focus in the states with greater strength of child population (0–4 years). According to the 2011 Census, Bihar (12.3 per cent), Jharkhand (11.1 per cent), Rajasthan (10.7 per cent), Madhya Pradesh (10.3 per cent), and Uttar Pradesh (10.2 per cent) are the major states with the highest share of child population (0–4 years). These five states together account for 45.7 per cent of the country’s child population (0–4 years). Given this skewed presence of potential demand for higher education in selected states, the avenues for higher education need balancing across regions to address disparities.
The goal of higher education set by NEP 2020 undoubtedly requires the expansion of higher education infrastructure with a focus on convergence across regions and bridging the existing rural–urban divide. Besides the supply aspect, there has to be incentivisation towards pursuing higher education among those who choose to join the work force against enroling in higher education. Such incentivisation could be scholarships, fee waivers, and, above all, better job potential. With the changing world order and the youth advantage, raising the levels of higher education would go a long way in serving the knowledge economy of tomorrow.
Footnotes
Declaration of Conflicting Interests
The authors declared no potential conflicts of interest with respect to the research, authorship, and/or publication of this article.
Funding
The authors received no financial support for the research, authorship, and/or publication of this article.