
Abstract
Since the introduction of the carbon Kuznets-curve hypothesis in the mid-1990s, the inverted U–shaped relationship between economic development and carbon emissions has remained a subject of debate in the social sciences. We engage tourism research in this debate, in a fourfold manner. First, we offer a systematic literature review concerning the role of tourism in the carbon Kuznets-curve hypothesis using a protocol-based reporting process. Second, we present the level of consensus with the carbon Kuznets-curve hypothesis and the conceptual gaps in the identified literature (n = 22). Third, we introduce an emerging concept, offering a novel tourism corporate/performance orientation to the carbon Kuznets-curve hypothesis. Fourth, we provide evidence of empirical validity using different econometric techniques from an international tourism corporation (n = 86) data set (2005–2018). The inverted U–shaped relationship between measures of economic and carbon performance among tourism corporations is a robust result under many different specifications.
Keywords
Introduction
In recent years, a great deal of research has been devoted to the relationship between tourism development, often proxied by tourist arrivals, and pollution, often proxied by carbon dioxide (CO2) emissions. Tourism development is increasingly coming under scrutiny as a result of the relative size and growth of its carbon emissions (see Lesar, Weaver, and Gardiner 2019; Sun 2019; B. Zhang et al. 2019). Lenzen et al. (2018) estimate that the tourism carbon footprint increased from 3.9 to 4.5 GtCO2, accounting for 8% of total global greenhouse gas emissions. Tourism development is therefore more carbon intensive than previously believed, and it has a higher pollution propensity than other industries that could potentially be targeted for economic development (Bojanic and Warnick 2019). Successfully addressing this challenge requires not only a shift toward a more sustainable trajectory for both the tourists and the industry but also the engagement of scholars with wider debates in the social sciences regarding the economy–pollution nexus (Bramwell 2015; Bramwell et al. 2017; Holmes, Dodds, and Frochot 2019; Knezevic Cvelbar, Grün, and Dolnicar 2019).
Within this context, a nascent stream of tourism research has begun to engage within the long-standing debate about the so-called “carbon Kuznets-curve” (CKC) hypothesis (see Wagner 2008), which posits an inverted U–shaped nexus between carbon emissions and economic development (see Holtz-Eakin and Selden 1995; Selden and Song 1994). The logic is analogous to the Kuznets-curve hypothesis (Kuznets 1955), one of the most enduring principles in the history of the social sciences (Moran 2005), which suggests an inverted U–shaped relationship between economic development and income inequality. For instance, Bella (2018) adopted the CKC hypothesis to explore the effect of tourist arrivals on CO2 emissions (per capita) and GDP (per capita) in France. Others have focused on a panel of countries from the Small Island Developing States (Akadiri, Akadiri, and Alola 2019) to the BRICS (Khattak and Wang 2018) and from the Asian Pacific region (Shakouri, Khoshnevis Yazdi, and Ghorchebigi 2017) to Europe (Zaman et al. 2016) and the OECD (Dogan, Seker, and Bulbul 2017; Wang and Wang 2018).
The aim of this article is to extend the engagement of tourism research with this line of inquiry by introducing the tourism corporate CKC hypothesis. This emerging concept is innovative because it steers the focus away from the country-level aggregation approach to a more corporate perspective using a series of performance measures. This aim is structured around four objectives: First, to offer the first review of the literature concerning the role of tourism in the CKC hypothesis, incorporating a significant amount of research from the wider energy, economics, and environmental literature. Second, to provide the state of relevant research that (a) depicts key areas of academic insight into the trajectory and the context of the extant literature, (b) synthesizes the evidence-based knowledge created, (c) presents the level of consensus, and (d) identifies the conceptual gaps. Third, to propose a novel approach to explore the role of tourism in the CKC hypothesis, drawing on the argument of Broadstock et al. (2018) that some extension of the inverted U–shaped logic between CO2 emissions and economic development could be applied at the corporate aggregation level through a performance-oriented approach. This emerging concept offers for the first time in tourism research the opportunity to investigate whether the level of carbon emissions produced by tourism corporations, which is their carbon performance, can begin to decline as their level of economic performance grows. Fourth, to provide evidence of empirical validity with panel-data techniques using an international data set (2005–2018) from 86 tourism corporations.
The remainder of the article is structured as follows. First, the process of conducting the systematic literature review (objective 1) is presented. Then, in line with the three steps—observe, bridge, and challenge—for “courageous” research recommended by Kock, Assaf, and Tsionas (2020), the state of the identified literature is described along the lines of (a) historical analysis, (b) deconstruction, and (c) scope (objective 2; observe). The logic behind the proposed conceptualization follows (objective 3; bridge), before the process of empirical validation (objective 4; challenge) is provided. The concluding part specifies the contributions of the study and presents avenues for future research.
The Systematic Literature Review Process
This study employs a systematic quantitative approach to review the role of tourism in the CKC hypothesis. The advantage of a systematic approach over a traditional narrative review is that it maps a disciplinary area in a quantitative, comprehensive, but more importantly structured manner, following precise steps for both the collection and the analysis undertaken (Jin and Wang 2016). In particular, we follow the steps (see Figure 1) recommended by Liberati et al. (2009) in the Preferred Reporting Items for Systematic Reviews and Meta-Analyses (PRISMA). The adoption of the PRISMA checklist (see Appendix A) provides a rigorous alternative for developing evidence-informed knowledge, which is easily replicated and minimizes the potential for bias (Pahlevan-Sharif, Mura, and Wijesinghe 2019).
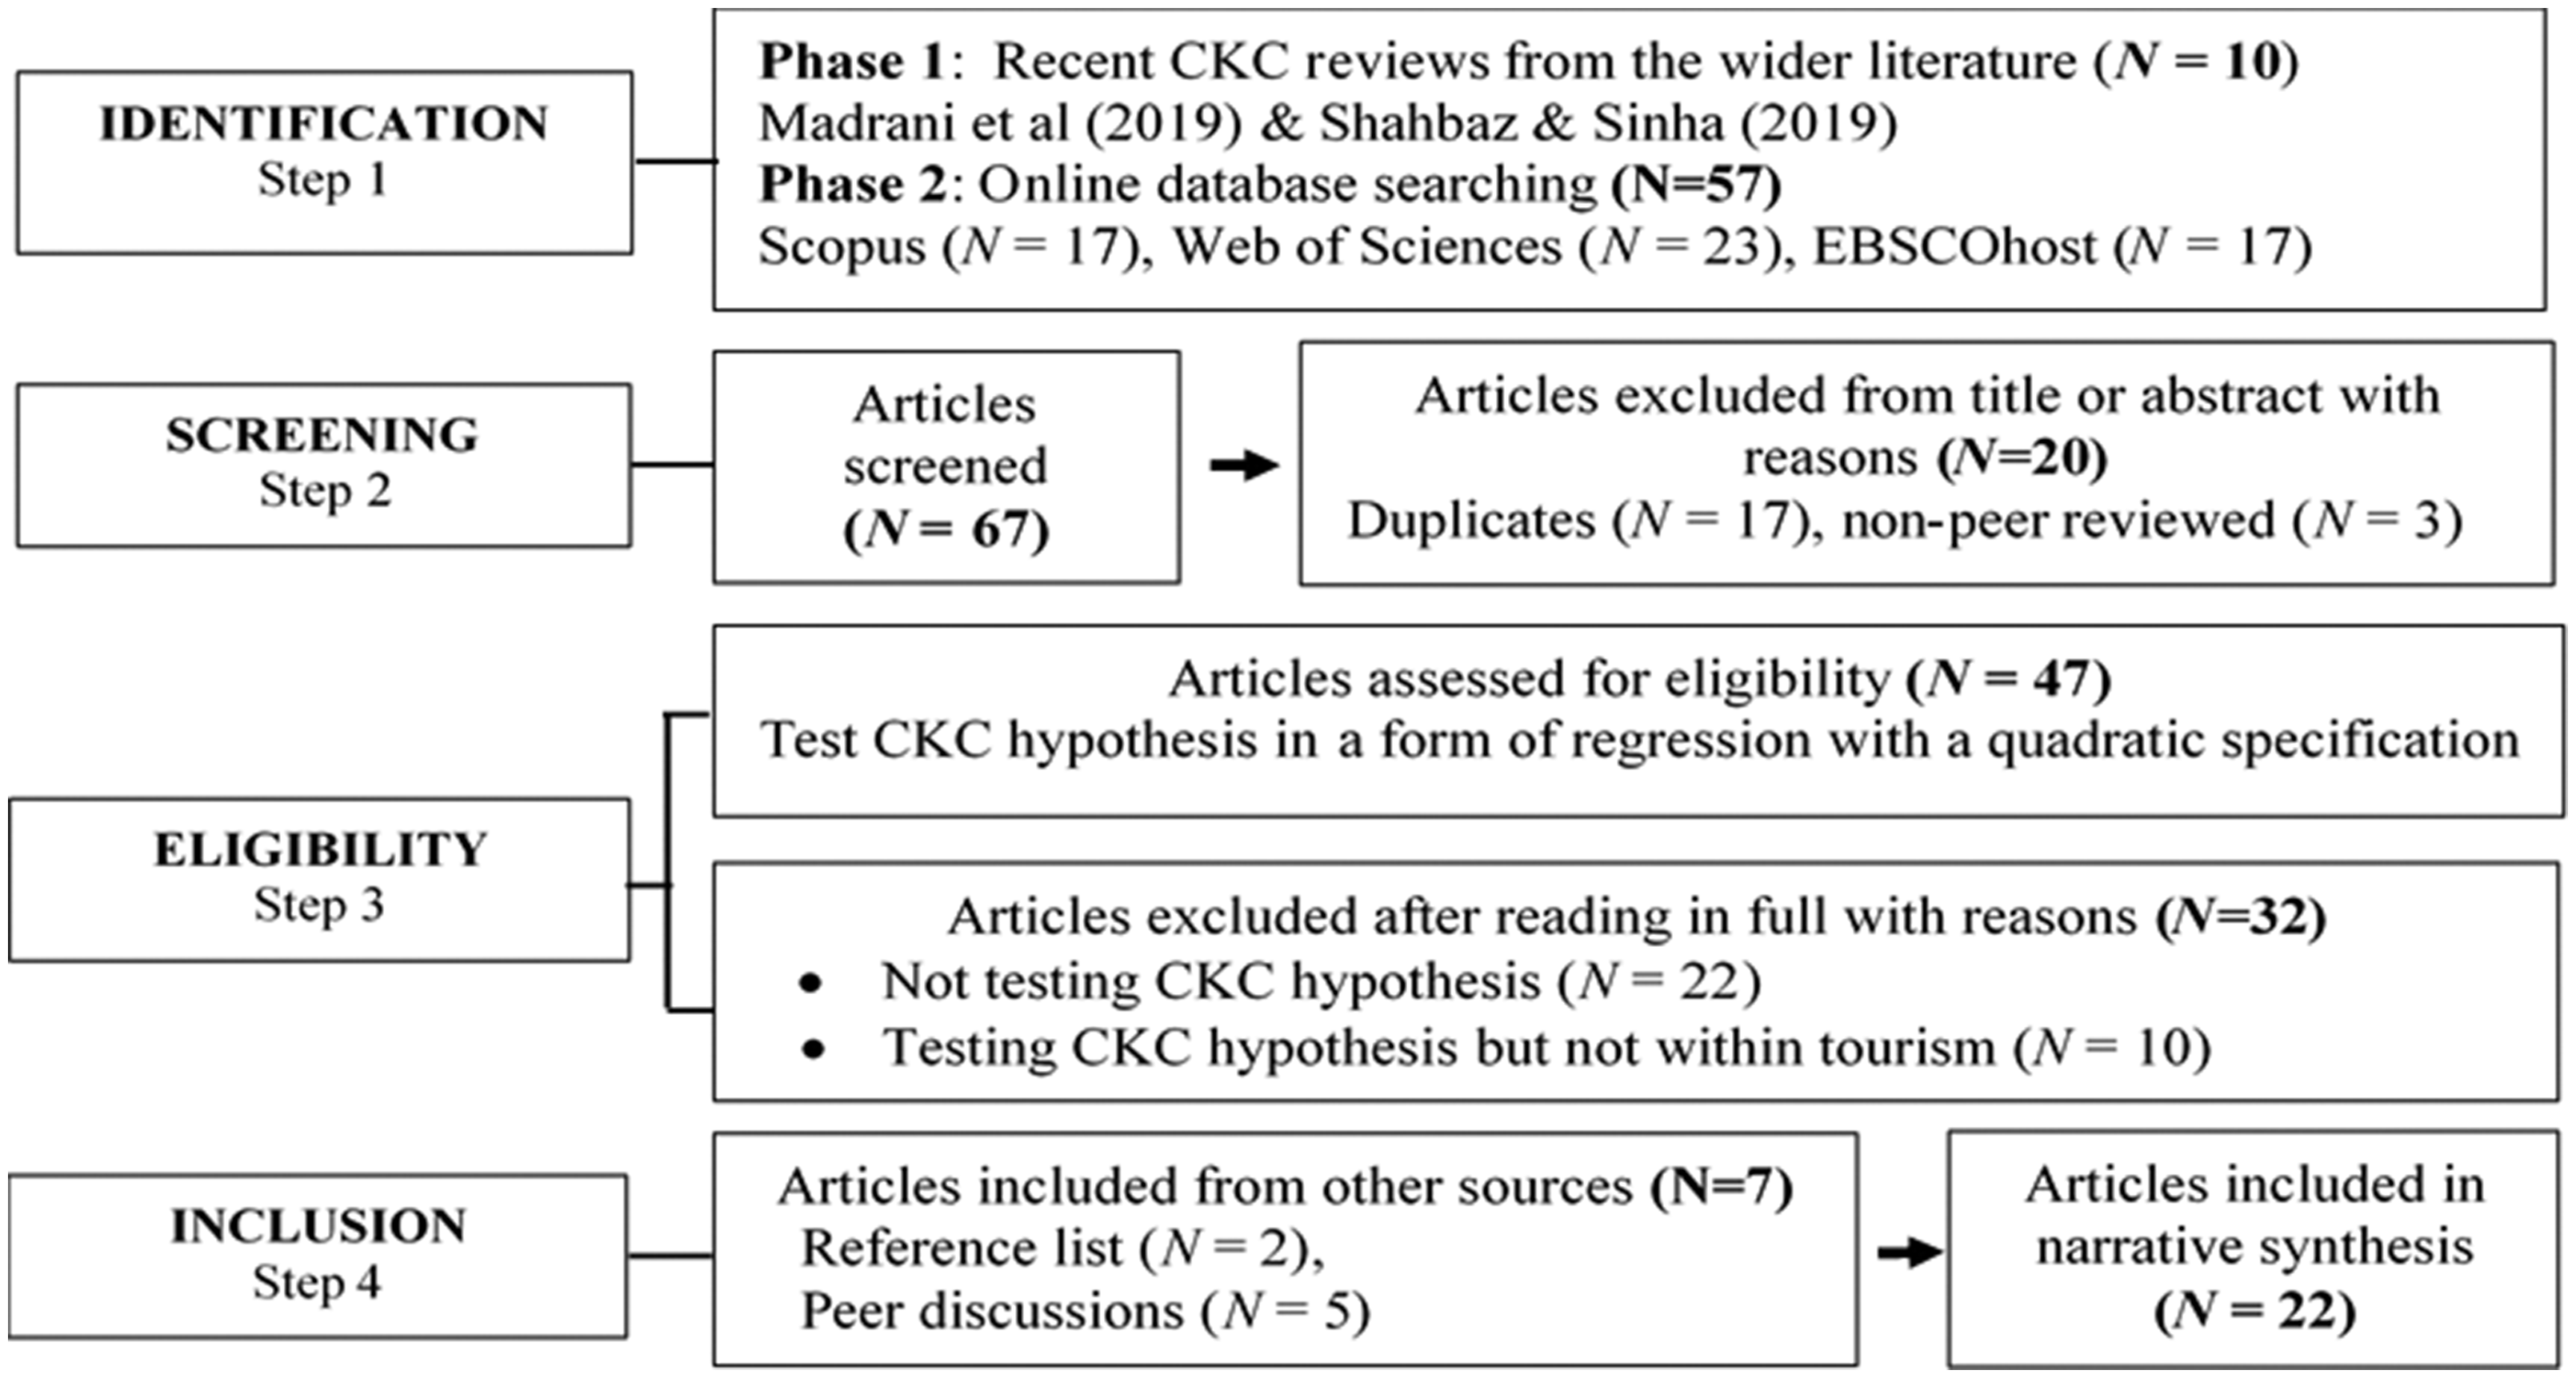
PRISMA flowchart for identification and inclusion of literature concerning the role of tourism in the CKC hypothesis.
A Two-Phase Identification Strategy
The systematic review commences with the identification of articles that have tested the role of tourism in the CKC hypothesis. Following Papavasileiou et al. (2017), a two-phase strategy was adopted, starting with manual searching of the reference lists in Shahbaz and Sinha (2019) and Mardani et al. (2019), two recent CKC reviews from the wider economics and environmental literature. This process identified 10 tourism-related articles among the 400 references included in both reviews (see Figure 1). The second phase entails a series of online searches in electronic databases (i.e., Scopus, Web of Sciences, and EBSCO), in line with recent recommendations (i.e., Buckley 2019; Durko and Petrick 2013; Passafaro 2019). In each online search, the same keywords were used, namely, “carbon emissions,” “Kuznets curve,” and “tourism.” The constraints on these search terms were meant to avoid the return of articles referencing each word separately. In addition, the returning articles were filtered to retain only those that (a) have undergone peer review and (b) been published in English, beginning with the seminal publication of Panayotou (1993) until the date of the search (June 9, 2019).
Screening, Eligibility, and Inclusion
The screening of the titles, abstracts, and keywords in the returning articles (n = 67) resulted in the exclusion of non-peer-reviewed articles (n = 3) and of duplicates (n = 17). Subsequently, the remaining articles (n = 47) were read in full against the eligibility principle: articles that test the CKC hypothesis in the form of regression with a quadratic specification (see Shahbaz and Sinha 2019) and include tourism as an indicator (i.e., environmental, economic, or other type of influence in the relationship). Following this process, additional articles were omitted from inclusion for not testing the hypothesis (n = 22) and for not using tourism as an indicator-related variable (n = 10) (see Appendix B). The reference lists included in the identified eligible articles (n = 15) were further searched. This process as well as peer discussions revealed more eligible articles for inclusion (n = 7). Overall, the systematic review reveals that the extant literature comprises 22 articles. The data included in this nascent stream of research were extracted in three dimensions and linked to the following questions: (a) What is the trajectory of the extant literature on the topic? (b) What kind of societal and disciplinary context is covered within this stream of literature? and (c) What is the scope of tourism development within the CKC hypothesis?
The State of the Literature
Historical Analysis: A Nascent But Sizable Stream of Research
Grossman and Krueger (1991) were the first to reveal an inverted U–shaped relationship between air pollutants (sulfur dioxide and suspended particulate matter) and income per capita, though it was Panayotou (1993) who coined the term Environmental Kuznets Curve (EKC) hypothesis. Following the World Bank’s formulation of the EKC (see Dasgupta et al. 2004), as industrialization begins, the affected areas are characterized by rapidly expanding pollution. At this early juncture, priority is given to employment over environmental conditions and there is a lack of sufficient resources to mitigate the phenomenon. Anti-pollution laws and regulations may be weak or nonexistent. As income levels rise and resources become more available, industries become less environmentally destructive, often as a result of tighter regulatory regimes. At the same time, there is more public recognition of pollution and demand for its mitigation. The curve demonstrates a decline in pollution as countries reach mid-development and then a more precipitous fall with greater wealth, finally returning to pre-industrial levels.
The EKC hypothesis has been tested with varied environmental indicators categorized as land, oceans, seas, coasts, biodiversity, freshwater, and atmospheric (see Sarkodie and Strezov 2019). In terms of the latter, a study by Holtz-Eakin and Selden (1995) is the first to have tested the CKC hypothesis (the focus of our review) using data of CO2 release and GDP per capita (1951–1986) from a panel of 130 countries. Within the next two decades, over the period of 1995–2014, the CKC literature has grown exponentially, totaling more than 100 publications (see Shahbaz and Sinha 2019). However, there are conflicting results regarding the existence of the CKC, which might be attributed to recent changes in how developing nations are treating their emissions, the time frame of the study, the methodological adaptation, and the choice of explanatory variables (Shahbaz and Sinha 2019).
During this period, the role of tourism within the CKC hypothesis has not been investigated, a phenomenon perhaps related to the general neglect at that time of research on the tourism–emissions nexus (J. W. Lee and Brahmasrene 2013). However, as shown in Table 1, there are signs of change with the studies from Katircioǧlu (2014) and de Vita et al. (2015). These studies gave the impetus for an additional 20 publications in the last five years. Overall, the extant literature (n = 22) represents a large group of scholars (n = 60), with most of them contributing one article (n = 51) (see Table 1). The large number of contributing authors and the sharp increase over such a short period illustrate that the investigation of tourism’s role in the CKC hypothesis is a sizable and rapidly growing stream of research.
Extant Literature Concerning the Role of Tourism in the CKC Hypothesis.a
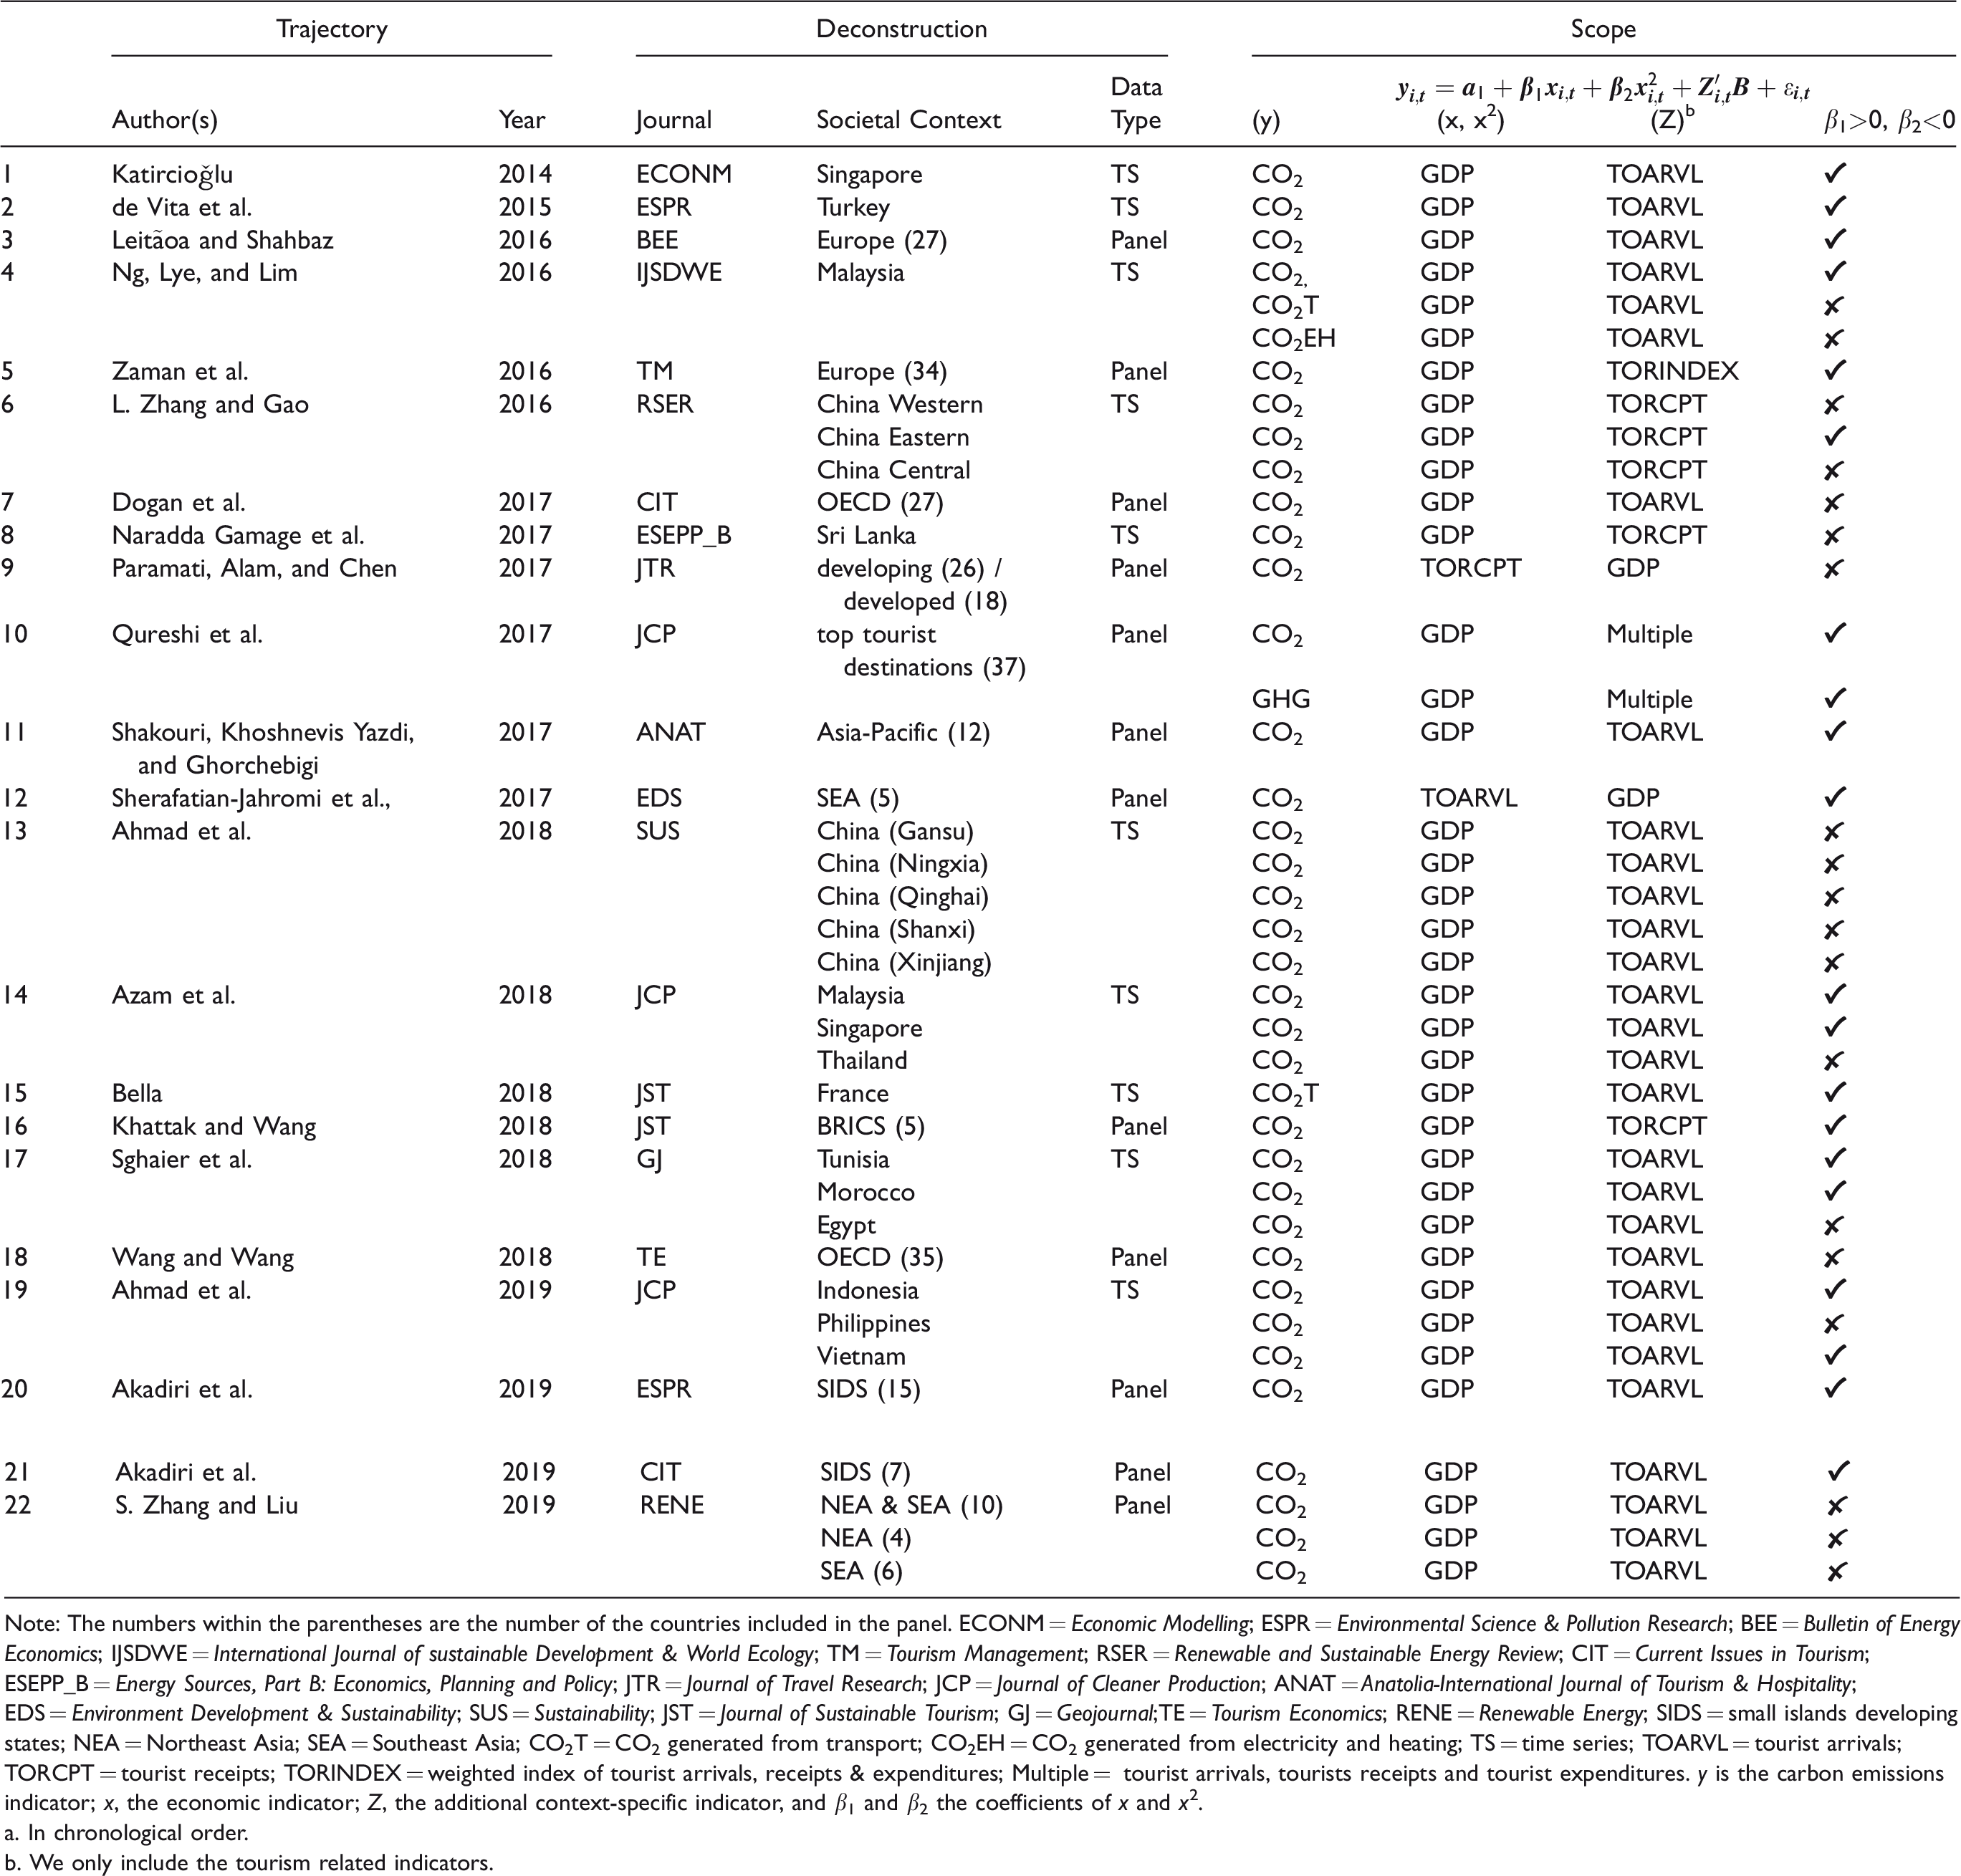
Note: The numbers within the parentheses are the number of the countries included in the panel. ECONM = Economic Modelling; ESPR = Environmental Science & Pollution Research; BEE = Bulletin of Energy Economics; IJSDWE = International Journal of sustainable Development & World Ecology; TM = Tourism Management; RSER = Renewable and Sustainable Energy Review; CIT = Current Issues in Tourism; ESEPP_B = Energy Sources, Part B: Economics, Planning and Policy; JTR = Journal of Travel Research; JCP = Journal of Cleaner Production; ANAT = Anatolia-International Journal of Tourism & Hospitality; EDS = Environment Development & Sustainability; SUS = Sustainability; JST = Journal of Sustainable Tourism; GJ = Geojournal;TE = Tourism Economics; RENE = Renewable Energy; SIDS = small islands developing states; NEA = Northeast Asia; SEA = Southeast Asia; CO2T = CO2 generated from transport; CO2EH = CO2 generated from electricity and heating; TS = time series; TOARVL = tourist arrivals; TORCPT = tourist receipts; TORINDEX = weighted index of tourist arrivals, receipts & expenditures; Multiple = tourist arrivals, tourists receipts and tourist expenditures. y is the carbon emissions indicator; x, the economic indicator; Z, the additional context-specific indicator, and β1 and β2 the coefficients of x and x2.
a. In chronological order.
b. We only include the tourism related indicators.
Deconstruction: Disciplinary Context, Societal Level, and Type of Data
Table 1 indicates that the literature on the topic originates from a variety of disciplinary fields. In particular, almost two-thirds of the articles are published in nontourism peer-reviewed journals, spanning from energy and sustainability (i.e., International Journal of Sustainable Development and World Ecology; Renewable Energy; Renewable and Sustainable Energy Reviews; Sustainability) to economics (i.e., Economic Modelling) and the environment (Environmental Science and Pollution Research). The field of tourism research comprises eight articles published in the following tourism peer-reviewed journals: Anatolia; Current Issues in Tourism, Journal of Sustainable Tourism, Journal of Travel Research, Tourism Economic, and Tourism Management.
The level of societal coverage adds further evidence of diversity in the identified literature. Table 1 reveals that almost one-third of the literature has investigated the topic among an international panel of countries. The size of the smaller panels ranges from 5 to 15 countries and focuses on the BRICS countries (Khattak and Wang 2018) and the Small Island Developing States (Akadiri, Akadiri, and Alola 2019; Akadiri et al. 2019). In addition, Dogan, Seker, and Bulbul (2017) and Wang and Wang (2018) utilize a wider OECD panel, Qureshi et al. (2017) select a top tourist destination panel (n = 37), and Paramati, Alam, and Chen (2017) use a 44-country panel clustered into developing and developed countries.
The regional-level panel studies place more emphasis on the Asian countries and particularly those from East Asia. For instance, Sherafatian-Jahromi et al. (2017) use a panel from Southeast Asia countries (n = 5) and S. Zhang and Liu (2019) a combined North and Southeast Asia panel (n = 10). Shakouri, Khoshnevis Yazdi, and Ghorchebigi (2017) focus on a wider Asian-Pacific panel (n = 12). Contrary to the small and medium-size Asian panels, Leitãoa and Shahbaz (2016) and Zaman et al. (2016) conducted large regional studies in Europe with 27 and 34 countries, respectively.
The national societal context was also examined, using time series data from countries in Europe (France), North Africa (Tunisia, Morocco, and Egypt), the Middle East (Turkey), and East Asia (Malaysia, Singapore, Sri Lanka, Indonesia, Vietnam, and the Philippines). The remaining two studies from Ahmad et al. (2019) and L. Zhang and Gao (2016) are also within the national time series context, and particularly China, but focus on more provincial level.
Scope: Formulation of the CKC Hypothesis, Level of Consensus, and Conceptual Gaps
The role of tourism in the CKC hypothesis has been tested 39 times using the following generalized form:

Conceptually, y in the majority of the studies (90%) was represented as the total CO2 emissions. Bella (2018) differed from the norm by focusing solely on the CO2 emissions generated from transport (CO2T). Earlier, Ng, Lye, and Lim (2016) conducted a separate test for the total CO2 emissions, the CO2T emissions, and the emissions generated from electricity and heat (CO2EH). Besides CO2 emissions, Qureshi et al. (2017) also used greenhouse gas emissions (GHG). In addition, the majority of the studies (95%) used the GDP per capita as x and x2. Paramati, Alam, and Chen (2017) differed from the norm by using the number of international tourism receipts (TORCPT) produced in the panel of 44 countries under investigation. In a similar vein, Sherafatian-Jahromi et al. (2017) utilized the number of tourist arrivals (TOARVL) produced in the panel of Southeast Asian countries under investigation. In both cases, GDP was considered as an additional context-specific explanatory variable. Furthermore, Z was represented by tourist arrivals (TOARVL, 74%); tourist receipts (TORCPT, 13%); a combination of tourist arrivals, receipts, and expenditures (5%); and a weighted index of tourist arrivals, receipts, and expenditures (TORINDEX, 2.5%).
Overall, in the testing of the CKC hypothesis the coefficients of interest (β1 and β2) were directly related to a tourism indicator only in two studies (5%), which estimated TOARVL and TOARVL2 and TORCPT and TORCPT2. Most of the literature tested the role of tourism in the CKC hypothesis as an additional context-specific indicator of the GDP, GDP2. This is a rather limited reflection of the sizable contribution of tourism both to the global economy, with more than 10% in 2018 (WTTC 2019), and to global CO2 emissions, with more than 8% in 2013 (Lenzen et al. 2018). We therefore argue that some extension of the theoretical framework into the tourism corporation level warrants further investigation.
A Framework for the Tourism Corporate CKC Hypothesis
Figure 2 presents the difference between the dominant country-level approach utilized in the identified literature and the proposed corporate-level paradigm. The most obvious change is in the societal context: the dominant country-level approach uses a function of per capita y and x, x2 indicators whereas the corporation-level perspective adopts an analogous per employee scaling. Notably, the coefficients of interest (β1 and β2) in the proposed framework are no longer related to an indicator of economic development (i.e., GDP) but to a set of economic performance indicators. This approach stems from Broadstock et al.’s (2018) underpinning theory of a corporate carbon Kuznets curve. In the light of the voluntary disclosure of GHG emissions by corporations, these authors hypothesized and empirically validated with a sample from the FTSE 350 index that GHG emissions are dependent on corporations’ performance and are characterized by an inverted U–shaped relationship.
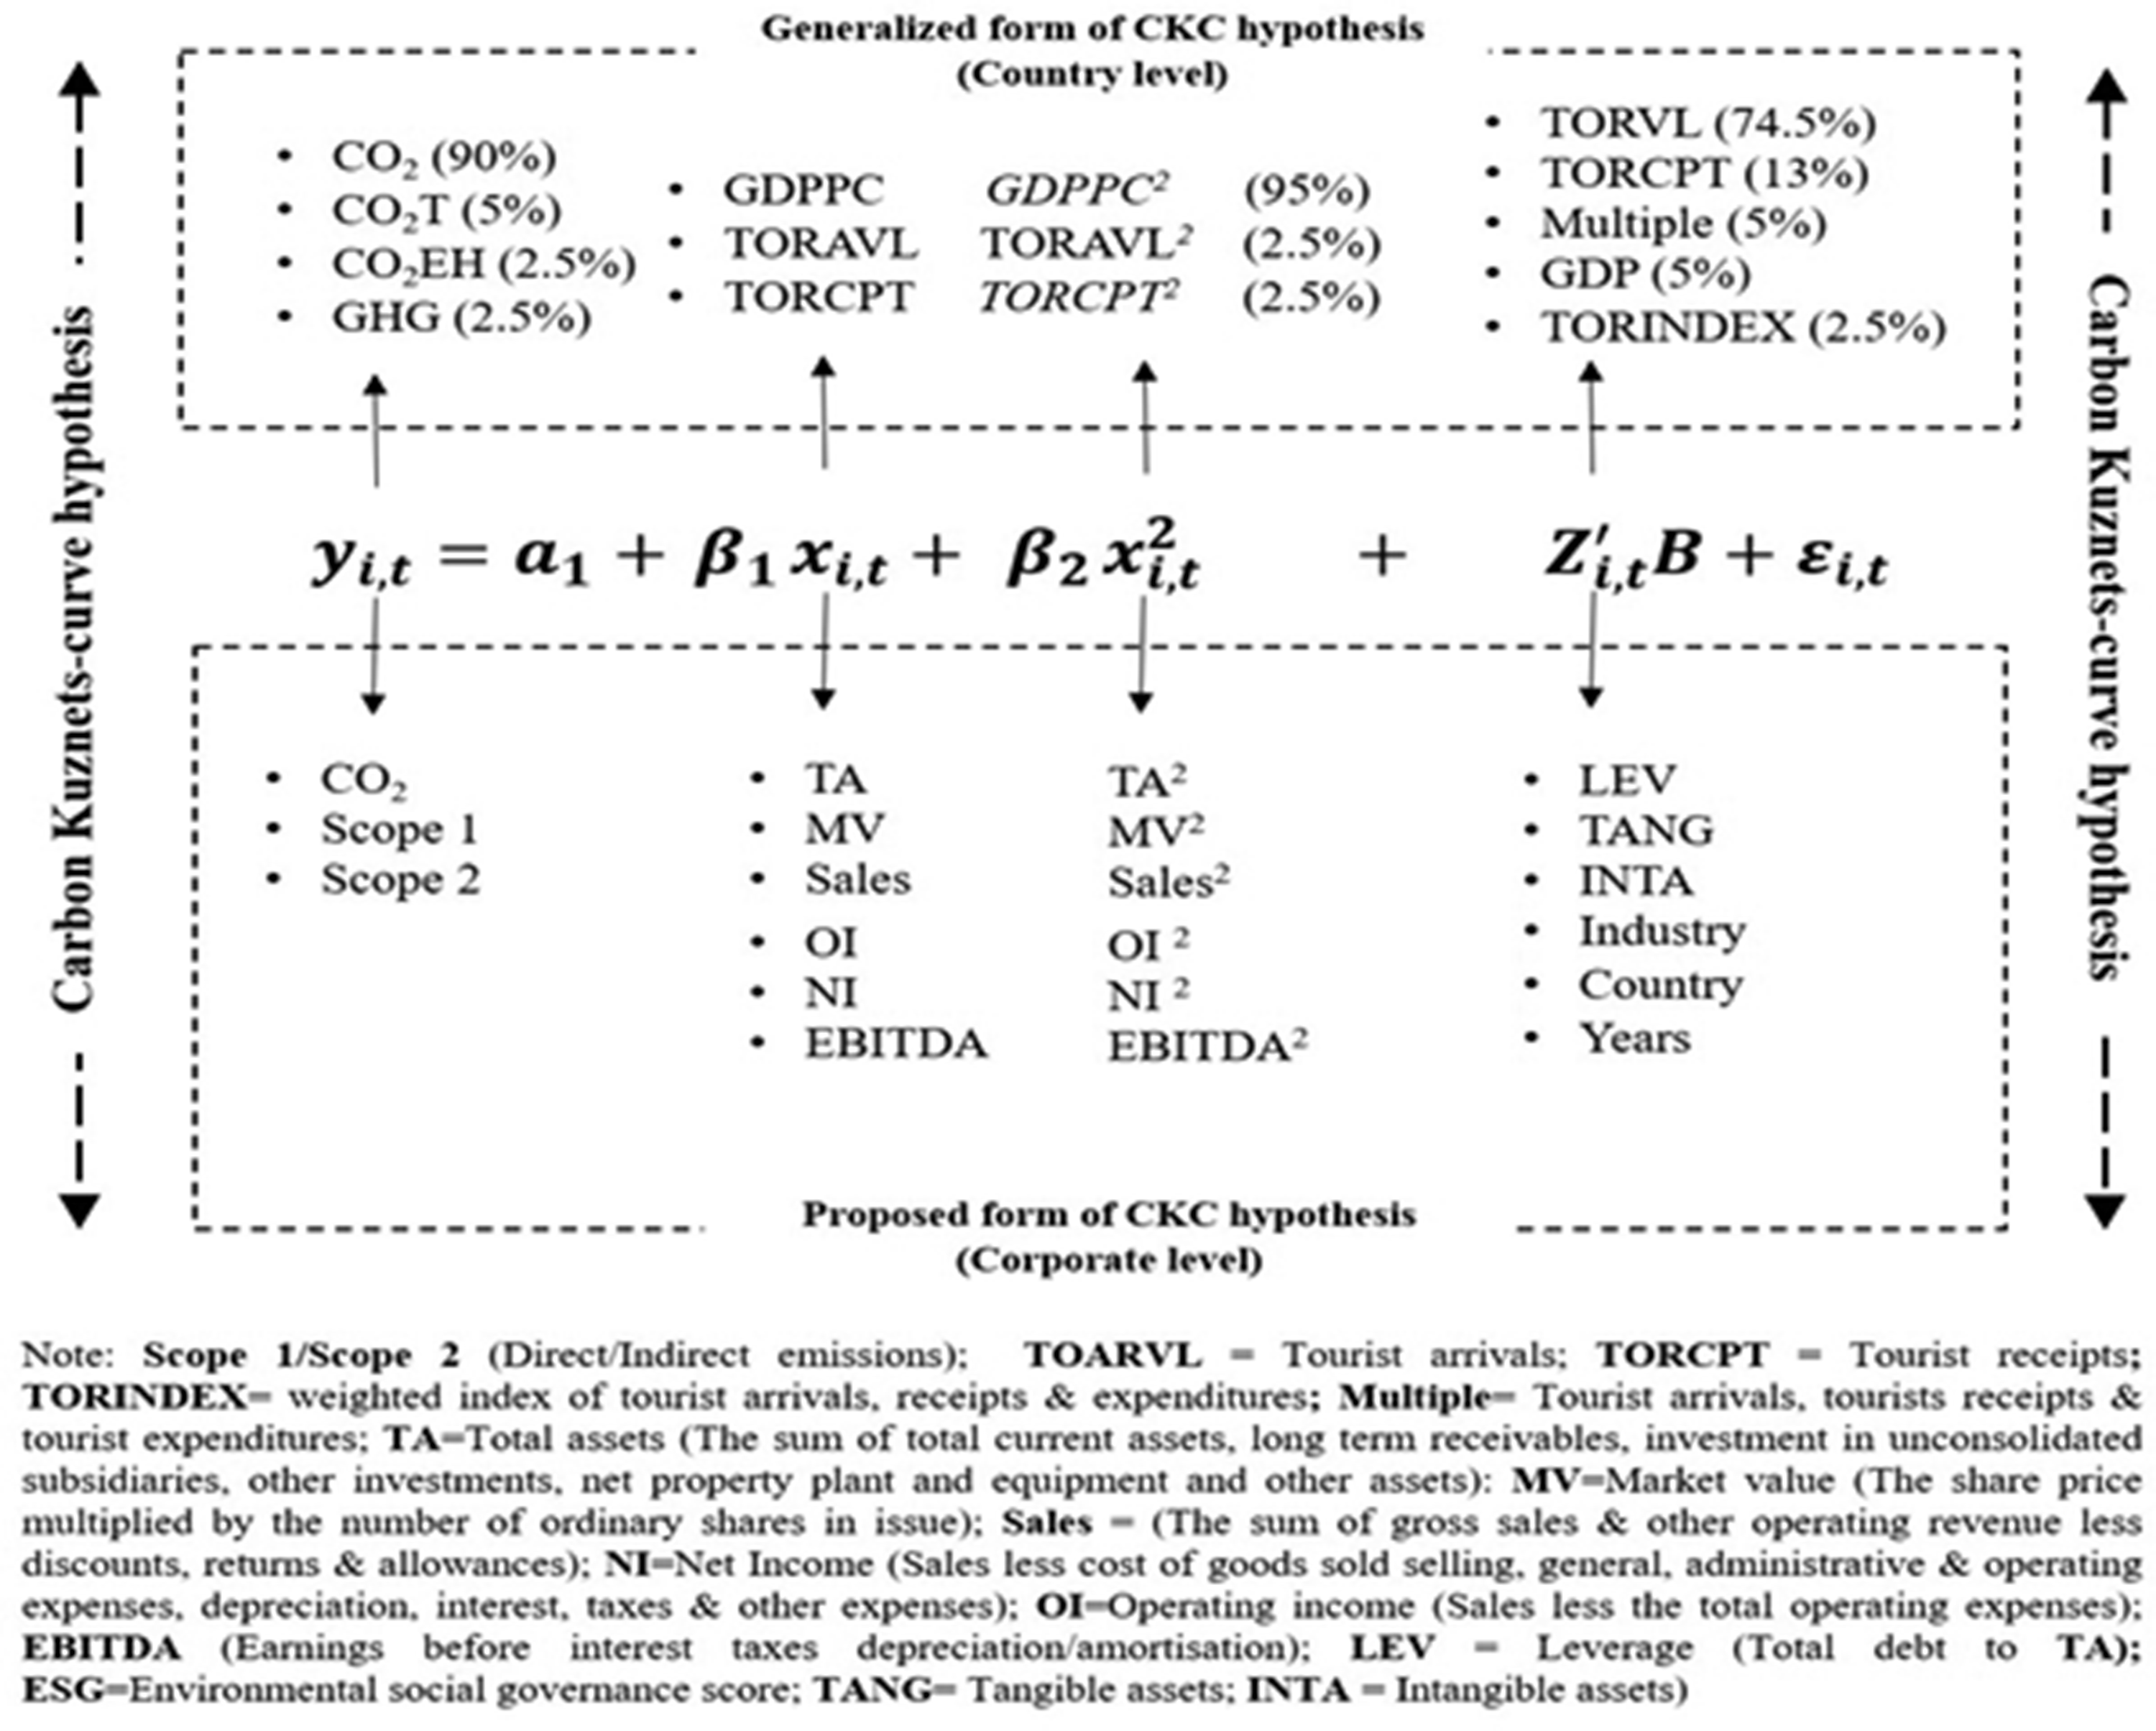
The role of tourism in the CKC hypothesis: A paradigm shift to a corporation-performance perspective.
We extend this approach within the tourism corporation level in the following way: First, it is important to consider the scope of the carbon performance indicator y, which is the sum of direct and indirect emissions. This approach is in line with the Corporate Accounting and Reporting Standard (WBCSD and WRI 2004), which distinguishes gases according to their scope. Scope 1 (direct) represents the emissions from facilities owned or operated directly by the company (e.g., physical or chemical processing, electricity generation, and the combustion of fuel). Scope 2 emissions (indirect) are those indirectly produced by the company when purchasing electricity to conduct their activities. All other indirect emissions are classified as Scope 3 and are an optional reporting category (i.e., produced from the transportation of the material or other supplies bought by the company).
Second, it is imperative to consider a set of performance measures x, x2 that encapsulate the multifaceted stakeholders related to the economic performance of tourism corporations (see McGehee et al. 2010). Five indicators are considered, beginning with Total Assets and Sales. These indicators are of common interest to every stakeholder (e.g., customers, suppliers, governments) as they represent proxies for the relative size and/or profitability of every tourism corporation. The third and fourth indicators reflect opportunities for investments (investors) and loan opportunities (bankers); these are the Market Value and Operating Income, respectively. The fifth indicator, Earnings before Interest, Taxes, Depreciation, and Amortization, is obviously related to the tax authorities, which mostly place an emphasis on earnings before taxes.
Third, we have to choose a series of additional corporate-specific variables with strong influence on the carbon emissions indicator y. We use Leverage (debt-to-equity ratio) to capture the level of risk; riskier firms normally undertake more environmental projects (see Albertini 2013). In addition, we utilize Tangible and Intangible Assets to control the size of the corporation and the level of its research and development activities (see Tzouvanas et al. 2019). Furthermore, it is imperative to capture the effect of the time span (the global financial crisis might have had an impact), the industry (some industries emit large amounts of carbon), and the country (e.g., developed countries are more committed to dealing with carbon emissions than are developing ones; see Busch and Lewandowski 2018).
Tourism Corporate CKC Hypothesis: Empirical Validity
International Data Set with 86 Tourism Corporations
Thomson Datastream is selected as the data source, in line with recent environmental and tourism development studies at the corporation level (i.e., Chatziantoniou et al. 2013; Dragouni et al. 2016; Zopiatis et al. 2019). In principle, the Travel & Leisure INDEX (Datastream mnemonic: G#LTRLESWD) includes tourism-related data that allow for several thousand corporation-year observations. However, the limited availability of corporate environmental data (see Tan et al. 2017), in our case with at least four years of observations, reduced the initial sample from 352 to 86 eligible corporations. Table 2 reports the descriptive statistics and reveals that 689 valid observations are related to the emission indicator and that approximately 1,100 valid observations are relevant to the economic performance indicators. The observations correspond to a 14-year period (2005–2018) spanning six sectors (bars and restaurants, travel and tourism, airlines, gambling, hotels, and recreation) and 21 countries (Australia, Canada, Chile, China, France, Germany, Greece, Hong Kong, Ireland, Japan, Malaysia, New Zealand, Singapore, South Africa, South Korea, Spain, Sweden, Thailand, Turkey, United Kingdom, and United States).
Descriptive Statistics.
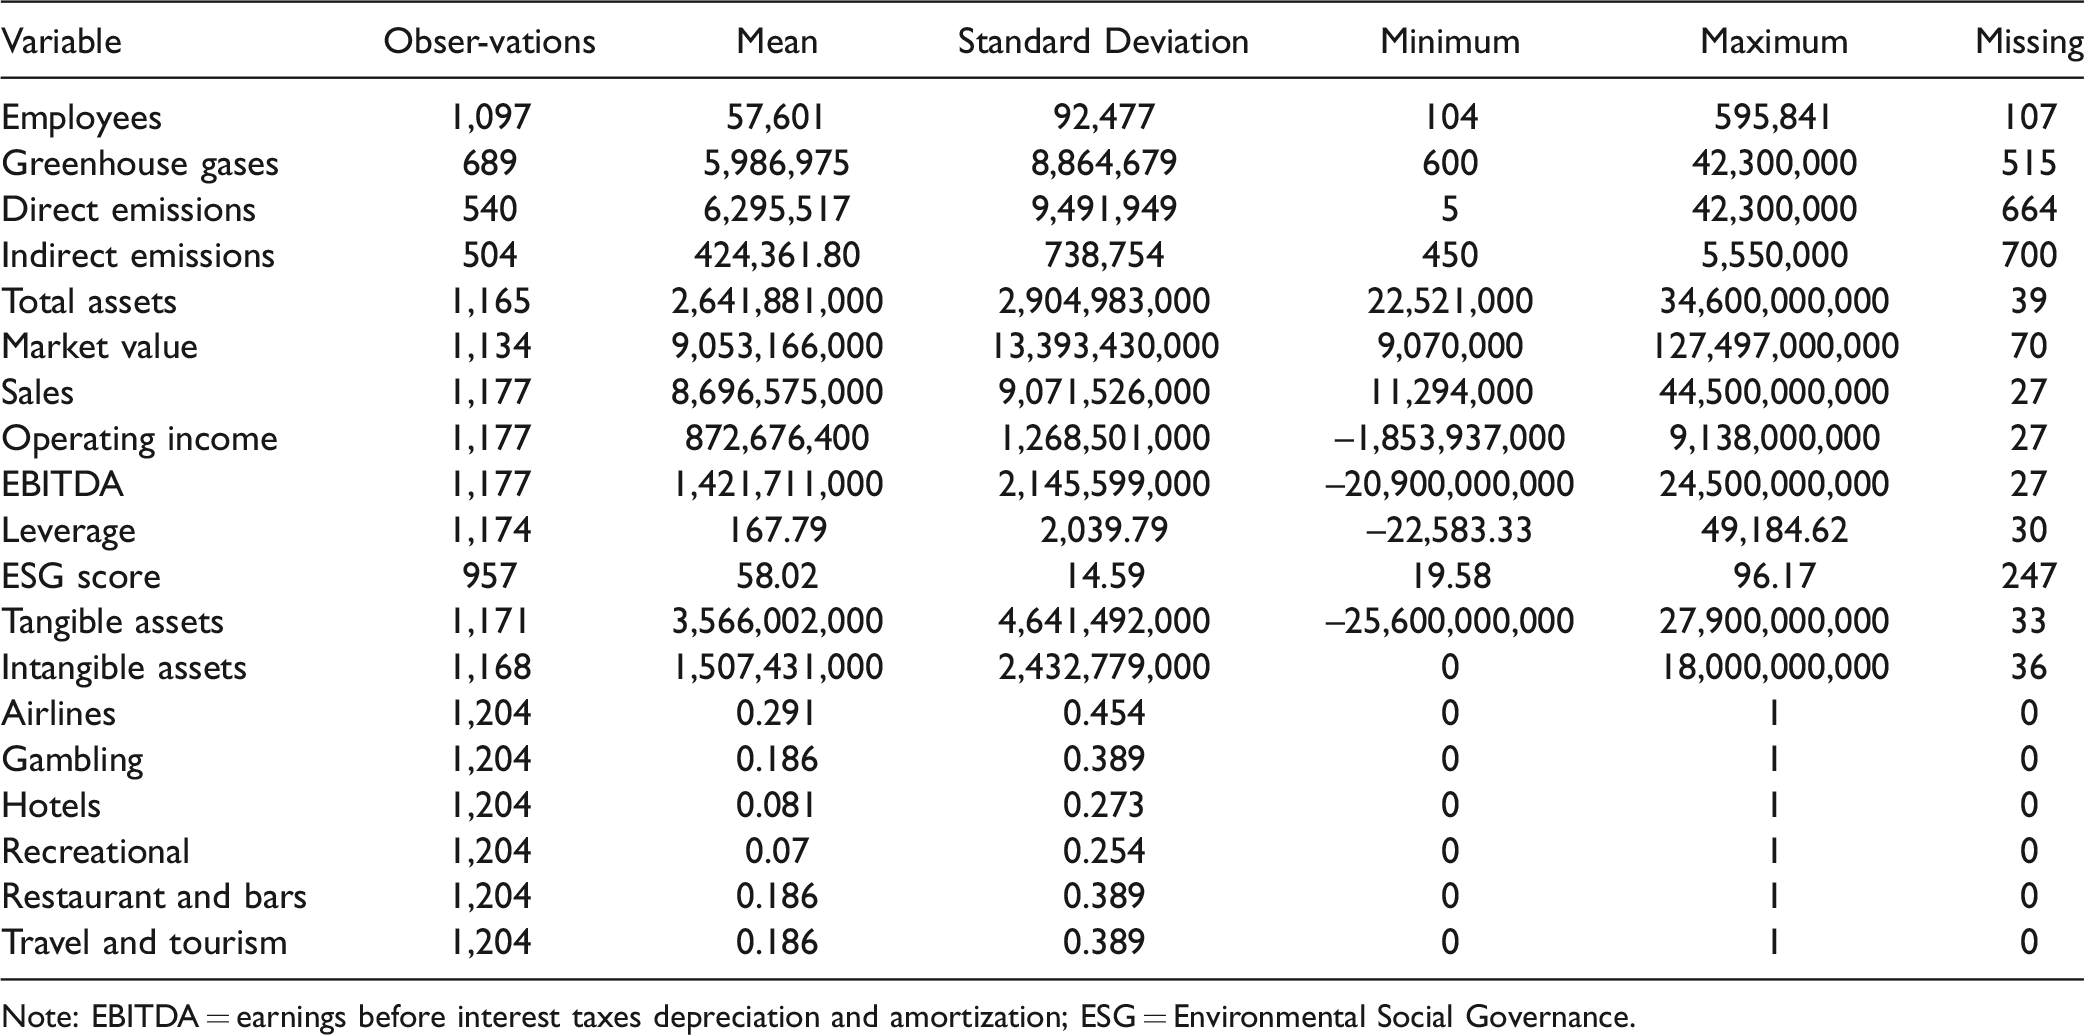
Note: EBITDA = earnings before interest taxes depreciation and amortization; ESG = Environmental Social Governance.
Panel Data Techniques: Fixed and Random Effects
Panel data analytic models such as fixed or random effects estimators can exploit the cross-sectional nature (i.e., corporations) of the data and the time variance in order to provide an inference of the relationship between the independent and dependent variable (e.g., Nollet, Filis, and Mitrokostas 2016). The advantage of these models is that they allow for individual specific effects (heterogeneity), which are completely ignored in traditional ordinary least squares models (Wooldridge 2002). For example, these effects can be important determinants for the carbon performance of the corporations; however, they are very difficult to quantify, for example, by geographic location (Koo, Lim, and Dobruszkes 2017). The difference between fixed and random effects is that the former assumes that the individual effects are constant and can correlate with the control variables, whereas the latter assumes that these effects vary and cannot be correlated with the control variables. The selection between the two is based on Hausman’s specification test, in line with recent firm-level studies (i.e., Koo, Lim, and Dobruszkes 2017; S. Lee, Pan, and Park 2019; J. W. Lee and Brahmasrene 2013).
Accordingly, fixed or random effects estimations are employed as shown below:
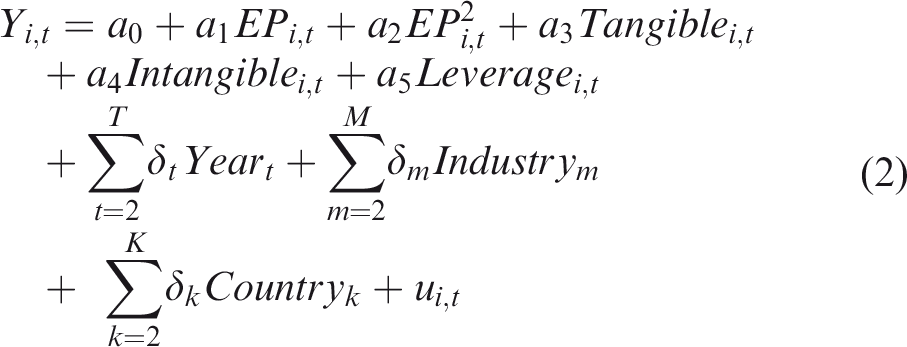
Table 3 reports the linear and quadratic effects of economic performance (EP) variables on carbon performance (Y) among the tourism corporations included in the sample. Following the principles of the Hausman test, column 1 reports the fixed effects estimations and columns 2–5, the random effects estimations. Throughout the different specifications, the same control variables are included, whereas their effects do not explain large variation in the carbon performance. With the exception of Earnings before Interest, Taxes, Depreciation, and Amortization (column 5), which exhibits an insignificant level term, the remaining EP variables follow an inverted U–shaped curve with the carbon performance (Table 3). In particular, the remaining EP coefficients are always positive and significant mostly at the 1% level. At the same time, the related squared term coefficients carry a negative sign.
Panel Estimations for Tourism Corporation Carbon Performancea (2005–2018).
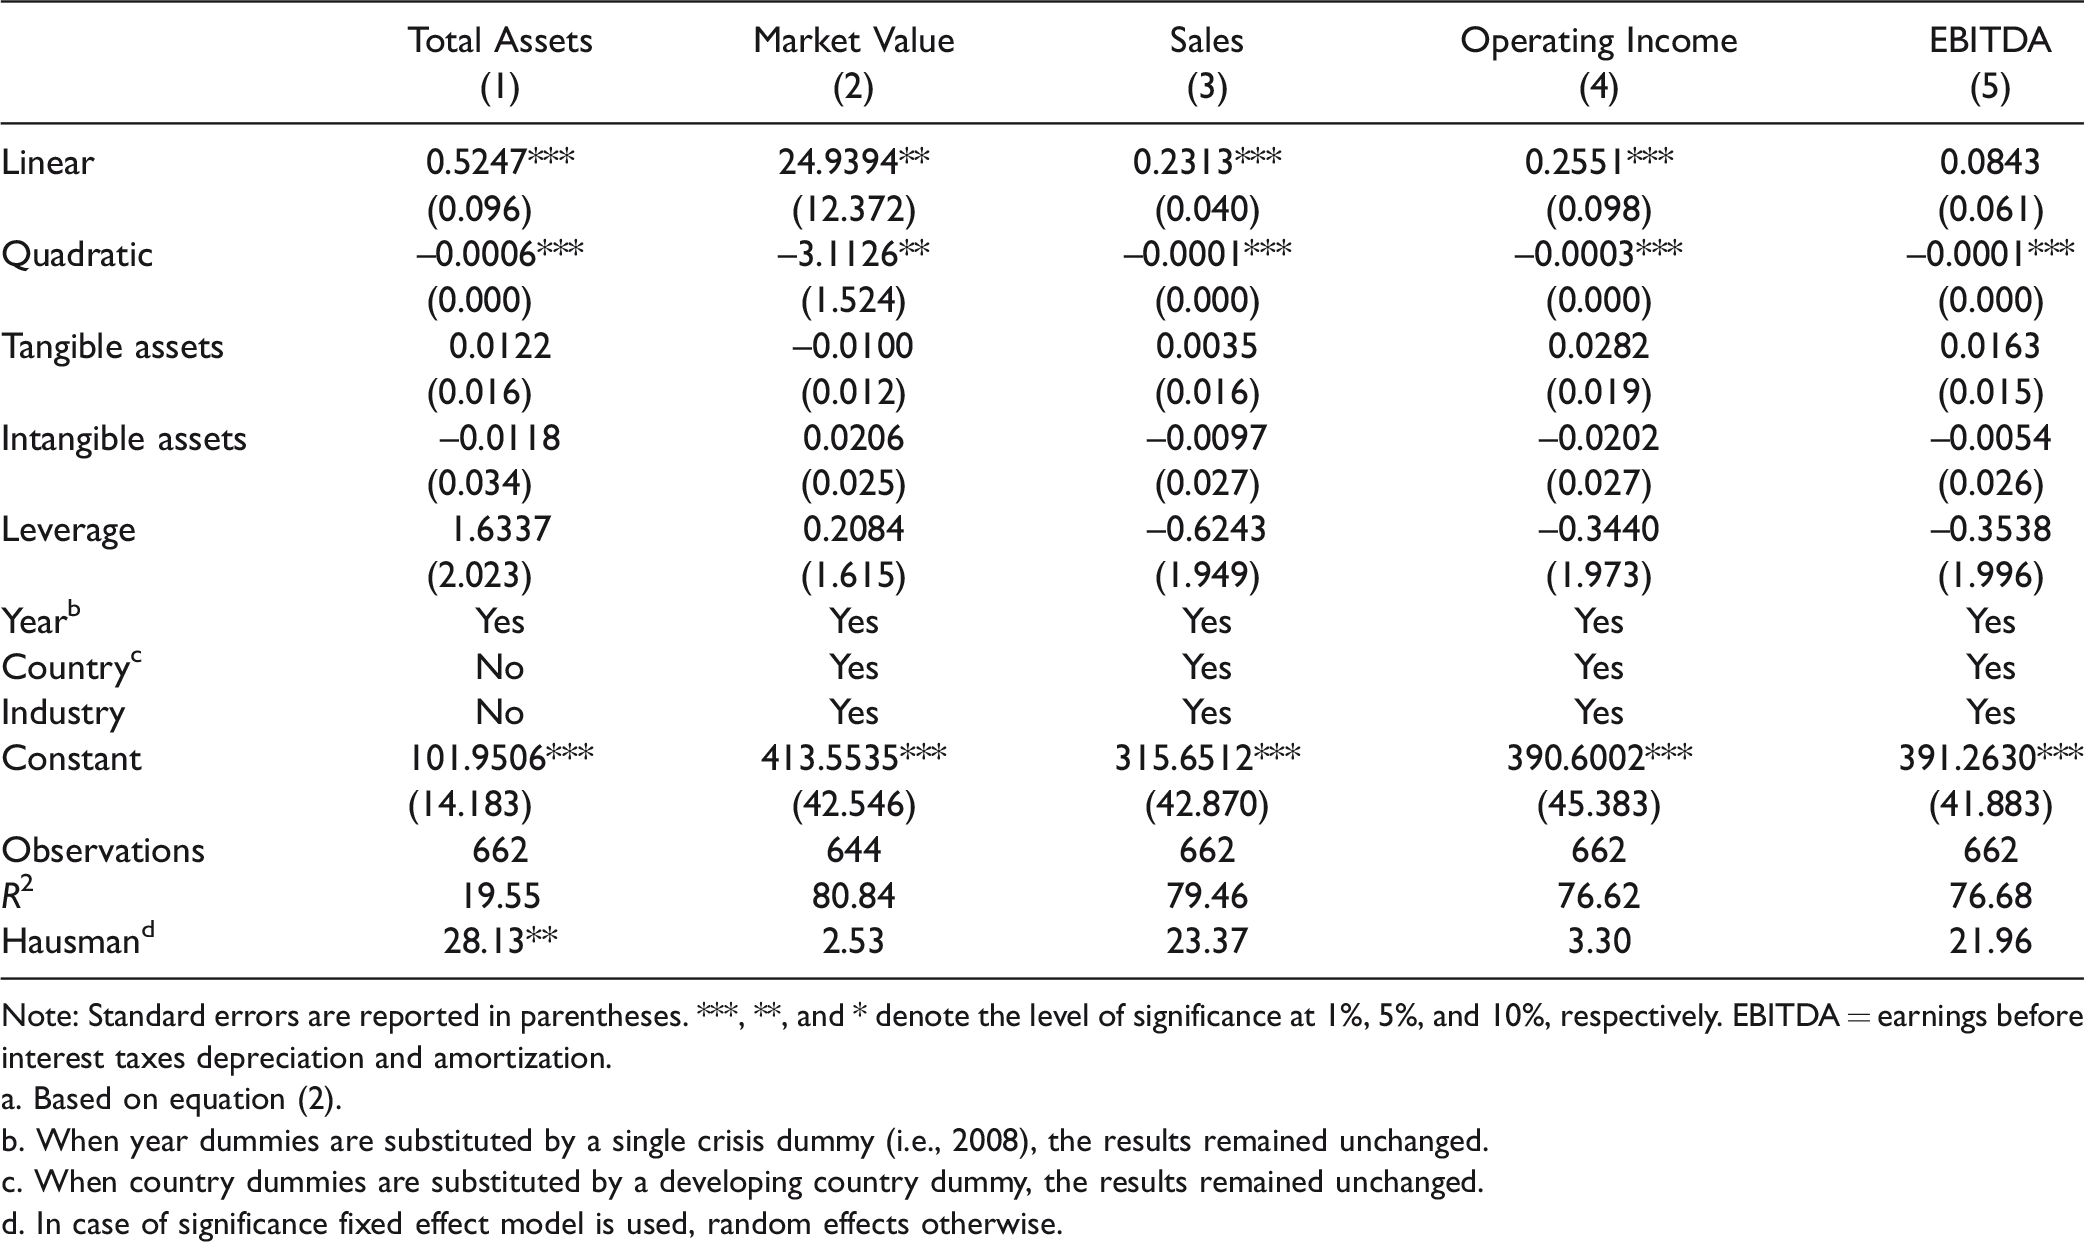
Note: Standard errors are reported in parentheses. ***, **, and * denote the level of significance at 1%, 5%, and 10%, respectively. EBITDA = earnings before interest taxes depreciation and amortization.
a. Based on equation (2).
b. When year dummies are substituted by a single crisis dummy (i.e., 2008), the results remained unchanged.
c. When country dummies are substituted by a developing country dummy, the results remained unchanged.
d. In case of significance fixed effect model is used, random effects otherwise.
Endogeneity
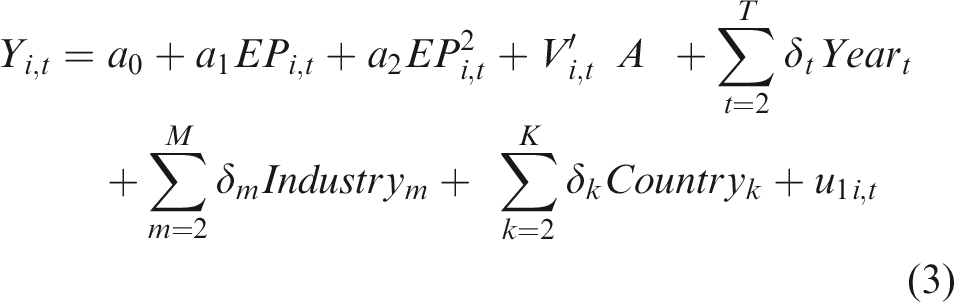
Endogeneity occurs because of simultaneity, causality, or omitted variable bias, and it should be carefully considered in the examination of the relationship between carbon emissions and economic performance (see Albertini 2013; Busch and Lewandowski 2018; Park, Woo, and Nicolau 2019). In other words, independent variables (i.e., economic performance) may correlate with the error term (u) in equation (2), and thus the estimations might be biased. In particular, a large number of corporations do not report their carbon emissions, and so it is reasonable to assume that reporting corporations represent only “one side of the coin”. A critical problem is that in the regression of economic performance on carbon performance, the entire population in the main equation cannot be observed. In turn, this might create an omitted variable problem, because the nondisclosing tourism corporations are neglected altogether. As a result, the sample might not be random and the results may be biased. Similar to Rodríguez, Martínez-Roget, and González-Murias (2018), to correct for selection bias, a two-step Heckman selection model (Heckman 1979) is employed. The model specifies that the decision to disclose emissions does not stem from a random process but rather represents the outcome of different institutional characteristics. The main equation is similar to Equation (2):
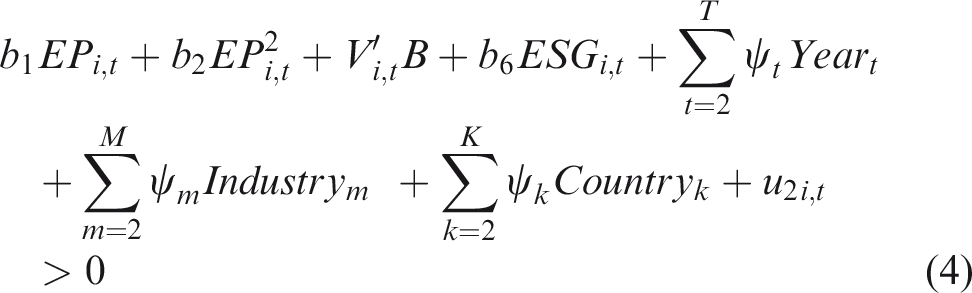
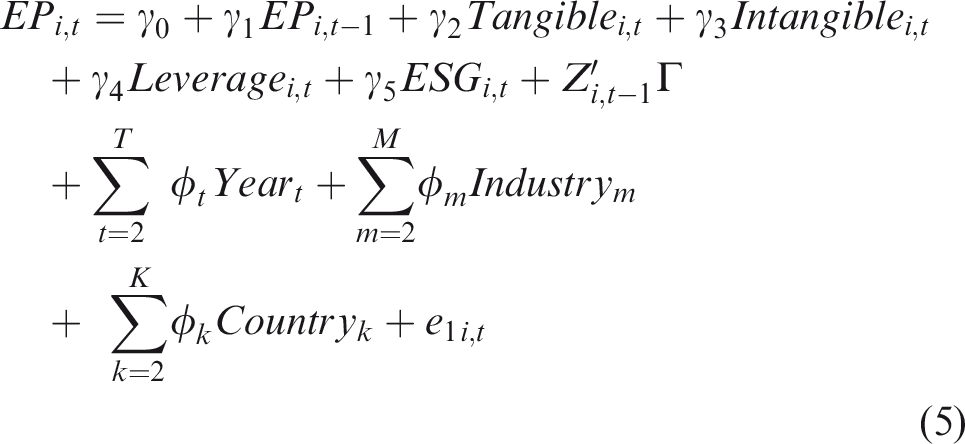
In the selection equation, that is, equation (4), all variables from equation (2) are considered, with the addition of the Environmental Social Governance (ESG) disclosure variable as an instrument. The disclosure score explains the percentage of disclosing practices by corporations, and so this naturally satisfies the conceptual validity of the instrument. The error terms have distribution
To test whether the large number of missing values has affected this outcome, the two-step Heckman selection model is reported in Table 4. First, the selection equation determines whether carbon emissions are observed or not (lower side of table). Then the main equation (upper side of table) examines the effect of the economic performance and the squared economic performance on carbon performance. On average, the unobservables in the selection model positively correlate with the unobservables in the main equation, indicating that two-step Heckman results should be more reliable than the previous fixed/random effects estimations. In particular, the correlations (ρ) of the residuals between the main and selection equations vary between –18% and 31% across the five models. Moreover, it has to be noted that the instrument (Environmental Social Governance) in the selection equation is highly significant, indicating its conceptual validity for determining carbon emissions. Nevertheless, the results validate the existence of tourism corporate CKC. In particular, all five EP indicators exhibit inverted U–shaped association with the carbon performance. Surprisingly, after controlling for sample bias in the EBITDA model (column 5), which is notably high (ρ = 31.2%), EBITDA also follows the hypothesized U-shaped curve. The direction of its effect changed from negative in the random effect model (Table 3, column 5) to inverted U–shaped, implying that, in fact, endogeneity plays a crucial role in this examination.
Two-Step Heckman Sample Selection Model for Tourism Corporations Carbon Performance (2005–2018).
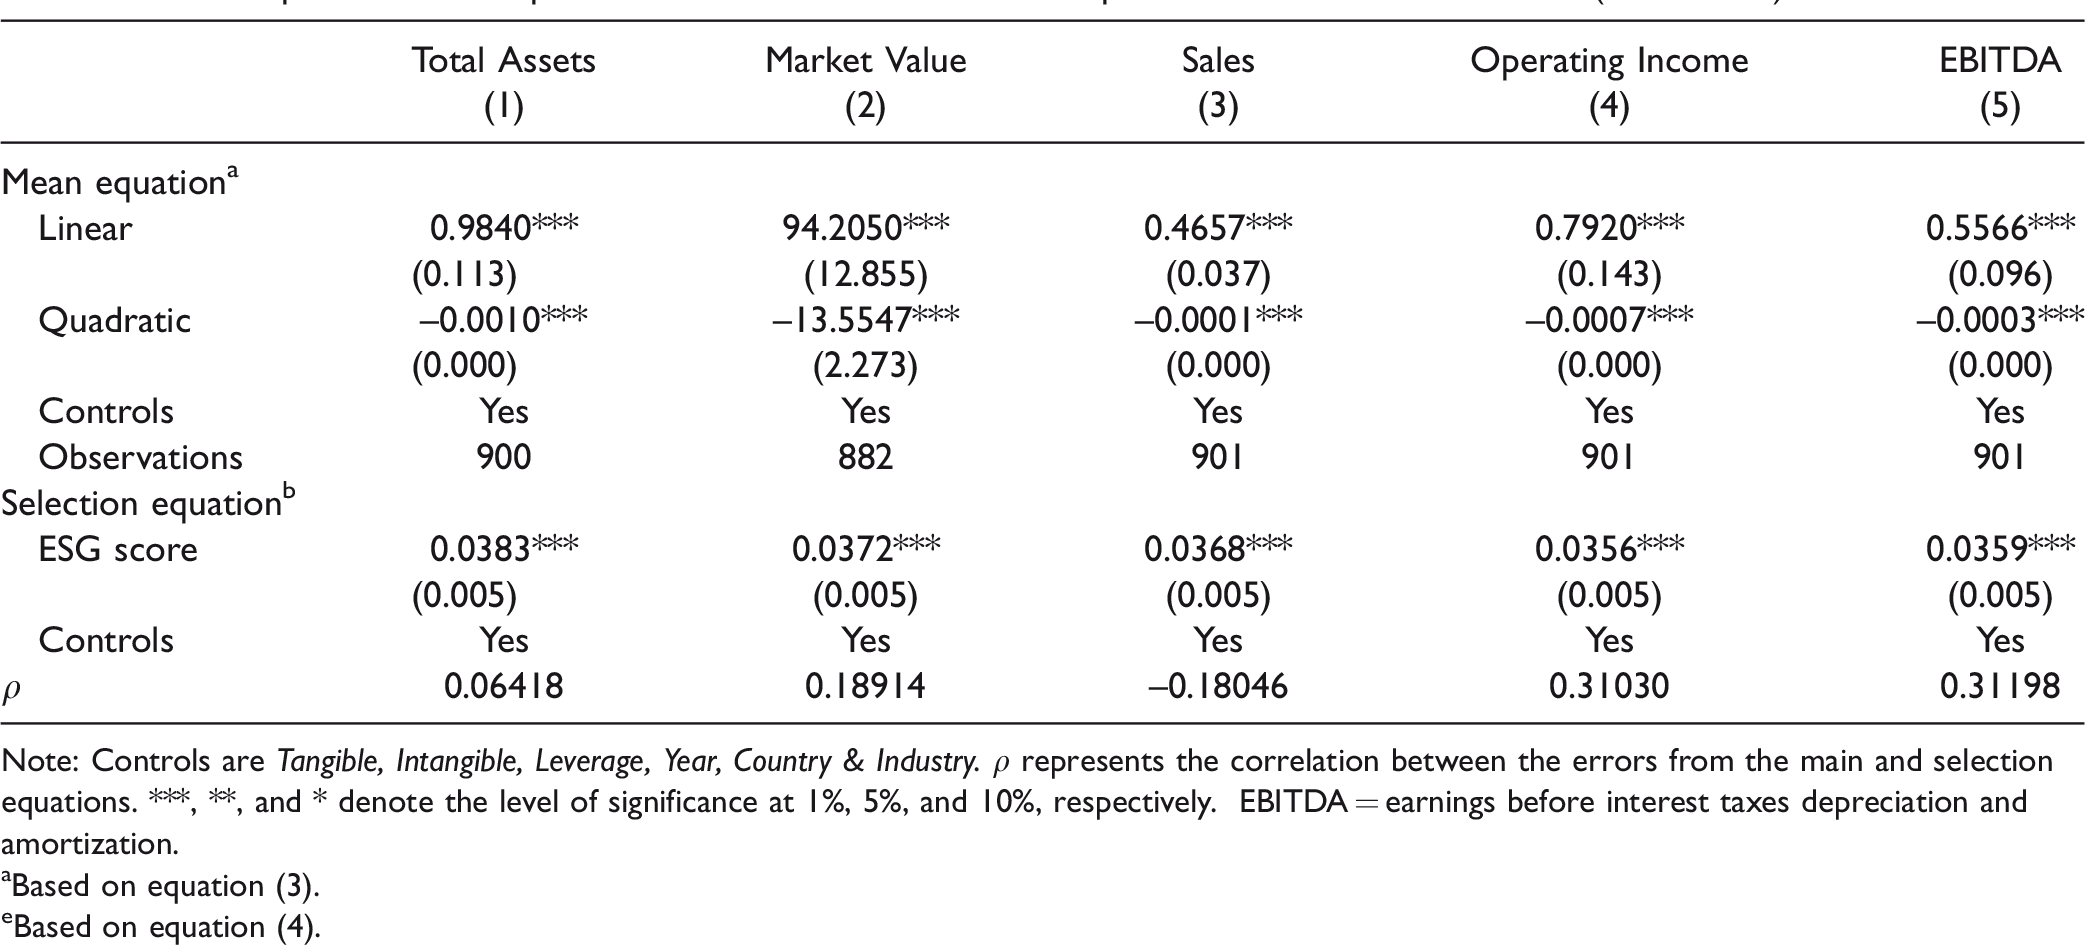
Note: Controls are Tangible, Intangible, Leverage, Year, Country & Industry. ρ represents the correlation between the errors from the main and selection equations. ***, **, and * denote the level of significance at 1%, 5%, and 10%, respectively. EBITDA = earnings before interest taxes depreciation and amortization.
aBased on equation (3).
eBased on equation (4).
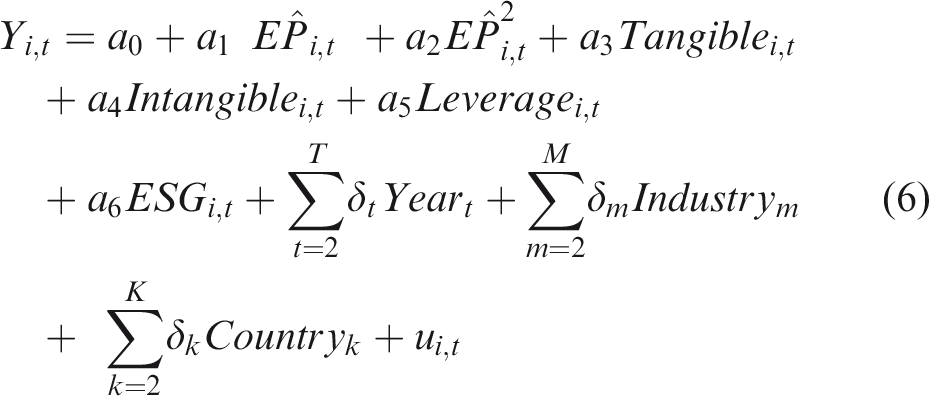
In addition to the above, a panel two-stage least squares regression is used to further solidify the results against possible endogeneity concerns (see Koo, Lim, and Dobruszkes 2017; Petit and Seetaram 2018; Park, Woo, and Nicolau 2019). The estimation of this model is also a two-stage process. The first stage estimates the economic performance model (equation (5)) by considering the lagged values of the explanatory variables as the exogenous instruments (Zaman et al. 2016). In the second stage, the fitted values of EP from equation (5) are used as the independent variable in equation (6). The first-stage equation is as follows:
The specification tests (Table 5) show that, excluding the model in column 3, the lagged values of control variables are valid instruments (Hansen J test). The results remain strongly significant, with the coefficients of both the linear and the quadratic economic performance terms having positive and negative signs, respectively. In line with the Heckman selection model, when endogeneity is controlled the evidence for a CKC in tourism corporations is stronger.
Panel 2-Step Least Squares Estimations for Tourism Corporations Carbon Performancea (2005–2018).
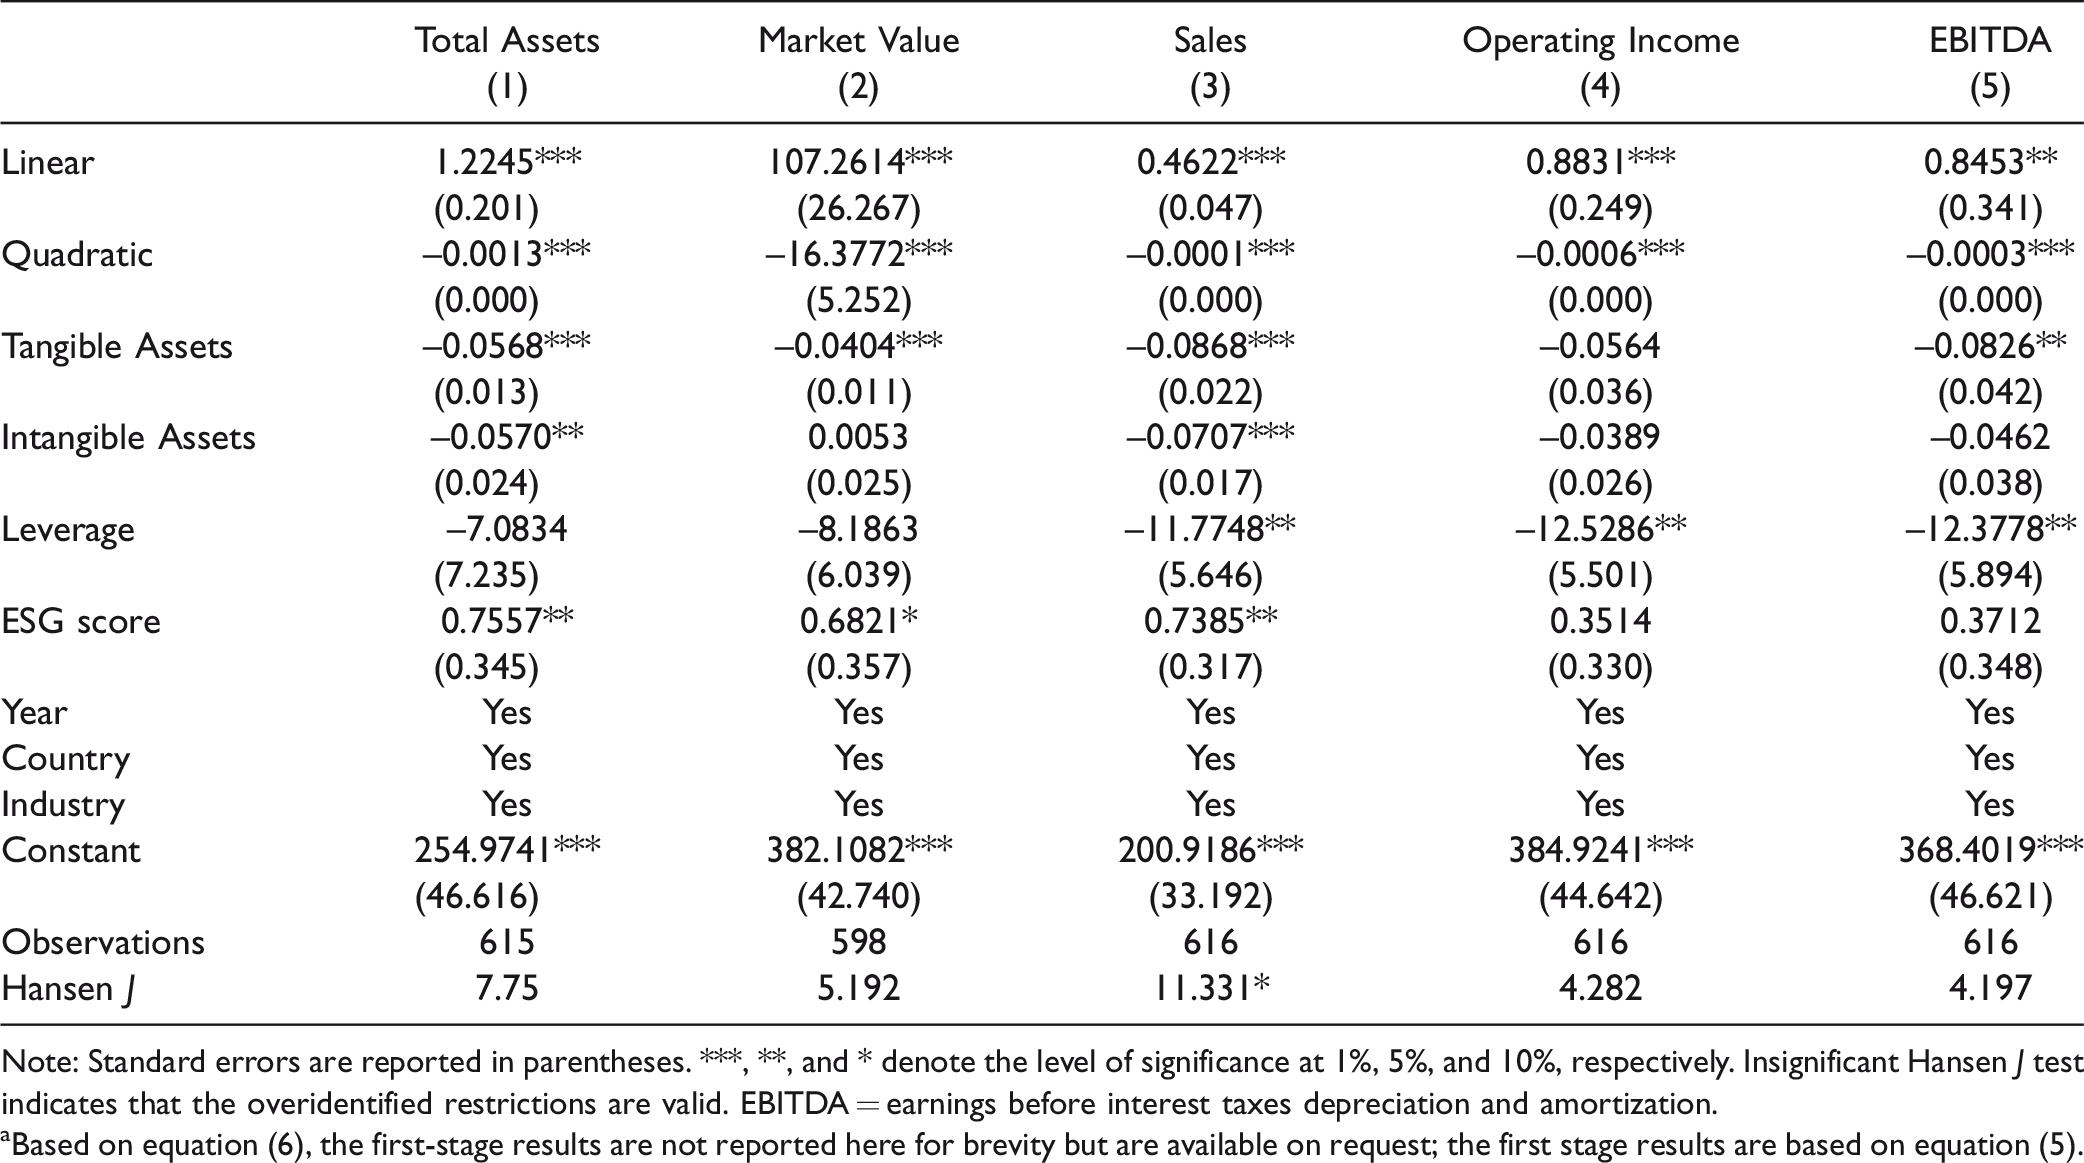
Note: Standard errors are reported in parentheses. ***, **, and * denote the level of significance at 1%, 5%, and 10%, respectively. Insignificant Hansen J test indicates that the overidentified restrictions are valid. EBITDA = earnings before interest taxes depreciation and amortization.
aBased on equation (6), the first-stage results are not reported here for brevity but are available on request; the first stage results are based on equation (5).
The Role of Direct and Indirect Emissions
Having established the empirical validity of the inverted U–shaped association between carbon and economic performance in tourism corporations, it is of paramount importance to examine whether the scope of emissions can offer variability in the results. A graphical illustration in Figure 3 shows the association between direct/indirect emissions and economic performance indicators. The figure depicts a clear inverted U–shaped curve for all five EP indicators. However, the total carbon performance and direct emissions (Scope 1) follow a very similar nonlinear inverted U–pattern, while the associated patterns for indirect emissions (Scope 2) look slightly different.
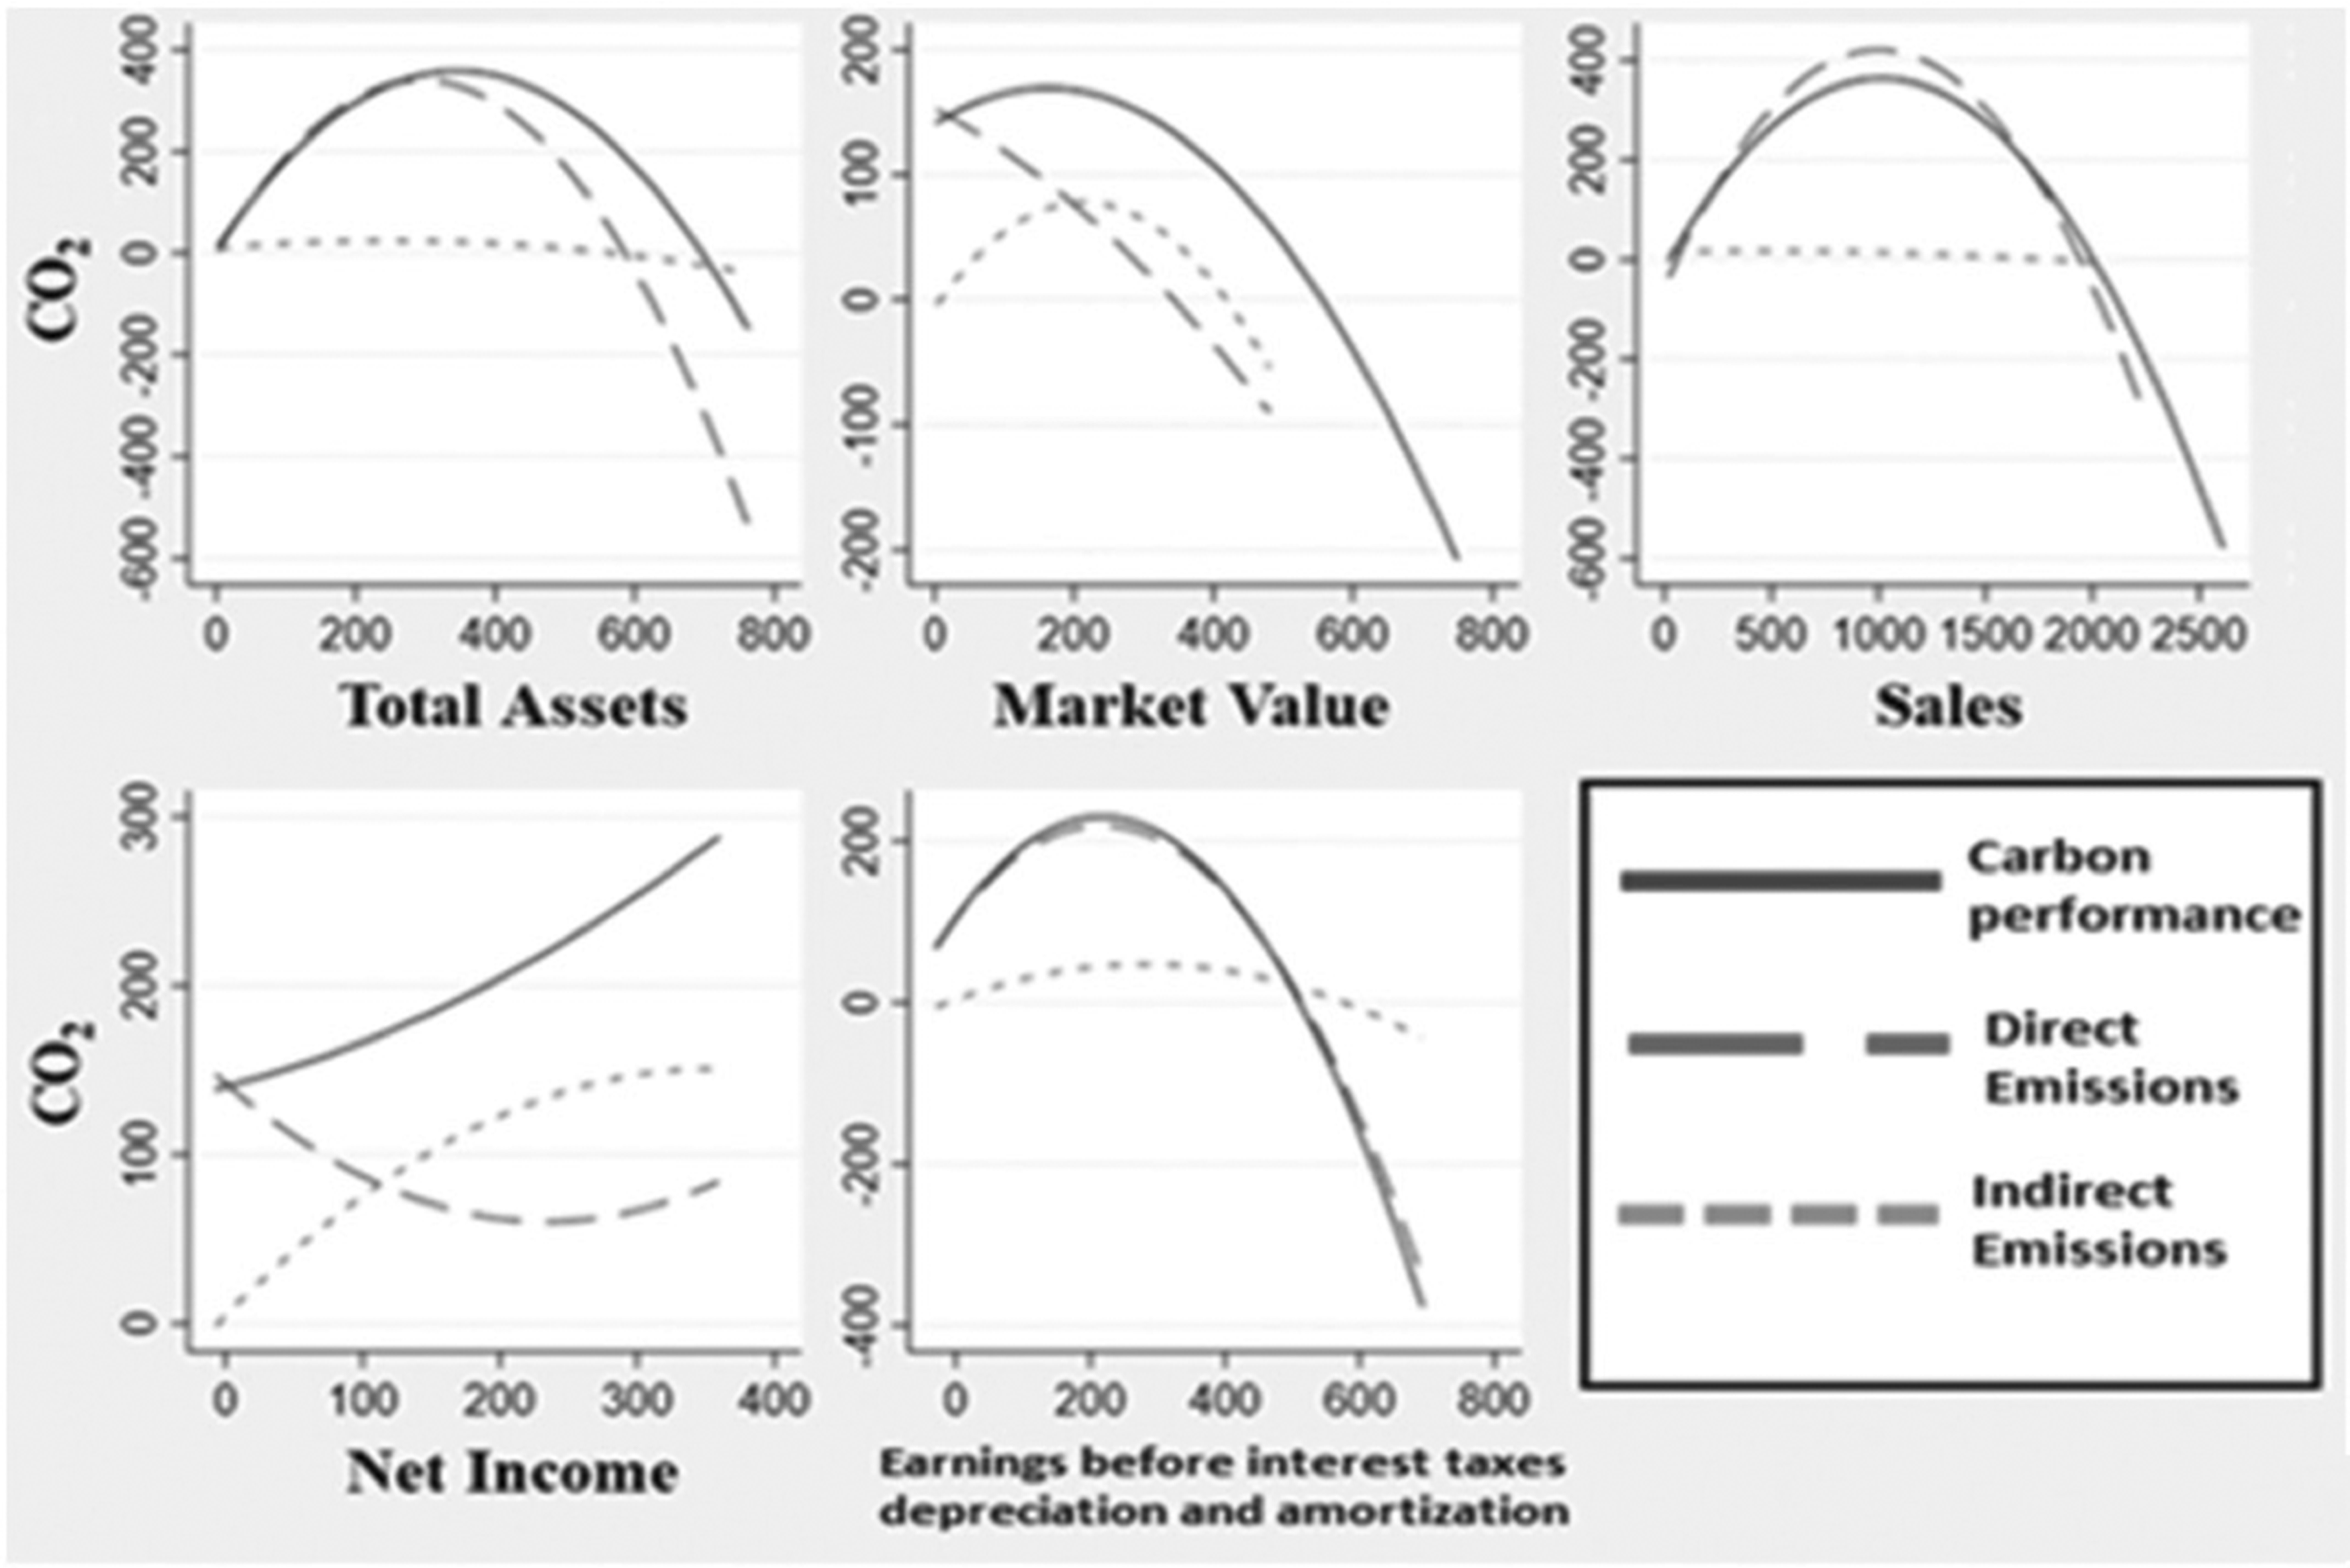
Tourism corporations’ carbon Kuznets-curves (2005–2018).
In Table 6, columns 1–5 adopt direct emissions, and columns 6–10 adopt indirect emissions as dependent variables. Notably, results reveal that all level coefficients are positive and all squared coefficients are negative, representing an inverted U–shaped curve. However, not every coefficient is statistically significant. Fixed and random effects estimations show that two of five indicators (Total Assets and Sales) are associated with direct emissions (Scope 1) in the hypothesized inverted U–shaped. By contrast, Market Value and Operating Income indicators exhibit inverted U–shaped relation with indirect emissions (Scope 2), whereas Total Assets, Sales, and EBITDA have a positive and linear effect on the indirect emissions.
Panel Estimations for Direct and Indirect Emissions from Tourism Corporationsa (2005–2018).
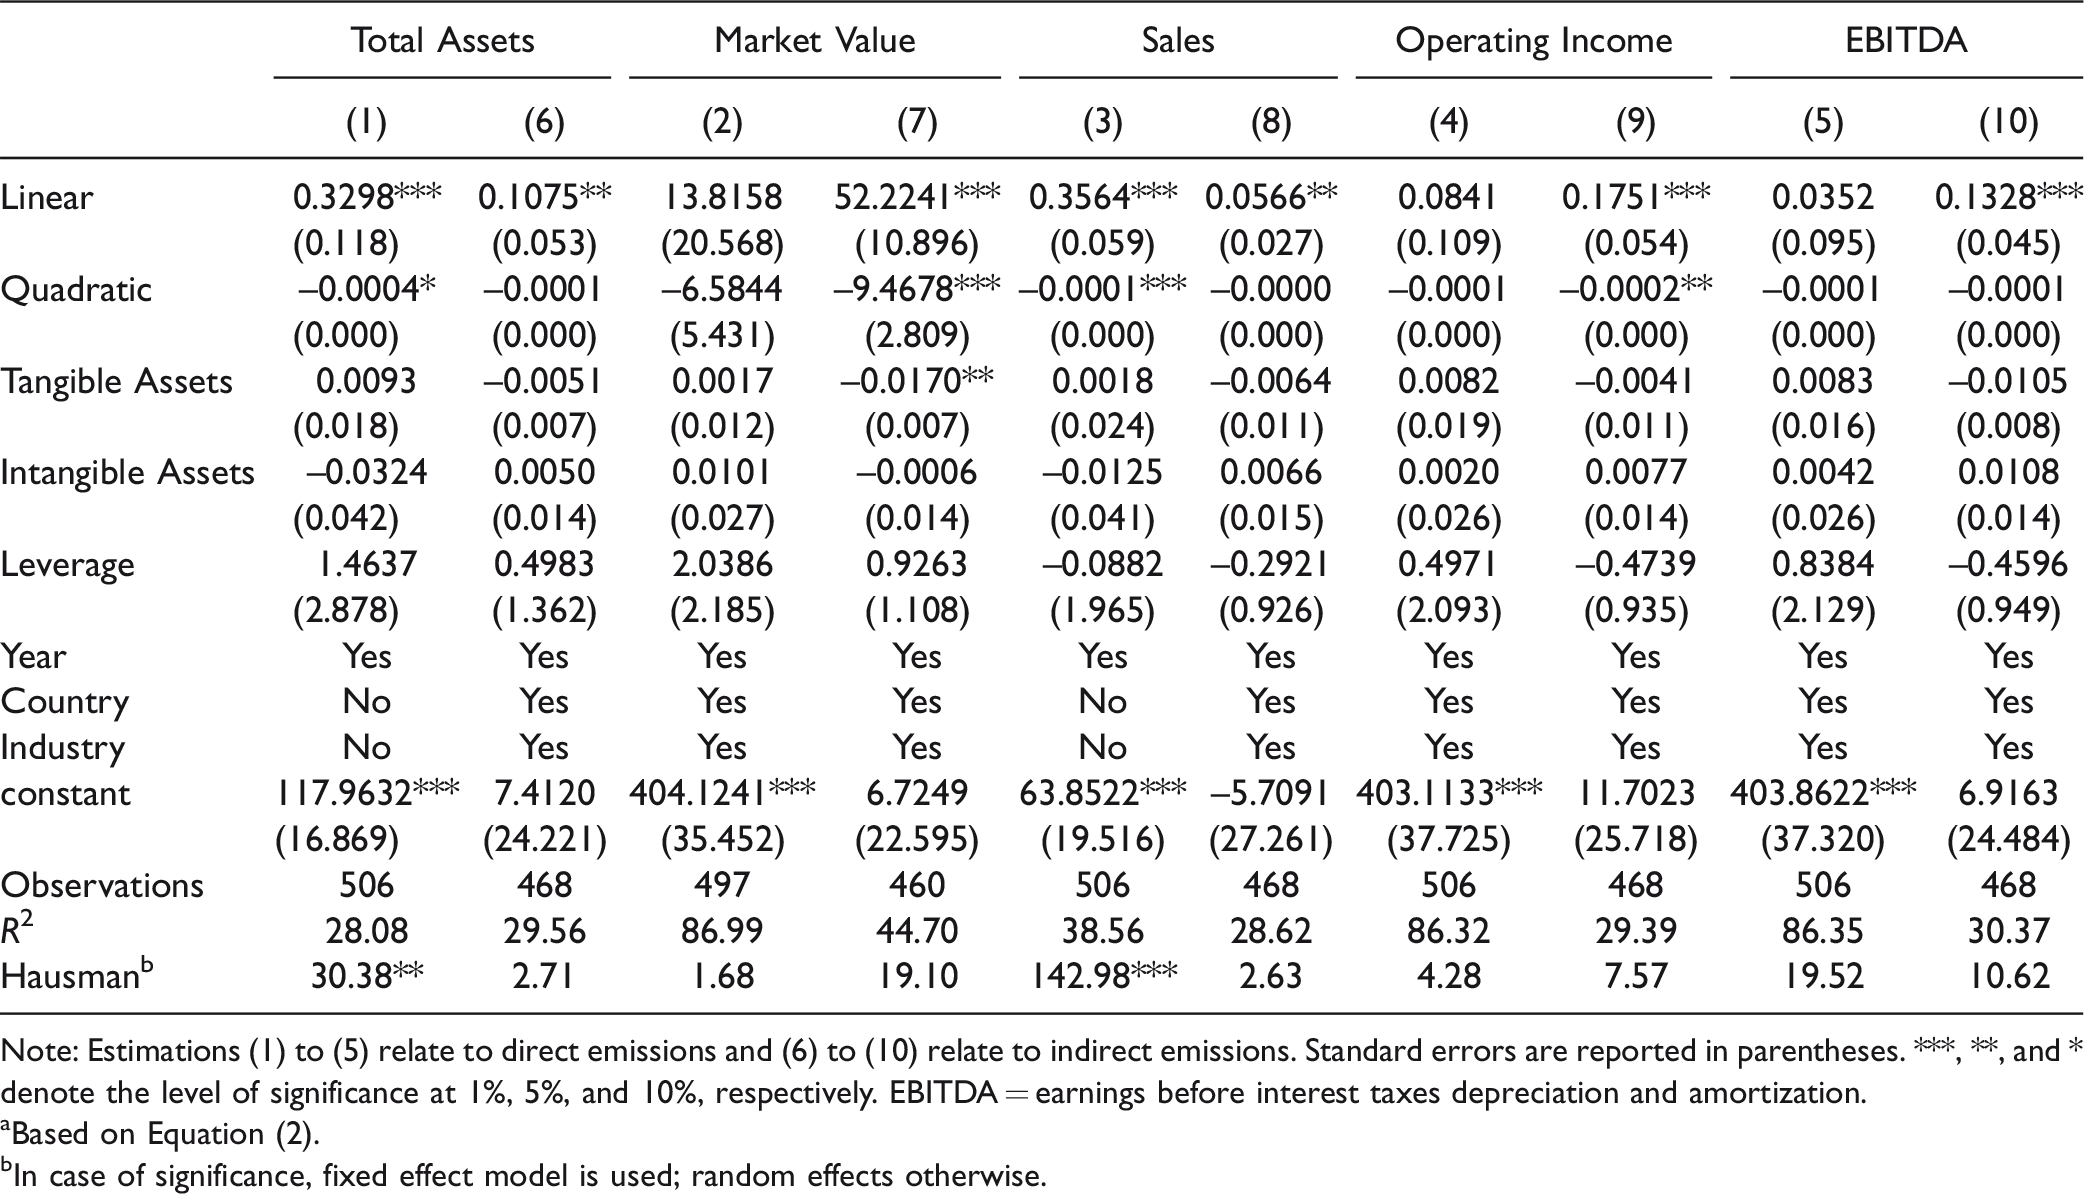
Note: Estimations (1) to (5) relate to direct emissions and (6) to (10) relate to indirect emissions. Standard errors are reported in parentheses. ***, **, and * denote the level of significance at 1%, 5%, and 10%, respectively. EBITDA = earnings before interest taxes depreciation and amortization.
aBased on Equation (2).
bIn case of significance, fixed effect model is used; random effects otherwise.
Conclusions
Over the past 25 years, a great deal of research has engaged within the debate about the CKC hypothesis. According to recent reviews published in the wider economic (Shahbaz and Sinha 2019) and environmental literature (Mardani et al. 2019), the extant literature on the topic from 1995 to 2017 comprises almost 200 articles. Despite the long period covered and the considerable number of articles surveyed in these reviews, only four cases examined the role of tourism. This is surprising, as tourism is one of the economic activities that is most dependent on the environment, creating multiple vulnerabilities and new opportunities with potential degradation (see Lesar, Weaver, and Gardiner 2019; Ma and Kirilenko 2019). We address this limitation by offering the first systematic review on the topic, incorporating a significant amount of new research that focuses on the role of tourism, which has been omitted or accumulated since the publication of recent CKC reviews. In fact, the findings of the systematic review reveal that a sizable (n = 22) literature emerged in the most recent period (2014–2019).
We also contribute to the tourism literature by reporting the steps in the systematic literature review process, in detail—from the identification to the inclusion of studies and from data extraction to their synthesis. Although the evidence-informed knowledge from systematic literature reviews is ever growing within the field of tourism, the current study adds to the small body of research that adheres to the Preferred Reporting Items for Systematic Reviews and Meta-Analyses process, responding to the “urgent need for consistency of systematic reviews in the field” (Pahlevan-Sharif, Mura, and Wijesinghe 2019, p. 165).
The study is also timely, as consolidation and integration of the literature in nascent fields of research, with a great deal of evidence created in a short period, is vitally important. In particular, our review reveals that the literature provides split results; 51% of the studies under review report the presence of an inverted U–shaped relationship between tourism development, carbon emissions, and GDP. However, it has to be noted that in 95% of the tests, tourism development was represented as an additional context-specific indicator (i.e., tourist arrivals, receipts, and expenditures) of GDP, GDP2 at the level of country or a panel of countries. We addressed this limitation by introducing a new perspective, at the corporation level, using a new set of variables that are performance related, addressing the call from Shahbaz and Sinha (2019). In particular, those authors’ extensive literature CKC review concludes that “Considering new perspectives, new set of variables, and going beyond the time series evidence can produce more productive results, based on which the policymakers can come up with substantial policy recommendations for encountering environmental degradation, thereby flattening the curve” (158).
We also present evidence of empirical validity using econometric estimation techniques on an international data set (2005–2018) from 86 corporations, accounted for endogeneity concerns, addressing the call from Park, Woo, and Nicolau (2019, p. 10) who state that “controlling for endogeneity is not a minor issue.”
However, our results should be treated with caution, as the emission indicators as well as the performance indicators were scaled by the number of employees, following the benchmark model of Broadstock et al. (2018). In contrast to the country-level CKC research, where there is the availability of rich data, at the corporate level there is a lack of environmental data (Tan et al. 2017). Therefore, our analysis is bounded by the voluntary disclosure of emissions from tourism corporations. Within this pool of available data, such as the Travel & Leisure INDEX in Datastream, the number of employees is the only analogous option to the per capita scaling. We acknowledge that a per customer scaling would have complemented our analysis, offering a more holistic view. Huang et al. (2015) conducted a nationwide survey in Taiwan with structured questionnaires and managed to collect relevant data (i.e., annual energy data, hotel occupancy rate, number of annually lodged guests, number of employees, room prices, and revenue) from 58 luxury hotels. This is a fruitful avenue for future research to collect additional customer-related data and extend our level of analysis.
Overall, recent engagements with the CKC hypothesis have clearly struck a chord in the field, in which many scholars recognize the need for an improved understanding of the tourism–environment nexus (e.g., Atzori et al. 2018; Higham, Ellis, and Maclaurin 2019; Ma and Kirilenko 2019; Wilkins et al. 2018). Our study in no way discredits past work but instead aims to stimulate the sometimes static and possibly stale tourism research praxis (Kock, Assaf, and Tsionas 2020; Tribe and Liburd 2016) by discussing the issues arising at the intersection of systematic literature review, theoretical underpinning, and econometric analysis of the role of tourism in the CKC hypothesis.
Supplemental Material
sj-pdf-1-jtr-10.1177_0047287520915276 - Supplemental material for Tourism Carbon Kuznets-Curve Hypothesis
Supplemental material, sj-pdf-1-jtr-10.1177_0047287520915276 for Tourism Carbon Kuznets-Curve Hypothesis by Emmanouil F. Papavasileiou and Panagiotis Tzouvanas in Journal of Travel Research
Footnotes
Acknowledgments
We are grateful to Professor Giampaolo Viglia for his valuable feedback on an earlier version of the manuscript and the two anonymous referees for their constructive comments and suggestions that helped us to improve the scope and clarity of this research. We would like to gratefully acknowledge the support of the University of Portsmouth, where this research was developed.
Declaration of Conflicting Interests
The author(s) declared no potential conflicts of interest with respect to the research, authorship, and/or publication of this article.
Funding
The author(s) received no financial support for the research, authorship, and/or publication of this article.
Author Biographies
Supplemental Material
Supplemental material for this article is available online.
References
Supplementary Material
Please find the following supplemental material available below.
For Open Access articles published under a Creative Commons License, all supplemental material carries the same license as the article it is associated with.
For non-Open Access articles published, all supplemental material carries a non-exclusive license, and permission requests for re-use of supplemental material or any part of supplemental material shall be sent directly to the copyright owner as specified in the copyright notice associated with the article.