
Abstract
Mobile health technology plays an important role in improving physical activity (PA). However, commercial healthcare applications for smartphones (apps) have poor retention, and understanding how people adopt and integrate app use in daily life is critical. We investigated the use patterns of PA apps and explored the usage styles that are predictive of continuation and discontinuation of use and of changes in PA levels over time. We analyzed 2-wave longitudinal survey data concerning commercial PA-app use, which included 4465 respondents (mean age = 50.7; 1932 women) identified as PA-app users at baseline. The participants completed a questionnaire regarding how and for what purpose they used the apps. A 6-month follow-up survey was administered that asked participants about their current app use and PA levels. At baseline, 2737 were identified as long-term users of a PA app (ie, use for more than 6 months). Long-term users reported appreciating the lifestyle management aspects (eg, constant accessibility to health information, tracking, and monitoring PA), whereas short-term users indicated that they appreciated their app’s distraction and building relationships (eg, finding like-minded peers) aspects. Prospective analyses (logistic regressions) demonstrated that lifestyle management was associated with continuing to use the app and increased PA levels at the 6-month follow-up, whereas distraction predicted discontinuing the use of the app and decreased PA levels. These findings suggest that on-purpose use (ie, using a PA app to improve one’s PA) is the key feature of being in an appropriation state, whereas off-purpose use may hinder app use, leading to less active lifestyles. The implications of appropriation theory and practice are also discussed.
Introduction
Mobile health has received increasing attention from researchers, practitioners, and other stakeholders as the ubiquity of mHealth tools allows the delivery of the right intervention to the right person at the right moment (e.g., Mair et al 1 and Mauch et al 2 ). The mHealth approach is expected to play a particularly important role in promoting physical activity (PA), which is effectively and efficiently supported by smartphone applications (apps) and wearable activity trackers that implement various behavior change techniques.3 -5 Several controlled and uncontrolled trials have assessed and established the efficacy of mHealth interventions for PA, and umbrella reviews have concluded that most mHealth interventions are effective albeit documenting high heterogeneity.6 -8
Regardless of their clinical and economic impact,9,10 mHealth interventions face important issues in implementation and distribution, namely poor retention rates for commercial app users. These challenges are a general issue for healthcare apps that is not limited to PA apps, as research indicates that only 4% of users who install mental health apps continue using the apps daily 11 and the median monthly usage time of mHealth apps, including both mental and physical health, is no more than 5 min. 12 Active user engagement has been suggested to be associated with the quality of product design 12 ; for example, reward and personalization functions may contribute to a good retention rate. One longitudinal study of commercial PA apps equipped with these functions suggested that 60% of users maintained active app use for at least 6 months. 13 Interestingly, the retention rate in randomized controlled trials of mHealth interventions is estimated to be 91%, which is much higher than that of commercial apps on the market. Thus, the discontinuation of app use is a unique phenomenon that can be observed in a daily, free-living context where no external regulation is expected by healthcare professionals or researchers. Assuming that a high-quality product will naturally attract active users through word of mouth is somewhat imprudent, given that the vast number of products emerge and vanish from the market each year. Knowing what factors are predictive of the continuation of app use is particularly important for stakeholders, as it can help build an effective strategy to facilitate and maintain app use, resulting in healthy lifestyle changes. Therefore, we aimed to explore how people continue using apps to support PA and exercise to clarify the technology appropriation processes.
Appropriation Perspectives
Appropriation is the way people adapt, adopt, and integrate new technology into their daily lives.14 -16 Carroll et al 15 distinguished between technology-as-designed (ie, the way of use that developers and designers intended) and technology-in-use (ie, how technology is currently used). Through an appropriation process, users implicitly or explicitly transform technology-as-designed into technology-in-use—that is, they “trial and evaluate a new technology, select and adapt some of its attributes and so take possession of its capabilities in order to satisfy their needs” (p. 4). New technology must go beyond how it is designed by developers to become part of users’ daily routines, and this process often involves users’ active adoption and integration (eg, reshaping and customizing a mobile device).
An increasing number of studies have investigated mHealth adoption, most having a theoretical basis in the technology acceptance model (TAM) and unified theory of acceptance and use of technology (UTAUT and UTAUT2). 17 The TAM highlights perceived usefulness and ease of use as fundamental determinants of user acceptance of information technology.18,19 Conversely, UTAUT highlights 4 constructs (ie, performance expectancy, effort expectancy, social influence, and facilitating conditions) and 3 extensions (ie, hedonic motivation, price value, experience, and habit) influencing the intention to use new technology. Empirical studies have shown that perceived usefulness and ease of use are significantly associated with continuance intention to use health apps on smartphones, 20 and these perceptions can be explained by external variables such as health consciousness, subjective norms, and Internet health information use efficacy. 21 Similarly, the UTAUT constructs (eg, performance expectancy, effort expectancy, and social influence) have been shown to have a significant impact on users’ behavioral intentions to adopt mHealth services, although some inconsistencies have been documented.22,23
The Mobile Phone Appropriation Model
Technology adoption models, including the TAM and UTAUT, typically target binary use intention, namely either the adoption or rejection (and use or non-use thereof), as the dependent variable. However, Wirth et al 16 argued that appropriation is a more complex concept that cannot necessarily be boiled down to the adoption-rejection dichotomy, which ends in various usage and meaning patterns at the individual and social levels. The Mobile Phone Appropriation (MPA) model explicitly theorizes the multifaceted patterns of everyday integration of mobile/smartphones and individual apps.17,24,25 This model assumes 2 aspects of usage—symbolic and functional. The former represents the goal for which a mobile phone or app is used, also known as the gratification dimensions.16,26 Stehr et al 24 applied the MPA model to their analyses of nutrition app use and divided the functional aspects into the following 3 subdimensions: distraction (ie, using an app for pastime), lifestyle management (ie, continuous monitoring and tracking of users’ own health states and behaviors to fulfill informational needs), and building relationships (ie, exchanging with like-minded peer users, seeking and receiving support from peers, and competing with other users). Symbolic aspects are subdivided into psychological and social dimensions pertaining to behaviors important to the users themselves and in relation to their social surroundings. 24 These aspects cover preference and suitability (eg, how the user likes the app and how the app fits the user), as well as prestige and identity, using the app as a way of expressing the user’s sense of self in public, such as in a fashion statement.17,27 The MPA model places the functional and symbolic aspects of use in a cycle of appropriation, in which metacommunication (ie, communication on how individuals use an app) and evaluations (eg, prospects about future app use for functional and symbolic aspects, beliefs about social norms, and barriers hindering app use) dynamically interact with and influence app use behavior.
Evidence Gap
Although the MPA model is a comprehensive and sophisticated framework for analyzing different app use patterns, empirical evidence is still lacking on how predictive the model is for the actual continued use of a healthcare app. The model correctly points to the importance of understanding user behavior with multifaceted aspects rather than the adoption-rejection dichotomy.17,24,25 However, it is an important question (especially for stakeholders) how likely users are to continue using an app with a particular task and purpose—for example, whether people using a PA app for a pastime would be more likely to continue using the app for lifestyle management. Most appropriation process studies rely on qualitative or cross-sectional analysis. Longitudinal evidence is required to establish the predictive value of the aspects of use listed in the MPA model.
Another notable gap in the research is that studies on adoption and appropriation focus almost exclusively on IT use (or use intention) of information technology as the dependent variable. Analyses of these proximate outcomes are meaningful for designing and updating service products. However, when it comes to a healthcare app, distal outcomes are equally important; that is, how the functional and symbolic aspects of app use are associated with actual health outcomes such as engagement in PA and exercise (in the case of apps supporting PA and exercise).
Objectives
Therefore, the current study investigated how the functional and symbolic aspects of PA-app use would predict the (a) (dis) continued use of apps and (b) changes in PA levels over time. Our focus was exclusively on the functional and symbolic aspects although the MPA model included other active components such as metacommunication and evaluations. Stehr et al 24 reported that metacommunication took place rarely among the users of a nutrition app, and they based their analyses (of user types) on the behavioral dimensions of the MPA model. We followed this approach given that this study is at the early stage of investigation for the appropriation process of PA app usages, and is, as far as we know, among the first to apply the MPA scheme to the analysis of PA apps. Questionnaire data from a longitudinal survey were analyzed. Participants reported how they used a PA app (for the functional and symbolic aspects) at baseline, and at the 6-month follow-up, they completed a questionnaire regarding the current use (vs non-use) of the app as well as their levels of PA.
Our analyses were conducted in a somewhat explorative manner, as we did not have a clear a priori hypothesis regarding which aspects of app use would be predictive of its continued use and participants’ PA levels at follow-up. Yet, we expected that the lifestyle management dimension would be predictive of continued app use at the 6-month follow-up, as it may indicate that users are aware of what they need and what they can do with the app. 24 However, distraction and building relationships may be less predictive—these less health-conscious uses may indicate that users are still exploring how they want to use the app and what goals they want to achieve with the app. Symbolic aspects, particularly identity (using the app to establish and express the user’s sense of self), would also be predictive of continued app use as the need to deal with the issues of identify are thought to drive the users’ appropriation of technology. 15
Methods
Data
We analyzed a dataset of how people use commercial apps to support PA and exercise, some of which have been published elsewhere (these earlier works addressed the associations between individual app functions used and physical activity28 -30). The data contained questionnaire responses from 20 573 Japanese-speaking adults who were online panels registered in a sample pool database (see Oba et al 28 for more details on the sampling procedure). The inclusion criteria were being over 18 years old, having a good command of Japanese, and residing in Japan. In this dataset, 5030 (24.4%) participants reported that they had used a PA-supporting app and wearable activity tracker, of which 4465 completed a questionnaire regarding the functional and symbolic aspects of the app use. These participants were invited to complete a 6-month follow-up survey, in which 3825 completed questionnaires reported on current app use and PA levels. The overarching study was approved by the Ethics Committee of the National Institute of Advanced Industrial Science and Technology (approval ID: 2022-1279). We adhered to the STROBE reporting guideline when drafting this manuscript. 31
Measures
Use of Apps for Supporting Physical Activity
Participants provided a binary response regarding their use of apps to support PA or exercise. Those who responded affirmatively provided further information on how they used the app. The questions included (a) the names of the apps in use, (b) how long they had been using the app that was used most frequently (less than a week to more than a year), and (c) how frequently they were using the app (less than once per month to multiple times per day). The complete description of the questionnaire is available in Oba et al. 28 At the 6-month follow-up, participants reported on their current app use (vs non-use) again, selecting 1 from the 3 response options (using an app, used but not using it anymore, or have never used it). The latter 2 responses were regarded as app non-use (ie, discontinuation), although a response of never used would be inconsistent with the participants’ baseline response.
Functional and Symbolic Aspects of App Use
We adapted the MPA scale for nutritional apps 24 to assess the functional and symbolic aspects of PA app use. In the original scale for nutritional apps, each item was phrased to refer to nutritional apps in general (eg, I’m using nutrition apps for diversion). We slightly adapted this wording to refer to the specific PA apps that each participant used (eg, I’m using the PA app for diversion) while keeping the remaining content identical.
Participants indicated their attitudes toward and impressions of the PA app. Nine items assessed functional aspects, including distractions (3 items), lifestyle management (3 items), and building relationships (3 items). Seven items assessed symbolic aspects, including psychological (4 items) and social (3 items) dimensions. We did not aggregate these items into factor scores because each item conveys slightly different concepts. For example, each social-dimension item represents showing off, a supportive environment, or identification. Participants rated the extent to which each item was applicable to situations or reasons why they used the indicated PA app on a 5-point scale (1 = not at all to 5 = very much).
Physical Activity
The International Physical Activity Questionnaire-Short Form (IPAQ-SF)32,33 was used to assess average weekly PA levels. Participants indicated the number of days and duration (in minutes) spent on three PA domains—(a) walking, (b) moderate-intensity, and (c) vigorous-intensity. The reported number of days and minutes were aggregated to represent the total PA time (min/week). We also converted this into metabolic equivalents (METs-hour) and assessed whether each participant met the PA level recommended by the Ministry of Health, Labor, and Welfare in Japan 34 (ie, 23 METs-hour/week for adults aged < 65 years; 10 METs-hour/week for older adults ≥ 65 years). The binary score clarifies whether each participant had the recommended levels of physical activity for the studied sample, which vary across countries and target populations (cf. Geidl et al 35 ).
Statistical Analyses
Cross-sectional and prospective analyses were conducted. The cross-sectional analyses focused on the duration of app use reported at baseline, examining differences in demographics and app use between long-term users (those using an app for ≥6 months) and relatively new short-term users (those using an app <6 months). A priori power calculation was not conducted specifically for this study because the sample size (n = 3825) was large enough to detect a small effect (f2 = 0.02, for which n = 395 is required with the assumptions of alpha = .05 and power = 0.80). Given the large sample size (and power) of the current dataset, we interpreted the standardized mean differences (Cohen’s d) instead of basing our inferences on statistical hypothesis testing (ie, P-values) for demographic and descriptive analyses. The app-use duration cutoff of 6 months was arbitrarily selected because we assumed that 6 months were long enough to indicate the maintained use of the app according to the stage-of-change theory,36,37 considering individuals in the maintenance stage have maintained the desired behavior for 6 months.
The prospective analyses highlighted how the functional and symbolic aspects of app use predicted app use continuation at the 6-month follow-up. A logistic regression was conducted, in which users who reported their continued versus discontinued uses at follow-up were predicted by each app-use aspect assessed at baseline. A similar logistic regression analysis was conducted with the follow-up levels of PA as the binary dependent variable (ie, adherence to the national PA guidelines), in which each app-use aspect was included as a predictor while controlling for the baseline levels of PA. This logistic regression analysis was repeated for the following 2 subsamples: individuals who adhered to the PA guidelines at baseline and those who did not. For the prospective analyses, data from those who completed both the baseline and follow-up were used (n = 3825). Prior to these analyses, characteristics of the participants lost to the follow-up were explored. No multicollinearity was found for the logistic regressions predicting PA-app use (VIF = 1.47-3.45) and adherence to the recommended PA level (VIF = 1.51-3.37).
Results
Demographic characteristics and descriptions are presented in Table 1. Long-term users were older, had higher education levels and income, and were more likely to be men and to adhere to the PA guidelines, compared with short-term users. Notably, long-term users interacted with the apps more frequently (n = 2174 [79.4%] used them more than once per day) and were more likely to continue using the apps at the 6-month follow-up (n = 1609, 58.8%). Most participants who had adhered to the PA guidelines at baseline maintained the recommended levels to follow-up (79.3%; 1986 out of 2504). Similarly, those who had not adhered to the guideline at baseline typically maintained under-recommended levels to follow-up; only 26.7% (353 out of 1321) met the recommended levels at follow-up.
Demographics and Descriptives at the Baseline and Follow-up.

Note. Guideline-recommended levels of PA = 23 METs hours/week for adults aged < 65 years; 10 METs hours/week for adults aged ≥ 65 years). Short-term or long-term users = those using apps for <6 or ≥6 months.
BMI = body mass index; IPAQ-SF = International Physical Activity Questionnaire-Short From; 1 USD = 140 JPY.
The specific apps and functions that each participant used were elaborated elsewhere. 28 To summarize, the most frequently used apps were iOS health app (26.6%; n = 1018 out of 3825), Trima (22.8%; n = 870), dHealthcare (20.4%, n = 779), and Google Fit (20.29%; n = 776). Participants reported that they used these apps for the following functions: sensor information, goal setting, energy analysis, reward points, recording weight, and visualizing goal progress. Around one-third of the participants (34.9% n = 1340 out of 3825) reported that the apps were pre-installed when they purchased their smartphones or tablets.
We observed dropout of 640 (14%) participants to the follow-up. Characteristics of the dropout (vs completer) samples were explored. Specifically, a logistic regression was estimated, with dropout (vs completer) being predicted by the following 7 baseline variables: age, gender (0 = men and 1 = women), BMI, education, income, PA adherence, and frequency of app use (ie, use app at least once per day). Older participants (OR = 0.97, P < .001, 95% CI [0.96, 0.97]), men (OR = 1.28, P = .010, 95% CI [1.06, 1.54]), and frequent app users (OR = 0.78, P = .009, 95% CI [0.65, 0.94]) were less likely to dropout from the study. These variables were included as covariates in the following regression analyses.
Table 2 illustrates the differences in the functional and symbolic aspects of app use between short- and long-term users at baseline. Lifestyle management items (Functional Aspect (FA) Items 4-6) were rated higher by long-term users (|ds| > 0.23), whereas short-term users appreciated distraction (FA Item 3, I’m using the app when I’m bored) and building relationships (FA items 7-8; |ds| > 0.23). Regarding the symbolic aspects, long-term users rated the psychological dimensions higher (except for Symbolic Aspect (SA) Item 3, I’m using a cutting-edge app) than short-term users. No substantial differences were found in the social dimensions (|ds| < 0.20, SA Items 5-7).
Means (SDs) of the Functional and Symbolic Aspects of Short Versus Long-term Users at Baseline.
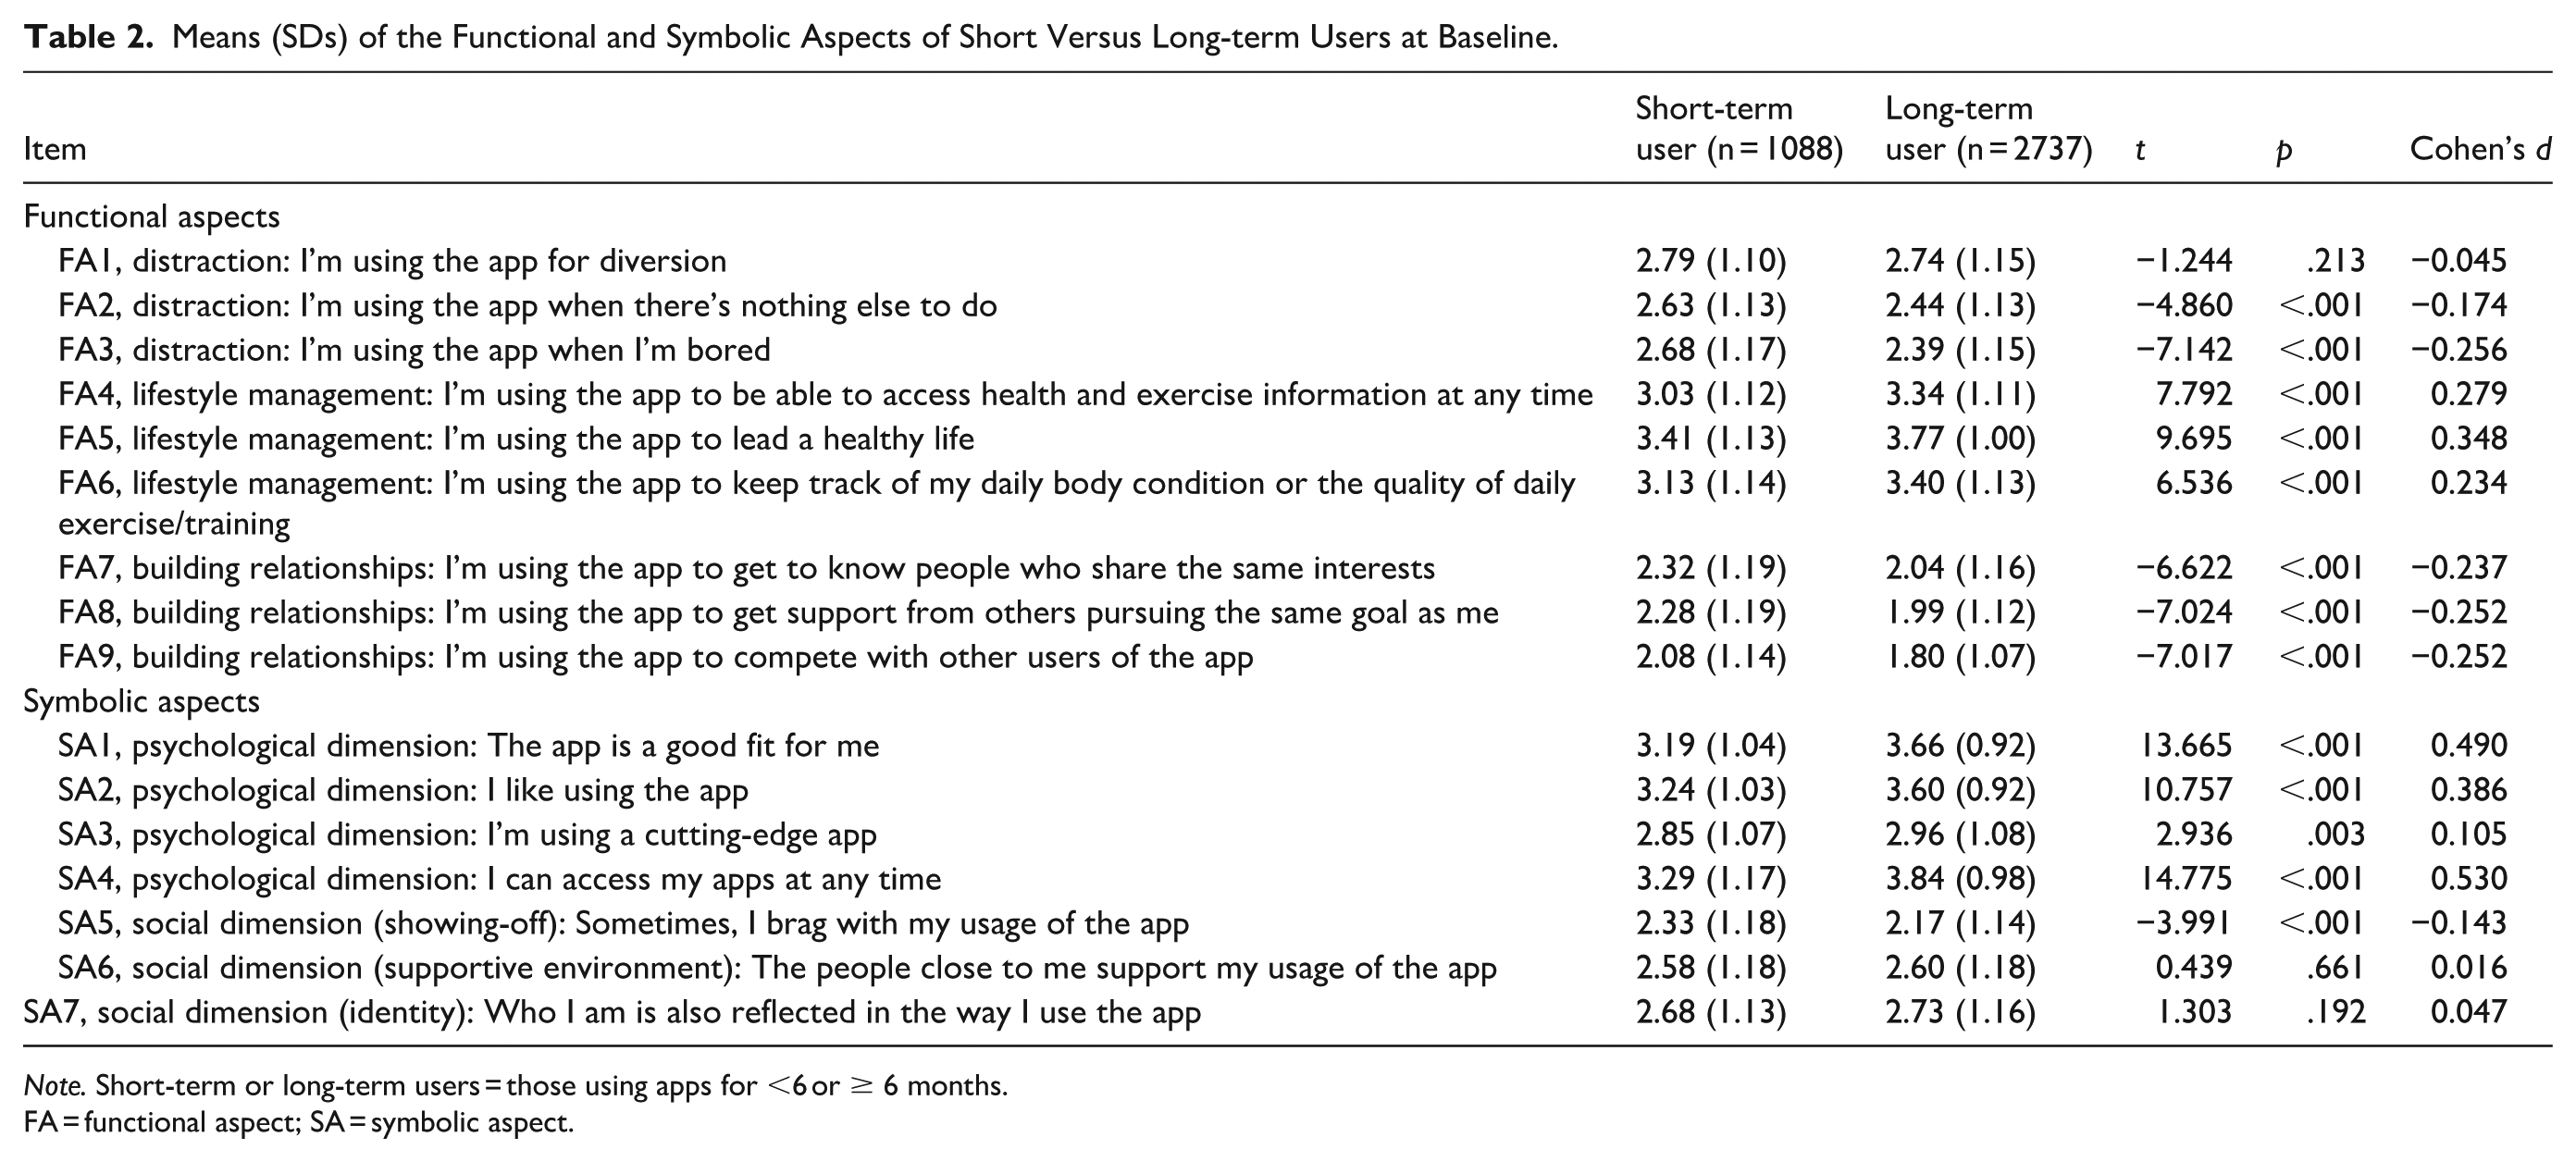
Note. Short-term or long-term users = those using apps for <6 or ≥ 6 months.
FA = functional aspect; SA = symbolic aspect.
Table 3 shows the results of the logistic regression predicting PA-app use (vs non-use) at the 6-month follow-up. FA Items 4 to 6 (ie, accessing health information; leading a healthy life; keeping track of body conditions and exercise) were predictive of continuation of app use; however, FA2 and FA7 had significant negative associations, indicating that those using PA apps for distraction (FA2) or finding peers (FA7) were likely to discontinue app use. Similarly, SA2 and SA4 (liking the app; being able to access the app at any time) were positively associated with continued use.
A Logistic Regression Predicting App Use (vs Non-use) at the 6-Month Follow-Up (n = 3825).

Note. Gender = 0 for men and 1 for women. BMI, body mass index (kg/m2). Duration was coded as 0 for app use < 6 months and 1 for app use ≥6 months. Frequency was coded as 0 for app use once in 2 or more days and 1 for app use at least once per day.
We conducted another logistic regression to predict adherence to the PA guidelines at follow-up after controlling for PA guideline adherence at baseline (Table 4). The results showed that FA2 (using apps for distraction) was negatively associated with adherence at follow-up, whereas FA6 (leading a healthy life) had a significant positive effect. None of the symbolic aspects were significantly associated with guideline adherence at follow-up. As a sensitivity analysis, we estimated a multiple regression model predicting the total PA level (in METs-hour/week) at follow-up, instead of the binary adherence score to the guidelines. The results (Table S1) were overall consistent with those of the binary adherence, except for the significant positive effect of FA7 (building relationships).
A Logistic Regression Predicting Adherence to the PA Guidelines at the Follow-up (n = 3825).

Note. Duration was coded as 0 for app use < 6 months and 1 for app use ≥6 months. Frequency was coded as 0 for app use once in 2 or more days and 1 for app use at least once per day. Guideline-recommended levels of PA = 23 METs-h/week for adults aged < 65 years and 10 METs-h/week for adults ≥65 years.
FA = functional aspect; SA = symbolic aspect.
The same logistic regression analysis was repeated for selected samples, namely individuals who adhered to the PA guidelines at baseline and those who did not. The results were consistent with those of the whole-sample analysis; among individuals who adhered at baseline, FA2 (using apps for distraction) was associated with non-adherence whereas FA6 (leading a healthy life) were predictive of adherence at follow-up (Table S2). However, among individuals who were not adherent at baseline, neither FA2 nor FA6 was identified as a significant predictor. Instead, FA4 (accessing health and exercise information at any time) was found to have a significant positive effect on adherence at follow-up (Table S3).
Discussion
In this study, we analyzed 2 waves of longitudinal survey data on commercial app use from a community sample to evaluate the predictive value of the MPA model. Specifically, we aimed to identify the functional and symbolic aspects of app use that predict continued app use and PA levels.
Regarding functional aspects, cross-sectional analyses at baseline revealed that long-term users (those already using an app for more than 6 months) appreciated aspects related to lifestyle management (eg, constant accessibility to health information, tracking, and monitoring PA), whereas short-term users rated distraction and building relationships as appreciated aspects. Similar patterns of results were observed in the prospective analyses—people appreciating lifestyle management aspects were more likely to continue using the app at the 6-month follow-up. In contrast, distraction and building relationships were associated with discontinuation. Lifestyle management, which is the core aspect of healthcare apps,38,39 might be the key dimension that inform the appropriation state, while distraction and building relationships can be seen as behaviors signaling that appropriation is in progress. Users who appreciate the off-purpose dimensions of the app might be exploring how they want to use the app (cf. Benamar et al 40 ), as neither distraction nor building relationships are functionalist behaviors to achieve a specific objective, namely, to improve and maintain PA. This might reflect low intrinsic motivation toward PA among distraction users, but the sample showed high levels of self-reported PA (M = 46.3 and 50.3 METs-h/w for short- and long-term users) at baseline. Therefore, in general, even distraction users were interested in PA and had actively engaged in it at baseline, but their use styles were not limited to improving PA directly.
Importantly, our results also showed that lifestyle management was positively associated with adherence to the national PA guidelines at the 6-month follow-up, whereas distraction was negatively associated with adherence. These associations appear to be relevant particularly for individuals who were already active. The subgroup analyses identified these effects among individuals who were adherent to the PA guidelines at baseline; however, accessing health information was the only significant predictor among those who were non-adherent at baseline.
On-purpose (or health-conscious 24 ) use appears to be crucial for maintaining app use and achieving an actual health goal. Indeed, Stehr et al 24 identified the health-conscious group among users of a nutrition app, which is characterized by their highly functional and goal-oriented use of the app and less frequent interactions with app functions that are not directly relevant to their health goals; also, health-conscious users typically appreciate apps that are easy to use and do not demand digital competencies. It might therefore be advisable that a PA app (and perhaps healthcare apps in general) should be designed as simple as possible with tightly focusing on the lifestyle management functions for fostering appropriation.
For symbolic aspects, we found that the psychological dimensions (eg, I like using the apps; I can access my apps at any time) were positively associated with the continuation of app use, which may reflect intrinsic motivation driving continuous app engagement. Contrary to our hypothesis, social dimensions were not associated with the reported duration of app use at baseline or the reported continuation of app use at the 6-month follow-up. We have no clear explanation to readily reconcile these unexpected null results (particularly for identity). However, one possibility is that users internalize the apps after they have integrated app use into their daily routines, suggesting that repeated or regular use of apps may foster affective attachment and a sense of identity (but not in the other way around). Studies suggest that smartphones are used at any time and in nearly every environment and that people are likely to develop an attachment (or even addiction) to their mobile devices through regular exposure and interactions in their daily lives.41,42 Analyses on use patterns and appropriation of a nutrition app 24 identified a group of users, namely socializers, who are particularly interested in exchanging views with like-minded users, receiving support from others with similar goals, and competing with others’ achievements. This group is less focused on leading a healthy lifestyle and tends to use the app for distraction. Such patterns suggest that social dimensions may relate more to off-purpose or socially oriented uses of apps, and may be less relevant for functionalist behaviors aimed at improving PA. Steher et al 24 highlighted the importance of offering social features (eg, synching to social media, gamified competition) to maintain socializers’ willingness to continue using an app. However, as our findings suggest that social dimensions were not significant predictors of continued app use, a balanced approach may be necessary. If users’ social needs are already largely met by dedicated social media apps, comprehensive social features may not have to be integrated into a healthcare app.
Our findings should be interpreted considering important methodological limitations. First, we included in the analyses any PA apps that participants were using, as we wanted to maintain the generalizability of the results across different PA apps. Most participants identified iOS Healthcare and Google Fitness (see Oba et al 28 for details) whereas others used different apps, such as those with a specific focus on fitness, training, or disease management (eg, for hypertension and diabetes). Participants typically reported that they started to use the app because it was pre-installed on their phones, 28 which may explain the prevalence of iOS Healthcare and Google Fitness in this sample. Future research should investigate the differences in app-use aspects based on the types of apps, their implemented functions, and the cost and charges. Second, the analyses exclusively targeted self-reported data on app use and PA levels. The IPAQ has been validated against accelerometers, but self-reported PA is not always consistent with objectively assessed PA, for example, Cleland et al. 43 Also, apps often collect user-behavior data automatically (eg, which functions are used, when they are used, and how frequently they are used). Analyses of in-app behavior may provide objective and behavioral phenotypes of the appropriation process that cannot be self-reported, although this may have to be limited to particular applications (eg, MyFitnessPal 44 ). Third, generalizability is still a matter in the current study because of the nature of the sample—Japanese-speaking adults. We do not have a clear theory regarding the differences in user behaviors between the East and West, but some participants indicated that they were using apps that were available only in Japan. Some country-specific or cultural differences are likely bound to the apps on the market or even to the cultural norms and policies of countries and regions. For example, some apps can be linked to a Japanese insurance database, which covered users’ health status and prescription information. 45 Medical and insurance information is legally protected in each country, and accessibility may vary across countries depending on the data protection policy. To establish the generalizability of the study findings, analyses at community and societal levels may be warranted to clarify how apps are designed and used across different regions and countries. Fourth, we assessed the functional and symbolic aspects at baseline but not at follow-up, which prevented us from testing the bidirectional relationships between the app-use aspects and outcomes. Distraction, for example, might have a bidirectional effect—the use of distraction functions was found to be associated with decreased levels of PA at follow-up; furthermore, it is possible that decreased levels of PA (or a failure to maintain good levels of PA) demotivate users to engage in PA and makes them procrastinate their workout or to take the easy way out in the app. Fifth, we exclusively assessed the functional and symbolic aspects of app use, although the MPA model highlights other components (ie, metacommunications and evaluations) at play in appropriating mobile technology.17,24,25 Future research, combining quantitative and qualitative approaches, should shed light on these components together with their use aspects, allowing researchers to clarify the dynamic cycle of the appropriation process for PA apps.
Conclusions
Despite these limitations, our findings contribute to the literature on the appropriation of healthcare apps. We based our analyses on the MPA model, which has been applied to research on nutrition and diabetes.17,24 Our results showed that the MPA model is also a meaningful theoretical basis for analyzing user behavior regarding PA apps. Both the functional (particularly lifestyle management) and symbolic aspects (psychological dimensions) were associated with long-term app use at baseline and continued use at the 6-month follow-up. Simultaneously, our findings highlight the importance of considering the degree of appropriation. Distraction and building relationships were associated with discontinued use, and furthermore, distraction led to poorer health outcomes (or lower adherence to the PA guidelines). On-purpose use of an app (ie, using a PA app to improve PA) would be the key feature of the appropriation state, whereas off-purpose use was associated with discontinuation and may be resolved in the process of acquiring a functionalist use style and integrating app use into one’s daily routine. One implication for practice is that developing solid on-purpose functions (eg, strengthening tracking and monitoring features for a PA app) would be a better strategy to maintain users than equipping an app with off-purpose components, such as gamification.46,47 Our findings echo the importance of assessing multifaceted patterns of use beyond the adoption-rejection dichotomy but point to the possibility that some use aspects may not be regarded as active features of the appropriation state. Clarifying the process is important, including how appropriation progresses and ends, and updating the theoretical assumptions to better understand how people adopt and appropriate new mobile technologies will optimize the decision making of app developers and other stakeholders.
Supplemental Material
sj-docx-1-inq-10.1177_00469580261442400 – Supplemental material for Usage Styles of Physical Activity Apps are Associated with Long-Term Activity Levels: A 6-Month Prospective Analysis
Supplemental material, sj-docx-1-inq-10.1177_00469580261442400 for Usage Styles of Physical Activity Apps are Associated with Long-Term Activity Levels: A 6-Month Prospective Analysis by Keisuke Takano, Takeyuki Oba, Kentaro Katahira and Kenta Kimura in INQUIRY: The Journal of Health Care Organization, Provision, and Financing
Supplemental Material
sj-docx-2-inq-10.1177_00469580261442400 – Supplemental material for Usage Styles of Physical Activity Apps are Associated with Long-Term Activity Levels: A 6-Month Prospective Analysis
Supplemental material, sj-docx-2-inq-10.1177_00469580261442400 for Usage Styles of Physical Activity Apps are Associated with Long-Term Activity Levels: A 6-Month Prospective Analysis by Keisuke Takano, Takeyuki Oba, Kentaro Katahira and Kenta Kimura in INQUIRY: The Journal of Health Care Organization, Provision, and Financing
Supplemental Material
sj-docx-3-inq-10.1177_00469580261442400 – Supplemental material for Usage Styles of Physical Activity Apps are Associated with Long-Term Activity Levels: A 6-Month Prospective Analysis
Supplemental material, sj-docx-3-inq-10.1177_00469580261442400 for Usage Styles of Physical Activity Apps are Associated with Long-Term Activity Levels: A 6-Month Prospective Analysis by Keisuke Takano, Takeyuki Oba, Kentaro Katahira and Kenta Kimura in INQUIRY: The Journal of Health Care Organization, Provision, and Financing
Footnotes
Acknowledgements
Ethical Considerations
This study was approved by the Ethics Committee of the National Institute of Advanced Industrial Science and Technology (approval ID: 2022-1279; Date: 23 Jan 2023).
Consent to Participate
All participants provided informed consent online.
Author Contributions
KT: Conceptualization, Data curation, Methodology, and Writing – original draft; OT: Data curation, Formal analysis, and Writing – review & editing; KK and KK: Data curation and Writing – review & editing. All authors read and approved the final manuscript.
Funding
The authors disclosed receipt of the following financial support for the research, authorship, and/or publication of this article: This study was supported by JSPS KAKENHI (23H01051).
Declaration of Conflicting Interests
The authors declared no potential conflicts of interest with respect to the research, authorship, and/or publication of this article.
Data Availability Statement
The dataset analyzed during the current study is not publicly available because we did not obtain consent from participants for placing data on a public registry. However, the data are available from the corresponding author on reasonable request.
Supplemental Material
Supplemental material for this article is available online.
References
Supplementary Material
Please find the following supplemental material available below.
For Open Access articles published under a Creative Commons License, all supplemental material carries the same license as the article it is associated with.
For non-Open Access articles published, all supplemental material carries a non-exclusive license, and permission requests for re-use of supplemental material or any part of supplemental material shall be sent directly to the copyright owner as specified in the copyright notice associated with the article.