
Abstract
Sarcopenia is associated with an elevated burden of depressive symptoms, yet screening tools may have limited accuracy and generalizability in this population. We developed and validated an interpretable machine-learning model to predict depressive symptoms risk among middle-aged and older adults with sarcopenia using National Health and Nutrition Examination Survey (NHANES) 2007-2020 data. In this cross-sectional study, we included 913 participants with sarcopenia aged ≥45 years from NHANES 2007-2020. Candidate predictors were selected using Boruta followed by least absolute shrinkage and selection operator (LASSO). Multiple machine-learning models were developed and internally validated for discrimination, calibration, and clinical utility. Shapley Additive exPlanations (SHAP) were used to support interpretability. Reporting followed the TRIPOD+AI guidance. Nine predictors were retained after Boruta–LASSO selection. In the validation set, the logistic regression model showed the best overall performance (AUC 0.794; Brier score 0.065). SHAP analysis highlighted key contributors including education level, sleep disorder, sex, poverty-income ratio, blood urea nitrogen, osteoarthritis, white blood cell count, absolute lymphocyte count, and body mass index. The final model was presented as a clinically usable nomogram for individualized depressive symptoms risk estimation. We developed a validated, interpretable machine-learning model for predicting depressive symptoms risk in middle-aged and older adults with sarcopenia using NHANES data. The nomogram may facilitate rapid risk stratification and targeted interventions to support risk stratification and targeted supportive care addressing both physical and mental health needs.
Introduction
Sarcopenia is a geriatric syndrome characterized by progressive, generalized loss of skeletal muscle mass, decreased muscle strength, and decline in physical function, representing a common pathological state during the aging process. 1 The core pathophysiological changes involve multiple aspects, including muscle fiber atrophy, reduced muscle quantity, intramuscular fat infiltration, increased fibrosis, imbalance between muscle protein synthesis and catabolism, mitochondrial dysfunction, enhanced oxidative stress, and degeneration of the neuromuscular junction. 2 These changes collectively lead to a progressive loss of muscle physiological function, significant weakening of muscle strength, and a decline in physical activity capacity, ultimately manifesting as a frail state and an increased risk of functional impairment. Epidemiological studies worldwide indicate that the prevalence of sarcopenia shows a significant upward trend with age. It is estimated that approximately 10% to 16% of the elderly population globally is affected by sarcopenia to varying degrees. 3 It is noteworthy that prevalence rates vary across different populations and diagnostic criteria. For instance, a study based on a community-dwelling elderly cohort in the United States (with an average participant age of approximately 70 years) reported a sarcopenia prevalence rate as high as 36.5% according to its adopted diagnostic criteria, highlighting the substantial burden of this syndrome among the elderly population. 4
This high-burden state of physical dysfunction exerts profound impacts on mental health. Mental health management, particularly the early identification and intervention of depressive symptoms, plays a decisive role in maintaining the life autonomy, social integration, and subjective well-being of the elderly population. 5 However, sarcopenia patients face a significantly higher risk of depressive symptoms compared to the general elderly population due to progressive physical functional decline, reduced exercise tolerance, loss of social roles, and anxiety over deteriorating health. Evidence-based medical research indicates that the risk of developing depression or clinically significant depressive symptoms in sarcopenia patients can be 1.32-1.86 times higher than that of their non-sarcopenic peers. 6 Depressive symptoms not only diminish patients’ motivation for rehabilitation exercises and maintaining nutritional intake, accelerating muscle loss and functional deterioration, but also significantly increase the risks of cognitive impairment, cardiovascular events, falls, and fractures, as well as all-cause mortality.7,8 Meanwhile, the social isolation tendency induced by depression and the deterioration of health-related quality of life further exacerbates family caregiving burdens and public health expenditures. 9 The bidirectional association between sarcopenia and depressive symptoms, which may co-occur and potentially reinforce each other, along with their compounded adverse health consequences, has become a major public health challenge to healthy aging in older adults. Therefore, early identification of individuals with sarcopenia who are at high risk of depressive symptoms and prompt intervention are of urgent importance for improving prognosis, enhancing quality of life, and alleviating societal healthcare burdens.
However, the application of existing depression screening tools in populations with sarcopenia has significant limitations. Although current clinical instruments (such as the GDS-15 and PHQ-9 scales) can be used to screen for depressive symptoms in older adults, their use in sarcopenia populations still faces challenges. Traditional screening scales primarily rely on patients’ subjective reports, making them susceptible to disease stigmatization, cognitive biases, overlapping somatic symptoms, and cultural factors, which may result in insufficient screening sensitivity and specificity in this population.10,11 The nomogram constructed based on traditional statistical methods, while capable of providing inevitable visualized risk stratification, is typically built upon specific samples with limited generalizability. Moreover, it lacks real-time and individualized risk interpretation capabilities, making it challenging to meet the clinical demand for rapid and precise decision-making. 12
In contrast to traditional subjective scales, this study utilizes machine learning algorithms for risk prediction. Machine learning demonstrates significant advantages in processing high-dimensional, heterogeneous data, effectively integrating multidimensional features, including demographic characteristics, lifestyle and behavioral factors, anthropometric parameters, nutritional intake data, clinical disease status, and laboratory test indicators. By identifying complex nonlinear relationships and higher-order interactions among variables, machine learning algorithms significantly enhance the prediction accuracy of depressive symptoms risk in patients with sarcopenia. 13 The core innovation lies in integrating explainable artificial intelligence techniques—particularly SHapley Additive exPlanations (SHAP). SHAP provides quantitative feature contribution analysis for individualized predictions, clarifying the relative impact weights of specific factors on the target patient’s risk of depression. This explainability safeguard mechanism enhances the clinical credibility and operability of model outputs, offering a theoretical foundation for individualized risk assessment and precise decision support. 14
Therefore, this study aims to utilize multi-source data on sarcopenia patients from the National Health and Nutrition Examination Survey (NHANES) database to construct and validate a risk prediction model for depressive symptoms based on multiple machine learning algorithms. Through rigorous model comparison and evaluation, the optimal predictive model will be selected. The study will further employ methods such as SHAP to analyze the key predictive factors and their operational patterns in the optimal model, revealing the bio-psycho-social factors influencing depression risk in sarcopenia patients. The ultimate goal is to establish a precise and interpretable risk prediction tool for efficiently identifying high-risk individuals with depressive symptoms among sarcopenia patients. Enabling early warning and risk stratification will provide clinicians with decision-making support to promptly initiate targeted psychological interventions, social support, or comprehensive management plans. This approach will contribute to effectively preventing or mitigating the onset and progression of depressive symptoms, improving the mental health outcomes and overall quality of life for sarcopenia patients, and ultimately reducing their risk of adverse health events and associated socioeconomic burdens.
Materials and Methods
Study Design and Data Source
This study employed a cross-sectional research design, aiming to conduct diagnostic prediction of depressive symptoms in middle-aged and elderly patients with sarcopenia based on data from 6 interlinked burdens (2007-2020) of the NHANES. All 6 interlinked burdens of data contained the required demographic, dietary, physical examination, laboratory, and questionnaire data for this study, meeting the variable selection criteria of the research.
The NHANES, conducted by the National Centre for Health Statistics (NCHS) of the Centres for Disease Control and Prevention (CDC), is a nationally representative, cross-sectional surveillance program designed to assess the health and nutritional status of the civilian, noninstitutionalized U.S. population. It employed a complex, stratified, multistage probability sampling design to ensure representativeness. Data collection involves detailed household interviews, comprehensive standardized physical examinations, and laboratory testing conducted in Mobile Examination Centres. NHANES provided critical data on a wide range of health indicators, including the prevalence of chronic and infectious diseases, nutrition biomarkers, anthropometric measurements, environmental exposures, and risk behaviors. Released in publicly accessible, biennial data interlinked burdens, NHANES served as a foundational resource for epidemiological research, health trend monitoring, and informing public health policy in the United States. Study data were available through the official NHANES repository hosted by the NCHS: https://wwwn.cdc.gov/nchs/nhanes/default.aspx. 15
Participants
The study population consisted of patients with sarcopenia. Previous studies have established dual-energy X-ray absorptiometry and bioelectrical impedance analysis as the gold standard methods for diagnosing and assessing sarcopenia. However, their practical application was limited by accessibility and operational convenience. To address this issue, some scholars have developed and validated a predictive equation for estimating appendicular skeletal muscle mass based on NHANES data. 16 The study indicated that compared to equations incorporating serological indicators, this simplified equation without serological markers was ASM = 0.485 × 0.9998age × 0.814[female] × 1.006height × weight0.680. Although it exhibited slightly lower accuracy in estimating ASM, the difference between the 2 was minimal. Based on the diagnostic criteria for sarcopenia established by the Foundation for the National Institutes of Health (FNIH), this study employed the ratio of ASM to body mass index (BMI) (ASM/BMI) for diagnosis: males with ASM/BMI < 0.789 kg/(kg/m2) and females with ASM/BMI < 0.512 kg/(kg/m2) were defined as having sarcopenia. 17 The inclusion criteria for this study were participants aged ≥45 years who met the diagnostic criteria for middle-aged and elderly sarcopenia as defined by the FNIH. 18 The exclusion criteria were: (1) missing PHQ-9 data, including participants who did not complete the relevant interview items; and (2) missing data in candidate predictors required for model development. We did not apply additional exclusions based on antidepressant use or treatments that may affect muscle mass, such as long-term systemic corticosteroid therapy, and medication exposures were not incorporated as predictors. The sample screening process was shown in Figure 1.
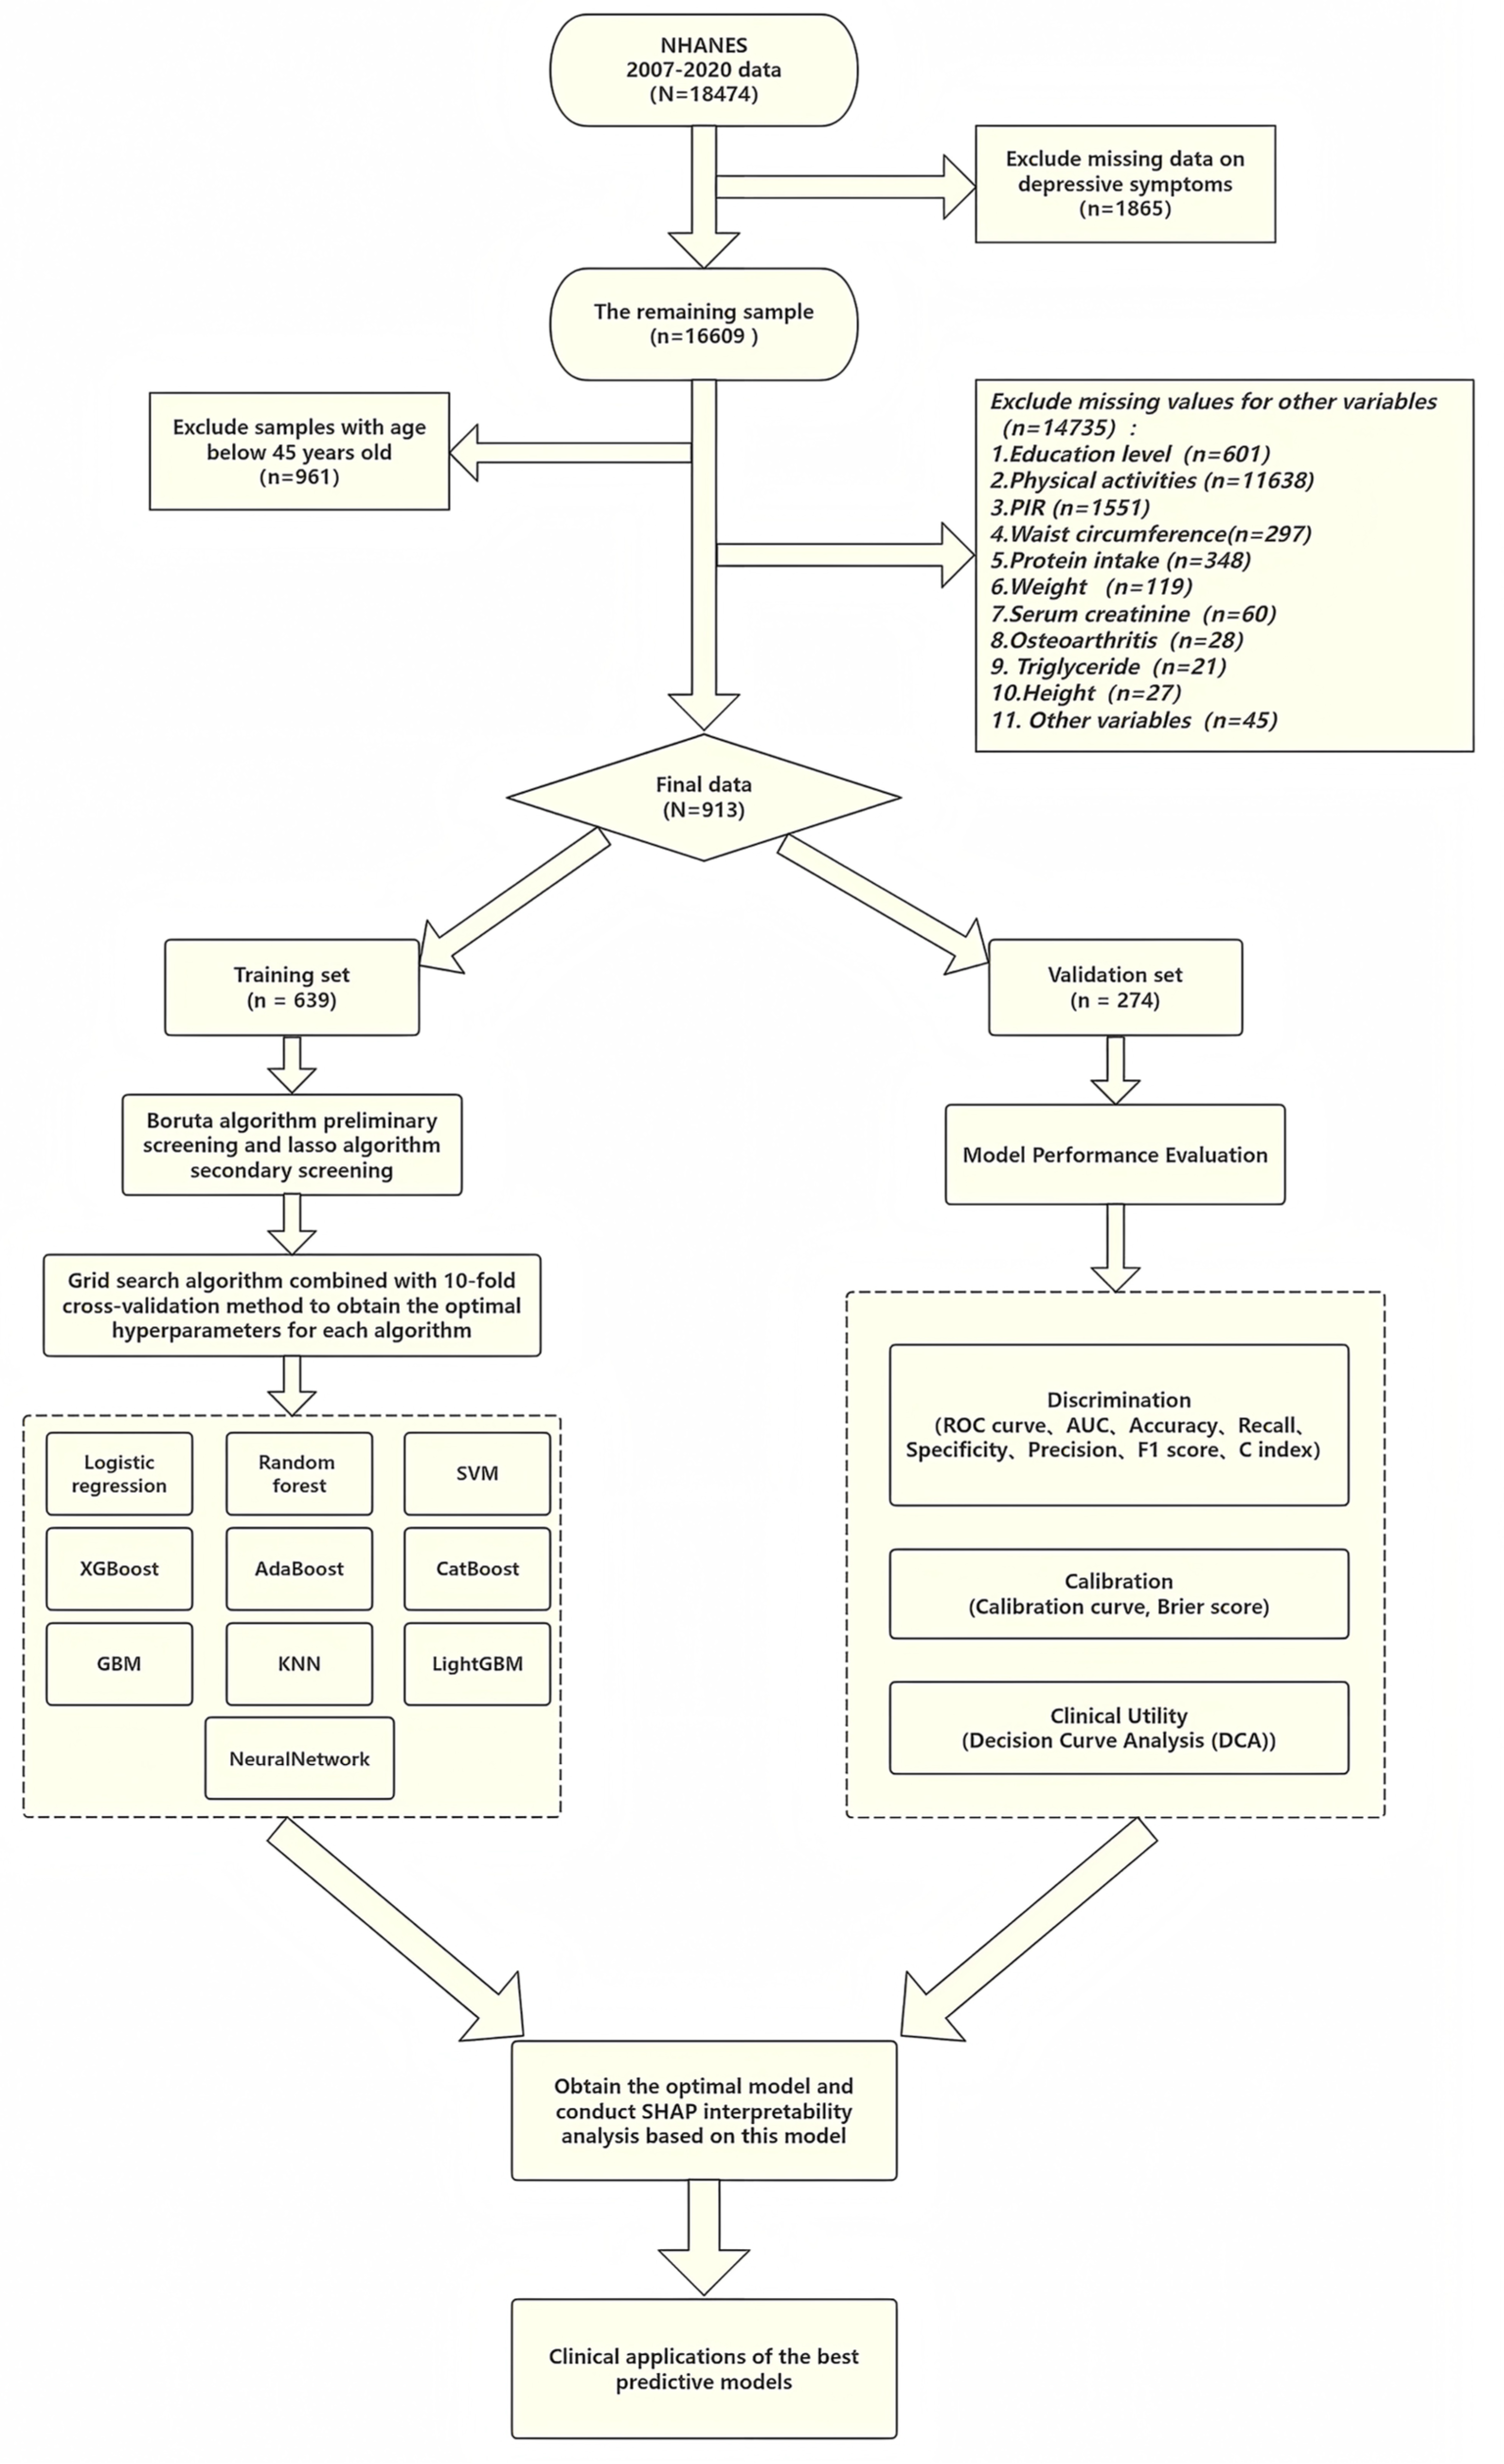
Sample screening and statistical analysis process framework diagram.
Sample Size
The sample size estimation was conducted based on the Events Per Variable (EPV) criterion. 19 This criterion recommends that each predictor variable ultimately included in the model should correspond to at least 10 outcome events to ensure robust parameter estimation. Preliminary planning indicated that the final model might incorporate 8 to 10 predictors; for a conservative estimate, we used the median value of 9 for calculation. Based on existing epidemiological evidence, the prevalence of clinically relevant depressive symptoms among middle-aged and older adults aged with sarcopenia is approximately 15.82%. 20 Accordingly, the EPV threshold was set at 10, and allowing for an anticipated invalid/missing response rate of ~10%, the minimum required sample size for model development was calculated as: 10 × 9 ÷ 0.1582 ÷ 0.9 ≈ 632. Given that we planned a 7:3 split for model development and internal validation, the total required sample size was therefore at least 632 ÷ 0.7 ≈ 903. In the present study, 913 eligible participants were included and were stratified into a training set (n = 639) and a validation set (n = 274), ensuring that the training set exceeded the EPV-based minimum.
Outcome Variable
The Patient Health Questionnaire-9 (PHQ-9) scale was initially developed in 1999 by American psychiatrist Spitzer et al, based on the Diagnostic and Statistical Manual of Mental Disorders, fourth Edition, and is a commonly used self-assessment tool for depression.21,22 The original author designed the scale as a universal tool intended for public use (please refer to https://www.phqscreeners.com/ for details). The PHQ-9 contained 9 questions, each with 4 answer options corresponding to a score of 0 to 3, with a total score ranging from 0 to 27. 23 According to the research criteria, sarcopenia patients with a PHQ-9 total score ≥10 were considered to have depressive symptoms. 24
Predictor Variables
The predictor variables involved in this study can be categorized as follows: demographic variables include age, gender, race, marital status, education level, and Poverty Income Ratio (PIR). Lifestyle and behavioral variables include alcohol consumption, smoking, physical activity, sedentary behavior, sleep duration, and sleep disorder. Anthropometric indicators include weight, height, body mass index (BMI), and waist circumference. Dietary and nutritional variables include protein intake and vitamin D intake. Clinical disease variables include hypertension, diabetes, osteoarthritis, cardiovascular disease (CVD), and stroke. Laboratory test indicators include renal function, blood lipids, inflammation-related markers (serum creatinine, blood urea nitrogen, uric acid, serum calcium, serum phosphorus, total cholesterol, triglyceride, white blood cell count, absolute lymphocyte count, monocyte, and neutrophil count). Detailed definition criteria for each predictor variable were shown in Supplemental Materials 1.
Statistical Analysis and Feature Screening
All statistical analyses were performed using R software (version 4.4.3). Normally distributed continuous variables were expressed as mean ± standard deviation (SD), non-normally distributed continuous variables as M (Q1, Q3), and categorical variables as number (%). Univariate analyses employed the chi-square test, independent samples t-test, and Mann-Whitney test, with a 2-sided significance level set at P < .05.
This study employed a stratified random sampling method to divide the dataset into training and validation sets at a ratio of 7:3. The training set was used for feature selection and model construction. During the feature selection phase, the Boruta algorithm based on random forests was first applied for preliminary screening. This algorithm identifies statistically significant and relevant features by comparing the importance scores of original features with those of randomly generated shadow variables. Subsequently, the Least Absolute Shrinkage and Selection Operator (LASSO) regression were used for the secondary selection of the screened features. By introducing an L1 regularization penalty term, LASSO compresses the regression coefficients of redundant features to zero, thereby achieving dimensionality reduction in the feature space, and mitigating overfitting risks. The optimal regularization parameter λ was ultimately determined through 10-fold cross-validation to obtain the final predictive variables.
Model Development
This study was based on the final screened predictive variables, employing a 10-fold cross-validated grid search method to optimize the hyperparameters of 9 machine learning algorithms—specifically AdaBoost, CatBoost, Gradient Boosting Machine (GBM), K-Nearest Neighbor (KNN), LightGBM, NeuralNetwork (NN), Random forest (RF), Support Vector Machine (SVM), and XGBoost—excluding the logistic regression model, aiming to achieve optimal model performance and mitigate the risk of overfitting.
Model Evaluation and Interpretability
This study evaluated model performance using validation set data through a comprehensive analysis of 3 dimensions: discrimination, calibration, and clinical utility. For discrimination assessment, the area under the receiver operating characteristic curve (AUC, ranging from 0.5 to 1) and the C-index (ranging from 0.5 to 1) were adopted as primary metrics, supplemented by accuracy, recall, specificity, precision, and the F1 score (all ranging from 0 to 1) for comprehensive evaluation. Values closer to 1 for these metrics indicated stronger model discrimination capability. Calibration assessment was conducted using calibration curves and the Brier score (ranging from 0 to 1), where calibration curves visually demonstrated the agreement between predicted probabilities and observed frequencies. In contrast, the Brier score quantitatively reflected the accuracy of predicted probabilities, with lower scores indicating better calibration. Clinical utility was evaluated using decision curve analysis (DCA), which calculated the net clinical benefit at varying decision thresholds to assess the model’s clinical application value. When the model’s decision curve lay above the “intervene for all” and “intervene for none” reference lines, it indicated that the model could effectively enhance clinical decision-making benefits. Based on the results of this multi-dimensional comprehensive evaluation, the optimal predictive model was ultimately determined.
To enhance model interpretability, this study employed the SHAP method, based on game theory, to analyze the optimal algorithm model. This approach quantified feature contributions to prediction outcomes by calculating Shapley values from 2 aspects. First, it identified key predictive features at the global level and explained individual sample predictions at the local level. Second, it ensured mathematical rigor in feature contribution allocation based on game-theoretic axioms. Third, it demonstrated broad model compatibility, applicable to various algorithms, including tree models, linear models, and deep learning models. Finally, it provided intuitive visualizations of feature influence direction and magnitude. The results demonstrated that SHAP analysis not only effectively improves model transparency by revealing the relationship between features and prediction outcomes but also provides a reliable theoretical foundation for model optimization and clinical applications.
TRIPOD+AI (EQUATOR) Reporting Guideline
This study followed the TRIPOD+AI reporting guideline (Transparent Reporting of a multivariable prediction model for Individual Prognosis or Diagnosis – AI extension), an EQUATOR Network reporting guideline for prediction model development and validation using regression or machine learning methods, to ensure transparent and comprehensive reporting throughout model development, internal validation, performance evaluation, and interpretation. 25 The completed TRIPOD + AI checklist is provided as Supplemental Figure S1.
Results
Baseline Characteristics
This study ultimately included 913 patients who met the criteria. Using the random number generator in R software (version 4.4.3) with a random seed set to 1234, the subjects were randomly allocated to the training set (n = 639) and the validation set (n = 274) in a 7:3 ratio. Baseline characteristic analysis revealed that, except for sedentary behavior, which showed a statistically significant difference between the groups (P < .05), all other variables were evenly distributed (Table 1), indicating that the randomization scheme was generally effective.
Comparison of Baseline Data Between Training Set and Validation Set.
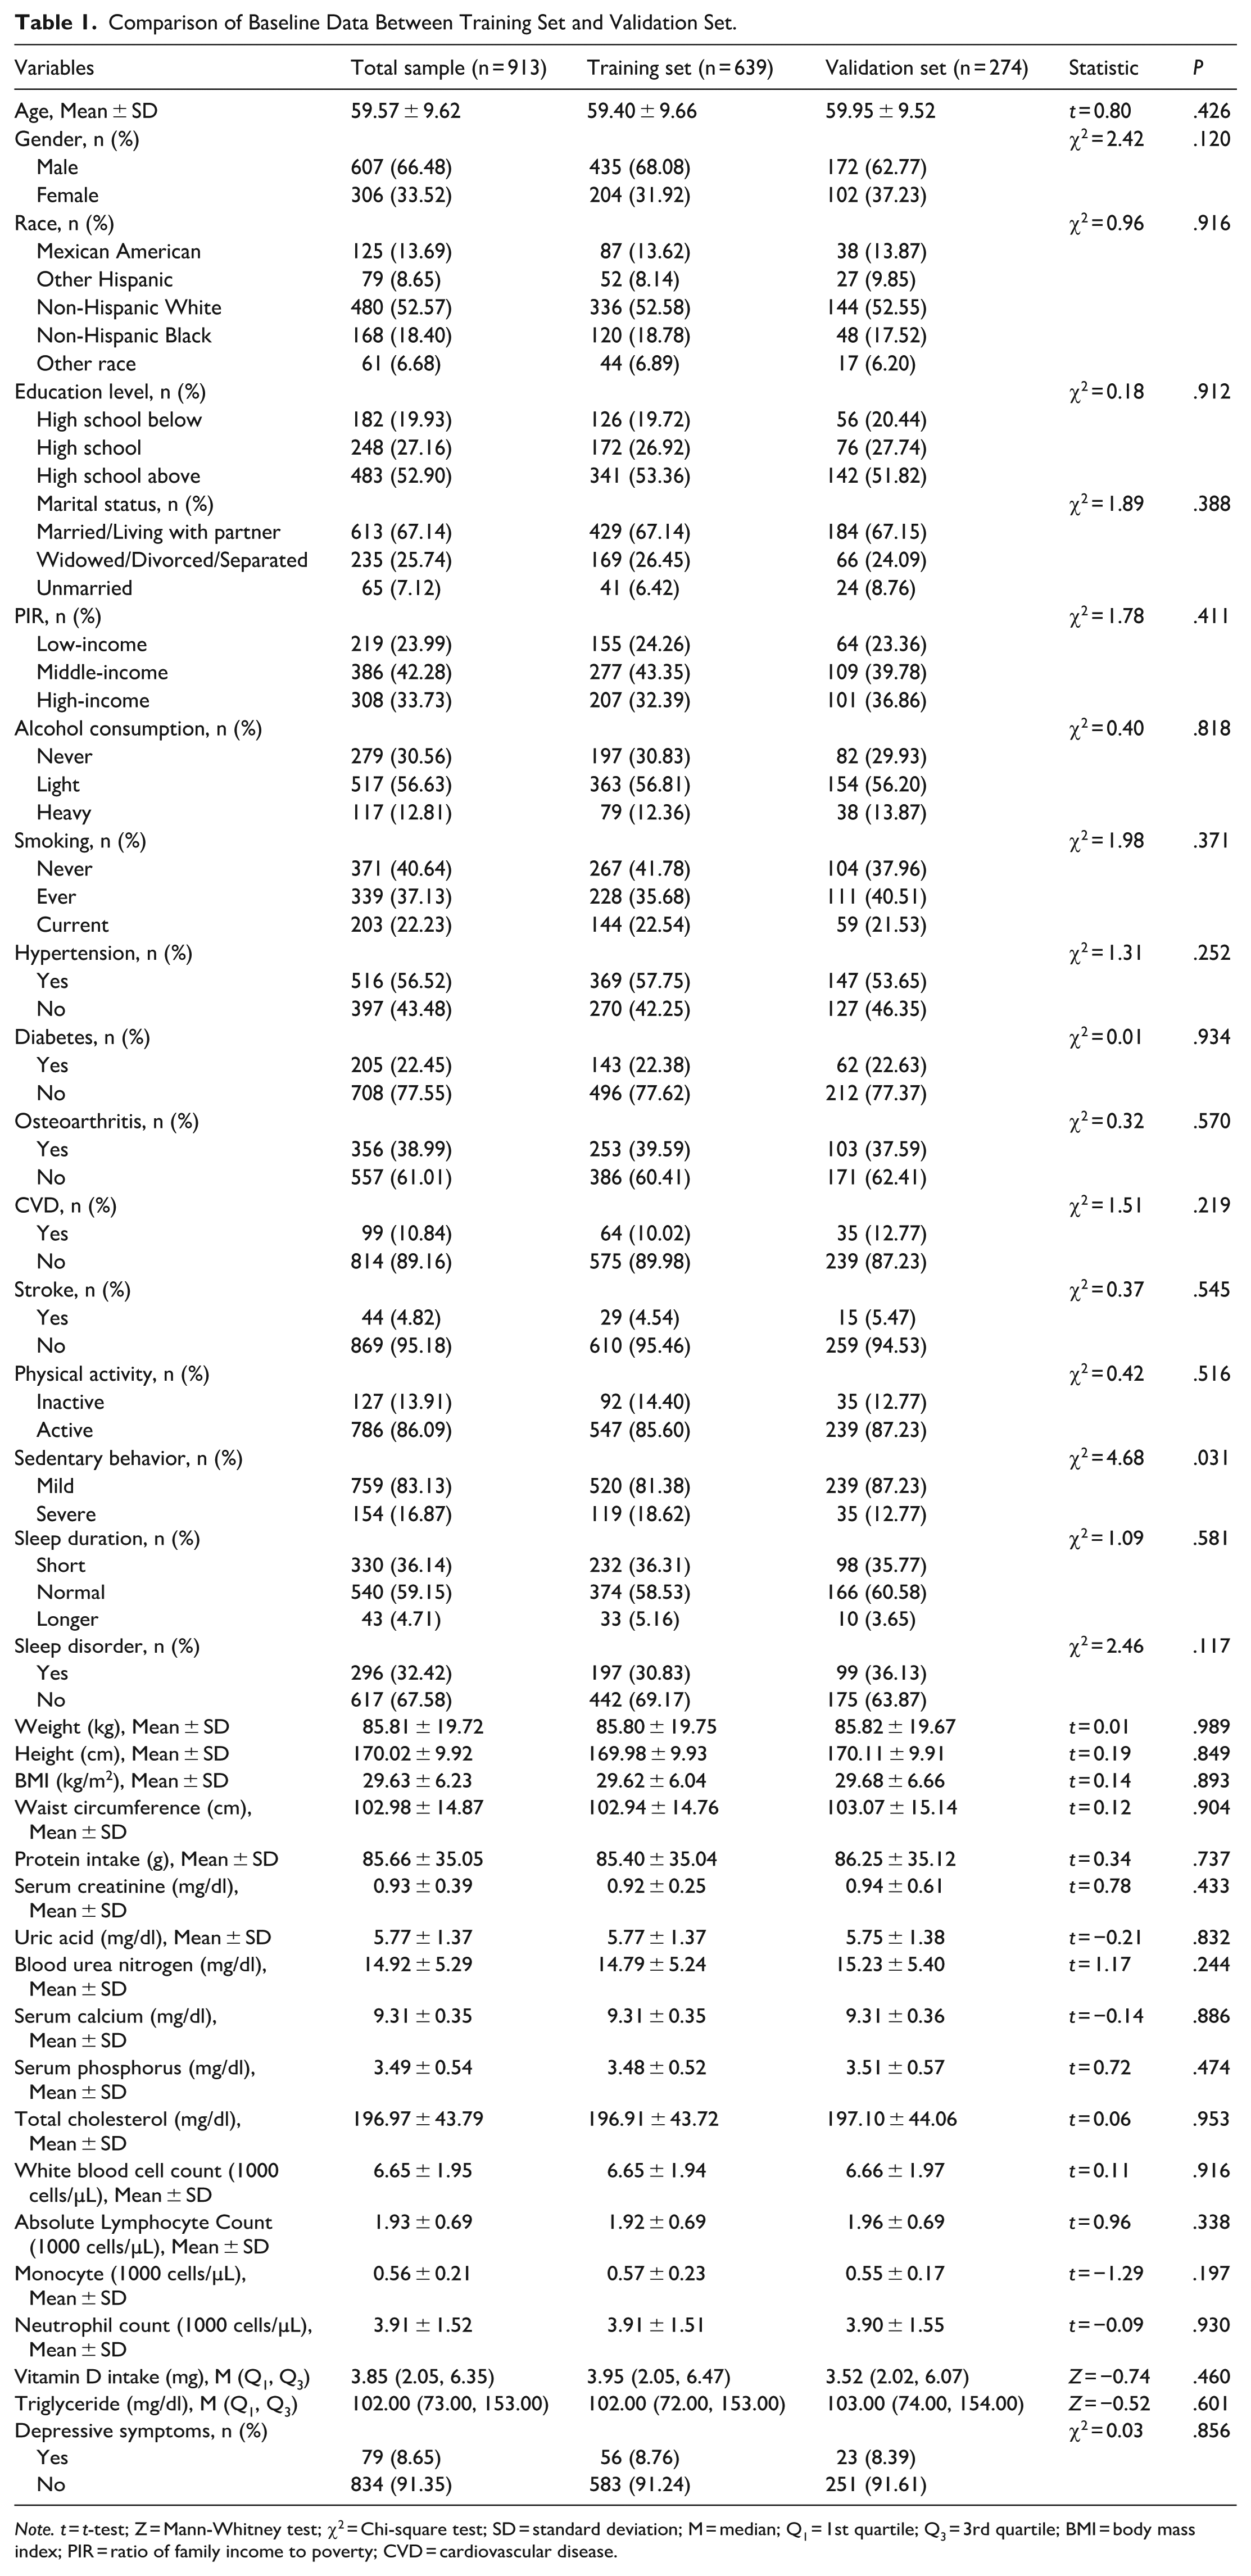
Note. t = t-test; Z = Mann-Whitney test; χ2 = Chi-square test; SD = standard deviation; M = median; Q1 = 1st quartile; Q3 = 3rd quartile; BMI = body mass index; PIR = ratio of family income to poverty; CVD = cardiovascular disease.
Among the 639 sarcopenia patients in the training set, 56 cases (8.76%) were in the depressive symptoms group. Compared with the non-depressive symptoms group, the depressive symptoms group exhibited the following characteristics: (1) Demographic aspects: significantly higher proportions of females (53.57% vs 29.85%; P < .001), low education level (below high school: 35.71% vs 18.18%; P = .003), and low income (poverty income ratio ≤1.0: 44.64% vs 22.30%; P < .001); (2) Clinical features: significantly higher prevalence of hypertension (80.36% vs 55.57%; P < .001), osteoarthritis (60.71% vs 37.56%; P < .001), and sleep disorders (60.71% vs 27.96%; P < .001); (3) Laboratory indicators: lower average height (167.11 ± 9.76 cm vs 170.25 ± 9.92 cm; P = .024) and higher lymphocyte count (2.12 ± 0.67 vs 1.90 ± 0.69; P = .020). No significant differences were observed between the 2 groups in terms of ethnicity, marital status, and cardiovascular diseases (all P > .05; see Table 2).
Distribution of Baseline Data in the Training Set.

Note. t = t-test; Z = Mann-Whitney test; χ2 = Chi-square test; SD = standard deviation; M = median; Q1 = 1st quartile; Q3 = 3rd quartile; BMI = body mass index; PIR = ratio of family income to poverty; CVD = cardiovascular disease.
Predictive Variable Screening
The training set was used for feature selection and model construction through a 2-step process. First, the Boruta algorithm, a random forest-based method, performed initial screening by comparing feature importance against shadow variables, retaining 14 potential predictors, including gender, race, education level, sleep disorder, PIR, osteoarthritis, weight, height, BMI, waist circumference, blood urea nitrogen, white blood cell count, absolute lymphocyte count and neutrophil count. Subsequently, LASSO regression with L1 regularization was applied for secondary selection, with the optimal regularization parameter (λ.min = 0.006674245) determined via 10-fold cross-validation to minimize prediction error while maintaining model parsimony. This final step identified 9 key predictive features: education level, sleep disorder, gender, PIR, blood urea nitrogen, osteoarthritis, white blood cell count, absolute lymphocyte count, and BMI. The selection process, illustrated in Figure 2, demonstrates a rigorous methodology for optimizing feature space while controlling overfitting.

Feature selection workflow: (A) initial feature screening using the Boruta algorithm, (B) secondary feature selection using the LASSO algorithm (binomial deviance vs log(λ)); dotted vertical lines indicate λ.min and λ.1se, and (C) 9 predictors with non-zero coefficients at λ.min were retained for model development, providing a parsimonious set of clinically available variables.
Model Construction and Performance Evaluation
Through the 10-fold cross-validation grid search method with resampling settings, this study obtained the optimal hyperparameters for 9 machine learning algorithms (excluding the logistic regression model). The optimal hyperparameter settings for each algorithm were as follows: AdaBoost (number of iterations mfinal = 2, maximum tree depth maxdepth = 2), CatBoost (number of trees tree_count = 3, learning rate learning_rate = 0.03, number of features feature_count = 7), GBM (number of trees n.trees = 100, interaction depth interaction.depth = 2, shrinkage rate shrinkage = 0.01, minimum number of observations n.minobsinnode = 5), KNN (number of nearest neighbors kmax = 14, distance metric distance = 1), LightGBM (minimum data min_data = 1, learning rate learning_rate = 1, number of threads num_threads = 2, verbosity level verbosity = 1, number of iterations num_iterations = 5, early stopping rounds early_stopping_round = 3), NN (number of hidden layer nodes size = 5, weight decay decay = 0.6), RF (number of candidate features per split mtry = 2), SVM (kernel parameter Sigma = 0.1, regularization parameter C = 0.5), XGBoost (number of iterations nrounds = 10, maximum tree depth max_depth = 4, learning rate eta = 0.1, minimum loss reduction gamma = 0.5, feature sampling ratio colsample_bytree = 0.5, minimum child weight min_child_weight = 1, sample sampling ratio subsample = 0.6). Subsequently, this study constructed risk prediction models based on the optimal hyperparameters of the aforementioned machine learning algorithms, respectively. Detailed parameter settings can be found in Supplemental Materials 2.
This study evaluated the performance of risk prediction models constructed using 10 machine learning algorithms. The discriminative ability of the models was primarily assessed through AUC and the concordance index (C-index) on the test set, with the following results: LR (0.794), SVM (0.695), GBM (0.766), NN (0.789), RF (0.736), XGBoost (0.743), KNN (0.695), Adaboost (0.644), LightGBM (0.531, 0.529), and CatBoost (0.773). Further examination of confusion matrix metrics (accuracy, specificity, precision, and F1 score) revealed that the LR model outperformed other models in terms of comprehensive discriminative performance (ROC curves for each model are shown in Figure 3A and B, and detailed metrics are provided in Table 3). Given the relatively limited impact of discriminative ability on model prediction comparisons, this study further evaluated the calibration performance of the models using calibration curves and the Brier score (calibration curves for each model are shown in Figure 3C and D, and Brier scores are provided in Table 3). The calibration curves were generated by binning samples based on predicted risk and comparing the mean predicted risk in each bin with the observed actual event rate. Points in the plot represent the actual event rates for each risk bin, connected by line segments. Under ideal conditions (perfect calibration), all points should lie on the 45° diagonal reference line, indicating that predicted risks align with actual risks. The results showed that LR and NN predictions were the most accurate, with most points closely adhering to the reference line except for the highest-risk bin, demonstrating minimal overall deviation and excellent calibration performance. The Brier score evaluation also indicated that LR and NN predictions were superior to those of other models.
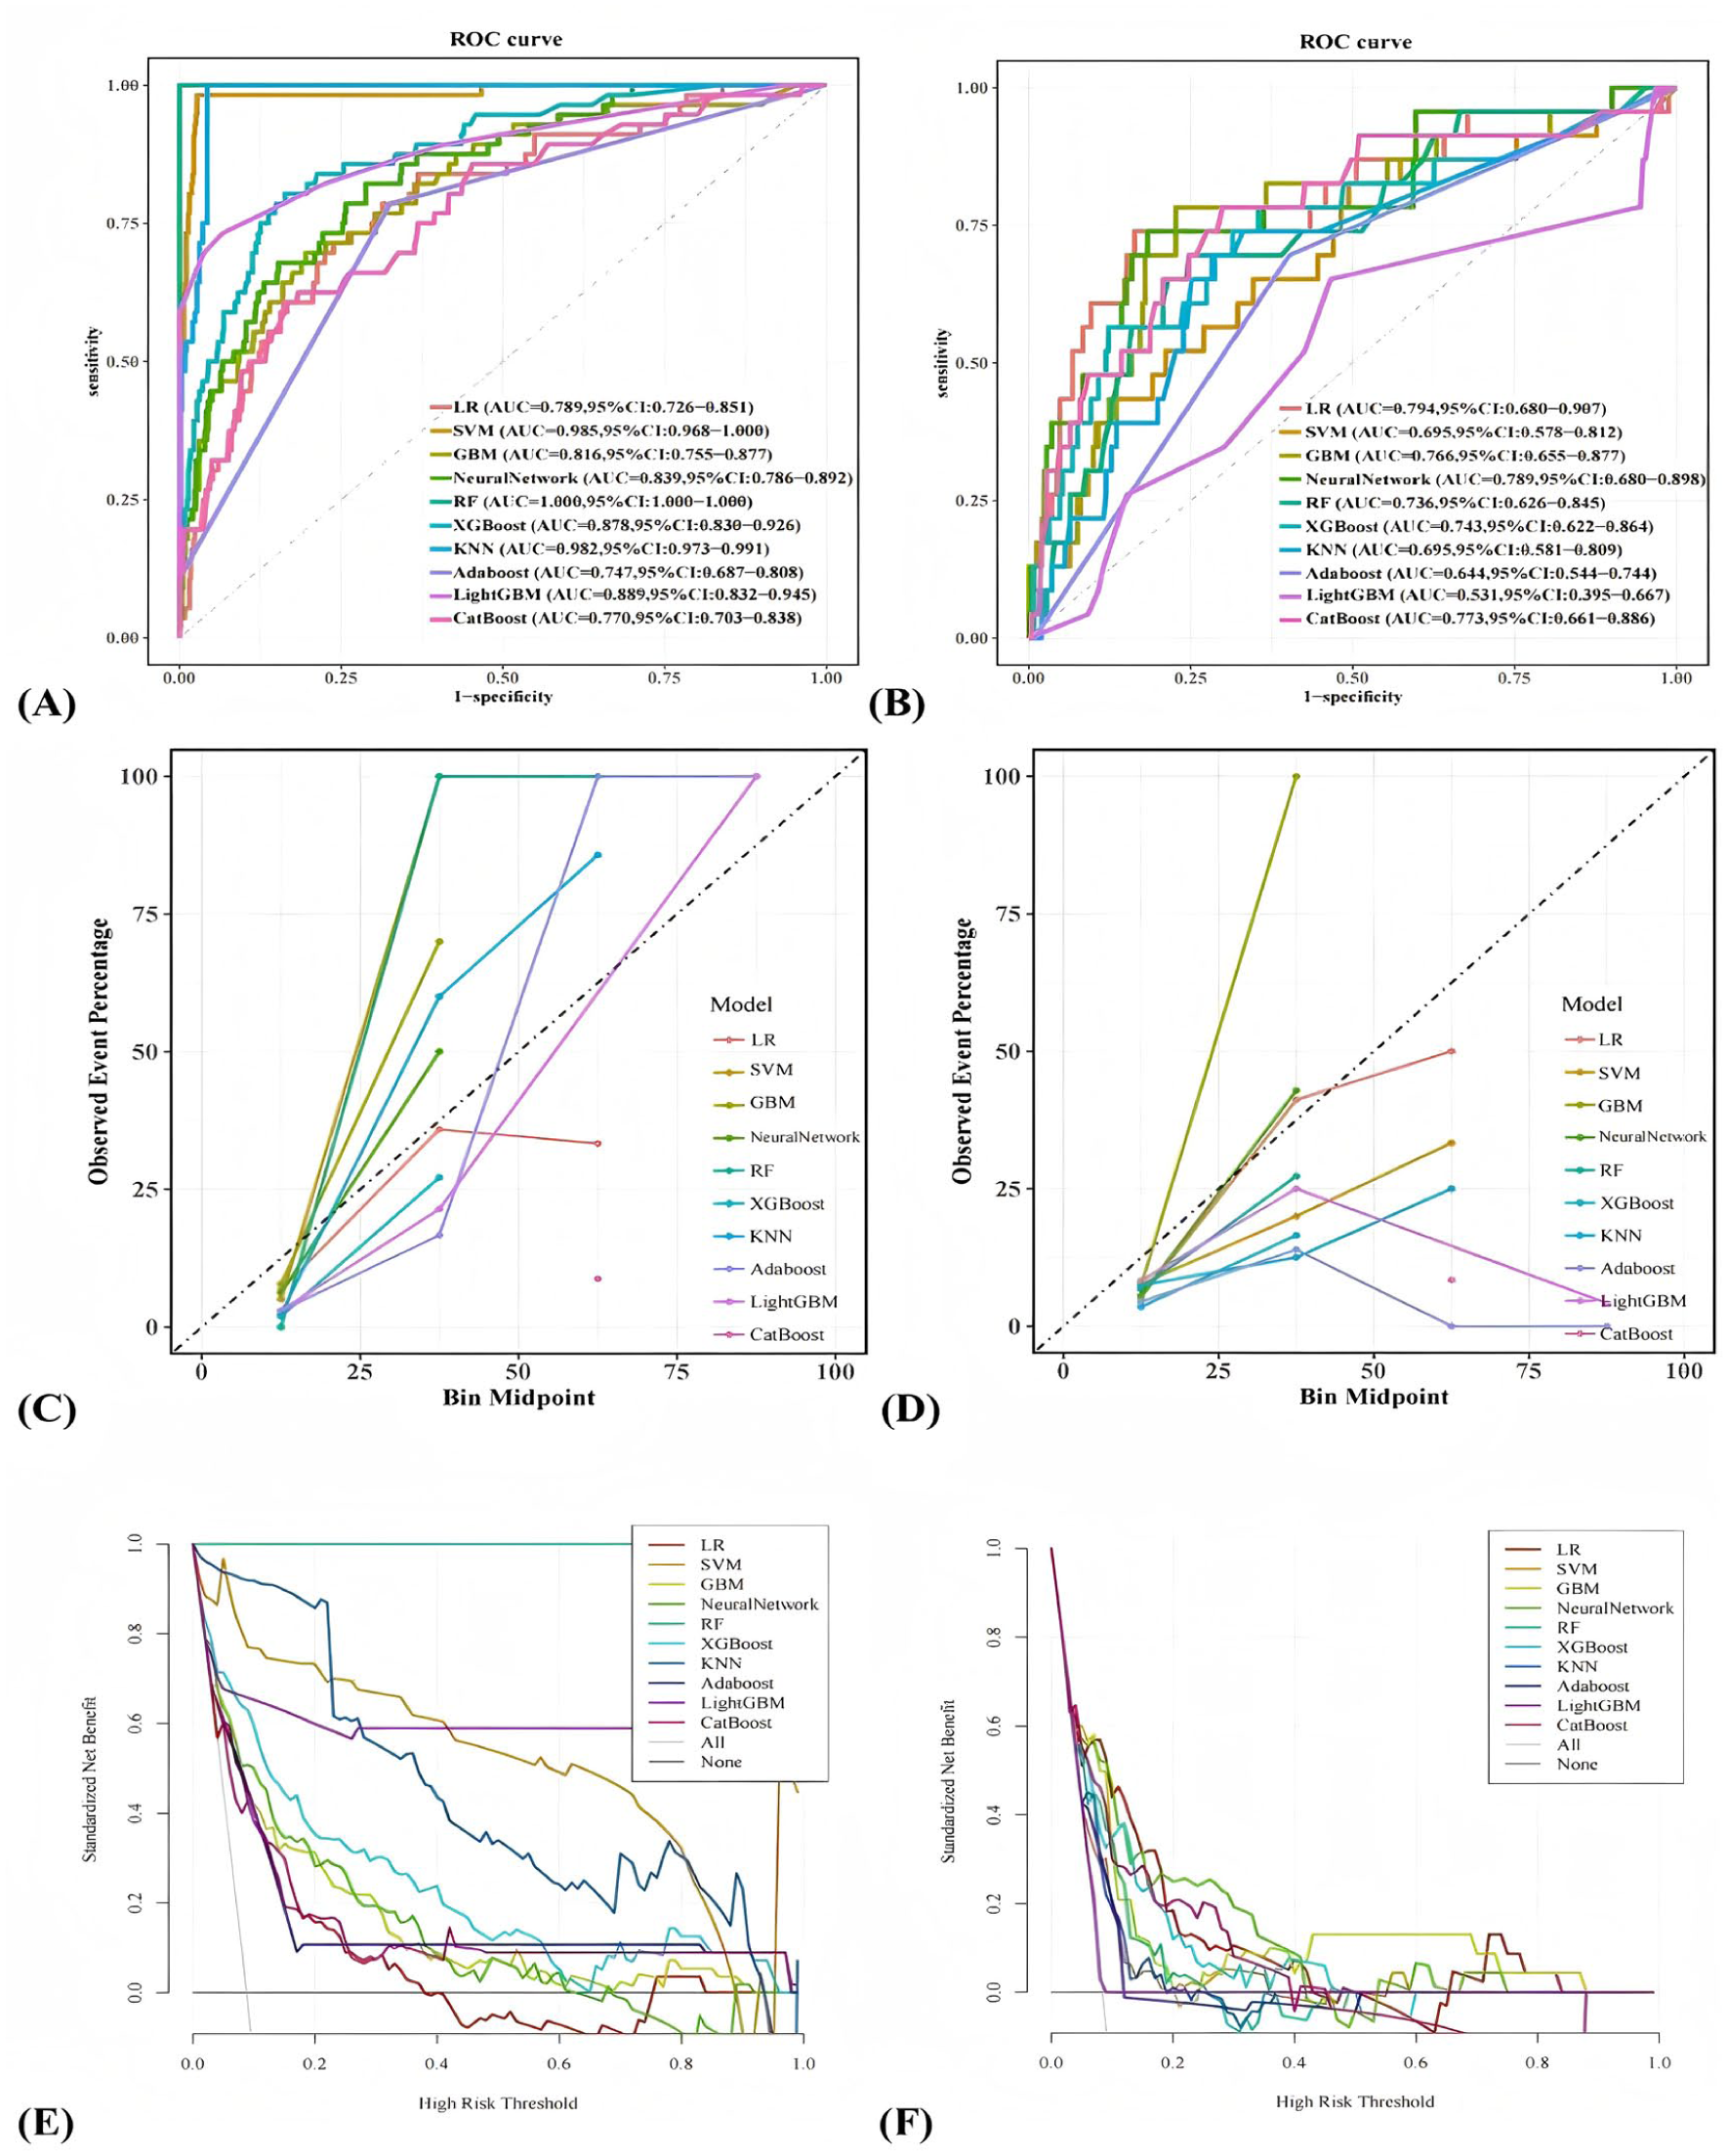
Comparison of model performance across 10 algorithms: (A and B) ROC curves in the training and validation sets illustrate discrimination and highlight potential overfitting when training performance does not generalize, (C and D) Calibration curves evaluate agreement between predicted and observed risks, which is essential for clinical risk communication, and (E and F) Decision curve analysis (DCA) summarizes net benefit across threshold probabilities and links model output to potential clinical decision-making. Clinical implication: Net benefit across clinically plausible thresholds suggests the model may help guide decisions about whom to screen and refer, while thresholds should be tailored to local resources and care pathways.
Performance Comparison Results of 10 Machine Learning Models.

Note. Train = training set; Valid = validation set; LR = logistic regression; SVM = support vector machine; GBM = Gradient Boosting Machine; NN = Neural Network; RF = random forest; XGBoost = eXtreme Gradient Boosting; KNN = K-Nearest Neighbor; Adaboost = Adaptive Boosting; LightGBM = Light Gradient Boosting Machine; CatBoost = Categorical Boosting.
Additionally, the clinical utility of the models was assessed through DCA (Figure 3E and F). The DCA curves plotted threshold probability (ie, the minimum predicted risk probability for considering intervention) on the x-axis and net benefit values based on model decisions on the y-axis. Except for the threshold probability range of .42 to .63, the LR model exhibited significantly higher net benefits than the “no intervention” and “full intervention” baseline lines across all other threshold probabilities, outperforming other models, and indicating superior clinical applicability within this range. The closer or higher the DCA curve is to the baseline, the more significant the model’s effect on optimizing clinical decisions. Based on a comprehensive evaluation of all performance metrics, the LR model demonstrated the best overall performance, combining excellent calibration and clinical utility, and thus proved to be the most suitable predictive model in this study.
Model Interpretability
To thoroughly interpret the results of the LR model, this study employed the SHAP method for visual analysis, with the outcomes displayed in Figure 4. Figure 4D presents the SHAP feature importance ranking of the LR model. The analysis reveals that education level, sleep disorder, gender, PIR, blood urea nitrogen, osteoarthritis, white blood cell count, absolute lymphocyte count, and BMI are the 9 key features influencing depressive symptoms in middle-aged and elderly sarcopenia patients. Among these, education level, sleep disorder, gender, PIR, blood urea nitrogen, and osteoarthritis are the 6 most predictive features.

Additional SHAP visualizations for the logistic regression model: (A) Beeswarm plot of SHAP values ranked by mean absolute importance, (B) SHAP waterfall plot illustrating how each feature shifts the prediction for an individual participant, (C) SHAP force plot showing feature contributions for a representative participant, and (D) Global feature importance ranking based on mean absolute SHAP values. Clinical interpretation: SHAP highlights which routinely available features most strongly drive predicted risk, supporting targeted screening and modifiable risk-factor management alongside rehabilitation.
As shown in Figure 4A, the SHAP beeswarm plot summarizes the distribution of SHAP values for each predictor across participants, thereby illustrating both the direction and magnitude of each predictor’s contribution to depressive symptoms risk. This visualization improves clinical interpretability by linking routinely measured features to individualized risk estimates.
Additionally, this study utilized SHAP waterfall plots (Figure 4B) and force plots (Figure 4C) to illustrate the relationship between individual sample features and their risk of depressive symptoms. In the plots, purple denotes lower feature values, and yellow denotes higher feature values, visually reflecting the direction and magnitude of each feature’s contribution to the model’s prediction for specific samples.
Taking the example patient, in the figure: This male sarcopenia patient has no sleep disorder, possesses a high school or higher education level, a low poverty-income ratio, and test indicators showing a white blood cell count of 6.1 × 1000 cells/µL, a BMI of 27.2 kg/m2, a blood urea nitrogen level of 13 mg/dL, an absolute lymphocyte count of 2.3 × 1000 cells/µL, and osteoarthritis. Based on the model’s prediction, this patient has approximately a 2.19% probability of developing depressive symptoms.
Clinical Applications of Predictive Models
To facilitate the routine clinical implementation of the optimal logistic regression model, we translated it into a nomogram (Figure 5). By aligning each patient’s values for the 9 predictors on the nomogram, clinicians can derive an individualized predicted probability of depressive symptoms. In clinical practice, a higher predicted risk may be used to prioritize confirmatory assessment, such as administration of PHQ-9, and to prompt referral for mental health evaluation or psychosocial support within an integrated sarcopenia management pathway.

Nomogram for predicting the probability of depressive symptoms in middle-aged and elderly patients with sarcopenia. Clinical use: This nomogram is intended as a screening-support tool to prioritize confirmatory symptoms assessment, such as the PHQ-9, and appropriate referral or psychosocial/behavioral intervention when predicted risk is elevated.
Discussion
Depressive symptoms are common among middle-aged and older adults with sarcopenia and may complicate rehabilitation and long-term functional outcomes. In our training set, 56 of 639 participants (8.76%) met the criterion for clinically relevant depressive symptoms, which falls within the range reported in cross-sectional studies of sarcopenia (8.09%-40%). 26 Importantly, depressive symptoms can reduce adherence to medical and behavioral treatment plans, including exercise-based rehabilitation, and may thereby worsen disability and downstream healthcare burden.27 -29 Therefore, early identification of depressive symptoms in sarcopenia is clinically meaningful as part of integrated care aimed at preserving health-related quality of life and functional well-being.30,31 We developed and internally validated prediction models using 10 machine-learning algorithms, and logistic regression demonstrated the best overall performance in the validation set (AUC 0.794; Brier score 0.065). Feature selection combining Boruta and LASSO identified 9 key predictors, and SHAP analysis provided transparent, patient-level interpretability, supporting clinical trust, and mechanistic hypothesis generation.32,33 Collectively, these findings indicate that an interpretable and well-calibrated model can serve as a screening-support tool to flag individuals who may benefit from confirmatory assessment and timely psychosocial or behavioral interventions before advanced depression develops. 34 Importantly, because NHANES is cross-sectional, the model output should be interpreted as a risk marker for concurrent depressive symptoms burden rather than a causal pathway, and the temporal sequence between sarcopenia and depressive symptoms cannot be determined.
Previously known: Sarcopenia is associated with a higher burden of depressive symptoms and functional decline.
What this study adds: An interpretable, internally validated logistic regression-based nomogram to predict depressive symptoms risk in middle-aged and older adults with sarcopenia using NHANES 2007-2020.
What to do next: Use the nomogram as a screening -support aid to prioritize confirmatory assessment and integrated physical–mental health interventions, particularly in socially vulnerable subgroups.
This study confirms that educational level is a core predictor of depressive symptoms in middle-aged and elderly patients with sarcopenia. Specifically, the lower the educational level, the higher the risk of depression, which is consistent with the conclusions of research on the depressive trajectory in sarcopenia patients. 35 The research findings of scholars such as Li et al also demonstrate a negative correlation between educational attainment and depressive symptoms. 36 Educational attainment modulates depression symptoms risk through biological-psychological-social multifactorial pathways. At the biological level, higher educational attainment enhances cognitive reserve and promotes neural compensatory mechanisms, thereby delaying degeneration in brain regions associated with depression. 37 On a psychological level, the advantage of health literacy among highly educated individuals facilitates early identification of depressive tendencies and mitigates emotional deterioration caused by illness uncertainty. 38 At the societal level, improving educational levels can help alleviate depressive symptoms in the elderly by enhancing their cognitive abilities and improving their economic security. 39 Indeed, it should be noted that educational level may introduce diagnostic bias, yet as an intervenable social determinant, it retains public health significance. Future research should employ standardized tools to control for bias and develop stratified intervention strategies: prioritizing community-based mental health programs for sarcopenia patients with low education levels while integrating family-community support systems to disrupt the depression pathway.
Sleep disorders have been identified as the second major predictive factor for depressive symptoms in middle-aged and elderly patients with sarcopenia, with those experiencing sleep disorders showing a significantly increased risk of depression. This finding aligns with research on the neuroendocrine mechanisms underlying the comorbidity of sarcopenia and depression. 40 The pathological pathway is primarily manifested as sleep disruption leading to hypothalamic-pituitary-adrenal (HPA) axis dysfunction, elevated cortisol levels, simultaneous suppression of growth hormone release, accelerated muscle protein breakdown, and induction of neuroinflammation, collectively promoting the onset of depression. 41 Sleep disorders, as a modifiable factor, suggest that future research should improve sleep quality through cognitive behavioral therapy to block the pathway to depression.
This study found that gender is the third largest predictive factor for depressive symptoms in middle-aged and elderly patients with sarcopenia, with women having a significantly higher risk of depression than men. This result is consistent with previous research conclusions on gender differences in depressive symptoms. 42 It may be related to the dual-pathway impact of declining estrogen levels in postmenopausal women on disease progression, which not only significantly inhibits muscle satellite cell activity to accelerate sarcopenia progression, but also markedly reduces hippocampal brain-derived neurotrophic factor expression to increase susceptibility to depression.43,44 In addition, the significantly prolonged daily caregiving time for women leads to a decline in physical function, weakens role performance capacity, and results in a noticeable reduction in social network size, exacerbating social isolation. 45 It is recommended to prioritize female sarcopenia patients as a key population for depression screening, develop gender-differentiated intervention plans, and reconstruct the care responsibility allocation model through community support systems.
This study found that income level is the fourth largest predictive factor for depressive symptoms in middle-aged and elderly patients with sarcopenia, with low-income status showing a significant positive correlation with increased depression risk. These findings align with the theoretical framework that economic resources influence the comorbidities of chronic diseases.46,47 The primary mechanism is the barrier to healthcare accessibility: low-income groups experience insufficient management of sarcopenia and accelerated physical function decline due to limitations in nutritional supplementation, exercise equipment, and health monitoring. 48 Future research should focus on expression bias in depression assessment among low-income patients, and it is recommended to include low-income sarcopenia patients in active depression screening systems.
This study found that blood urea nitrogen (BUN) level is an important predictor of depressive symptoms in middle-aged and older patients with sarcopenia, with lower BUN levels associated with higher predicted risk. BUN reflects nitrogen balance and is influenced by dietary protein intake, hepatic urea production, hydration status, and renal clearance; low BUN may therefore signal protein-energy undernutrition and impaired muscle anabolism, which could exacerbate sarcopenia-related vulnerability. 49 Nevertheless, BUN is non-specific and may be confounded by comorbidities and acute illness; thus, its contribution should be interpreted as a risk marker rather than a causal pathway.
Osteoarthritis was also a prominent predictor of depressive symptoms in middle-aged and older patients with sarcopenia. Chronic pain, mobility limitation, and reduced physical activity can accelerate muscle loss and impair participation in rehabilitation, contributing to a interlinked burden of worsening function and depressive symptoms.30,50 Integrating pain control, joint function rehabilitation, and mental health screening may therefore be particularly relevant for sarcopenic patients with osteoarthritis.
In addition to the top predictors, elevated white blood cell count, increased absolute lymphocyte count, and higher BMI levels were associated with higher predicted depressive symptoms risk in adults with sarcopenia. These hematologic measures are readily available but highly non-specific and can be influenced by infection, chronic disease, medications, and other comorbidities. Nevertheless, accumulating evidence supports a role for systemic low-grade inflammation and immune dysregulation in depressive symptoms, potentially through effects on neurotransmitter metabolism, neuroendocrine function, and synaptic plasticity.51,52 Higher BMI may contribute through metabolic dysfunction and adiposity-related inflammation, 53 and through psychosocial pathways such as body-image distress and weight stigma. 54 Overall, these findings suggest that integrating routine clinical and laboratory indicators can help identify higher-risk individuals, while emphasizing the need for careful clinical interpretation and prospective validation.
Model comparison highlighted that more complex algorithms are not necessarily better for this clinical prediction task. Several non-linear models achieved very high apparent performance in the training set but showed marked degradation in the validation set, consistent with overfitting in a setting with a relatively small number of outcome events. In contrast, logistic regression provided robust discrimination, excellent calibration, and transparent coefficients that facilitate clinical acceptance. This observation is consistent with evidence from clinical prediction research showing that machine-learning methods do not reliably outperform logistic regression, particularly when predictors are structured and sample sizes are modest. 55
To enhance translational usefulness, we presented the final logistic regression model as a nomogram. Rather than serving only as a statistical visualization, the nomogram can function as a screening-support tool in sarcopenia care: clinicians can estimate an individual’s predicted risk and, when the predicted probability exceeds a prespecified threshold that should be calibrated and externally validated in future studies, initiate confirmatory symptoms assessment such as administration of PHQ-9, and refer patients for evidence-based mental health evaluation or psychosocial interventions. Depression screening with systems in place for accurate diagnosis, effective treatment, and appropriate follow-up is recommended for adults, including older adults. 34 Future work should determine clinically actionable thresholds, evaluate net benefit in pragmatic settings, and externally validate the model across independent cohorts and health systems.
This study has several limitations. First, the cross-sectional design of NHANES precludes causal inference and does not establish temporal ordering; thus, model outputs should be interpreted as risk markers or correlates rather than evidence of causal pathways. Second, sarcopenia was defined using a BMI-adjusted appendicular skeletal muscle mass index based on dual-energy X-ray absorptiometry, without direct assessments of muscle strength or physical performance; future work should adopt the European Working Group on Sarcopenia in Older People 2 diagnostic framework to improve phenotypic accuracy. Third, several laboratory predictors, including blood urea nitrogen, white blood cell count, and absolute lymphocyte count, are non-specific and may be affected by comorbidities or acute conditions; although these variables may enhance discrimination, their clinical interpretation warrants caution and should be evaluated in prospective settings. Fourth, NHANES primarily samples community-dwelling individuals; therefore, our findings may not fully generalize to institutionalized populations. In addition, standardized cognitive assessments were only available in selected NHANES cycles, which limited our ability to consistently account for cognitive impairment across all survey years. Medication exposures that may influence depressive symptoms or muscle mass, including antidepressant therapy and long-term systemic corticosteroids, were not used as exclusion criteria, or incorporated as predictors because information on indication and cumulative duration is limited and not consistently harmonizable across cycles; residual confounding may remain. Future studies should incorporate medication data and perform sensitivity analyses to further evaluate clinical specificity. Fifth, despite internal validation, the number of outcome events was relatively limited, and external validation is required. Validation in independent multicenter cohorts, together with prospective follow-up studies, is needed to assess transportability, refine decision thresholds, and quantify clinical impact.
Conclusion
This study developed an interpretable machine learning model predicting depressive symptoms risk in middle-aged and older patients with sarcopenia using NHANES data. The optimal logistic regression model identified 9 predictors. A clinically applicable nomogram was created for rapid bedside risk quantification, enabling precision-tiered interventions and early disruption of the sarcopenia–depression interlinked burden to improve outcomes.
Supplemental Material
sj-docx-2-inq-10.1177_00469580261436992 – Supplemental material for Internally Validated Logistic Regression Nomogram for Depressive Symptoms Risk Prediction in Middle-Aged and Older Adults With Sarcopenia: Cross-Sectional Study
Supplemental material, sj-docx-2-inq-10.1177_00469580261436992 for Internally Validated Logistic Regression Nomogram for Depressive Symptoms Risk Prediction in Middle-Aged and Older Adults With Sarcopenia: Cross-Sectional Study by Enguang Li, Fangzhu Ai, Ping Tang, Hongjuan Wen and Botang Guo in INQUIRY: The Journal of Health Care Organization, Provision, and Financing
Supplemental Material
sj-docx-3-inq-10.1177_00469580261436992 – Supplemental material for Internally Validated Logistic Regression Nomogram for Depressive Symptoms Risk Prediction in Middle-Aged and Older Adults With Sarcopenia: Cross-Sectional Study
Supplemental material, sj-docx-3-inq-10.1177_00469580261436992 for Internally Validated Logistic Regression Nomogram for Depressive Symptoms Risk Prediction in Middle-Aged and Older Adults With Sarcopenia: Cross-Sectional Study by Enguang Li, Fangzhu Ai, Ping Tang, Hongjuan Wen and Botang Guo in INQUIRY: The Journal of Health Care Organization, Provision, and Financing
Supplemental Material
sj-pdf-1-inq-10.1177_00469580261436992 – Supplemental material for Internally Validated Logistic Regression Nomogram for Depressive Symptoms Risk Prediction in Middle-Aged and Older Adults With Sarcopenia: Cross-Sectional Study
Supplemental material, sj-pdf-1-inq-10.1177_00469580261436992 for Internally Validated Logistic Regression Nomogram for Depressive Symptoms Risk Prediction in Middle-Aged and Older Adults With Sarcopenia: Cross-Sectional Study by Enguang Li, Fangzhu Ai, Ping Tang, Hongjuan Wen and Botang Guo in INQUIRY: The Journal of Health Care Organization, Provision, and Financing
Footnotes
Acknowledgements
Thanks to the National Health and Nutrition Examination Survey (NHANES) for providing the data and allowing us to use it for free. We express our great gratitude to the participants in the study.
List of Abbreviations
PHQ-9 The Patient Health Questionnaire-9
NHANES National Health and Nutrition Examination Survey
NCHS National Center for Health Statistics
PIR Poverty Income Ratio
BMI Body Mass Index
SD Standard deviation
KNN K-nearest neighbor
LR Logistic regression
RF Random forest
SVM Support vector machine
ROC Receiver Operating Characteristic
AUC Area under the curve
DCA Decision curve analysis
SHAP Shapley Additive exPlanations
CVD Cardiovascular disease
CDC Centres for Disease Control and Prevention
LASSO Least Absolute Shrinkage and Selection Operator
GBM Gradient Boosting Machine
NN NeuralNetwork
Ethical Considerations
NHANES data collection procedures and protocols were reviewed and approved by the National Center for Health Statistics (NCHS) Ethics Review Board (ERB), including Protocol #2005-06 (continuation approved September 19, 2007), Protocol #2011-17 (approved November 10, 2011), and Protocol #2018-01 (approved October 26, 2017), with annual continuation reviews for subsequent survey cycles. The study procedures were conducted in accordance with the Declaration of Helsinki and its subsequent amendments. This study is a secondary analysis of publicly available, de-identified NHANES data; therefore, additional institutional review board approval for this secondary analysis was not required. The original ERB approval documentation is provided as a separate “Research Ethics Documentation” file.
Consent to Participate
Written informed consent was obtained from all participants (and parental permission/assent for minors, as applicable).
Author Contributions
EL: Conceptualization, Methodology, Formal analysis, Data Curation, Writing—Original Draft, and Writing—Review & Editing. FA: Conceptualization, Methodology, Formal analysis, Data Curation. PT: Formal analysis, Data Curation, Conceptualization, Methodology, Formal analysis. BG and HW: Conceptualization, Formal analysis, Supervision, Writing—Original Draft, and Writing—Review & Editing.
Funding
The authors disclosed receipt of the following financial support for the research, authorship, and/or publication of this article: This study was supported by the Science and Technology Project of the Jilin Provincial Administration of Traditional Chinese Medicine (No.2024260), the Changchun University of Traditional Chinese Medicine Theme Case Project (No.2024YJ03), the Shenzhen Key Medical Discipline Construction Fund (No. SZXK062), the 2025 Thematic Case Project of the Development Center for Degree and Graduate Education, Ministry of Education (No. ZT-2510199001), and the Shenzhen Philosophy and Social Science Planning Project (No. SZ2024C018).
Declaration of Conflicting Interests
The authors declared no potential conflicts of interest with respect to the research, authorship, and/or publication of this article.
Data Availability Statement
Supplemental Material
Supplemental material for this article is available online.