
Abstract
Patient mobility is a crucial indicator in healthcare resource allocation and improvement. This mobility is due to the uneven distribution of healthcare facilities in its provincial sense. The objective here is to designate the Alzheimer’s disease patients’ mobility patterns in Iran. Through this longitudinal study, by applying process mining techniques on the 28 425 physician office visits recorded in the Salamat Health Insurance (SHI) database between 2019 and 2023, the inter-provincial patient mobility patterns across Iran are revealed. Based on the extracted knowledge about the most essential care flows, patient mobility patterns in provinces with the highest rates of trajectories are constructed, a task that traditional statistical methods cannot assess in healthcare. The inter-provincial process model of patients with the highest count of out-of-province patient mobility (more than 50%) is attributed to Ilam, Alborz, Sistan, and North and South Khorasan provinces; though, Tehran, Alborz, and Isfahan provinces are the preferred medical destinations for 70% of AD treatment. The provinces with the lowest count of patient mobility are Qom, Yazd, Fars, Gilan, Isfahan, Eastern Azerbaijan, and Khorasan Razavi, with rates <1%. The potential of process mining techniques in addressing new problems in healthcare services and the integration between the 2 disciplines is introduced here to better understand their contribution to the health industry. The top provinces with the highest counts of referrals from other provinces (eg, Tehran, Alborz, and Isfahan) have also a high count of the specialist share. Consequently, efforts should be made to promote a rational balance in medical resource allocation throughout provinces nationwide, thereby eliminating the monopolistic status of a particular province.
Keywords
Introduction
Patient mobility refers to the travel of individuals across regions to access timely, affordable, or specialized healthcare services outside their place of residence. Patient mobility is closely linked to the opportunities and limitations they experience in accessing healthcare services located within a certain distance from their place of residence. 1 Patient mobility inherently is due to: (1) imbalances in the provided capacities and lack of improvement in local healthcare services, (2) problems related to insurance coverage, (3) overload of health facilities, and (4) intensified unequal distribution of healthcare services. To assess the cross-regional provision of healthcare services based on basic medical insurance participants, allocate healthcare services rationally, and promote patient awareness in seeking appropriate medical care is essential. 2
Due to the lack of specialists and advanced medical equipment across its provinces and between urban and rural areas, Iran faces significant healthcare disparities.3,4 Patients often have to travel inter- or intra-provincially for healthcare. 5 Because patient mobility significantly contributes to the discrepancy between healthcare resource availability and population demand, 6 the state must proactively address the underlying issues regarding the healthcare service supply-demand imbalance. The concept of domestic patients’ mobility patterns in Iran is limited; therefore, there is no improvement in healthcare resource distribution at a macro scale.
Every 3 seconds, someone, somewhere, develops dementia. 7 Alzheimer’s disease (AD) is the most common syndrome of dementia, which leads to the formation of amyloid plaques in the brain and the breakdown of neurons. 8 Although AD is usually incurable, irreversible, and difficult to treat, where memantine is prescribed in mild and moderate cases, treatments are available to manage some symptoms (eg, a cholinesterase inhibitor [ChEI, donepezil, galantamine, and rivastigmine]). 9 The unknown aspects of AD’s progression and its curation have encouraged researchers to explore and find innovative approaches through ML-based methods. For the early diagnosis of AD, some available techniques apply DL and CNNs to analyze MRI image data and predict progression.10,11 Like in all scientific endeavors, studies on AD are closely associated with treatment costs.12,13 The same holds for the modeling of known approaches for a few disease states, where Markov models, discrete-event simulation, system dynamics, and business process management are applied.13 -16 Because these classical modeling methods scale poorly beyond 10 or 15 conditions, data-driven approaches, which do not rely on prior knowledge of the event order of occurrence, are crucial to care pathway discovery.
There exist many studies on the mobility of patients diagnosed with cancer,17,18 rare diseases, 19 and non-emergency hip arthroplasty, 20 in different single-characteristic groups, such as the labor force 21 or adults, 22 and in other countries like China,2,17,19 Turkey,1,23 the United States, and European countries.6,24 -26 Researchers2,3,25,27,28 have sought to reveal the correlation between patient mobility and healthcare resource services, adopting classical statistical methods like analyzing researcher-devised questionnaires and logistic regression. The specific mobility patterns of patients with AD remain largely unexplored. The progressive and complex nature of this disease requires long-term, specialized neurological care, that is, often concentrated in major urban centers, necessitating inter-provincial mobility. The issue of patient mobility pattern analysis in Iran is neglected so far. The reasons for patient mobility in Kerman province, Iran, are assessed in Sabermahani et al. 4 The intra-provincial patient mobility ratio is reported in Hekmat et al, 3 where, based on regression analysis, the factors affecting it over a limited period are identified. While previous studies in Iran have assessed mobility for other conditions,3,4 none have addressed this pressing issue for patients with AD. The aging population in Iran is projected to increase the prevalence of AD, thereby intensifying the demand for specialized neurology and caregiving resources. Iran’s physician density, at 1.8/1000 population, exceeds the global benchmark of 1.0 but is substantially lower than the 3.0 ratios typical in developed countries. 29 This difference is even more pronounced for neurologists. Iran has only 1.3 neurologists/100 000 population, compared to an average of 7.1 in developed countries (eg, 9.2 in Europe and 22 in the United States).30,31 This scarcity, next to the likely concentration of these limited specialists in major urban centers, initiates a powerful driver for inter-provincial patient mobility. The focus of this study is on addressing this specific gap by applying and adapting established methodological frameworks from other diseases to a new, critically important context.
In featuring a typical hierarchical healthcare system and uneven distribution of healthcare resources and services, Iran is a case in point for assessing patient mobility, where the findings can supplement the existing studies in this field. Therefore, by applying the established methodological framework to AD, this study addresses a critical and emerging challenge exacerbated by Iran’s evolving demographics and specialist distribution.
Process mining (PM) is applied here to analyze a large-scale administrative claims dataset of 9630 patients diagnosed with Alzheimer’s disease between 2019 and 2023 across Iran, to extend the understanding of patient mobility and its policy implications. Due to the temporal characteristics of patients’ mobility, it is necessary to apply the PM techniques to run interdisciplinary studies. The PM is an emerging expert in machine learning, capable of analyzing temporal correlations between activities and resources involved in processes. By applying interpretable visualizations and introducing actionable insights, the PM has gradually evolved into an ideal, almost practical method for acknowledging healthcare systems’ predictive analysis and enhancing care processes. 32 The emerging research direction in the PM field, known as healthcare process mining (HPM), embodies such studies where determining patient mobility patterns necessitates further empirical research.
Materials and Methods
Data Introduction
In Iran, a mandatory overall healthcare program is managed by the Ministry of Health and Medical Education, and its universal public health insurance scheme, known as the Salamat Health Insurance (SHI), was established in September 2012 to provide medical services, particularly to the low-income stratum. In this context, a key methodological consideration of this study is to represent the low-income population, which may not be fully generalizable to other socioeconomic groups or those with different primary insurance coverage types. Since 2017, the SHI organization has initiated a comprehensive electronic insurance system to eliminate most of the paperwork processes, including prescription issuance.
The data applied in this study are extracted from the SHI database, limited to all relevant information on physician office visits by the AD population covered by SHI. Every record contains patient demographic information, type of insurance, prescribed anti-dementia drugs (eg, galantamine or memantine), medical costs related to dementia, residential area, and the location of the medical treatment source. This information can be applied in determining patient mobility patterns for AD treatment nationwide.
Patients with incomplete information are excluded from this study. The data from 28 425 physician office visits of 9630 patients diagnosed with Alzheimer’s disease, spanning from January 2019 to March 2023, are extracted SHI database. Due to the strict data protection policies of healthcare institutions, access to data is managed through our data sharing agreement with SHI. As to the legal requirement for data minimization, the patients’ data are not disclosed. Verbal informed consent was obtained from all individual participants prior to their enrollment. The consent procedure involved a researcher reading the complete participant information sheet aloud to each potential participant, ensuring comprehension of the study’s purpose, procedures, potential risks and benefits, and the right to withdraw at any time without penalty. This verbal agreement was formally documented by the researcher using a signed checklist that confirmed the information was presented, understood, and that consent was verbally provided and recorded. Due to the high illiteracy rate within the target population, the committee granted a formal waiver for written consent. This longitudinal observational study was reported in accordance with the Strengthening the Reporting of Observational Studies in Epidemiology (STROBE) guideline (Supplemental Material).
In this study, patient mobility refers to insured behavior where the medical treatment location is not in their immediate vicinity, thus including inter- and intra-provincial mobility.
Algorithm and Software Technology Choices
The techniques through which any event is analyzed with business process improvement in mind constitute the PM package. Any event log is provided with a Process discovery algorithm to produce a descriptive process model for extracting the control-flow information among activities of a given society. The PM techniques go beyond the control-flow perspective (the ordering of activities). In identifying bottlenecks and diagnosing other performance-related problems, the time stamps and frequencies of activities are applied. In this context, one can reveal a social network and validate an organizational model through an event log. An organizational perspective can be applied to establish insight into typical work patterns, organizational structures, and social networks. By applying such information, more techniques will be introduced to learn more about people, machines, organizational structures, task distribution, and work patterns.
An event log refers to input data, and the beginning point of PM projects. A set of traces, where each describes the sequence of implemented activities for a process instance is identified by the Case ID constitutes this log. Certain case-related attributes, which remain constant throughout the process trace are recorded in event log. The 3 defined basic PM concepts are 33 :
Event Log:
Trace:
The context attributes is a n-dimensional vector of attributes like patients’ demographics (case attributes) and injury information (event attributes).
Directly Follow Graph (DFG): is the ordering correlation between the occurrences in the whole operation portrayed graphically. The DFG operates by drawing a directed graph that exhibits the ordering correlations and every incident’s rate in the log. Though DFG does not represent a comprehensive process model, it is a quick and effective approach to observe the process behavioral manner. The DFG is calculated through equation (1):

where E is an event log,
Results
In the event log, the treatment activities that occur for each sample (ie, patient) are listed in the order of occurrence to provide treatment path discovery. How to convert raw data into an event log is shown in Figure 1. This is an acceptable input format for process mining software. The information on the insurance registration location, the doctor’s visit location, and the place where the medicine is received is considered resource information to facilitate the accurate identification of patients’ journeys with the help of source analysis techniques in process mining. The patient’s address in the raw data set is considered the initial insurance registration activity because the time information associated with this activity is not essential. Therefore, the time value of the first visit to the doctor for each sample is directly related to the insurance activity. This allows the researchers to assess the difference between the clinical visit and the receipt of a drug prescription.
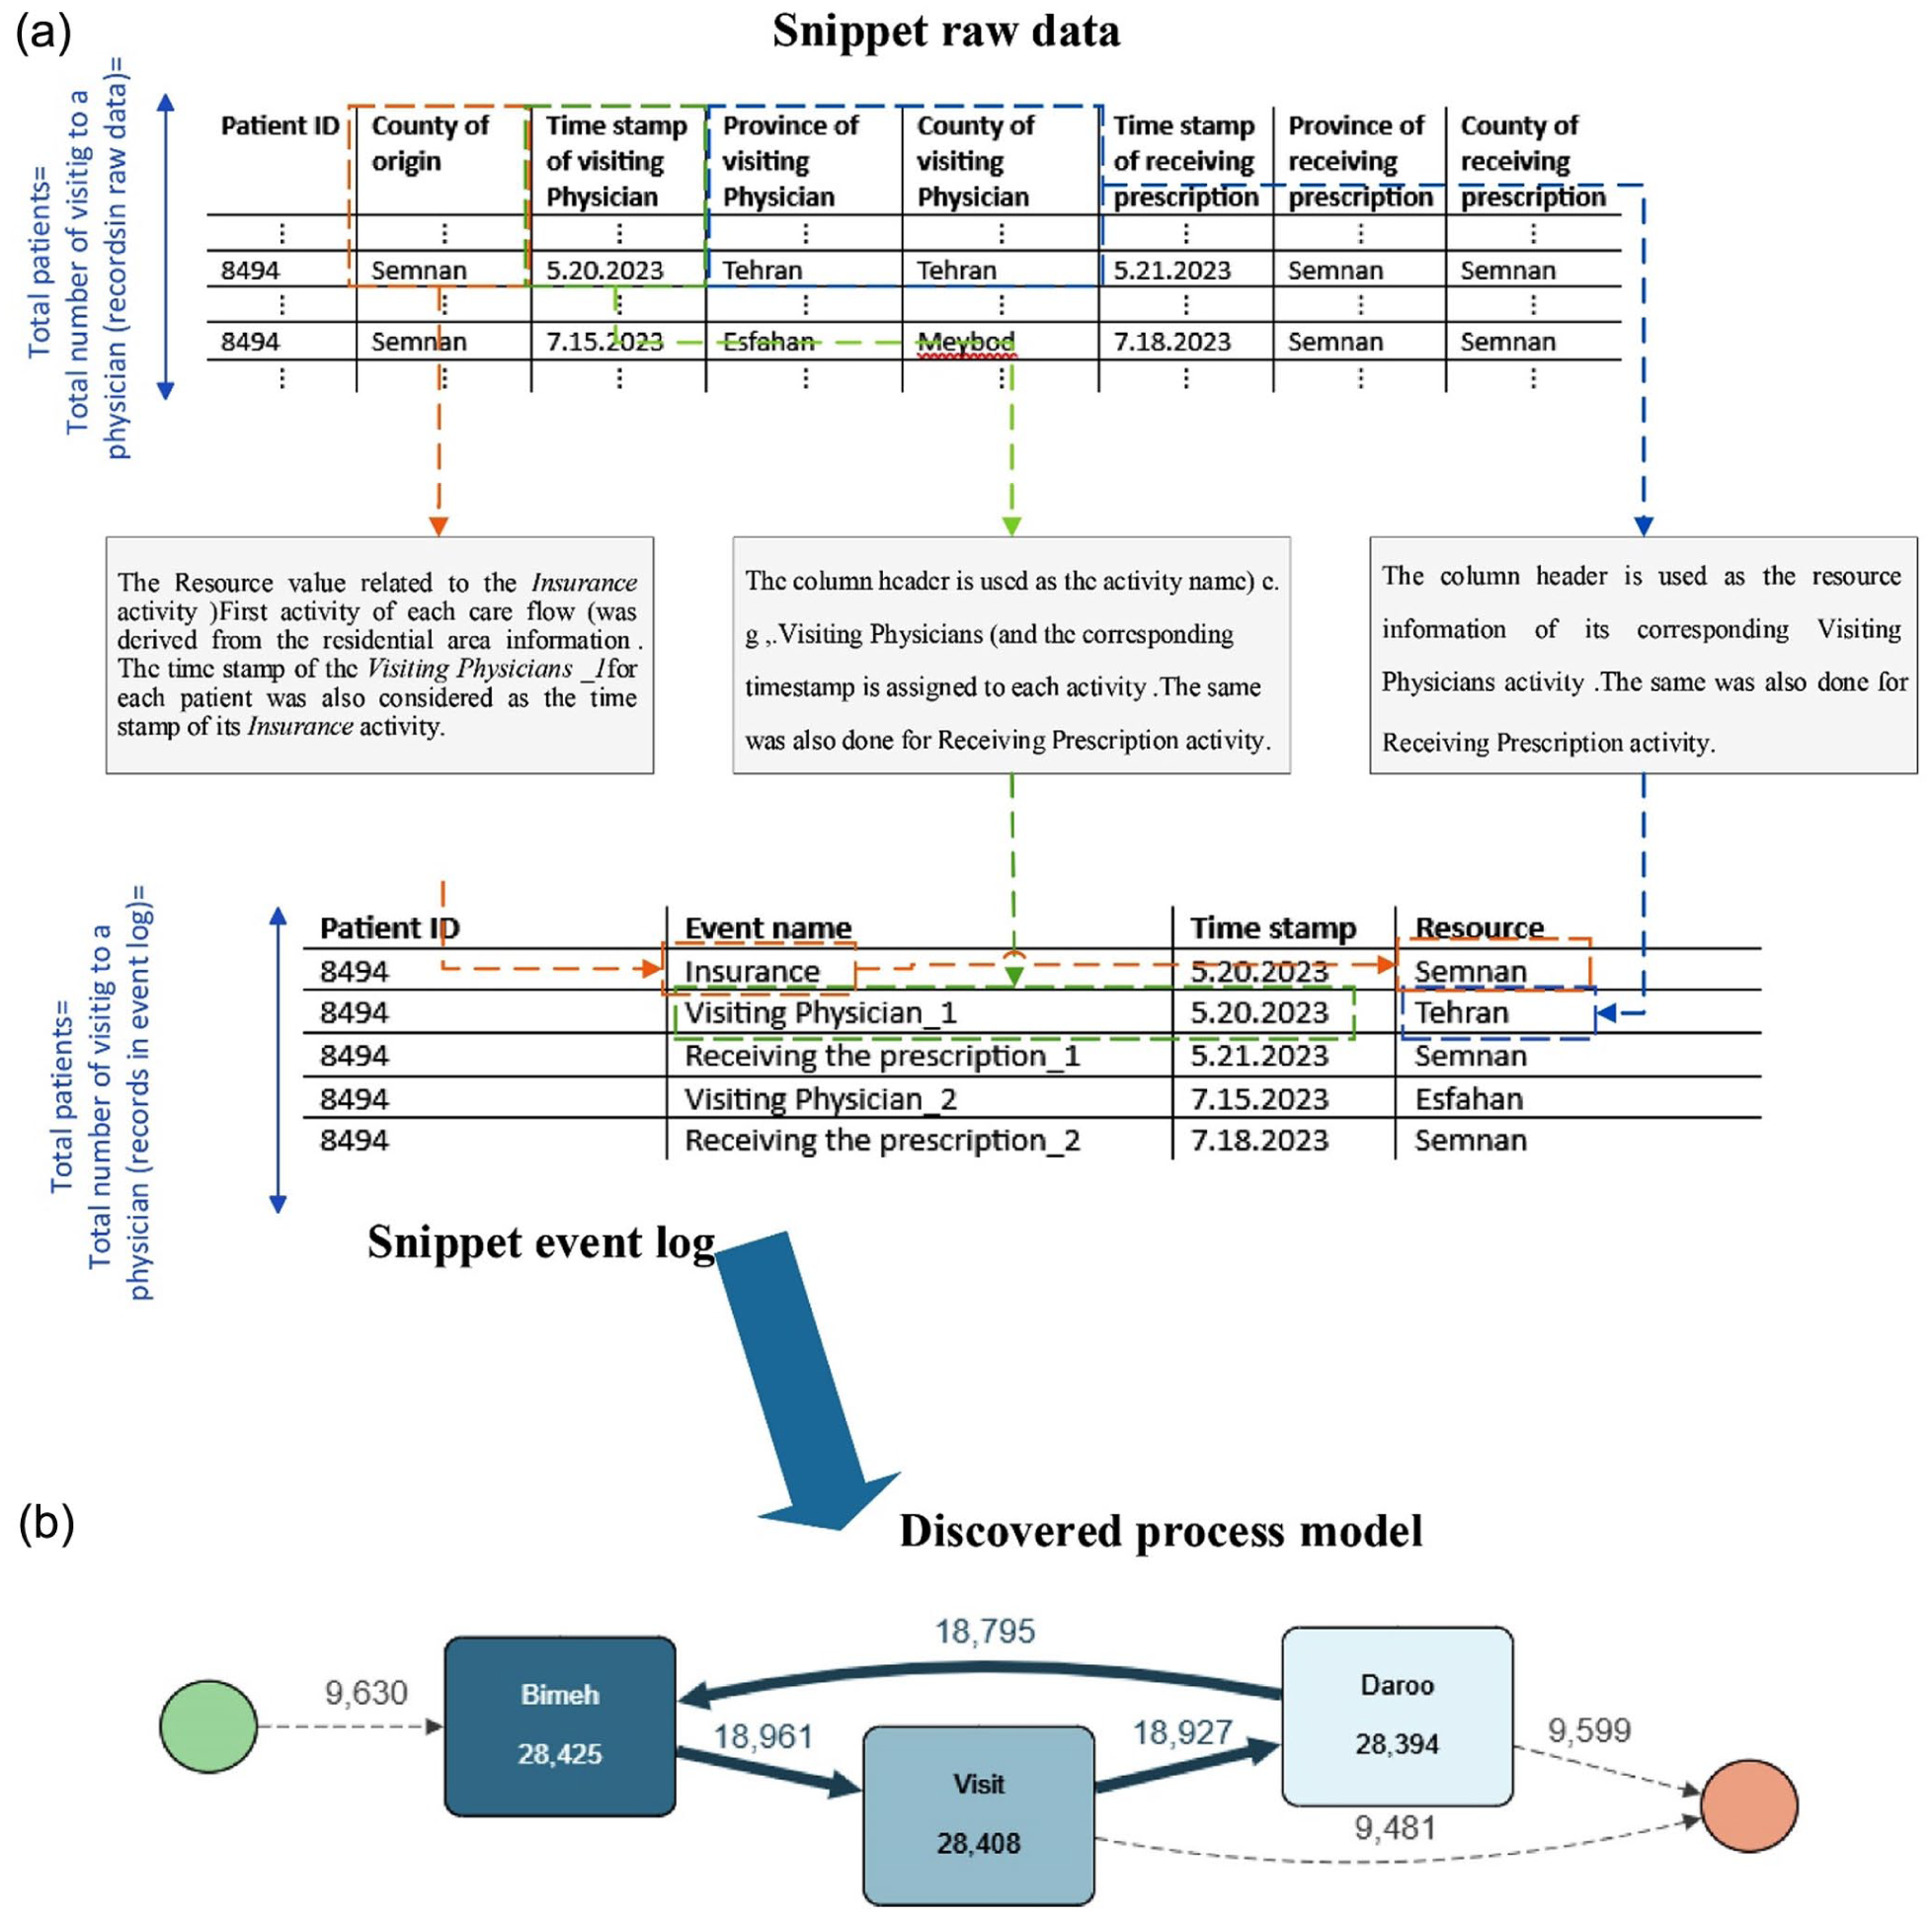
(a) The segment of the patients’ mobility patterns’ event log and (b) the discovered process model.
Each square in Figure 1b represents a treatment activity, and each edge represents a treatment trace. Darker colors and thicker edges indicate more frequent activities. As observed in this figure, for each patient, the process of “Insurance Registration, Visiting Physician, and Medical Prescription” is completed. It should be noted that in 9841 cases, some prescriptions, although issued, were not received; therefore, the process is terminated immediately; moreover, for 18 795 cases, the visiting process is repeated (at the edge of the loop from Medical Prescription activity to Insurance activity).
Apromore is a web-based process analytics platform based on the standard for PM in research, offering a variety of techniques, including data conversion into the XES format, event data visualization, and prediction. According to Gartner’s report, Apromore is a Leader in the Magic Quadrant for Process Mining Platforms. 34 Apromore is system-agnostic and accessible on the cloud through annual subscriptions. It supports industries like BFSI, healthcare, manufacturing, and energy. The process mining offering we assessed is Apromore Enterprise Edition 10.1. The Apromore Portal is the primary interface that gives access to the Apromore Workspace. Readers can refer to the user guide for more details about Instructions and how to use this software. 35
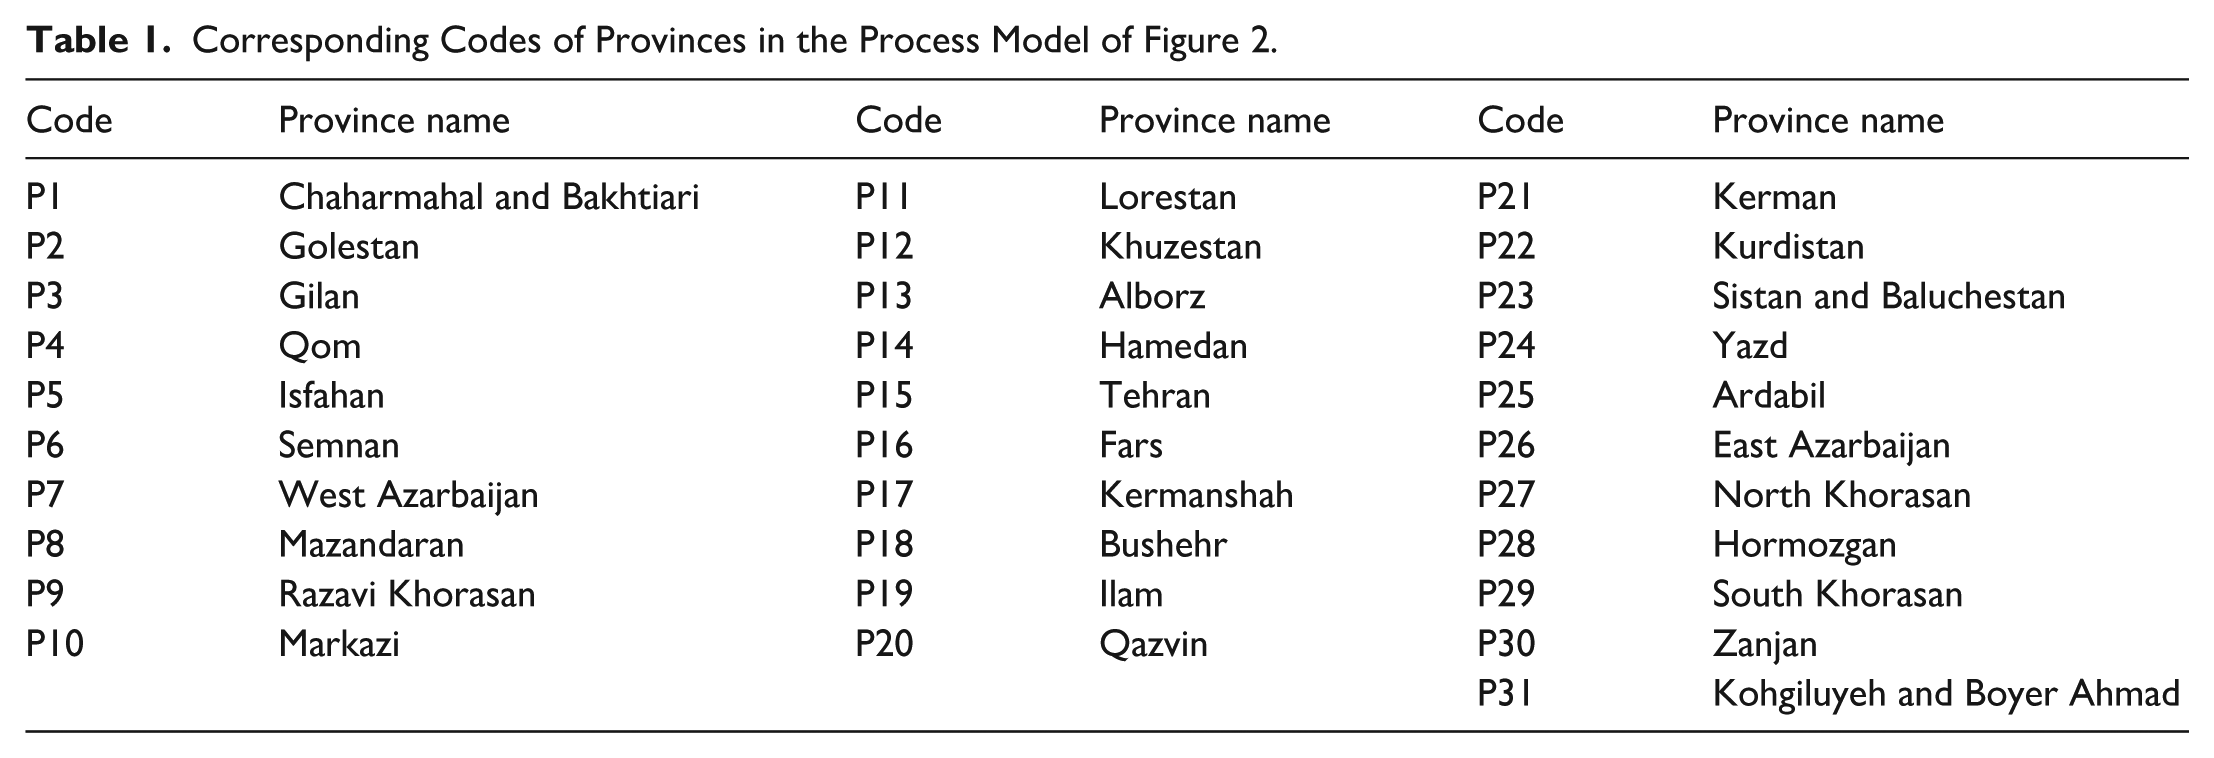
In this study, the data format is converted from CSV to XES before PM analysis. In this study, Apromore is applied to represent patients’ travel to different locations. The geographic information is considered the Resource Perspective of the PM algorithm, which enables the analysis of patient mobility patterns based on resource analysis techniques. In general, cities with big inter-provincial patient flows are marked with thicker edges in dark blue inside the activity box. The numbers at the nodes of the graph represent the total number of referred patients in a given province. The absolute frequencies of patients who travel to other provinces to buy drugs are displayed in the numbers at the arcs and in the activities. The thickness of arrows and the activities in colors exhibit these numbers. The activities slider, which spans the range from the most frequent activities to the least frequent activities, determines the count of activities displayed in the process map. The count of incoming edges to a node is the count of patients who have visited the node province from other provinces. The count on the outgoing edges from a node province is the count of patients who have traveled from that province to other treatment destinations. A loop refers to the count of patients who buy drugs within the same province as their visiting doctors. The obtained process model of patient mobility patterns at the national level is complex and difficult to interpret (Figure 2). To facilitate summarization of the province names in the process model, a code is assigned to each province. Table 1 shows the corresponding code of each province.

Process model of patient mobility pattern at the national level in Iran.
Corresponding Codes of Provinces in the Process Model of Figure 2.
Based on this general process model, the 4 provinces of Ilam, Alborz, Sistan, and North Khorasan, as well as South Khorasan, which have the highest counts of out-of-province patient travel, are outstanding. Based on the numbers obtained from the process model, the inter-provincial mobility rates for visiting doctors and purchasing medicine are tabulated in Table 2, columns 2 and 3, respectively. The mobility rate is the difference between the count of people whose place of insurance and place of visit vary, divided by the total patient population in a given province. According to Table 2 content, the provinces with the lowest mobility indicate a proper distribution of medical resources and specialists, which are Fars, Isfahan, Khorasan Razavi, Gilan, Yazd, and Qom, respectively, with mobility rates of <0.1. Tehran province, with a population of nearly 15 million, has a high travel rate. The average age of the statistical population here is over 60. It is natural that the insured in Tehran, capable of living outside the megacity, will go to the neighboring provinces. This phenomenon is observed in the third column of Table 2, where the similarity in the count of visiting province and the province of receiving drugs (
Inter-Provincial Referral Rates.

Column 1: patients traveling from their home province to see doctors elsewhere. Column 2: patients traveling from the province specifically to obtain medications. Column 3: patients traveling into the province to consult physicians. Column 4: patients traveling into the province specifically to obtain medications.
The high rate of inter-provincial referrals to visit a specialist and low referral rates from other provinces to a special province indicate that the provinces could be underprivileged. The southern and eastern provinces have the highest intra-provincial mobility, while the lowest is in the northern and western provinces (Figure 2). Patient mobility in central areas is lower than that of the border provinces (Figure 2). The northern provinces of Iran offer hospitalization services with high professional specialists. Northwestern provinces are more privileged than Eastern provinces in this context. Sistan, a province in southeast Iran, is the most deprived in this context. These findings suggest that relatively distinct services (medical hubs) are established in the provinces of north and central Iran, which makes them stand out compared to Tehran province, the predominant one. Consequently, efforts should be made to balance the allocation of medical resources across provinces nationwide, thereby eliminating the monopolistic status of any single province.
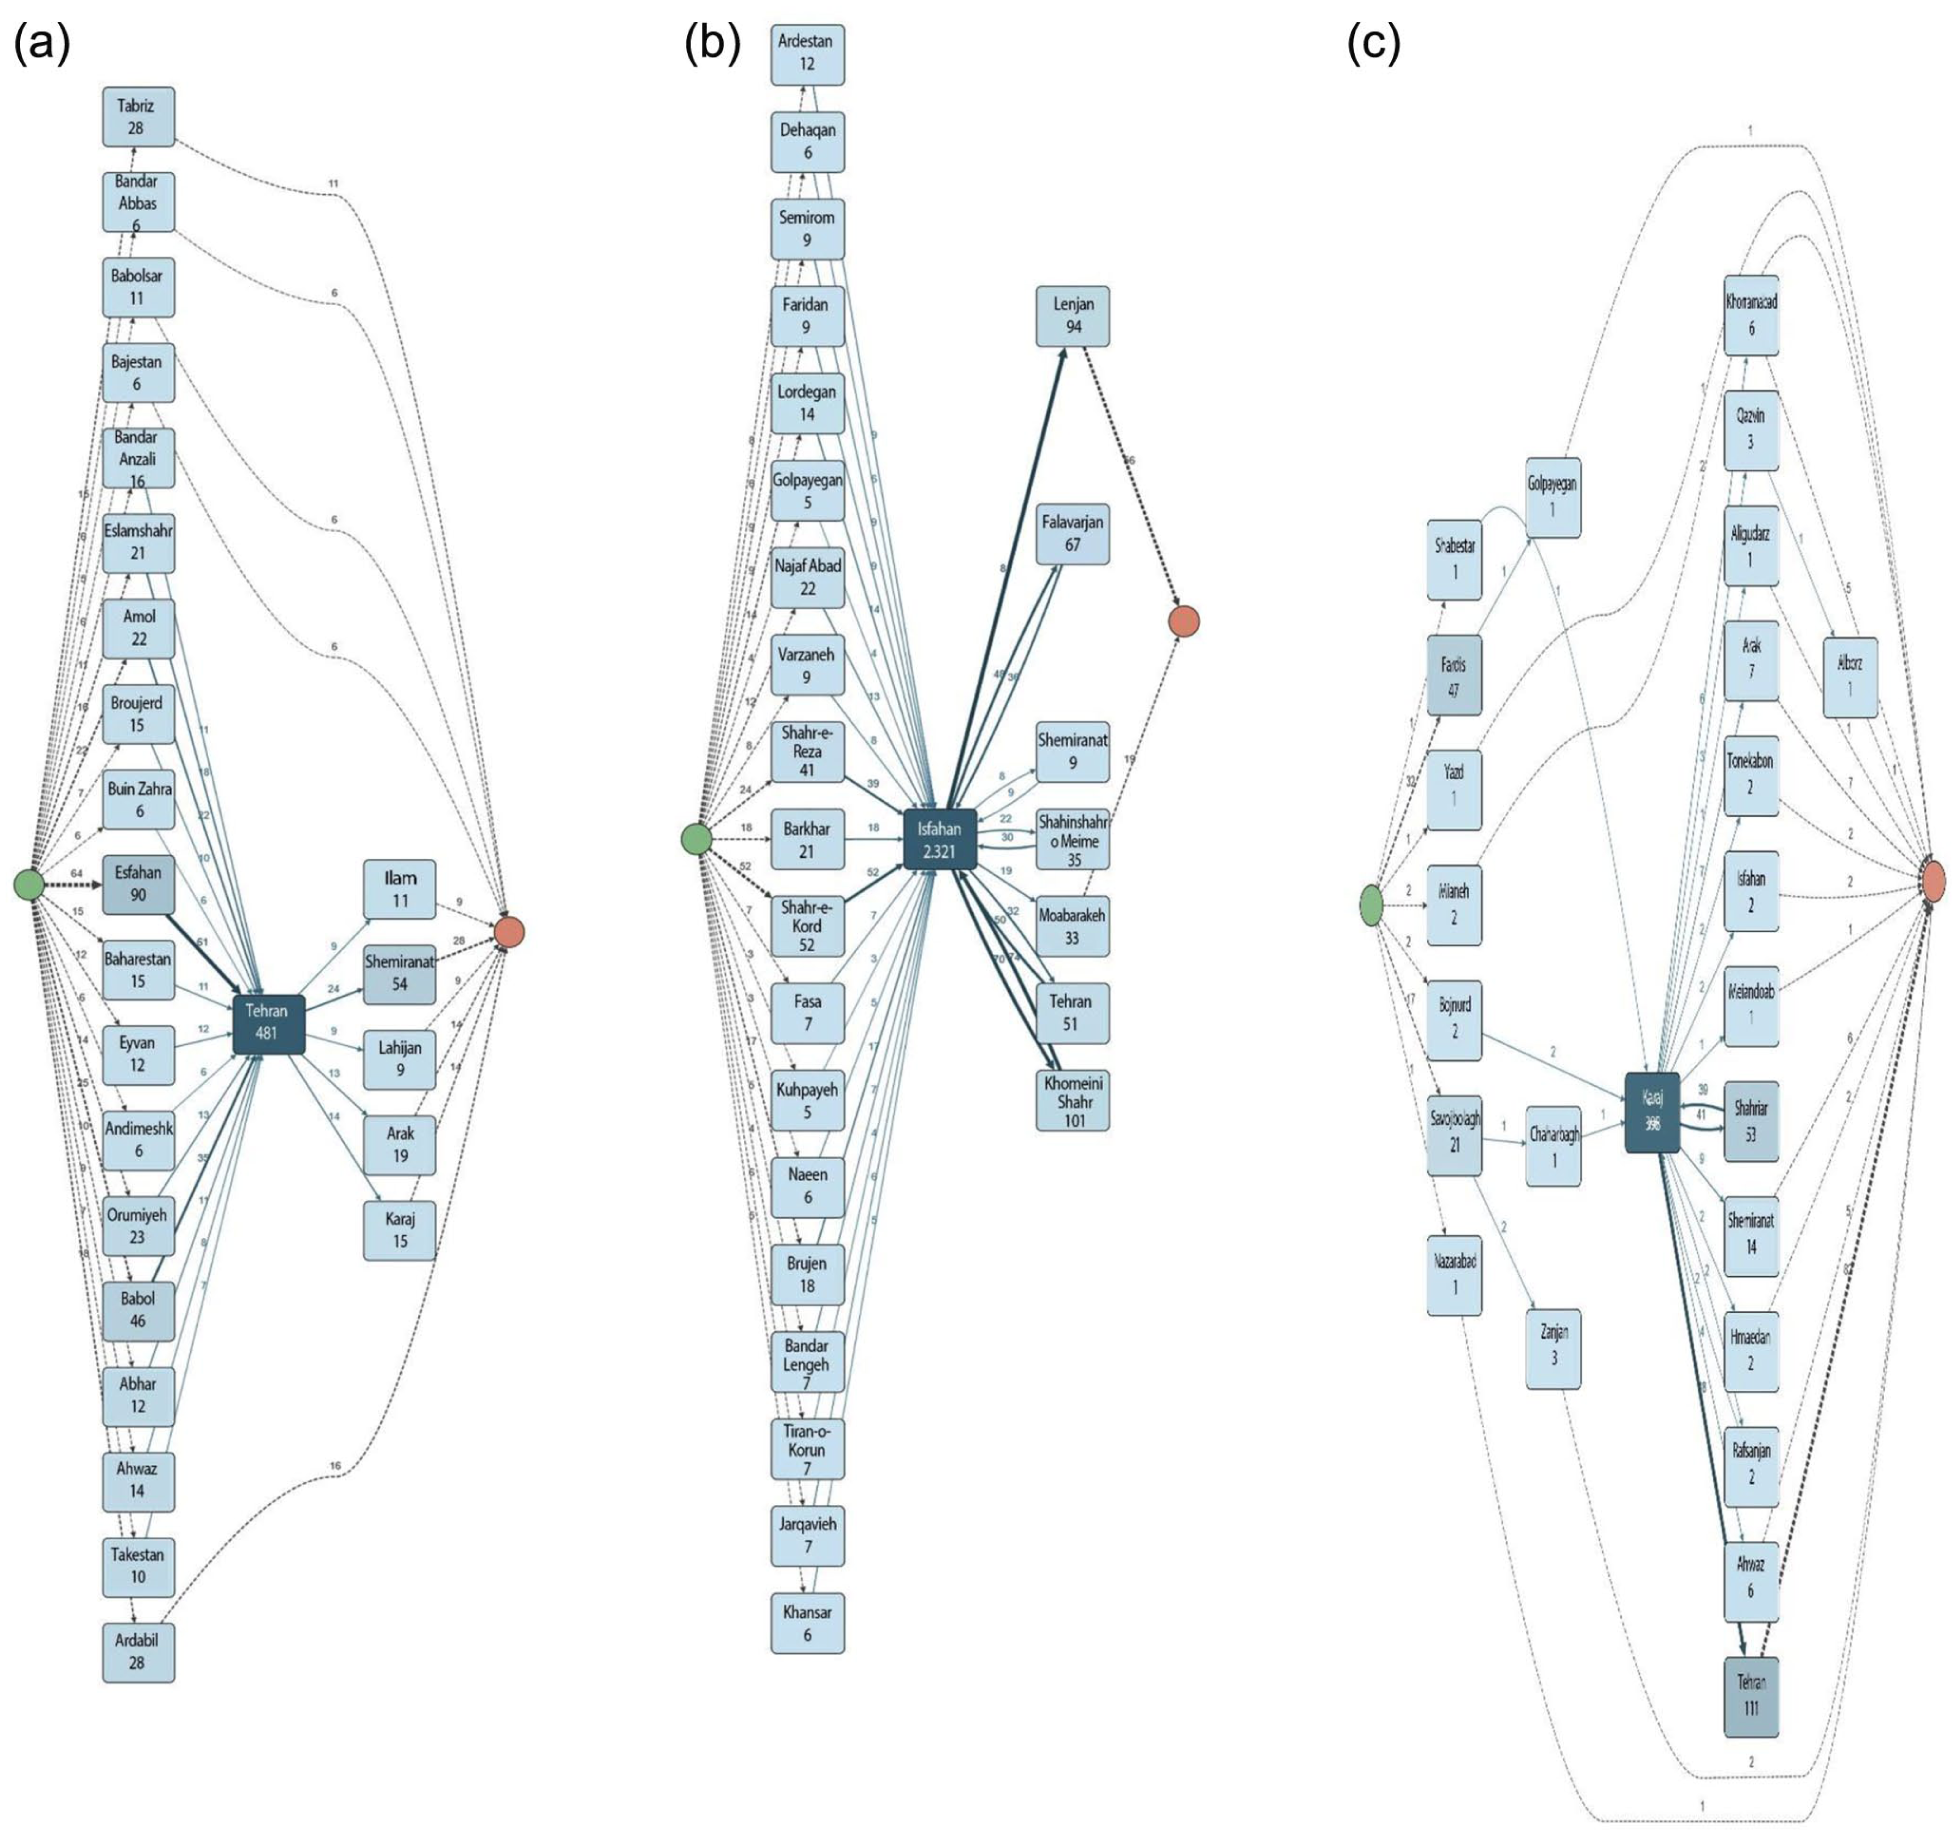
The process models of provinces with the highest count of out-of-province patient mobility and provinces with the highest inter-provincial patients’ mobility are revealed for analysis at the city level. This can help to understand which provinces are the destination of the deprived areas and which cities in these provinces have the highest patient mobility rates. The patient’s mobility patterns of Ilam, Alborz, Sistan, and North and South Khorasan are illustrated in Figure 3, where, as observed, the travel destinations from the cities in Ilam province are primarily Ilam and Tehran, and secondarily Isfahan, Khorramshahr, and Kermanshah. Alborz Province, adjacent to Tehran Province, naturally records the highest count of referrals to Tehran and Shahriar. Alborz, a sizeable district of Tehran, is administratively separated from Tehran in 2010. In South Khorasan Province, the majority of patients who travel from Birjand, Boshruyeh, and Darmiyan are directed toward Mashhad. Patients from Tabas, Qaenat, and Sarbisheh frequently travel to Yazd, Torbat-e Heydarieh, and Gonabad. Meanwhile, Sarayan, Ferdows, Zirkuh, and Nehbandan are of limited patient travel to other cities. In North Khorasan Province, specifically in Esfarayen, there is no record of patient travel. In Sistan Province, the cities of Saravan and Zahedan have the least patient travel, and patients from neighboring townships predominantly travel to Zahedan, Kerman, Mashhad, and Tehran. No patient travel is recorded in Lorestan Province, Borujerd, Khorramabad, and Delfan cities have the lowest travel rates compared to others, though Khorramabad’s highest patient travel rates are directed toward Borujerd, Tehran, and Qom. It should be noted that among the mentioned provinces, patient travel to purchase medicine is lower compared to Lorestan and Sistan, which have the highest rate of patient travel for purchasing medicine. In Lorestan, most patients travel to Khorramabad for medical appointments and to Borujerd to purchase medicine.

The process models of provinces with the highest count of out-of-province patient mobility: (a) Ilam, (b) Sistan, (c) North Khorasan, and (d) South Khorasan provinces.
The revealed process models of inter-provincial patients traveling to Tehran, Alborz, and Isfahan are shown in Figure 4. The primary source of patients who traveled to Isfahan was its neighboring provinces, that is, Markazi, Fars, Alborz, Qom, Khozestan, and Charmahal. According to statistics, the count of visits from other cities to Tehran is 1259. The top 5 provinces in this context are Alborz (27.91%), Isfahan (11.58%), Mazandaran (8.98%), Gilan (7.62%), and Qom (7.28%), accounting for 63.36% of the total patients. While good medical resources are located in these provinces, underprivileged provinces like Sistan, North and South Khorasan have low rates of travel to Tehran. The travel cost is a significant factor influencing patient travel patterns. Based on the findings, the patients’ chosen destinations in less-prosperous provinces are often their closest cities. Patients in provinces with proper medical resources travel to Tehran for top treatment.
Process models of inter-provincial patients travel: (a) Alborz, (b) Tehran, and (c) Isfahan.
The average time duration between visiting a doctor and purchasing medicine is 2.2 days, with a maximum of 2 months. According to Figure 5a, the majority of patients (22 000 cases) bought their drugs in <24 hours. The sample sizes for each city are illustrated in Figure 5b. As is evident, the provinces of Tehran (3100 patients), Isfahan (4017), Gilan (3163), Khorasan Razavi (2493), Fars (2264), Mazandaran (1794), Azerbaijan (2516), and Qom (1379) reported the highest number of patients. Given that most of these are among the country’s most populous provinces, the prevalence rate may be a more reliable indicator. In terms of prevalence rate, calculated by dividing the number of insured patients in a province by the total population of that province, 36 Qom (1379/1 292 283 = 0.001067104) and Gilan (3163/2 530 696 = 0.001249854) exhibit the highest prevalence rates in the country by a considerable margin, followed by Isfahan (4017/5 120 850 = 0.000784440) and Ardabil (785/1 270 420 = 0.000617906), thus making them full-bodied urban candidates for more detailed assessments in the future. The lowest Alzheimer’s prevalence rates in the country were recorded in Khuzestan (439/4 710 509 = 0.000009300) and Sistan (180/2 755 014 = 0.000007844).

(a) The average time duration between visiting doctors and purchasing medicine and (b) the sample sizes for each city.
Based on the observed patient mobility patterns, proper distribution of medical specialists is a key driving factor. Provinces with a high count of referrals (eg, Tehran, Fars, Khorasan Razavi, and Isfahan) account for 45.4% of the specialist share. 37 On the contrary, North and South Khorasan, Ilam, Lorestan, Sistan, Kurdistan, Kohgiluyeh, and Bushehr have limited specialists, at about <1.8% of the national rate. This considerable disparity in specialist distribution initiates a clear push-pull dynamic, compelling patients from underserved provinces to travel to the well-equipped central hubs to access necessary medical services.
Discussion
Overcoming the predominance of patient mobility for healthcare services in Iran requires resource reallocation among regions. A process model is proposed where the medical trajectories of 28 425 cross-provincial patients’ travel are integrated. The mobility patterns process models of cross-provincial AD patients are revealed for analysis at 2 levels based on statistical granularity: (1) provinces with the highest count of patient inflow rate and (2) provinces with the highest count of patient outflow rate. According to available records, a considerable and constant flow of patients is moving from the southern provinces to predetermined regions in central and northern Iran, where more effective and professional medical providers are available, thus leading to patient migration. These regions are located in the north-central Alborz, Tehran, and Isfahan, in the center, which are equipped with comprehensive medical service infrastructures, including medical universities and integrated health systems, thus absorbing high inter-provincial patient flows. Alborz, one of Iran’s most economically developed provinces, with its well-established healthcare system and high quality of medical services absorbs patients from neighboring provinces, thus, contributing to the highest inflow and outflow of inter-provincial patients in Iran (Figure 2). As observed in Figure 4, Shahriar in Tehran province, due to the accessibility and modern healthcare facilities, is the primary source of inter-provincial patient travel, the second to Alborz.
This finding suggests that, because access to medical resources varies in distribution across different provinces of the country, establishing a stratified heterogeneous spatial framework regarding travel patterns among inter-provincial patients is necessary. The sizable populations of Sistan and Khorasan, which embody relatively low per-capita medical resources, require greater inputs in medical services. Until this requirement is met, residents would often seek treatment outside their province. To overcome this drawback in healthcare accessibility among different provinces, the priority should be on investing in this realm. Patient mobility in central provinces is lower than that of the border provinces (Figure 4). Isfahan is located in the northernmost part of the region 2 of administrative divisions, which is considered the center of Iran, with almost easy access for patients seeking medical treatment from other neighboring provinces from regions 1, 2, 4, and 5.
The findings presented here correspond with those of Hekmat et al, 3 where the highest intra-provincial mobility is observed in the southern and eastern provinces, and the lowest is observed in the northern and western provinces. Results 4 indicate that most services provided to transit patients begin at their place of residence. Free inter-regional patient mobility in this situation reduces the sustainability of the health system over time 38 and introduces challenges for both inflow and outflow regions; in outflow regions, patients’ avoidance of local services weakens these services and reduces bed occupancy rates. The increased workload resulting from the high count of unnecessary visits forces policymakers to allocate more resources to bigger cities. Countries have adopted different policies, like levying increasingly higher taxes on treatment expenses for citizens who move to other regions to receive healthcare services to mitigate the adverse effects of unnecessary patient mobility.39,40
The findings presented here are consistent with those of Italy and China,27,41 which support the existence of quality-driven mobility among patients. These results indicate that, due to the uneven distribution of medical resources and the high count of patients, a considerable volume of money from poorer regions is transferred to wealthier regions, serving as the absorbing force. Patients in underdeveloped regions often need to travel longer distances for medical services, which results in additional transportation and accommodation expenses. A social network analysis method, consisting of centrality analysis and spillover effect analysis, is run, 42 where the fact that patients seeking medical care across provinces are more likely to travel to nearby provinces to access better medical resources prevails.
The maldistribution of specialists, especially in remote regions, is a global issue. This phenomenon raises concerns about equity issues related to the right to equal access to equal care. As for the southern and eastern regions of Iran, new investments in medical staff, advanced technology, and specialization within the hospital sector would help contain patient outflows. The state must improve medical services, like neurology centers, in regions with high insurance coverage, enhance treatment centers for severe diseases, and bridge the gap in medical technology and treatment levels among its provinces, so that patients can receive high-quality medical treatment therein. To address this issue, technical support and resources should be provided for key border regions to facilitate solutions for more structural regional healthcare services, like commissioning high-cost clinical capital equipment in deprived provinces; specialty services development in patient outflow regions, and introducing advocacy actions focused on the role of functional outflow regions to overcome regional disparities at their roots.
Conventional methods, like statistical analysis, focus on identifying affected factors and cannot analyze patient mobility patterns from a geographic perspective, thereby rendering them incapable of assessing service application differences among counties. Results4,20 have treated patient mobility as a binary variable, with options of Yes and No, and have applied traditional statistical methods in healthcare, like researcher-devised questionnaire analysis and logistic regression. These methods facilitate separate analysis but do not accurately entrap geographic patterns of inter-provincial mobility. In this context, PM enables the underlying structure of events in real-world data to be revealed by providing the possibility to consider the implemented paths and offering a convenient manner to visually represent patient mobility patterns, thereby promoting a preliminary understanding of the related correlations.
This PM study is subject to SHI data, with a focus on a group of low-income vulnerable population, where the innate and obvious limitations prevail. Not all the data in the SHI database is reliable; therefore, it does not accurately reflect the actual mobility patterns of patients in the country. Without a doubt, the mobility patterns of the low-income stratum are more likely to be directed towards closer destinations. A more in-depth analysis could be run on another group of Iranian patients (eg, those covered by different types of insurance or varying socioeconomic profiles) to understand the diversity of medical treatment requirements. There are additional challenges associated with a cleaved data collection system, where health insurance models vary among multiple providers. The lack of interoperable patient data systems presents a challenge to data extraction and process analysis. More progress can be made through collaborative working for sharing statistical data. Ministry of Health should work with health insurance companies and all other relevant data owners (including healthcare providers) to develop in-country mechanisms to assure that better and accurate data is available on the cross-provincial patient mobility issue. More practical data collection mechanisms and tools should be developed on a multilevel basis to include demographic data on patients and categories of care accessed, to allow for fuller assessments of use and needs to be made.
Conclusion
In many countries, the issue of patient mobility is gaining momentum as a challenge to both the healthcare delivery and patients’ ability to access healthcare centers. A workflow analysis approach, subject to the PM techniques within the context of patient mobility pattern analysis, is applied here. This study’s contribution lies in providing a deeper and more comprehensive intellectual understanding of patient travel demand in Iran.
The conclusive statements of this study consist of:
The practical application of PM and its potential contributions to patient mobility pattern analysis are assessed through a detailed case study. The PM techniques can automatically reveal real-world processes, thereby exposing the complete and accurate expression of the spatial patterns of patient mobility and medical service resources, which is beyond the capability of traditional statistical methods in the healthcare system. In this context, PM tools enhance data processing and visual analysis, allowing for a deeper understanding of the patient behavior process and medical demand, which in turn enables the provision of proper medical services.
Based on the assessed process models, the Ilam, Alborz, Sistan, (North and South) Khorasan, and Lorestan provinces have the highest count of out-of-province patient travel with mobility rates >0.4. The provinces with the lowest mobility, indicating a proper distribution of medical resources and specialists, are Fars, Isfahan, Khorasan Razavi, Gilan, Yazd, and Qom, respectively, with mobility rates 0.1. The count of travels to receive medicine is low in all provinces except South and North Khorasan and Sistan. No inbound medical visits are recorded in North Khorasan province, although it is exclusively considered a source of outbound medical travel. The top 3 provinces with the highest counts of referrals from other provinces that provide medical services to cross-provincial patients are Tehran, Alborz, and Isfahan, with percentages of 50%, 11%, and 12%, respectively, which account for 73% of the total statistical population in this context. Based on the observed patterns, the distribution of medical specialists appears to be a key factor inspiring this trend. Provinces with a high count of referrals (eg, Tehran, Fars, Khorasan Razavi, and Isfahan) account for 45.4% of the specialist share. 37 The North and South Khorasan, Ilam, Lorestan, Sistan, Kurdistan, Kohgiluyeh, and Bushehr have limited specialists, accounting for 1.8% of the national total. Consequently, efforts should be made to promote a rational balance in medical resource allocation throughout provinces nationwide, thereby eliminating the monopolistic status of a particular province. In terms of prevalence rate, Qom (1379/1 292 283 = 0.001067104) and Gilan (3163/2 530 696 = 0.001249854) exhibit the highest prevalence rates in the country by a considerable margin, followed by Isfahan (4017/5 120 850 = 0.000784440) and Ardabil (785/1 270 420 = 0.000617906), thus making them full-bodied urban candidates for more detailed assessments in the future.
The potential influence of comorbidities on the observed patient mobility patterns is of no concern in this study. It is plausible that the severity of AD is a significant factor motivating migration to central provinces, as local healthcare infrastructure in peripheral areas is often inadequate for managing advanced stages of the condition. The primary focus of this study is on the provincial level; however, potentially significant variations in patient mobility within provinces, particularly between urban and rural areas or among different cities within the same province, would be informative.
Supplemental Material
sj-doc-1-inq-10.1177_00469580261422675 – Supplemental material for Analysis of Patients’ Mobility Patterns: Insights From a Process Mining-Based Longitudinal Study
Supplemental material, sj-doc-1-inq-10.1177_00469580261422675 for Analysis of Patients’ Mobility Patterns: Insights From a Process Mining-Based Longitudinal Study by Mansoureh Yari Eili, Fatemeh Hajialiasgari, Mohammad Hossein Roozbahani, Jalal Rezaeenour, Mahdi Shafiee Sabet, Shima Mohammadi and Alireza Atashi in INQUIRY: The Journal of Health Care Organization, Provision, and Financing
Footnotes
Ethical Considerations
The study was conducted in accordance with the Declaration of Helsinki. This research project was approved by the Research Ethics Committee of Tehran University of Medical Sciences, with the approval ID: IR.TUMS.NIHR.REC.1403.003. The entity of participants (patients’ private information like name, date of birth, etc) in the data set were properly anonymized by the IT department of SHI before the access link were provided for authors.
Consent to Participate
Verbal informed consent was obtained from all individual participants prior to the study. This consent was documented by the researchers using a signed checklist confirming that the participant information sheet was read aloud and understood, and agreement was verbally recorded.
Author Contributions
M.Y.E. performed the computations and analytic calculations. F.H. verified of analytical methods and supervised the findings of this work. M.H.R. carried out the experiment and visualized all results. J.R. developed the theory and contributed to sample preparation. M.S.S. wrote the manuscript with support from M.Y.E. S.M. provided data. All authors read and approved the final manuscript. All authors take responsibility for the integrity of the data and the accuracy of the data analysis.
Funding
The authors received no financial support for the research, authorship, and/or publication of this article.
Declaration of Conflicting Interests
The authors declared no potential conflicts of interest with respect to the research, authorship, and/or publication of this article.
Data Availability Statement
The data that support the findings of this study are available on request from the corresponding author. The data are not publicly available due to privacy or ethical issues.
Supplemental Material
Supplemental material for this article is available online.
References
Supplementary Material
Please find the following supplemental material available below.
For Open Access articles published under a Creative Commons License, all supplemental material carries the same license as the article it is associated with.
For non-Open Access articles published, all supplemental material carries a non-exclusive license, and permission requests for re-use of supplemental material or any part of supplemental material shall be sent directly to the copyright owner as specified in the copyright notice associated with the article.