
Abstract
The healthcare supply chain relies on real-time logistics Management Information System (LMIS). Despite Ethiopia’s adoption of a digital LMIS in 2009, ongoing evaluation of software, infrastructure, and sustainability remains essential for improving performance from users’ and health system’s perspectives. The study aimed to evaluate the performance of the facility version of digital LMIS at public health facilities in the Amhara Region, Ethiopia. An institution-based cross-sectional study was used. Out of 102 surveyed facilities, only 37 implemented the digital LMIS. Data was collected using interviewer-administered questionnaires. Out of 37 facilities using digital LMIS, 28 (75.7%) were functional. The average frequency of use across 27 sub-dashlets was 3.13 ± 0.67 out of 4. End users rated the digital LMIS performance as 3.21 ± 0.43 out of 5 (64.2%). Significant differences in LMIS performance related to organizational support were found due to varying end users’ experience and internet access (P-value < .05). The digital LMIS performance from end users’ perspective was 64.2%, with significant differences in agreement related to health system and organizational support, influenced by internet access and users’ experience.
Introduction
The supply chain system of health commodities, including medicines, vaccines, and health technologies, is a critical component of the healthcare system. 1 A well-functioning supply chain of medicines, vaccines, contraceptives, and other products is key for improving, maintaining, or protecting the health of the needy society.2,3 The effectiveness of the major activities in the health supply chain management system is dependent on the availability of real-time logistics management information system (LMIS) across each level of the health care system.4 -6
As countries continue to expand health programs, the supply chain of health commodities becomes more complex, and user-friendly tools and software packages are needed to support the timely accurate collection and reporting of LMIS data. 7 In the last few decades, the supply chain system has undergone several changes, replacing muscle power with brain power with the help of information and communication technologies.8,9 However, the digital LMIS design and implementation needs demand-based project planning, identification of essential requirements, extensive piloting, deployment, continuous support, and system sustainability.10,11
Automation of LMIS can significantly facilitate supply chain activities by enabling faster data collection, transmission, aggregation, and analysis of data. In addition, it will help reduce human error and allow end-to-end data visibility up and down the supply chain stream.2,8,11 -14 Improved data visibility empowers key stakeholders to make informed decisions, thereby enhancing supply chain management performance and ensuring better commodity availability at public health facilities. It also significantly improves coordination across different program areas by streamlining the flow of information, reducing errors, and ensuring timely and accurate data sharing. Ultimately, this results in improved patient health outcomes.15,16 Countries like Namibia and Malawi use different electronic LMIS tools for health commodities management.16,17 Similarly, Tanzania’s implementation of integrated electronic LMIS (eLMIS) enhanced vaccine availability in contrast to its previous paper and Excel-based system. 18
In Ethiopia, the Integrated Pharmaceutical Logistics System (IPLS) implemented for the management of the health commodities supply chain in the public health system has 3 basic logistics functions: LMIS, inventory control system, and storage of pharmaceuticals. The purpose of LMIS, which is primarily a paper-based system, is to collect, organize, and report supply chain data to other levels in the system in order to make informed decisions Despite improvements in data utilization, the quality of data generated by the manual IPLS-based LMIS was very poor.19 -21
Hence, as part of the Integrated Pharmaceutical Logistics System (IPLS) implementation process, a digital LMIS named Health Commodities Management Information System (HCMIS) was locally developed and implemented in 2009 by USAID/Deliver project and Ethiopian Pharmaceutical Supply Service (EPSS). The HCMIS is designed to manage health commodities, ensuring real-time data visibility, efficient distribution, and effective use of products such as medicines, vaccines, and medical supplies in EPSS and health facilities. Its goal is to improve availability, reduce wastage, enhance service delivery, and contribute to better health outcomes.22,23 As per the Digital Health Activity report for 2021, the facility version of HCMIS (Dagu) is deployed in more than 1000 facilities in Ethiopia. 24
Despite the efforts in the digitalization of LMIS, challenges related to software development project management, infrastructure, interoperability, and sustainability are usually observed in the healthcare system.2,25 -27 Likewise, the HCMIS digital tool used in Ethiopia faced challenges related to interoperability, integration, health system support, data quality, skill gap, and infrastructure.4,21,23,27 -31
On top of that, automation of both the physical flow and the flow of information, as well as the level of automation aligning it with the physical and organizational needs of health facilities, is trouble for Digital LMIS developers. 32 The architectural domains of digital LMIS should consider the type of data needed, the type of records and reports, the responsible body for information recording, channels of reporting, governance, visibility, integration, interoperability, and level of automation.5,33
Evaluating the performance of the digital LMIS tool architecture and its user-friendliness within the context of healthcare system operations is essential for the ongoing improvement and functionality of the system. 31 Hence, this study focuses on evaluating the performance of the facility-version digital LMIS, including its interoperability, functionality, integration, and data quality, from the perspective of end users. The end users’ evaluated the system using a set of Likert scale evaluation tools. This perspective is vital for identifying areas for improvement and ensuring the system’s continued functionality, user-friendliness, and alignment with the needs of healthcare providers.
Methods
Study Area
This study was conducted in the Amhara Regional State of Ethiopia from March 01-31, 2022. Ethiopia, the second-most populous country in Africa and the 12th largest in the world is administratively divided into 12 regional states and two city administrations. Amhara, the second-most populous region in the country, is further subdivided into 12 Zones, three city administrations, and 166 Woredas (districts). As of 2020, the total number of functional health facilities in the region was 5775 including; 87 public hospitals, 873 public health centers, 3565 health posts, 6 private hospitals, and 1244 private clinics. Amhara was selected for this study because it was the first region to implement new pharmacy service and supply chain initiatives as well and eLMIS was implemented in the first phase of the implementation. 6
Study Design
The study employed an institution-based cross-sectional study. This research is part of a larger project focused on assessing the performance of the health commodities LMIS, with its results mainly based on quantitative data analysis
Source and Study Population
The source population for this study was all public health facilities in the Amhara region and all health professionals involved in the health commodities supply chain system. The study population was public health facilities and store managers in selected health facilities. The lead of the digital LMIS database in health facilities was considered for the evaluation.
Sampling Procedure
Health centers and Hospitals in all Zonal administrations, except those with security problems, were considered for sampling. Accordingly, 6 zonal and two city administrations were selected and further stratified into 3 clusters based on the EPSS hubs’ location. Fifteen percent of the facilities were included in the study per the recommendation of USAID’s Logistics Indicators Assessment Tool (LIAT), in which 15% of the facilities were studied. 34 The sample size for each zone and district was allocated based on proportion to size. Accordingly, a total of 102 facilities, including 5 referral hospitals, 4 general hospitals, 10 primary hospitals, and 83 health centers, were included in the study. Finally, sample facilities were selected using a multi-stage stratified random sampling proportionate to the size method. All store managers managing the digital LMIS were considered for the interviewer-administered questionnaire.
Inclusion and Exclusion Criteria
All Zonal Administrations
All public health facilities that have been functional for more than 1 year
All store managers with more than 6 months of experience
Digital LMIS implemented in health facilities
Health facilities were damaged in conflict-affected areas or had security problems during the study.
Digital information management tools used for other health services
Data Collection Process
Both a data abstraction checklist and an interviewer-administered questionnaire (a Likert scale questionnaire with 2 sections containing 27 and 34 items) were used to collect data in health facilities (Supplemental Annexes 1 & 2). The data collection tool was developed based on literature, the Ministry of Health and EPSS monitoring and evaluation tools, and the standard operating manual of the HCMIS software.
Data Quality Assurance
The data triangulation technique was used to ensure the validity of the data. Ten experts in the area face-validated the data collection tools. Data was collected by Health Supply Chain Management MSc students, who received a 2-day training on the data collection tool. The data collection tools were pre-tested in 3 health facilities (1 hospital and 2 health centers). Revalidation was then conducted through a 1-day discussion with data collectors and coordinators, and necessary amendments were made to improve the clarity of the questions. In addition, the tools were changed from a self-administered version to an interviewer-administered version during the data collection process to enhance the validity of the data. Reliability and validity tests were conducted to check the internal consistency of the questionnaire. The study has adhered to the STROBE guideline provided by the EQUATOR Network. 35
Operational Definitions
Data Analysis and Interpretation
The quantitative data were checked for completeness and internal consistency. Then, the data were entered into Epi Info Version 7 statistical software. Finally, the data was exported to SPSS Version 23.0 for better data management and analysis. The data was cleaned by sorting the variables and cross-checking the hard copies for any missing data. The descriptive analysis was summarized using tables and graphs. Bivariate analysis was conducted to assess the performance of the Digital LMIS in relation to health system support, organizational support, and the technical skills of end users. The P-value < .05 shows a statistically significant association.
Ethical Consideration
The proposal was reviewed and approved by the Institutional Review Committee of the school and the Institutional Review Board of the college. The purpose of the study was clearly explained to all participants, and verbal informed consent was obtained after they comprehended the information. The verbal agreement was audio-recorded with the participant’s permission. No individual identifiers were included in the data collection to protect the privacy of the participants, and the data was analyzed in aggregate.
Results
General Information
Out of 102 public health facilities included in the study, only 37 health facilities implemented the digital LMIS. Except for 4 facilities, 33 (89.2%) of them are located in urban areas. Of the facilities that implemented eLMIS, the majority, 22 (59.5%), were Health centers and the rest were Primary Hospitals, General Hospitals, and Referral Hospitals, with a frequency of 9(24.3%), 2(2.0%), and 4(3.9%), respectively. Of these, 16 (43.2%) installed Dagu 1.0, and the rest 21 (56.8%) installed Dagu 2.0. Partners (USAID, JSI, and GHSC-PSM) installed the digital LMIS in 23 (82.1%) of the health facilities, 5 (17.9%) installed with government offices support and the rest 8 (21.6%) installed with joint support. Only 25 (67.6%) health facilities had dedicated computers for eLMIS (Mean = 2.4 ± 2.77). The digital LMIS is installed in all leading health facilities stores, whereas 2 facilities were installed at the offices of the supply chain case team leader and pharmacy head. Only 1 facility is installed at the dispensary and ART pharmacy; however, none are installed at the office of the facility’s chief executive officer or medical director (CEO/MD). Concerning infrastructural support for digital LMIS, 29 (78.4%), 25 (67.6%), 22 (59.5%), 21 (56.8%), and (15 (40.5%) had access to electric power, computer, internet, generator backup, and data backup system, respectively (Figure 1).

Infrastructural access in eLMIS implemented public health facilities of Amhara Region, Ethiopia; March 2022 (N = 37).
At the time of the visit, the eLMIS was functional at 28 (75.7%) health facilities. Report and Requisition Form (RRF) is integrated with eLMIS in 27 (73%) health facilities, whereas Model 19/Health (Model19/H) and Model 22/Health (Model 22/H) transaction tools are integrated with eLMIS in 18 (48.6%) health facilities (Figure 2).

Functionality and integration of eLMIS with transaction and reporting tools in public health facilities of Amhara Region, Ethiopia; March 2022 (N = 37).
Sociodemographic Characteristics of Participants
Among the 37 health facilities that implemented eLMIS, only 27 eligible store managers were available and interviewed using an interviewer-administered questionnaire. Two-thirds of the participants were male, and all of them were pharmacy professionals (Table 1).
Sociodemographic and eLMIS Information of Participants in Public Health Facilities of Amhara Region, Ethiopia; March 2022.

Utilization Status of Dagu Dashlets
The facility version of HCMIS (Dagu) has 4 main database features (Dashlet) for health commodities information management systems. These are activity log (have 5 sub-Dashlets), transaction (2 sub-Dashlets), reports (15 sub-Dahslets), and summary reports (have 5 sub-Dashlets; Figure 3).

Dagu 1.0 Dashboard screenshot (EPSS &JSI, 2018).
A 27-item tool utilizing a 4-level Likert scale, with a Cronbach’s Alpha value of .94 for internal consistency, was employed to assess end users’ frequency of use of different Dashlets in the Dagu dashboard. Accordingly, the overall average mean rating for 27 items was 3.13 ± 0.67 (Supplemental Annex 1). The overall mean rating on the frequency of use of the activity log Dashlet was 3.43 ± 0.49. “Receive” and “Issue” dashlets were the most frequently used features among the activity log Dashlets, with a mean value of 3.93 ± 0.27 and 3.96 ± 0.19, respectively. The store managers claimed that the “Stock Transfer” sub-Dashlet was the least frequently used feature from the activity log Dashlet (mean, 2.78 ± 1.09; Figure 4)

End users’ rating on the frequency of use of Activity Log Dashlet of Digital LMIS in public health facilities of Amhara Region, Ethiopia; March 2022.
The mean frequency of use of the 2 transaction Dashlets, model 19/H and model 22/H, was 3.08 ± 1.35 and 3.04 ± 1.40, respectively. The overall mean rating on the frequency of use of report Dashlet was 3.00 ± 0.78. The most frequently used report sub-dashlet was electronic bin card (mean = 3.63 ± 0.88), and the lowest frequently used sub-dashlet was HPMMR (mean = 2.04 ± 1.43; Figure 5).
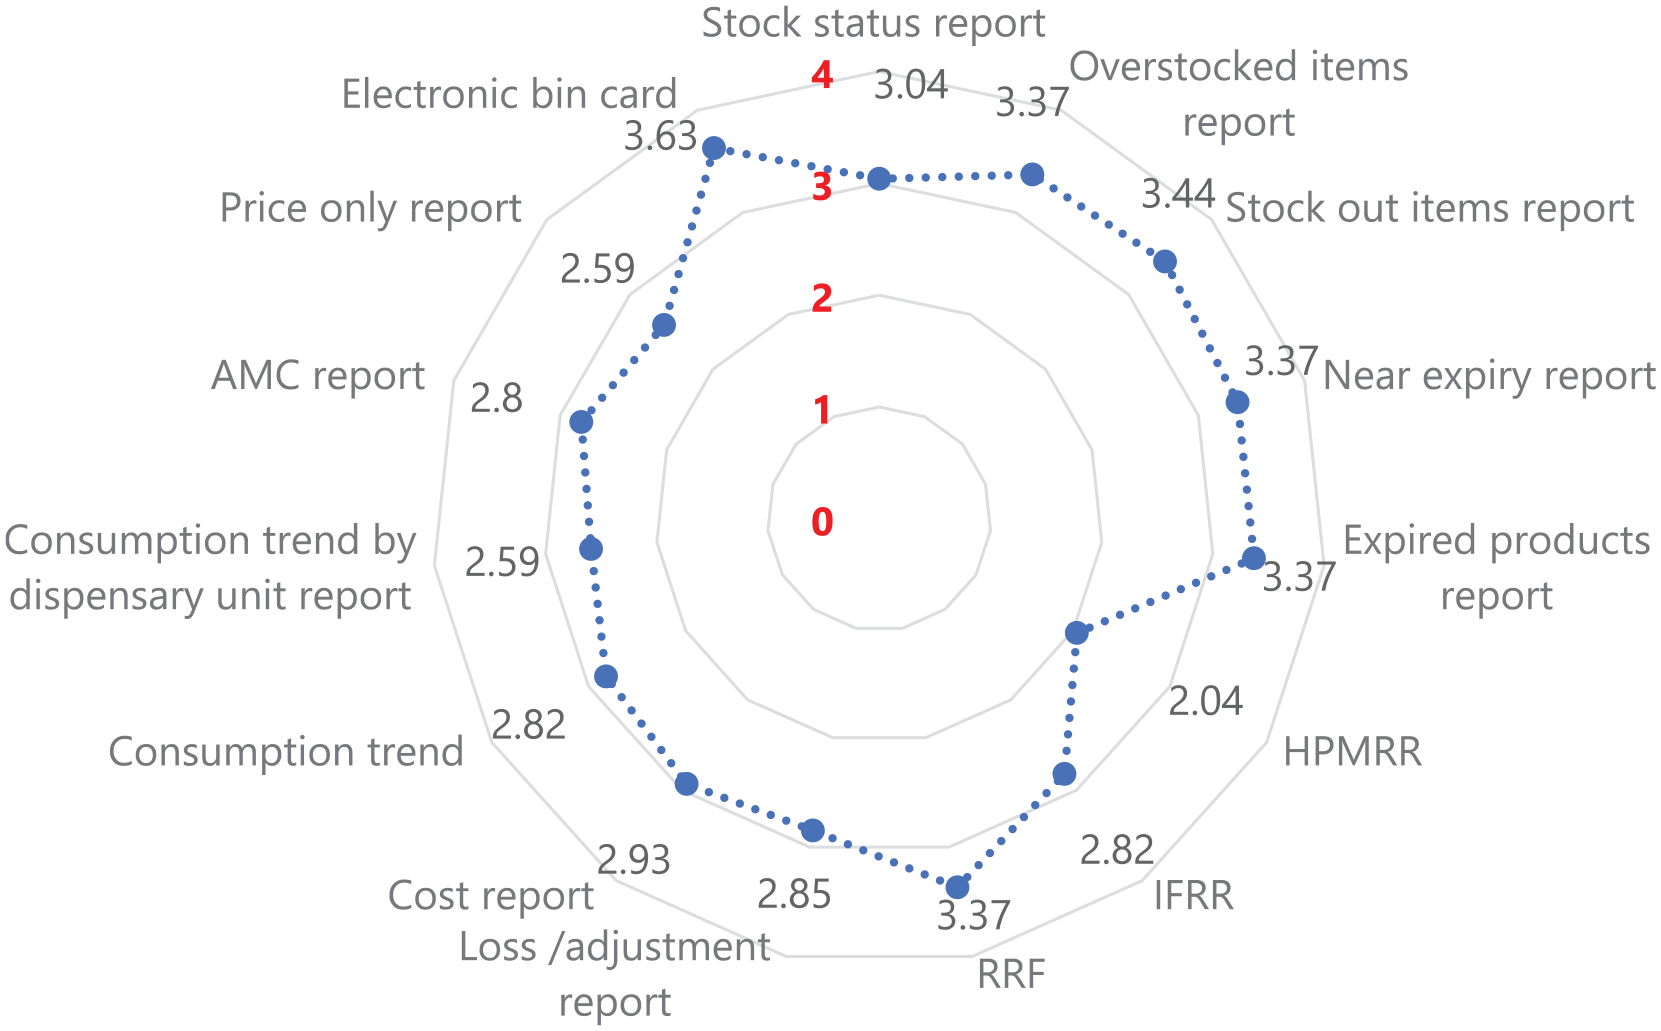
End users’ rating on the frequency of use of report Dashlet of Digital LMIS in public health facilities of Amhara Region, Ethiopia; March 2022.
The overall mean rating on the frequency of use of the Summary Report Dashlet was 3.25 ± 0.96. The most frequently used summary report sub-dashlet was stock expiry summary (mean = 3.41 ± 0.97), and the lowest frequently used sub-dashlet was cost summary (mean = 3.07 ± 1.14; Figure 6).
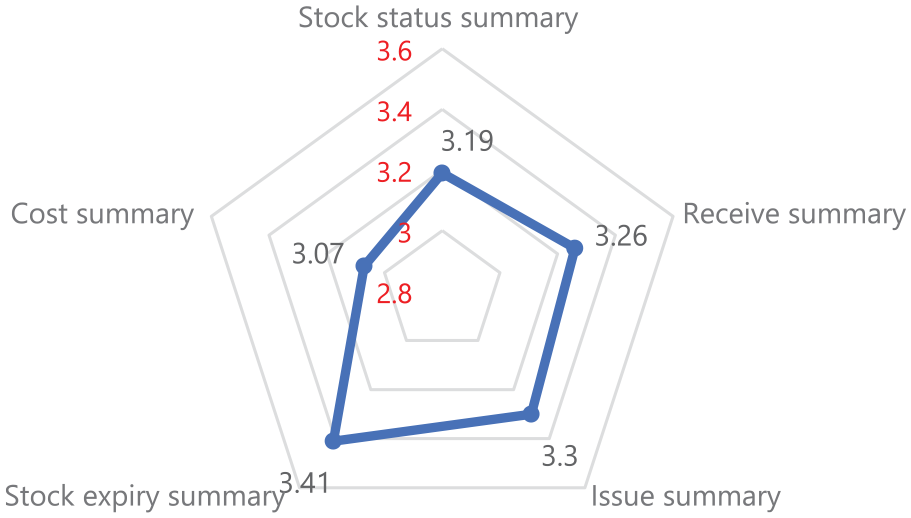
End users’ rating on the frequency of use of Summery report Dashlet of Digital LMIS in public health facilities of Amhara Region, Ethiopia; March 2022.
In addition to rating the frequency of use for the digital LMIS Dashlets, respondents suggested the addition of different data elements in the dashboard, including an alarm for expired items, a database synchronization feature [Dagu 1.0), an Add & Delete feature for items, Unit of items, Model number, and Price markup.
End Users’ Perspective on the Performance of Dagu
End users who directly interact with and utilize the software evaluated the facility-version digital LMIS across various aspects of the system. The evaluation captures users’ experiences, satisfaction, and perceived effectiveness of the digital LMIS by examining different dimensions of the software’s performance.
A 34-item tool utilizing a 5-level Likert scale, with a Cronbach’s Alpha value of .82 for internal consistency, was employed to assess end users’ perspectives on the performance of Dagu. Among the 34 items, the highest mean score was obtained for the statement “The Dagu benefits/improve the facility LMIS performance" with a mean value of 4.60 ± 0.50. In contrast, the lowest mean value was obtained for “The database is linked with higher levels with real-time end-to-end data visibility,” with a score of 1.74 ± 0.98 (Supplemental Annex 2). The overall mean average score of the end user’s rating for the performance of the digital LMIS was 3.21 ± 0.43. End users had a better agreement for digital LMIS performance metrics related to organizational support and the lowest agreement for items related to technical skills, with an average mean score of 3.42 ± 0.5 and 2.53 ± 0.96, respectively (Figure 7).

End users’ perspective on the performance of Digital LMIS in public health facilities of Amhara Region, Ethiopia; March 2022.
Bivariate and Multivariate Analysis
There is a significant mean difference in the frequency of use of transaction dashlets in Dagu 2.0 (Mean = 3.63) and Dagu 1.0 (Mean = 1.93) at a P-value of .02. In addition, there is a significant difference in the frequency of use of transaction dashlets in geographical locations. The mean frequency of use of transaction dashlets in North Shewa Zone (mean = 4.0) was significantly higher than in West Gojjam (Mean = 1.67) at a P-value of .009.
There is a significant mean difference in the end users’ agreement on the performance of the digital LMIS in terms of health system support in different versions. There is also a significant mean difference in the end users’ agreement on the performance of the digital LMIS in terms of organizational support due to differences in end users’ experience and internet access. The end users claimed that the performance of technical skills was significantly better in facilities with internet access (Table 2).
Bivariate and Multivariate Analysis Variables on the Performance of Digital LMIS in Public Health Facilities of Amhara Region, Ethiopia; March 2022.

Discussion
This survey has attempted to evaluate the digital LMIS performance from the end user’s perspective. The study was conducted during the transition period of the digital LMIS from Dagu 1.0 to Dagu 2.0. However, the digital LMIS was functional at three-fourths of the facilities installed. This is due to the infrastructural challenges (computer, internet, power backup) and the partner-dependent governance and technical support system of the database. This is well reflected by the end users and different studies conducted in Ethiopia.29,30,36 Due to challenges with electricity infrastructure, the number of facilities implementing eLMIS in rural areas is limited. Most health facilities implementing the digital LMIS needed to integrate the transaction Dashlets. A notable number of facilities also needed to integrate a critical reporting Dashlet used for periodic supply and re-supply of items. On top of the overload it creates due to manual recording might lead to poor data quality due to loosening integration of all logistics records in the system.3,36
The average mean percentage frequency of use of dashlets in the Dagu dashboard was 78.3%. The report Dashlet has the lowest mean frequency of use. The mean frequency of use obtained from the Health Post Monthly Requisition and Report (HPMRR), a reporting and re-supply system between the health center and health post, was 2.04 ± 1.43. The findings indicated infrequent use of critical Dashlets for routine logistics management information systems. A study 30 in Addis Ababa Health facilities also indicated inconsistent use of the digital LMIS Dashlets. This might be due to multifaceted factors related to infrastructure, the skill of end users, location, and versions of the Dagu, as shown in different studies.21,36 -38
The end users highly agreed on the benefit of the digital LMIS in improving supply chain performance. However, their agreement on integrating the digital LMIS across the healthcare system and its end-to-end data visibility could have been much higher. This aligns with the Federal Ministry of Health (FMOH) report, which boldly noted the integration and interoperability of digital tools as a primary challenge for the healthcare system. 27 This could pose practical challenges related to data integration, duplication of efforts, and data quality issues, which ultimately affect health system decision-making. Even though FMOH developed a national e-health architecture in its information revolution roadmap, which aimed to transform the integration, interoperability, and standardization of digitalization in the healthcare system, 39 it is not yet fully implemented due to multifaceted factors. 27 The information revolution and digitalization are some of the strategic initiatives stipulated in the health sector transformation plan II of the country, 40 and there are efforts by the Digital Health Activity to streamline digital health across the healthcare system. 24
End users had a better agreement for digital LMIS performance metrics related to organizational support and the lowest agreement for items related to technical skills. This aligns with a recent technology acceptance model study of HCMIS in which the technology-task fit model showed skill gaps among end users. 36 This indicates the need for continuous capacity-building training and supportive supervision. There is a significant mean difference in the performance of digital LMIS across facilities due to internet access and the implementation of the Dagu version. It is crystal clear that internet access is a critical factor for data synchronization across the supply chain system, especially for Dagu version 2.0.24,27 Overall, the performance of the digital LMIS in health facilities in the Amhara region requires improvement. Challenges related to infrastructure, skills, governance, integration, and interoperability need to be addressed through system revitalization and continuous enhancement. The low number of facilities using the eLMIS, compared to the total sample, may affect the inferential analysis and could be considered a limitation of this study.
Conclusion and Recommendation
The overall performance of the digital LMIS in terms of the frequency of use of dashlets was 78.3%. The highest mean score was obtained from the activity log Dashlet, and the lowest was from the reports Dashlet. There is a significant mean difference in the utilization status of transaction Dashlet in the different versions of Dagu and the facility’s location. The overall mean average score of end users’ agreement on the performance of the digital LMIS was 64.2%. The highest mean agreement score was obtained for organization support, and the lowest was for technical skills. In the end, there is a significant mean difference in users’ agreement on the performance of the digital LMIS in terms of health system support in different versions and in terms of organizational support concerning internet access and end users’ experience. The study’s findings indicated the need to revitalize the digital LMIS performance, develop end users’ technical skills, and scale up the system to Dagu version 2.0.
Supplemental Material
sj-docx-1-inq-10.1177_00469580251319086 – Supplemental material for End Users’ Perspective of Digital Logistics Management Information System (eLMIS) Performance at Public Health Facilities of Amhara Region, Ethiopia
Supplemental material, sj-docx-1-inq-10.1177_00469580251319086 for End Users’ Perspective of Digital Logistics Management Information System (eLMIS) Performance at Public Health Facilities of Amhara Region, Ethiopia by Zelalem Tilahun Mekonen, Denny J. Cho, Naoufel Cheikhrouhou, Karl Blanchet and Teferi Gedif Fenta in INQUIRY: The Journal of Health Care Organization, Provision, and Financing
Footnotes
Acknowledgements
Dr. Andre Kreie, Dr. Daniel Zapata, Dr. Julia Kleineidam and Jorida Gjergji from the Kuehne Foundation deserve special appreciation. The second appreciation goes to the Geneva Centre for Humanitarian Studies and HES-SO for jointly hosting the first Author. Lastly, the Department of Pharmaceutics and Social Pharmacy, Addis Ababa University, is acknowledged for its administrative support during the data collection.
Contribution
ZTM, TGF, and DJC conceived the idea and its study design. ZTM developed the proposal and conducted the data collection. TGF and DJC supervised the quality of the data collection. NC and KB mentored the data analysis and write-up. TGF, NC, and DJC did the final editing of the manuscript. All authors read and approved the final manuscript.
Data Availability Statement
Declaration of Conflicting Interests
The author(s) declared no potential conflicts of interest with respect to the research, authorship, and/or publication of this article.
Funding
The author(s) disclosed receipt of the following financial support for the research, authorship, and/or publication of this article: This study is a part of the PhD project by the first Author, who was financially supported by the Kuehne Foundation (KF).
Institutional Review Board Statement
This study was approved by the Ethical Review Committee of the School of Pharmacy on January 31, 2022 (Protocol No: ERB/SOP/399/14/2022) and the Institutional Review Board of College of Health Sciences, Addis Ababa University on February 23, 2022 (Protocol number: 007/22/SoP).
Informed Consent Statement
Verbal informed consent was obtained from all participants involved in the study. The verbal agreement was audio-recorded with the participant’s permission.
Supplemental Material
Supplemental material for this article is available online.
References
Supplementary Material
Please find the following supplemental material available below.
For Open Access articles published under a Creative Commons License, all supplemental material carries the same license as the article it is associated with.
For non-Open Access articles published, all supplemental material carries a non-exclusive license, and permission requests for re-use of supplemental material or any part of supplemental material shall be sent directly to the copyright owner as specified in the copyright notice associated with the article.