
Abstract
This convergent parallel mixed-methods study examined how a primary care value-based payment (VBP) model affected patient health care use and captured implementation experiences from select clinics. Focusing on outpatient care as a key step to improving outcomes, we used a difference-in-differences model to compare outpatient utilization between PCPM (the VBP model) and non-PCPM clinics, and semi-structured interviews with a subset of participating clinics to explore implementation efforts on the ground. We identified our quantitative study population (cases N = 68 807; control N = 71 695) and outcomes from Oregon’s All Payer All Claims (APAC) data system and, qualitatively, we conducted 12 interviews with operational/administrative staff at 7 PCPM clinics. Our findings indicated that PCPM patients experienced greater connection to primary and specialty care—both the proportion who used care and the average amount of care used per member—relative to the control group. Primary care use rose by 4.2 percentage points (95% CI: 3.3%, 5.1%; P < .001), and specialty care by 1.1 points (95% CI: 0.4%, 1.8%; P = .002). Among users, primary care visits increased by 136.9 per 1000 member months (95% CI: 107.2, 166.6; P < .001), and specialty care by 32.1 (95% CI: 10.5, 53.7; P = .004). Qualitative findings added further context: (1) staff communication about PCPM efforts connects directly to improvements in care delivery and patient outcomes; (2) success depends on care team staff being involved in the creation of new workflows and processes; and (3) access to program data helps to identify care gaps and improve patient care delivery. We concluded that care team staff engagement in VBP models is strengthened by making the connection between VBP and direct improvements to patient care. Models that motivate staff can lead to increased connection to primary and specialty care among the clinic’s patient population.
Although the evidence for the effectiveness of VBP’s in primary care is mixed, VBPs in primary care could improve care delivery by supporting critical tasks that are traditionally not funded under fee-for-service payment.
In addition to focusing on a VBP in primary care, our study differs from most previous research due to our choice of connection to outpatient care as an outcome. We found that implementing a VBP program in primary care led to stronger patient connection to primary and specialty care relative to the control group. Staff engagement was necessary for successful implementation and was supported by communicating the potential benefits on patient outcomes and inviting staff into the design of new workflows.
To ensure needed buy-in from care team staff, clinics participating in VBP programs can emphasize benefits for patient care and outcomes rather than financial impact. Payors can also consider making data and technology or data-related technical assistance available, and providing payments that can support positions needed for team-based care when designing primary care VBPs. The observed effect of this primary care VBP on specialty care utilization also points to the need for system wide VBP strategies with mutually reinforcing models in primary and more specialized care.
Introduction
Total health spending in the United States (U.S.) more than doubled between 1970 and 2019, growing from 6.9% to 17.7% of gross domestic product (GDP) 1 ; yet these surging health care costs come without clear benefits to quality of care. To improve quality and control costs, many payors are shifting away from a fee for service (FFS) system that reimburses based on quantity of care provided toward value-based payment (VBPs) models meant to incentivize provider performance based on measures of health outcomes. 2
VBPs vary in the degree of clinical and financial risk for the provider, 3 and include a variety of arrangements, from FFS with bonuses for quality and pay-for-performance [P4P] models4 -6 to population-based payments such as global capitation (e.g., federal Comprehensive Primary Care Payment Initiative [CPC and CPC+]). These programs can be applied to a wide range of health care services and settings, 3 and there is growing excitement for VBPs in primary care specifically because of the potential for these programs to support the critical tasks associated with delivering primary care services that are traditionally not funded under FFS models, including “interdisciplinary teams, care coordination, self-management support, and ongoing communication.” 7 In theory, providing support for these critical tasks can improve the delivery of primary care services, which can in turn improve patient health and decrease use of acute health care.
Previous studies have explored the impact of VBPs in primary care on a variety of patient health and health care outcomes, including chronic disease management, 8 use of preventive care such as vaccinations or cancer screenings,8,9 and quality measures such as avoidable emergency department visits or hospital readmissions.10 -12 However, evidence from these studies is mixed.8,10,12 -14 For example, a 2016 systematic review showed a positive impact of P4P measures in primary care on disease management for conditions including hypertension, coronary heart disease, and diabetes 8 ; a separate analysis of a P4P program across multiple states found that the impact of the program on different health care quality measures varied by state 11 ; and a 2018 systematic review found no impact of various primary care redesign initiatives on Medicare costs, emergency department visits, and hospital admissions and readmissions. 10 Further, there is, to the best of our knowledge, no previous research exploring the impacts of a primary care VBP model on broader outcomes such as use of outpatient care more generally.
The inconsistent evidence for VBPs in primary care may be due in part to the factors that distinguish primary care from other types of health care. Although primary care providers (PCPs) serve as the first point of contact for many within the health care system, primary care has suffered from decades of underinvestment and a low provider supply and high turnover, among other problems.7,14 -16 Underinvestment, relatively low financial margins, and increased expectations and measurement requirements have made it difficult for PCPs to move toward payment models that provide incentives for innovation and continuous learning/process improvements.7,10,11,13,14,16 -18 Primary care clinics typically also lack levers to influence their patients’ health costs beyond their clinic or to influence hospital and specialist behaviors, 7 making it challenging for primary care clinics to successfully perform within traditional VBPs.
It is therefore necessary to continue exploring the impacts of VBPs designed specifically for primary care settings to better inform future financial programs that encourage quality improvements and innovation. Given payors and regulators’ continued interest in VBPs, it is also important to investigate what factors facilitate or impede successful implementation of VBPs in primary care, and the mechanisms by which these efforts lead to improved outcomes. This convergent parallel mixed-methods study explored the impact of a VBP in primary care implemented by an Oregon-based payor on patient health care utilization and captured the implementation experience of a subset of participating clinics. Because the first step to improving patient outcomes is to ensure patients are connected to outpatient care, this study specifically assessed the impact of the VBP on outpatient care utilization. We also explored the elements of the VBP program implementation at participating clinics in an effort to identify components of the implementation that supported success or created challenges.
Methods
Study Setting
The Primary Care Payment Model (PCPM), the primary care VBP model assessed in this study, was designed and implemented by a large non-profit insurance company in Oregon serving Medicaid and Medicaid-Medicare beneficiaries in multiple geographic areas. Oregon has state-level standards and a tiered recognition program for patient-centered primary care homes (PCPCHs); the state estimates that about two-thirds of primary care clinics in the state have been recognized as of February 2023. 19 As a Medicaid plan, the payor that designed the PCPM is subject to several VBP initiatives and obligations, including: (1) an incentive program in which approximately 3.5% of total capitation revenue is withheld and earned back through performance on a set of access, quality, and outcome metrics 20 ; (2) a requirement beginning in 2020 to provide per-member-per-month (PMPM) “foundational infrastructure” payments to recognized PCPCHs in their network, with higher payments for higher tiers of recognition 20 ; and (3) an expectation to annually increase the proportion of total provider payments that are in the form of a VBP, from a minimum of 20% in 2020 to 70% in 2024. 20
PCPM Background
Implemented since 2015, PCPM offers clinics bonus payments for quality performance, making it a category 2C payment model as described by the Health Care Payment Learning and Action Network (HCP-LAN) framework. All PCPM clinics must be recognized as a PCPCH (as described above). PCPM clinics are eligible to receive a risk-adjusted PMPM quality incentive payment for the payor’s assigned patients. Clinics report on self-selected quality measures; payment level is determined and adjusted based on timely reporting and performance. 21 PCPM specifically supports primary care transformation through investing in services that are not covered by FFS billable codes in an effort to shift care to outpatient services and away from acute services.21,22 The most commonly selected PCPM priority measures as of 2020 included Colorectal Cancer Screening, Effective Contraception Use, Eligible population with a Flu Shot, Alcohol & Drug Misuse, and Screening for Depression and Follow Up Plan. 22
The payor makes programmatic changes annually based on feedback from participating clinics as well as state and national VBP targets and climate. The most substantial change to the PCPM prior to the beginning of this study occurred in 2017, with the inclusion of uniform benchmarks for specific quality measures (as opposed to improvements over baseline) and the move to risk-adjusted payments. Approximately 130 clinics across Oregon participate, representing urban and rural areas, large systems, independent providers, provider associations, and federally qualified health centers (FQHCs). In addition to primary care, some participating clinics also offer onsite behavioral health care.
Study Design
This study used a convergent parallel mixed methods design, in which quantitative and qualitative data are collected simultaneously but analyzed separately, and then the results are compared and integrated. Measures of health care utilization were assessed from 2016 through 2019 (described in more detail below); however, these data were obtained in 2022 at the same time the qualitative interviews with clinic staff were being conducted. The study has followed the STROBE guidelines.
Data, Measures and Variables
Quantitative Data
The primary data source for our analysis was administrative claims from the Oregon All Payers All Claims (APAC) data system. APAC data contains enrollment information, demographics, and all claims for health care services for individuals insured in the state of Oregon. For this analysis, we included adults 18 years of age and older who were covered by the large non-profit insurance company and received health care services between 2016 and 2019. We focused our analysis on the iteration of the PCPM that began in 2017; 2016 was therefore included as a potential pre-period year. We did not include data from 2020 or subsequent years in order to avoid biasing results due to the impact of the COVID-19 pandemic on health care utilization, especially non-acute health care utilization.
From the APAC data, we constructed our outcome measures of primary care, specialty visits, and outpatient mental health utilization for all individuals included in our study. Outpatient encounters were classified into 3 mutually exclusive categories based on provider taxonomy, procedure (HCPCS/CPT) codes for evaluation and management (E&M) and hospital outpatient clinic visits, and diagnosis (ICD-10) codes for mental and behavioral health conditions. Primary care visits required a primary care provider taxonomy and qualifying procedure codes, excluding claims with mental health diagnoses. Specialty care visits required a specialty provider taxonomy and qualifying procedure codes, also excluding claims with mental health diagnoses or procedures. Outpatient mental health encounters required both a qualifying mental health diagnosis and procedure code, and, where applicable, a recognized mental health provider taxonomy. Each measure of outpatient care was constructed as both binary (eg, had a visit or did not have a visit each year) and as numeric (number of visits per month). Our independent variable was clinic participation in the PCPM. We linked APAC data to PCPM program data using Provider IDs to identify participating clinics. We additionally used APAC data to construct our individual-level measures of age, sex, race and ethnicity, language, urban or rural residence, geographic region, and medical complexity defined using the Chronic Illness Disability Payment System (CDPS). 23 The CDPS algorithm predicts future healthcare costs using diagnosis codes, age, and disability status from administrative claims and enrollment data and is commonly used as an indicator of medical complexity.
Qualitative Data
In summer 2022, we conducted semi-structured interviews with operational or administrative staff (including roles such as Chief Operations Office, Chief Financial Officer, Quality Director, Clinical Manager, Data Analyst, and HR Manager) at 7 PCPM clinics. To recruit clinic participants, we introduced the study at meetings regularly attended by PCPM clinics; following the meetings, clinics could reach out to the research team to express interest. We also identified clinics for targeted outreach to ensure sample diversity (eg, location, size, PCPM start date, etc.). Once a clinic agreed to participate, we worked with a clinic leader to invite the appropriate staff to participate in interviews. Potential interviewees who had knowledge of the funding mechanism were invited to participate in the study via email and text messages. Once recruited, interviews were conducted by phone or by video call and lasted 30 to 60 min. Prior to conducting interviews, participants were given an information sheet that detailed the elements of consent. Verbal consent was then obtained from each participant before the interviews commenced.
We created a semi-structured interview guide (Supplemental File A) that focused on the clinic’s motivation to participate in the PCPM, benefits to clinic staff and patients, financial investment and return, clinical innovations related to PCPM efforts, and motivation to participate in other VBPs. The Oregon payor implementing the PCPM reviewed and made additional suggestions for the guide. In total, study team members conducted 12 interviews with 13 clinic staff who were most familiar with the funding mechanism from 7 clinics (1 interview was conducted with 2 study participants). We interviewed everyone who agreed to participate and stopped recruiting when we reached saturation in the themes emerging from interviews.
Analysis
Quantitative Analysis
We first limited our study population to patients of the large non-profit insurance company. We then attributed each individual to the clinic that provided the plurality of their primary care visits for each year in the study period; individuals could be attributed to different clinics in different years but were attributed to only 1 clinic in any given year. Individuals attributed to PCPM clinics formed the intervention group; all individuals who had at least 1 primary care visit during the study period but were not attributed to a PCPM clinic served as a comparison group.
We tested the association between PCPM enrollment and health care utilization using staggered difference-in-difference models, as outlined by Callaway and Sant’Anna. 24 Index dates for participating clinics were assigned based on their first month of participation in the PCPM program, and individuals attributed to PCPM clinics were required to be continuously enrolled for 12 months before and after the index date of the attributed clinics. Individuals in the comparison group required a similar enrollment length, with index dates centered on the first 24-months of continuous coverage by the large non-profit insurance company. Because the majority of individuals (86%) were attributed to clinics that implemented the PCPM in early 2017, this method resulted in a similar distribution of index dates between the case and control groups.
Treatment effects were estimated using the staggered DID approach, leveraging variations in treatment timing to analyze PCPM enrollment effects across clinics and time periods. Group-time average treatment effects (ATT) with bootstrapped standard errors were calculated using the did 25 package for R to account for potential heterogeneity and dynamic effects. Individuals who were never treated functioned as controls. All models included adjustments for medical complexity. Group-time ATTs were aggregated across post-intervention periods and PCPM implementation dates to obtain an overall ATT estimate. The parallel trends assumption was evaluated by analyzing ATTs grouped by months since PCPM implementation, with no effect identified during the pre-treatment period. clinic
We constructed separate models for each outcome measure. We additionally conducted several subgroup analyses, including by FQHC status, region, and payment level, to assess for possibility of heterogeneity in the treatment effect across clinic characteristics. All estimates are reported in terms of the absolute changes in the original units of measurement from baseline. P < 0.05 was considered statistically significant. All analyses were performed using R Statistical Software (v4.2.2). 26
Qualitative Analysis
Interviews were audio recorded, transcribed by a HIPAA-compliant, third-party site and were coded using ATLAS.ti version 22. A team-based thematic analysis approach was used to code and analyze the interview data.27,28 Two trained qualitative researchers collaboratively developed a codebook using a mix of deductive codes from the interview guide and inductive codes that emerged following an initial review of a subsample of interviews. Half (50%) of the interviews were double-coded, and the team would meet regularly to test and update the codebook using a consensus-based decision-making process to ensure reliability of code use across all transcripts and to reduce potential bias from the characteristics of the research team. We prepared code summaries and examined patterns among and across code groups to identify themes about experiences with PCPM and VBPs more generally, as well as barriers and facilitators to PCPM implementation.
Results
Quantitative Results
Characteristics of the clinics implementing the PCPM during our study window are shown in Table 1. The majority of participating clinics were part of a larger health care system; slightly over a quarter were FQHCs. Two-thirds of clinics were located in the Portland Metro Area. Only 20% of participating clinics had implemented the PCPM in 2017; however, these were the larger clinics in the sample, and therefore served the majority (86%) of patients in our case group.
Characteristics of the Participating Clinics.

n (%).
Characteristics of our quantitative sample are shown in Table 2. Cases were slightly older than controls, and more likely to be female and White. There were no substantive differences between the 2 groups by language or geography. Cases had higher rates of utilization across all domains of care.
Characteristics of the Patient Study Population.

Mean and standard deviation.
Member month.
Figure 1 displays the unadjusted rates of utilization and percent of the population with any primary care, specialty care, and outpatient mental health utilization across the study period. Access and use of care was higher in the case group across all domains of outpatient care group during the 12 months leading up to clinic enrollment in PCPM.

Unadjusted rates of utilization (A) and percent of the population (B) by utilization type.
For the difference-in-differences analysis of the proportion of patients who used each type of outpatient care at least once, we found a greater change from baseline to follow-up among cases compared to controls (Table 2). For cases, the proportion of patients who used primary care increased by 4.2 percentage points above what would have been expected given the increase for controls (95% CI: 3.3%, 5.1%; P < .001); for specialty care this increase was 1.1 percentage points (95% CI: 0.4%, 1.8%; P = .002). There was no significant difference between the 2 groups in the change to use of outpatient mental health care.
For the difference-in-difference analysis of the number of visits among patients who used care, we found a greater change from baseline to follow among cases compared to controls for primary care and specialty care (Table 3). For cases, patients who used primary care had an increase of 136.9 more visits per 1000 member months above what would have been expected given the increase for controls (95% CI: 107.2, 166.6; P < .001); for specialty care this increase was 32.1 visits per 1000 member months (95% CI: 10.5, 53.7; P = .004). There was no significant difference between the 2 groups in the change to use of outpatient mental health care.
Difference-in-Differences Analysis of Proportion of Cases and Controls Receiving Each Type of Outpatient Care.
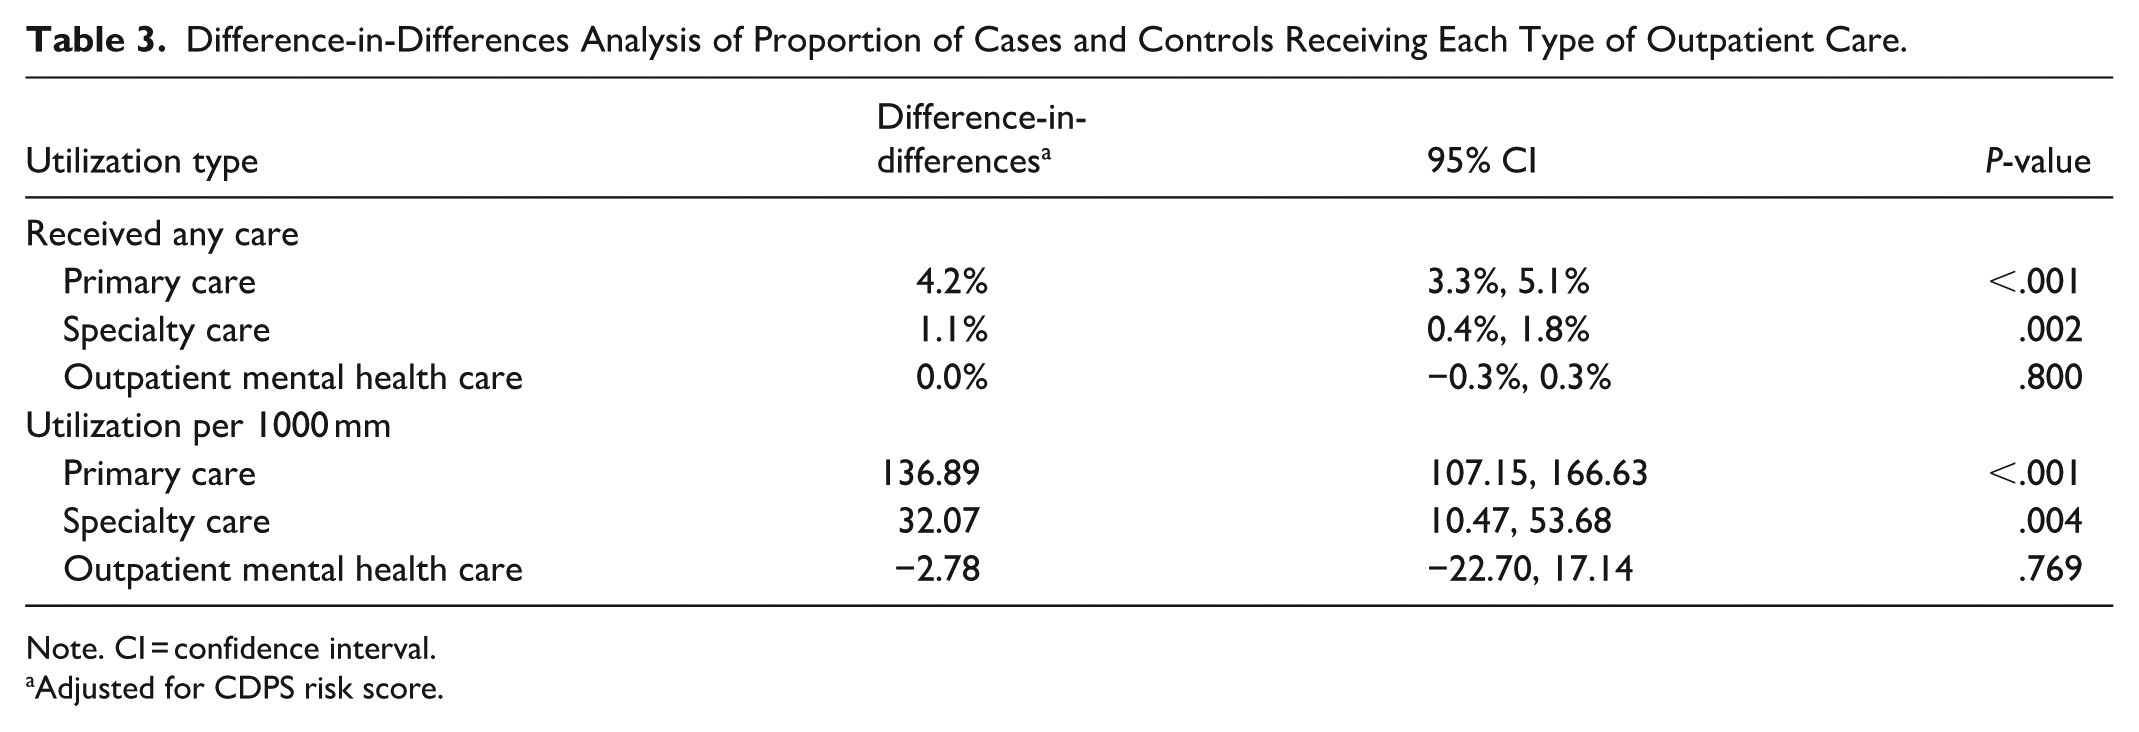
Note. CI = confidence interval.
Adjusted for CDPS risk score.
Subgroup analyses among FQHCs and by clinic region and payment level showed similar results as the overall model (data not shown).
Qualitative Results
Eleven clinics were invited to participate in the qualitative portion of the study; 7 clinics (6% of total PCPM clinics) responded. Overall, the clinics represented both urban and rural locations (43% and 57%, respectively), and were evenly spread across PCPM start dates (29% started in 2017, 29% in 2018, and 43% in 2019) and FQHC status (43%); the sample was generally reflective of characteristics of the participating clinics overall (shown Table 1). The findings of this study centered around 3 major themes, related to improvements in care delivery and patient outcomes as primary drivers for care team and other clinic staff to participate in PCPM efforts.
Theme 1. Staff Communication About PCPM’s Connection to Improvements in Care Delivery and Patient Outcomes Motivates Staff Buy-In
Implementation of PCPM at the clinics was a complex process requiring changes at multiple levels of care delivery and therefore additional work. A major strategy used by the clinic leadership to generate staff buy-in was to emphasize the program’s potential to improve care delivery and subsequent patient outcomes. Even though PCPM metrics were often selected prior to communicating to staff about PCPM, clinic leadership avoided introducing PCPM solely as new metrics or payments tied to targets, as this was seen as demotivating for care team staff. Instead, operational and administrative staff shared how PCPM could center the patient in care workflows, bring a focus to social determinants of health, and create opportunities for new ways to deliver care and work with patients, including hiring new positions that focus on care coordination and social needs. Clinic leadership reported that staff were more motivated to implement PCPM and make changes in their workflows once they began to see improvements in patient engagement and care processes, despite the high documentation burden.
We sat down with our medical leaders and found really the measures, the things we want to focus on to make sure our patients are being taken care of properly. That’s really how we’ve tried to package it to all of the staff, is that this is what’s best for our patient in a lot of different ways. - Health Center Director of Quality Improvement, Clinic 5
Highlighting the potential for PCPM to benefit the clinic’s entire patient population was an additional selling point, because care team staff could see that their efforts were not directed at just one payor’s patients. This sentiment, that their efforts were directed at all the patients at the clinic, regardless of payor type, was consistent across clinics, regardless of when they first started participating in PCPM and the clinic’s location.
I’m not grumbling, you know about oh, having to report this because sometimes you’re like, ‘Oh, this is hard, but this does make us better’. I usually approach it in that way, that this is something that will help us to serve our patients better.—Health Center Executive Manager, Clinic 7 This is something that [the metrics team] are holding ourselves accountable to. But that’s not necessarily the way we want to communicate it to the staff, because not all of our patients are Medicaid patients, not all of our patients are [the payor’s] patients. When we’re prioritizing the care of this one group and having these lists to really specifically outreach to certain people, because we know that it’ll increase the numbers for this particular report, that doesn’t land well. It seems like it could perpetuate a different treatment for the rest of our patients. So [we’re] really trying to step back and revisit the way that we’re talking about it and how we prioritize the work.—Health Center Director, Clinic 6
Theme 2. Care Team and Other Clinic Staff Must be Involved in Creating New Processes Related to PCPM
At least initially, implementation of PCPM prompted changes in workflows, EHR processes, or documentation clinics at many clinics in order to make the quality improvements necessary to meet PCPM performance targets. Each new workflow required resources and staff time for training, documentation, data and quality review, more time for iteration and therefore less time for patients. To avoid potential resistance from staff related to implementation burden, clinic leadership emphasized that that staff needed to be meaningfully engaged in designing and implementing new workflows and processes. This included care team staff (eg, those seeing patients), frontline personnel (eg, those doing documentation), as well as other staff (eg, data or population health teams) who provide support from the back of the house. Involving staff from across a range of roles in co-designing new workflows not only created the opportunity to tailor changes to the clinic’s unique patient population but also ensured alignment across the clinic, care team buy-in, and accountability across the care and quality improvement processes. Although this required more coordination up front, interviewees reported that clinic staff were more willing to try new workflows and participate in trainings and quality improvement cycles when they were involved in designing them.
Health centers meeting their PCPM targets consistently mentioned having strong internal operational and administrative support, where planning was intentional and included many teams across the health center and there was infrastructure and a culture that supported improvement efforts
Then we’re taking time in our clinic team meetings, which are just short weekly meetings, to actually do some peer chart audits and do some digging into process and checking in on it. Involving everyone at every level of clinical care in understanding what’s required and how that’s reflected in the reports. . . .[Team member(s)] will reach out and say, hey, this is what we’re doing. I see this opportunity for improvement. Can I do this? Can I work on this?—Health Center Director, Clinic 2
Theme 3: Access to PCPM Metric Performance Data Helps to Identify Care Gaps and Improve Patient Care Delivery
Access to granular program or performance data and a strong reporting infrastructure was an important part of PCPM implementation in many clinics, where staff discussed leveraging data and technology to identify patient care gaps and prioritize patient populations, improve workflows, conduct patient outreach, and track quality improvement progress. Noticeably, staff were using data not solely for reporting purposes, but also to demonstrate the impact on patient care and identify opportunities to improve workflows to address care gaps. Clinic staff described how champions within the clinic or among providers play a pivotal role in spearheading process changes and enhancing workflows. These champions drive initiatives such as implementing gap analyses and facilitating workflow improvements. Key actions include allocating time for weekly meetings to foster collaboration, conducting peer chart audits, and reviewing screening rates to inform the development of process flows that focus on targeted outreach and intervention. Several clinics reported establishing centralized scheduling and registration systems and appointing dedicated Medical Assistants responsible for routinely reviewing charts to identify patients in need of screening and referral.
With access to program data, some interviewees however, felt that patients who were the focus of PCPM metrics (eg, those with chronic conditions like hypertension or diabetes) benefited most from the program, as they were identified for targeted outreach and engagement. These interviewees noted that the metrics may draw attention away from some groups, such as the clinic’s culturally specific patient populations. However, the majority of the clinics described PCPM as benefiting all patients because new workflows and processes were implemented across the clinic. Some clinics with more advanced data infrastructure reported a desire for more comprehensive member level data to fully understand their patient population.
Then really tracking that information, it helps us see where we are having a dip, and we’re seeing a spike in our uncontrolled diabetic patient population. That’s like, ‘Okay, we need to make sure that we’re bringing these people in. We’re sending them reminders and really doing targeted focus on that when we’re seeing a blip on our radar.’—Health Center Project Coordinator, Clinic 3 I think the biggest way that it [benefits] is probably through accountability and from a leadership standpoint, supporting a culture of data awareness and process improvement. As a result of that, staff are wanting to improve processes so that things are smoother for patients and patients aren’t slipping through the cracks with different medical needs.—Health Center Director, Clinic 2
Discussion
In this study, we assessed the impact of a primary care VBP model on outpatient care utilization and identified components of implementation that support success or create challenges in connecting patients to outpatient care. We used a staggered difference-in-differences model to assess changes in utilization between PCPM and non-PCPM clinics, and semi-structured interviews with a subset of participating clinics to explore implementation efforts on the ground. We found patients at participating PCPM clinics had statistically significantly higher use of primary and specialty care. Additionally, we found that clinic staff involvement in VBP efforts is critical. Clinics successfully engaged staff by presenting PCPM in terms of its potential benefits to patients and inviting staff into process improvement efforts. We theorize that these staff engagement and motivation efforts then led to the resulting increase in primary and specialty care utilization.
Our study adds to the growing literature on the impacts of VBPs on patient outcomes. Previous research has shown mixed results, which may be due to the varied nature of VBPs: they can take many forms, be implemented in multiple types of medical settings, focus on different specific populations, and prioritize a wide range of clinical quality measures.12,29,30 However, even when narrowing to implementation of P4P models within primary care settings in the U.S., results remain mixed, 8 with only a few studies showing a positive impact on patient outcomes31,32 and most of the observed impact being on process measures.33 -38
In addition to focusing on a VBP in primary care, our study differs from most previous research due to our choice of outcome. Research on the impact of VBPs, particularly P4P models, on patient outcomes often focuses on either the specific measures being incentivized or on costs of care.8,29 In fact, a substantial amount of research on VBPs in primary care focuses specifically on the impact on diabetes management and outcomes.32,34,35,37,39 Yet one major advantage of VBPs in primary care is their potential to support primary care more holistically, providing funding for aspects such as care coordination, outreach, and interdisciplinary teams. 7 Thus, choosing a more holistic measure of “value,” namely connection to outpatient care, allows us to more broadly assess the impact of the PCPM on patients, rather than focusing narrowly on the impact of the PCPM on the incentive measures chosen by each clinic. 11
Previous review articles suggest some key features of VBPs that facilitate implementation success, such as provider engagement and quality improvement support, 30 inclusion of team-based and community-oriented care, 4 and addressing the additional administrative burden. 40 Our study affirmed some of these features as influential components for PCPM implementation within primary care clinics, particularly those that focus on engagement and motivation of the staff and center the patient benefits. These features may have led to staff’s increased willingness to participate in the necessary quality improvement efforts, cross-team collaboration and problem-solving, and new administrative and documentation tasks which require time and resources to learn, resulting in stronger care connections for PCPM patients.
The fact that our study did not find an impact of the PCPM on outpatient mental health care utilization is not entirely surprising. The PCPM metrics did not emphasize mental health care during the study window; in fact, previous research has suggested that there is in general a lack of well-developed and feasible quality metrics for mental health care. 41 This contrasts with both primary care and specialty care, which had a variety of well-developed metrics within the PCPM for clinics to choose from and invest in. In addition, while Oregon has been an early adopter of integrating behavioral health care into primary care, these efforts were not fully realized during the study window. Rather, Oregon, like many states, suffered from staffing shortages among mental health providers that would have directly impacted whether patients could get connected to and established with appropriate mental health care, regardless of efforts by PCPM clinics to address this need.
Limitations
Our study had several limitations. The first limitation inherent to our study design was our method of patient attribution to specific clinics or providers. Using our APAC data for attribution required patients to have used care. Our analysis was therefore limited to assessing the impact of the PCPM on patients who already had at least some connection to health care during the study window. This population encompasses those who only sporadically use care and therefore could potentially benefit from more systematic connection to health care; the analysis does not, however, assess the impact of PCPM on those who were not engaging in clinical care at all during the study period. The population not engaging in care at all may face the greatest challenges to accessing needed health care, and our study cannot draw any conclusions about the impact of PCPM on them.
Additionally, our quantitative data might not be generalizable to other locations or other more ethnically diverse populations. We were missing race and ethnicity information for some participants in our quantitative data and were also unable to account for insurance or enrollment churn during the study period. We did not have clinic information on our control group, which prevented us from being able to attribute control group members to specific clinics. We were therefore unable to account for clustering at the clinic level, which may have artificially deflated our standard errors, although it would not have impacted our point estimates. We additionally did not have access to a comprehensive list of all selected quality measures for PCPM clinics, so were unable to assess if there were differences in the impact of the PCPM by measure selected. We did, however, have a binary measure of the overall complexity of quality measures selected by participating clinics, and found that this had no effect on the impact of the PCPM. Finally, we did not perform sample size calculations to ensure we had enough cases and controls for the analysis. However, our sample comprises the entire eligible population and is large enough that we were confident in having the statistical power to detect any clinically meaningful effect.
Since our qualitative results were only collected from a subset of PCPM clinics, the views expressed in the interviews may not be representative of other PCPM clinics or clinic staff who did not participate. Recruitment for qualitative interviews was also challenging in part because it took place when clinics were facing workforce shortages related to COVID and vaccine rollout. Involving clinic leaders in recruiting study participants may have introduced some selection bias; however, interviewees were assured that their participation and comments would remain confidential.
Conclusion
This mixed methods study assessed the impact of a primary care VBP model on outpatient care utilization and identified components of successful implementation. We found that patients in VBP clinics had greater connection to primary and specialty care compared to patients at non-VBP clinics. The observed effect of this primary care VBP on specialty care utilization points to the need for system-wide VBP strategies with mutually reinforcing models in primary and more specialized care. Our findings also highlight the essential role of clinic staff in VBP implementation and suggest that clinics participating in VBP programs should emphasize holistic value rather than financial impact to secure buy-in from care team staff. As payors continue to refine future VBP models, they should consider including time and resources for clinic staff engagement, reducing barriers to data access, and clearly articulating how implementation and documentation support better patient care.
Supplemental Material
sj-docx-1-inq-10.1177_00469580251384760 – Supplemental material for Staff Engagement in the Implementation of a Primary Care Value-Based Payment Program Increases Outpatient Care Utilization: A Mixed Methods Study
Supplemental material, sj-docx-1-inq-10.1177_00469580251384760 for Staff Engagement in the Implementation of a Primary Care Value-Based Payment Program Increases Outpatient Care Utilization: A Mixed Methods Study by Ritu Ghosal, Natalie Royal Kenton, Megan Holtorf, Lisa Angus and Hannah Cohen-Cline in INQUIRY: The Journal of Health Care Organization, Provision, and Financing
Supplemental Material
sj-docx-2-inq-10.1177_00469580251384760 – Supplemental material for Staff Engagement in the Implementation of a Primary Care Value-Based Payment Program Increases Outpatient Care Utilization: A Mixed Methods Study
Supplemental material, sj-docx-2-inq-10.1177_00469580251384760 for Staff Engagement in the Implementation of a Primary Care Value-Based Payment Program Increases Outpatient Care Utilization: A Mixed Methods Study by Ritu Ghosal, Natalie Royal Kenton, Megan Holtorf, Lisa Angus and Hannah Cohen-Cline in INQUIRY: The Journal of Health Care Organization, Provision, and Financing
Footnotes
Acknowledgements
We would like to recognize support provided by Abby Bush, Diana Govier, Taylor Doren from the Center for Outcomes Research & Education, and Jessi Smith, Beth Sommers, Keshia Bigler, and Nicole Merrithew from CareOregon.
Ethical Consideration
The full study protocol was approved by Providence St. Joseph Health Institutional Review Board (IRB# 2021000089) and conformed to the principles of the Declaration of Helsinki.
Consent to Participate
A consent document was created with details of the project and the interviews and information on the voluntary nature of the interviews, confidentiality, privacy and risks associated with the study. The consent document was reviewed and approved by the IRB and emailed to participants before the interview date. Verbal consent was obtained and documented at the beginning of each interview. Participants provided informed consent for use of their de-identified quotes and statements for use in reports and publications.
Author Contributions
Ms. Kenton, Ms. Angus, and Dr. Cohen-Cline were responsible for study conceptualization and design. Ms. Kenton and Ms. Ghosal were responsible for all aspects of the qualitative portion, including creating interview guides, conducting interviews, coding, and analysis. Dr. Cohen-Cline and Ms. Holtorf were responsible for designing the quantitative analysis and interpreting the results; Ms. Holtorf acquired and analyzed the quantitative data. All authors contributed to journal article writing.
Funding
The authors disclosed receipt of the following financial support for the research, authorship, and/or publication of this article: This study was funded by The Patrick and Catherine Weldon Donaghue Medical Research Foundation.
Declaration of Conflicting Interests
The authors declared no potential conflicts of interest with respect to the research, authorship, and/or publication of this article.
Data Availability Statement
The data cannot be shared because the Data Sharing Agreement between the institutions does not account for sharing the data in a public repository
Supplemental Material
Supplemental material for this article is available online.
References
Supplementary Material
Please find the following supplemental material available below.
For Open Access articles published under a Creative Commons License, all supplemental material carries the same license as the article it is associated with.
For non-Open Access articles published, all supplemental material carries a non-exclusive license, and permission requests for re-use of supplemental material or any part of supplemental material shall be sent directly to the copyright owner as specified in the copyright notice associated with the article.