
Abstract
The evolving gambling environment, marked by increased accessibility and innovative promotions, has led to rising expenditures globally. Despite this, the relationship between social media use and problem gambling in the Czech Republic remains underexplored. To investigate the association between social media use and problem gambling severity among Czech adults using the Problem Gambling Severity Index (PGSI). Is there a difference in gambling severity based on demographic characteristics? (1); Is there a relationship between social media news consumption and gambling severity? (2); Is there a connection between negative motives for social media use and problematic usage? (3); Is there a link between problematic social media use and gambling severity? (4). Primary research, designed as a cross-sectional study, was conducted in the Czech Republic in November 2024 on a sample of 3093 respondents (48.4% male). All participants were aged 16 years or older. The sample was selected using quota sampling based on multiple identifying quota variables, with minimal differences in the proportions of quota indicators compared to the general population. Non-parametric tests and ordinal logistic regression analyzed relationships between demographics, social media use, and PGSI scores. Higher PGSI scores were found among males, younger participants, those with lower education, and the unemployed or students. Greater social media news consumption correlated with increased gambling severity. Disruptive social media behaviors, such as waking up to check notifications and interrupting activities, were significantly associated with higher PGSI scores. Problematic social media use involving deceit and family conflict substantially heightened the risk of severe gambling problems. These findings highlight the need for targeted prevention initiatives, regulatory policies, and enhanced digital literacy to safeguard vulnerable groups from the risks posed by digital gambling platforms. Addressing both gambling behaviors and problematic social media use is crucial in mitigating potential harms.
Keywords
Introduction
The gambling environment has been undergoing rapid changes, with gambling becoming increasingly accessible, new promotional strategies emerging, and innovative gambling products being developed. This has led to higher gambling expenditures across various populations. Governments worldwide now recognize Internet addiction as a significant public health concern, with the WHO identifying excessive Internet use as a growing issue. 1 Some argue that social media platforms are intentionally designed to be addictive, raising ethical concerns about social media addictions. 2
Gambling expenditures are highly concentrated, complicating efforts to reveal all contributing factors. Research confirms that while high-income groups spend more money on gambling, low-income groups spend a larger proportion of their income.3,4 The harms associated with gambling are multidimensional, encompassing financial issues such as debt, reduced household funds, and even the loss of property and employment.5,6 Other significant social consequences include criminal behavior, social exclusion, and negative impacts on health. Gambling expenditure varies based on factors such as age, education, type of gambling, and income. Grönroos et al 3 found that pathological gambling is more prevalent among men with lower education levels and poor psycho-relational functioning. Kessler et al 7 similarly identified unemployment and low socio-economic status as risk factors for severe gambling. Low socioeconomic status is linked to higher gambling expenditures, though households receiving government income support are less likely to gamble. However, these groups tend to have higher rates of gambling-related problems. 8 Gambling opportunities are often concentrated in economically disadvantaged areas, further exacerbating the issue.9,10
Several studies emphasize sociodemographic predictors in problematic gambling. Men typically spend more on gambling than women, influenced by preferences for specific types of gambling—men favor strategic games, while women often opt for non-strategic games.11-13 The population aged over 55 is among those who spend the most on gambling, though fixed incomes often limit their gambling expenditures. Moreover, older women are at a higher risk of poverty, 14 further highlighting the role of education in gambling behaviors—lower education levels are consistently linked to higher gambling expenditures.3,13,15 Gambling addiction risks can fluctuate over an individual’s life due to various life events, including psychological factors like depression and anxiety.16,17 Family context is another important factor, as problem gambling among family members increases the risk for individuals.18,19 According to Goodwin et al, 20 problem gamblers can cause significant harm to close family members, making it possible to calculate the damage caused by gambling more precisely.
To create effective prevention programs, it’s crucial to examine the effects of both online and land-based gambling. The type of gambling environment significantly influences gambling frequency and its associated harms. 21 Research indicates that the availability of gambling correlates with the severity of gambling problems. 22 Additionally, gambling patterns vary across demographic categories. For example, males and younger adults tend to gamble more and suffer greater harm compared to females and older adults.8,23 Males aged 18 to 34 who engage in drug or alcohol abuse are especially prone to risky gambling behaviors. 24 Furthermore, advertising has been shown to exacerbate problem gambling. 25 Despite the growing body of research on gambling, there remains a gap in studies exploring the connection between social media use and the development of gambling addictions. As digital technologies continue to evolve, the accessibility of gambling is likely to increase, leading to higher rates of gambling addiction, especially among younger demographics. This flags the need for enhanced digital literacy, prevention programs, and regulatory mechanisms to protect vulnerable groups from emerging gambling platforms.
Social vulnerability is examined in the research studies across many dimensions. Some researchers investigate social vulnerability in relation to gambling prevalence26,27 or in relation to psychological and physical comorbidities. 28 The social vulnerability of gamblers can also be understood from a perspective of the motivational directions. 29 Within the framework of the motivational directions, it is also important to examine the age parameters, 3 which justify the interconnectedness of many psychological aspects as well as the gambling intensity and the level of health, social, economic, and the other types of risks. 30 For elderly population, gambling may also provide an emotional escape, accompanied by a desire to socialize in an environment, where they feel safely and comfortably. This fact also explains the potential positive outcomes of regular gambling for elderly population. 31
Therefore, the primary aim of this study is to investigate the relationship between social media use and problem gambling, as measured by the Problem Gambling Severity Index (PGSI), using a sample from the Czech population. The study seeks to highlight the growing potential for gambling addiction in the future. The following research questions were formulated:
RQ1: Is there a difference in gambling severity based on demographic characteristics?
RQ2: Is there a relationship between social media news consumption and gambling severity?
RQ3: Is there a connection between negative motives for social media use and problematic usage?
RQ4: Is there a link between problematic social media use and gambling severity?
Material and Methods
The research conducted can be classified as a primary quantitative interdisciplinary study. Its primary nature reflects the collection of original data specifically tailored to address the study’s objectives. The quantitative approach emphasizes statistical analyses to identify relationships, patterns, and trends, while the interdisciplinary focus incorporates perspectives from various fields, such as behavioral science, digital technology, and public health. This comprehensive approach allows for a nuanced exploration of the interplay between social media use and problem gambling within a specific population context.
To achieve the aim of the study, the research was carried out in the conditions of the Czech Republic on a sample of 3093 respondents. The overall addressed sample was 3925 respondents, while 3118 questionnaires were filled in, of which 25 were cancelled because of very short time period for filling in. The period for data collection was 10 November 2023 to 26 November 2023. The target population was aged over 16 via the quota selection. The target quotas were sex, age, education level, region, residence size, Internet use, labor status, and 2021 and 2023 election behavior. The CAWI data collection method was applied.
The sample consisted of 3093 respondents. From the point of view of the sex characteristics (SEX), the sample consisted of 1497 (48.4%) males and 1596 (51.5%) females. From the perspective of age (AGER), the frequency of the age categories was as follows: 16 to 24: 186 (6.01%), 25 to 34: 342 (11.06%), 35 to 44: 500 (16.17%), 45 to 54: 567 (18.33%), 55 to 64: 576 (18.62%), 65+: 922 (29.81%). Regarding the education level, the numbers are like this: primary school: 215 (6.95%), secondary school without high school diploma: 973 (31.46%), secondary school with high school diploma: 1237 (39.99%), university: 668 (21.6%). From the point of view of residence size (SIZER), the sample was divided into the three categories: up to 4999 inhabitants: 1172 (37.89%), 5000 to 99 999 inhabitants: 1201 (38.83%), over 100 000 inhabitants: 720 (23.28%). Regarding the economic status (REKO), the situation is as follows: employees (including working pensioners): 1261 (40.77%), entrepreneurs and self-employed: 347 (11.22%), unemployed: 71 (2.3%), pensioners (non-working): 935 (30.23%), students (working and non-working): 155 (5.01%), others (on parental/maternity leave, at home, other): 324 (10.48%). In addition to the above listed identification characteristics, the sample structure can also be described based on the intensity of Internet use (INT): Several times a day: 2118 (68.48%), Once a day or almost daily: 728 (23.54%), Less often: 247 (7.99%).
The analytical processes included 9 items focused on the severity of gambling PGSI (Problem Gambling Severity Index). The sum of the listed items forms the severity index. The following items are included (never/sometimes/mostly/almost mostly):
- Did you bet more than you could afford to lose? (1114 (92.22%)/73 (6.04%)/17 (1.41%)/4 (0.33%))
- Did you need to play with higher amounts of money to get the same feeling of excitement? (1116 (92.38%)/65 (5.38%)/21 (1.74%)/6 (0.5%))
- When you gambled, did you come back the next day to try to win back the money you lost? (1064 (88.08%)/108 (8.94%)/25 (2.07%)/11 (0.91%))
- Did you borrow money or sell something to get money for gambling? (1142 (94.54%)/48 (3.97%)/13 (1.08%)/5 (0.41%))
- Did you feel that you might have a gambling problem? (1060 (87.75%)/109 (9.02%)/31/(2.57%)/8 (0.66%))
- Has gaming caused you any health problems, including stress or anxiety? (1116 (92.38%)/61 (5.05%)/23 (1.9%)/8 (0.66%))
- Did people criticise your gambling or tell you that you have a gambling problem, whether you thought it was true or not? (1100 (91.06%)/74 (6.13%)/24 (1.99%)/10 (0.83%))
- Has your gaming caused you or your household any financial problems? (1117 (92.47%)/65 (5.38%)/19 (1.57%)/7 (0.58%))
- Did you feel guilty about the way you play or what happens when you play? (1050 (86.92%)/120 (9.93%)/25 (2.07%)/13 (1.08%))
A total PGSI score (PGSI Score) was calculated as the sum of all the items. The PGSI categories come from the total score. A score of 0 determines gambling severity at the “None” level, a score of 1 to 4 is considered “Low” severity, a score of 5 to 7 is considered “Moderate” severity, and a score of 8 and above is considered “Problematic” severity regarding the PGSI.32,33 There are 1885 (60.94%) missing answers in these items.
RQ2 interconnect the PGSI score to the intensity of following news on social networks. When you think about the past month, how often did you watch or listen to the news in a typical week: | On social networks? Attitudes to the mentioned item were determined on a 5-point scale (the numerical value of each category is shown in parentheses): Several times a day (1): 423 (13.68%), Once a day (2): 398 (12.87%), Several times on different days (2-6 times a week) (3): 399 (12.9%), Once a week (4): 424 (13.71%), Not even once (5): 1449 (46.85%).
RQ3 was aimed at assessing the association of PGSI with disturbing use of social networks. Three items on an ordinal scale stood out in this area. The listed items were evaluated on a four-category scale, with numerical coding values in the parentheses: Never (1), Rarely (2), Sometimes (3), Often (4).
The item is shown as follows: “Please indicate how often DURING THE PAST WEEK (past 7 days) you experienced the following feelings.” The responses were categorized into the three fields:
- I woke up at night to check social networks (ISMU01): Never = 2007 (64.89%), Rarely = 154 (4.98%), Sometimes = 69 (2.23%), Often = 12 (0.39%).
- I interrupted my current activity (work, cleaning, childcare, watching a movie, playing a game) to check social networks (ISMU02): Never = 1262 (40.80%), Rarely = 570 (18.43%), Sometimes = 344 (11.12%), Often = 66 (2.13%).
- I interrupted a conversation (with a partner, friend, work colleague, acquaintance) to check social networks (ISMU03): Never = 1678 (54.25%), Rarely = 394 (12.74%), Sometimes = 151 (4.88%), Often = 19 (0.61%).
Investigation of the problematic use of social networks included the following items—“During the last year, have you caught yourself that. . .” (yes/no):
- you regularly could not think about anything other than the moment you would be able to use social media again (125 (4.04%)/2968 (95.96%));
- you regularly felt dissatisfied because you wanted to spend more time on social media (117 (3.78%)/2976 (96.22%));
- you often felt bad when you could not use social media (124 (4.01%)/2969 (95.99%));
- you have tried to spend less time on social media, but unsuccessfully (355 (11.48%)/2738 (88.52%));
- you regularly neglected the other activities (for instance, hobbies, sports), because you wanted to use social media (271 (8.76%)/2822 (91.24%));
- you often argued with others about using social media (146 (4.72%)/2947 (95.28%));
- you regularly lied to your relatives (for instance, friends, parents, siblings, children) about the time period you spend on social media (82 (2.65%)/3011 (97.35%));
- you often used social media to escape from unpleasant feelings (408 (13.19%)/2685 (86.81%));
- you have had a serious conflict with your relatives (for instance, parents, siblings, children), because of your use of social media (87 (2.81%)/3006 (97.19%)).
RQ4 was focused on problematic behavior on social networks. The items listed in Table 2, evaluated on a dichotomous scale, were applied. The instructions for these items were as follows: “We are interested in your experience with social media now. By social media, we mean networks (for instance, Facebook, Instagram, Twitter) and chat applications (for instance, WhatsApp, Snapchat, Facebook Messenger).”
The analytical processes were concentrated in the methodological procedures according to the individual research questions. To evaluate RQ1, non-parametric tests (the Pearson’s χ2 test, the Wilcoxon test, and the Kruskal–Wallis test 34 were applied to evaluate RQ1. RQ2, RQ3, and RQ4 were evaluated through the simple and multiple logistic ordinal regression models. 35 These models were chosen based on the fact that the indicators capturing gambling severity can be understood as the ordinal variables. The programming language R version 4.4.0 Puppy Cup (R Core Team, 2024) and Tableau version 2023.3 were used for the analysis.
Results
The first section deals with a general view of the seriousness of the problem gambling in the Czech Republic and then the individual RQs are evaluated.
Figure 1 shows the distribution of PGSI (Problem Gambling Severity Index) results in the Czech Republic. The given figure is composed of two visualizations, with the upper part (histogram) showing the raw PGSI score and the lower visualization (treemap) illustrating the representation of the individual PGSI severity categories. The given score was recalculated according to the standardized PGSI tool, while the reliability formed by the individual items shows a high level, that is, 0.93. The PGSI histogram shows the frequency of occurrence of the individual PGSI scores. The largest proportion (76.32%) has a score of 0, which indicates no problem with gambling. A score of 8 or more is considered problematic. It is clear that the vast majority of the population did not show a problem with gambling. The treemap shows the overall distribution of the population by PGSI category. The “None” category is represented by a 76.32% share (922 people). The category “Low” (low risk) is represented by a 15.15% share (183 persons). The “Moderate” category is represented by a 3.48% share (42 people). The “Problematic” category is represented by a 5.05% share (61 people). Hence, the highest category of gambling severity showed itself at the level of statistical error.
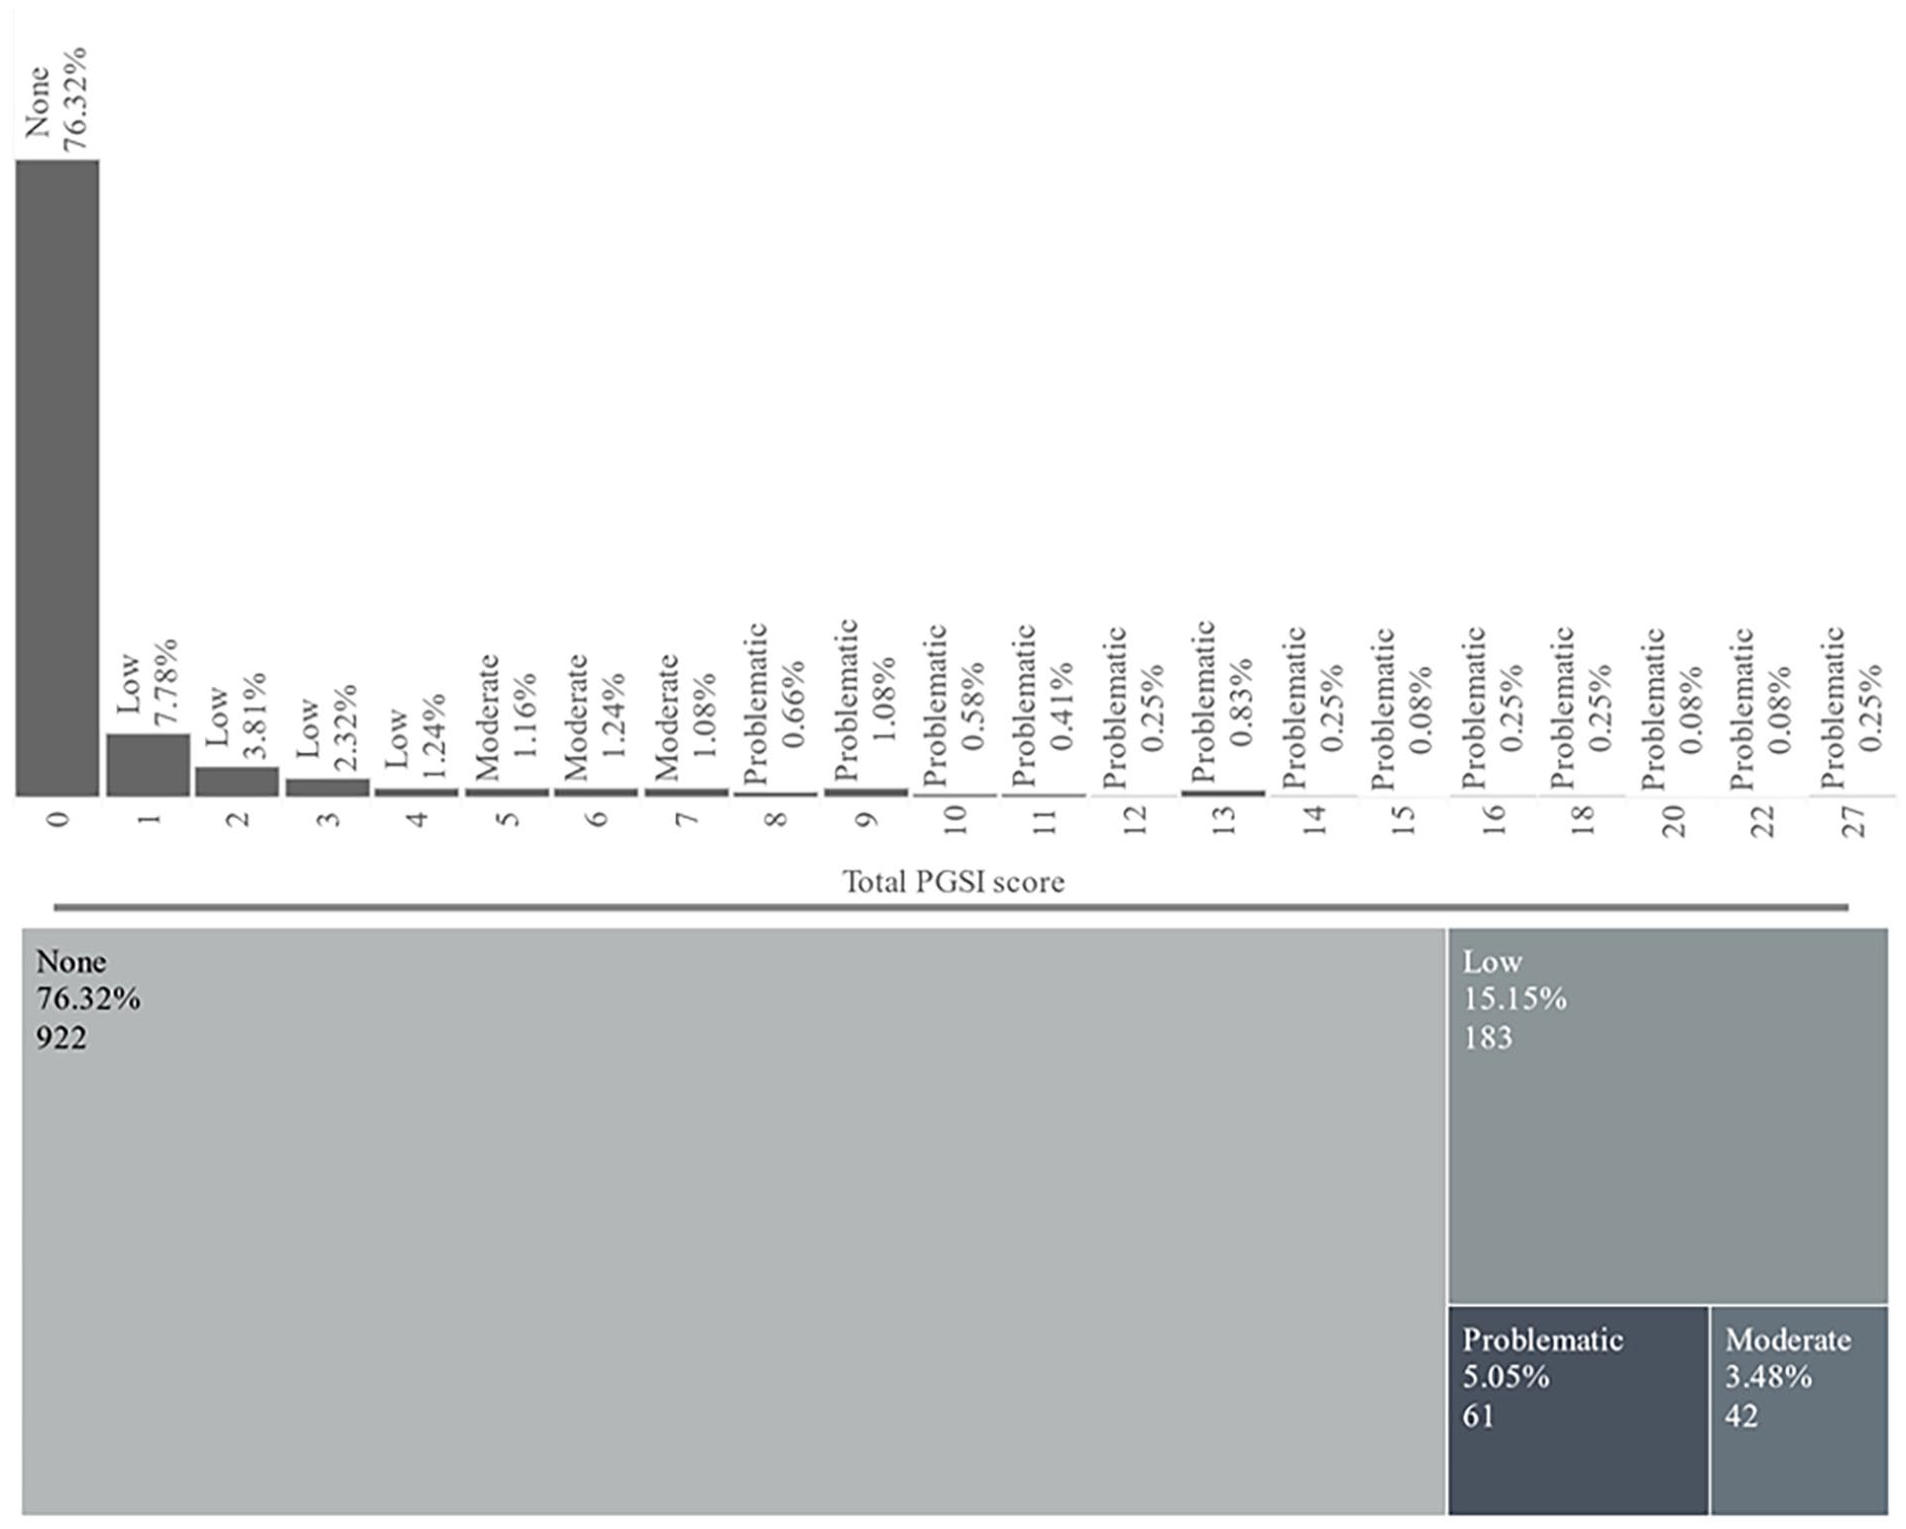
PGSI in the Czech Republic.
Table 1 presents the outcomes of the evaluation of the differences in the total PGSI scores and the PGSI categories between different respondent identification characteristics via the Wilcoxon/Kruskal–Wallis tests and χ² tests. The first part of the table focused on the overall score, then the tests were aimed at the PGSI categories. The outcomes show that there is some difference between the categories of the sex characteristics (SEX), as well as in age (AGER), education (EDUR), and economic status (REKO).
Test of the PGSI Differences Between the Categories of the Respondents’ Identification Characteristics.

Figure 2 shows the average score of the PGSI (Problem Gambling Severity Index) divided by sex, age, education and economic status of the respondents. The average PGSI score is higher for men (x̅ = 1.1849) compared to women (x̅ = 0.9833). Within the age categories, young people aged 16 to 24 have the highest average score (x̅ = 2.096), while the score gradually decreases with age, while the lowest is in the 65+ age group (x̅ = 0.563). The differences in the total PGSI scores are also apparent between the education categories. Individuals with primary education have the highest score (x̅ = 2.338) and people with higher education have the lowest score (x̅ = 0.687). In the terms of an economic status, unemployed (x̅ = 2.636) and students (x̅ = 2.568) have the highest average PGSI scores, while entrepreneurs and self-employed have significantly lower scores. The values in bold font indicate fulfilling a five-per-cent statistical significance level.

Average value of the total PGSI score in the classification of the selected.
The outcomes related to the relation of the intensity of watching news on social networks with the PGSI score and also its categories are as follows. The estimated regression coefficient of the PGSI score is −0.233 with standard error of 0.043 and P-value lower than .001. It means odds ratio stands at 0.792, while its lower confidence interval boundary is 0.728 and the upper one is 0.862. The McFadden R2 is .011. For the PGSI categories, the estimated regression coefficient is −0.235 with standard error of 0.043 and P-value lower than .001. Its odds ratio stands at 0.790, while its lower confidence interval boundary is 0.726 and the upper one is 0.861. The McFadden R2 is .016. These outcomes of the ordinal logistic regression indicated that for both models we can talk about a significant relationship at the α < .001 level. This result confirms the positive answer to the second research question (RQ2). In both cases, negative coefficients appeared. Here, however, it is necessary to draw attention to the numerical coding of the variable of following the news on social networks, which was coded in a way where a lower level of intensity represents a higher numerical value. In view of the above, the mentioned relationship can be understood in such a way that with a higher degree of intensity of news monitoring through social media, a higher value of the PGSI score can also be expected, as well as a higher degree of severity according to the PGSI categories. The coefficient of determination is at a relatively low level, which may indicate that following the news on social media is a significant predictor, but not a dominant one, and the change in PGSI will most likely be modeled by something else.
Table 2 demonstrates the effect of disturbing use of social networks on the PGSI score and its categories through an ordinal logistic regression model.
Association of Disturbing Use of Social Networks with PGSI Score and PGSI Categories—Ordinal Logistic Regression Model.
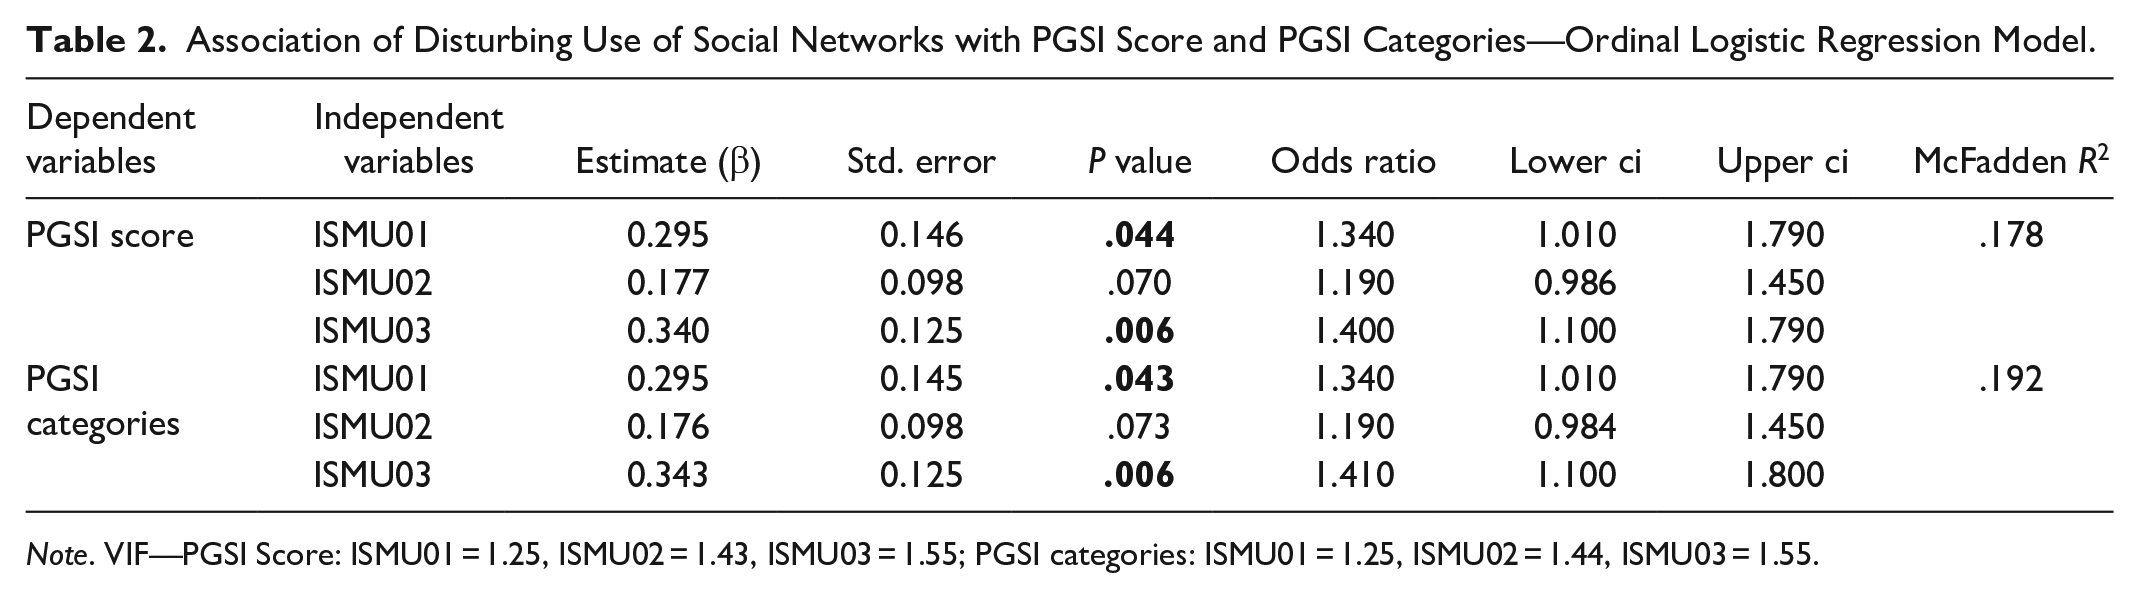
Note. VIF—PGSI Score: ISMU01 = 1.25, ISMU02 = 1.43, ISMU03 = 1.55; PGSI categories: ISMU01 = 1.25, ISMU02 = 1.44, ISMU03 = 1.55.
Table 2 shows the three independent variables: ISMU01, ISMU02, and ISMU03, which represent the different forms of disturbing use of social networks. The given table presents the two multiple logistic ordinal regression models, one with the dependent variable PGSI score and another one with the PGSI Categories. It is clear that significant outcomes can be said for the ISMU01 indicator, which refers to the cases when study participants wake up at night to check social networks and ISMU03, which refers to interrupting personal conversations to check social networks. The ISMU02 indicator, which evaluates the cases, where respondents interrupted current activities due to social networks. This indicator appears to be insignificant. The estimates of the regression coefficients are positive. Here, nevertheless, it is necessary to draw an attention to the numerical coding of the variable of disturbing use of social networks, which was coded in a way, where a lower level of intensity represents a higher numerical value. Hence, the outcomes can be interpreted in such a way that a lower severity level of playing gambling games can be associated with a higher level of perceived disturbance of social networks in the fields of ISMU01 and ISMU03. The values in bold font indicate fulfilling a five-per-cent statistical significance level.
Table 3 provides an analysis of the relationship between problematic use of social networks and the total PGSI (Problem Gambling Severity Index) score and its categories through an ordinal logistic regression model. These are the regression models with one independent variable.
Connection of Problematic Use of Social Networks with the Total PGSI Score (PGSI Score) and PGSI Categories (PGSI Categories)—Ordinal Logistic Regression Model.

Note. Reference: No.
In all the cases, it is a significant relation and in all the cases positive β coefficients were shown. The odds ratio values can be understood that in all the cases, the probability of problematic gambling-related behavior is higher among people, who show a problem with social networks (YES answer) than among those, who do not show a problem with social networks (NO answer). An extremely strong relation was demonstrated in the two indicators (SMDSG, SMDSI). The SMDSG variable, which determines whether respondents regularly lie to their relatives about the amount of time spent on social media, presents a coefficient β = 2.640, P-value < .001, with odds ratio = 14.100. The SMDSI variable, regarding serious conflicts with relatives due to the use of social media, had a coefficient β = 2.320, P-value < .001, with odds ratio = 10.100. These high odds ratios suggest that more frequently occurring problem behaviors related to social media use significantly increase the likelihood of a higher PGSI score. Interpretation of these outcomes indicates that the population groups, which manipulate or have conflicts with others due to their use of social networks, have a significantly higher risk of developing problem gambling behavior. When evaluating the coefficients of determination, it cannot be spoken about a positive outcome, as the McFadden R2 values are relatively low. The values in bold font indicate fulfilling a five-per-cent statistical significance level.
Discussion
The outcomes of the analytical processes have brought several interesting findings within all the four RQs. These findings help to build a systematic platform for the creation of targeted policies and tools focused on early monitoring as well as the regulatory and prevention processes. Sharing research outcomes at an international level supports the creation of benchmarking tools required for national and international comparative analyses that are needed for prevention initiatives and programs.
Based on the PGSI evaluation, nearly 80% of the population is unlikely to experience gambling-related issues. However, our research suggests that approximately 5% of the population may face problematic behaviors.
RQ1 explored PGSI differences across demographic groups. Differences emerged in sex, age, education, and economic status, while Internet usage intensity and residence size showed no influence. Males had higher average PGSI scores, with younger individuals showing the highest scores, which decrease with age. The lowest education levels correlated with the highest PGSI scores, confirming previous research. 36 Male pathological gamblers also showed lower education levels. 3 Economic status evaluation revealed that the unemployed and students are most vulnerable to gambling risks, consistent with other studies.37,38 Additionally, gambling types are influenced by socioeconomic and regional factors, such as income inequality. 39
Particularly for elderly population, gambling can offer distraction, social interaction, and opportunities for positive emotions, and elimination of depressive symptoms. 40 Gambling is no longer considered a bad habit accompanied by negative connotations and stigmatization, but its potential health benefits have gained a position that is paid an attention. 41 Research focused on investigating multidimensional sociodemographic aspects will be essential for discovering new factors and determinants of the gambling addiction development in all the population groups.42,43
The use of land-based, multimodal, and online gambling varies across sociodemographic factors and gambling behaviors. Multimodal gambling, for instance, increases the number of gambling products used, heightening gambling risks. Online gambling is particularly attractive to younger individuals due to its accessibility. 44 Moreover, male gambling typically occurs in public spaces, whereas women often gamble online at home. 45
New gambling sites are expected to expand quickly in the future, 46 while the increase in gambling addiction will be considerably boosted by the digital technologies.47,48
RQ2 examined the link between PGSI and social media news consumption. The findings suggest that higher social media news consumption correlates with higher gambling severity. This aligns with studies showing that the convergence of digital media and gambling can promote gambling among younger individuals later in life. 44 Additionally, excessive social media use can cause mental health issues, such as depression and anxiety, which can increase gambling risks. 49 Davoudi et al 50 also confirmed a positive and significant correlation between the gambling severity and the Internet addiction severity, the depression severity, the anxiety severity, and the obsession severity for online gamers.
RQ3 addressed the connection between negative motives for social media use and problematic usage. Results indicated that frequent social media disruptions, such as waking up to check notifications, contribute to problematic use. Other studies confirm that social media addiction impairs attention and cognitive function, 51 leading to psychological distress, anxiety, depression, and low self-esteem. 52
RQ4 investigated the relationship between problematic social media use and gambling severity. Logistic regression models confirmed a significant link between these factors, particularly where lying and family conflict were tied to social media activities. Such conflicts may increase both gambling severity and suicide risks among problem gamblers, 53 emphasizing the role of family in prevention. 54
The study’s strengths lie in its large, representative sample of 3093 respondents, ensuring robust and generalizable findings, and its interdisciplinary approach, which integrates behavioral science, sociology, and digital technology to comprehensively examine the interplay between social media use and problem gambling. The use of advanced statistical methods, such as ordinal logistic regression, adds depth to the analysis. However, its cross-sectional design limits the ability to infer causation, and a significant portion of missing data (e.g., in PGSI responses) may affect result accuracy. Additionally, reliance on self-reported measures introduces potential biases, and the study’s focus on the Czech Republic may restrict the generalizability of its findings to other populations. 55
The study’s limitations include its cross-sectional design, which prevents causal inferences, and the reliance on self-reported data, potentially introducing bias. Additionally, the focus on the Czech Republic limits generalizability to other cultural contexts. Future research should explore longitudinal designs to establish causal relationships between social media use and gambling severity. Expanding studies to diverse populations and integrating qualitative approaches could provide deeper insights into the underlying mechanisms driving problematic behaviors, enhancing the development of targeted interventions.
Conclusion
The study’s main objective was to investigate the association between social media use and problem gambling severity among Czech adults using the PGSI on a sample of 3093 respondents in the Czech Republic. The interesting relationships were found between the selected sociodemographic characteristics and the gambling severity as well as between the social media use and the gambling severity. Higher consumption of social media increases the gambling severity risk similarly as social media use involving lies and family conflicts. The significant societal changes, associated with economic and social uncertainties related to geopolitical threats may support population’s interest in gambling in the different population groups. Gambling has been increasingly becoming a legitimate form of entertainment, but also a controversial health and social policy issue all over the world. The attitudes of governments in many countries as well as of the general population provide clear evidence that new gambling sites will also expand quickly in the future.
These findings highlight the urgent need for further research into gambling risks stemming from excessive Internet and social media use. The results offer critical insights for policymakers in health and education, stressing the importance of health, digital, and media literacy systems. Additionally, these findings emphasize the need for regulatory mechanisms to address the increasing gambling risks in various environments. The collaboration among institutional actors, communities, organizations, and families is essential to curbing the rise of gambling addiction facilitated by digital technologies. Governments must prioritize monitoring and regulating gambling through digital platforms in response to technological advancements and concurrently manage the creation of targeted prevention programs and initiatives at both the national and international levels.
Supplemental Material
sj-docx-1-inq-10.1177_00469580251318162 – Supplemental material for From Clicks to Bets: How Social Media Engagement Influences Gambling Severity—Cross-Sectional Research
Supplemental material, sj-docx-1-inq-10.1177_00469580251318162 for From Clicks to Bets: How Social Media Engagement Influences Gambling Severity—Cross-Sectional Research by Vaclav Moravec, Nik Hynek, Beata Gavurova, Martin Rigelsky and Michal Miovsky in INQUIRY: The Journal of Health Care Organization, Provision, and Financing
Footnotes
Author Contributions
Vaclav Moravec: Conceptualization, Writing—review and editing, Visualization, Validation, Supervision. Nik Hynek: Writing—original draft, Writing—review and editing, Visualization, Supervision. Beata Gavurova: Formal analysis, Methodology, Data curation, Writing—original draft, Writing—review and editing, Visualization. Martin Rigelsky: Formal analysis, Data curation, Methodology, Software, Validation. Michal Miovsky: Conceptualization, Methodology, Writing—original draft, Writing—review and editing, Supervision.
Data Availability
Data will be made available on request.
Declaration of Conflicting Interests
The author(s) declared no potential conflicts of interest with respect to the research, authorship, and/or publication of this article.
Funding
The author(s) disclosed receipt of the following financial support for the research, authorship, and/or publication of this article: The paper was financed by the project Support for increasing the impact, innovation and sustainability of CEDMO in the Czech Republic (No. 1.4 CEDMO 1—Z220312000000). This project is funded by the EU’s Recovery and Resilience Facility (RRF) and Institutional support by Charles University, Institutional Program Cooperatio (Health Sciences) on Charles University.
Ethics
All subjects were informed about the study, and all provided informed consent. The study procedures were carried out in accordance with the Declaration of Helsinki and was approved by ethical committee of General University Hospital Prague (IORG0002175—General University Hospital in Prague, IRB00002705 a Federalwide Assurance FWA00029052).
Supplemental Material
Supplemental material for this article is available online.
References
Supplementary Material
Please find the following supplemental material available below.
For Open Access articles published under a Creative Commons License, all supplemental material carries the same license as the article it is associated with.
For non-Open Access articles published, all supplemental material carries a non-exclusive license, and permission requests for re-use of supplemental material or any part of supplemental material shall be sent directly to the copyright owner as specified in the copyright notice associated with the article.