
Abstract
Although China’s 2009 New Healthcare Reform aimed to correct the imbalance in the spatial allocation of healthcare resources with a focus on the county level, its impact on county-level allocative efficiency evolution and convergence remains unclear. This paper for the first time performs a spatial analysis to explore the distribution, evolution, and convergence of the allocative efficiency of healthcare resources with county-level data. This paper uses the sample data of 158 countries in Henan Province, China, to evaluate the evolution and convergence of the allocative efficiency of healthcare resources. Based on the estimated Data Envelopment Analysis (DEA) allocative efficiency, analysis of variance (ANOVA), and spatial descriptive analysis, we explore the county heterogeneity and efficiency evolution; a spatial panel model is then utilized to test the county-level convergence of the allocative efficiency of healthcare resources. Although the number of efficient counties has not increased, the number of inefficient individuals keeps decreasing, and the allocative efficiency of municipal districts is lower than that of nonmunicipal counties. There exists a positive spatial correlation of allocative efficiency in Henan Province, and significant and robust convergence results can be found at the county level after China’s 2009 reform. This study reveals a diversified picture of China’s county-level spatial evolution of allocative efficiency in healthcare resources, showing a more balanced spatial distribution of allocative efficiency since the triggering of China’s 2009 reform. However, long-term investment incentives and a targeted allocation of healthcare resources are still needed to promote further efficiency convergence and increase the number of counties with efficiency.
Keywords
The spatial imbalance of the allocation of healthcare resources is a long-standing challenge for China and the world. Previous studies have demonstrated the spatial correlation and convergence of healthcare resources at the provincial and municipal levels; however, few studies have focused on the spatial correlation and convergence of allocative efficiency at the county level.
We estimate for the first time the county-level efficiency evolution and convergence of healthcare resources by including the spatial correlation factor. The use of spatial descriptive analysis and panel models enables an understanding of the spatial evolution of the allocation of healthcare resources since the triggering of China’s 2009 reform, which provides evidence of the reform’s effectiveness.
This paper implies that spatial correlation and county heterogeneity should be fully considered in efficiency evolution and convergence studies. Our results support the effectiveness of China’s 2009 reform in correcting the county-level imbalance of the allocative efficiency of healthcare resources. However, more targeted policy intervention and investment are needed to exert incentives and to pressure those counties still in the ineffective range.
Introduction
The balanced allocation of healthcare resources across regions is one of the most important issues facing China and the world.1-3 The New Healthcare Reform, launched by the Chinese government in 2009, and the subsequent descendant reforms and supporting policies, all aimed to correct the imbalance in the spatial allocation of healthcare resources.4,5 The concentration of high-level hospitals in major cities is what attracts most patients, and this is the main problem confronting China. 6 Since the 2003 SARS epidemic, the increased investment from central and local governments has been directed mainly to county and substandard hospitals; however, the utilization of healthcare resources remains low in these hospitals in spite of the increased assets, 7 creating serious structural congestion and the inefficient allocation of healthcare resources. 8 In China, county-level administrative units include counties and county-level cities and municipal districts in major cities. As part of a central city, municipal districts usually have a better economy and a larger number of high-grade hospitals and therefore typically contain abundant healthcare resources. Counties (and county-level cities) consist predominantly of agricultural populations. The corresponding difference in healthcare resource allocation is the core issue the 2009 reform focused on. 9 Our research encompasses the following questions: After the 2009 reform, could China have witnessed a balanced, county-level healthcare resource allocation and convergence, and would it be helpful for China to review the effectiveness of the reform and adjust the present policy? 10 Additionally, China’s experience in achieving more efficient healthcare resource allocation can enrich the literature on healthcare resource equity and provide useful insights for other developing countries.
Previous studies on healthcare equity usually focused on 3 aspects: supply, demand, and efficiency.11-13 The supply-centered literature discusses the supply of financial, material, and human resources related to healthcare services, 2 while demand-side studies concern the use of healthcare resources such as consultation and hospitalization services. 14 These studies usually take 2 main sequential steps: The first step is to measure supply/demand levels of healthcare resources by utilizing a single indicator, such as the number of hospital beds and doctors 15 or constructing a healthcare supply/demand index with multiple input/output data and the entropy weighting method. 16 The second step is to estimate the spatial allocation and convergence of healthcare resources. 17 Some studies explore whether different countries realize more equitable allocation and convergence with multinational panel data.18-20 Other studies pay attention to province- or state-level allocations and a convergence of healthcare resources that focuses on major countries in the world such as the US, China, India, and Italy.21-24 Two methods are used to measure efficiency. The first is the ratio method. Here, multiple indicators of supply (input) and demand (output) are used to integrate one single indicator through methods like entropy or principal component analysis and then divided by the output/input index to obtain an efficiency indicator as the input-output ratio. 25 However, this method does not reflect the characteristics of the healthcare production function. The second method is data envelopment analysis (DEA), which could provide a more accurate measure of efficiency by incorporating healthcare production functions.26-28 This method can also be extended to use the slack based measure (SBM) model and the Malmquist model in combination with a panel regression model or for dynamic analysis.29,30
In China, a cluster of healthcare resources can be found in developed provinces and cities, but the geographic accessibility of healthcare resources is poor in underdeveloped provinces and cities. 31 The supply-side convergence among cities in China tends to accelerate, but it is still slower than that of the GDP per capita. 32 β convergence and spatial spillover effects also exist between provinces.21,33 However, other studies using provincial panel data find that the imbalance remains serious, mainly due to the serious disparity in physical and financial resources. 34 The reason could be related to the biased incentive of the 2009 reform, which expanded health insurance coverage and relaxed patients’ financial constraints. This pushed them to choose high-level hospitals more often 35 and weakened the convergence of healthcare resources allocation. Although several studies discussed the county-level spatial distribution and convergence of the supply/demand side,36,37 little attention has been paid to county-level spatial correlation and spillover effects.
Some provincial panel-data estimations reported an increase in the allocative efficiency of healthcare resources in China with remaining large regional differences. 38 However, decreasing productivity of primary care institutions was also reported after the 2009 reform, 39 and management level and scale efficiency have not improved. 40 An urban panel-data study found that the allocative efficiency is usually high in central cities but large differences still exist,41-44 which calls for further county-level evidence. A few studies have measured the county-level efficiency27,36,37,43 and found no evidence of efficiency improvement. 27 However, previous studies did not discuss spatial correlation and convergence of allocative efficiency at the county level.
Given China’s vast provincial heterogeneity, it is appropriate to use a representative province to assess the evolution and convergence of the allocative efficiency of healthcare resources. In this paper, we selected Henan Province, which has 158 counties (county-level cities and municipal districts), to assess the county-level efficiency distribution and convergence. There are several reasons for this choice: (1) Henan, located in central China, has the country’s third largest population of 99 366 000; (2) it is a major agricultural province with a large agrarian population; and (3) it contains significant urban-rural differences (Figure 1). Panel data from 2009 to 2019 is used to perform the empirical study based on data availability. The efficiency estimation of Henan Province could be helpful for understanding the evolving healthcare resource allocation following China’s 2009 healthcare reform.

The location of Henan Province and its county distribution.
Compared with previous studies, this paper made the following novel contributions: (1) We estimated, for the first time, the efficiency convergence of healthcare resource allocation, which could help to clarify the evolving healthcare equity in China after the 2009 healthcare reform; and (2) We incorporated the spatial correlation into county-level healthcare resource imbalance research by utilizing the spatial descriptive analysis and spatial panel model together. This better reflects the reality that the county-level allocation of healthcare resources benefits from spatial correlation and spillover.
Methodology and Data
Efficiency Measurement Based on DEA Methodology
This paper uses DEA to measure the allocative efficiency of healthcare resources. DEA evaluates the efficiency indicators of similar evaluation units with multiple inputs and outputs in the production process and observes whether each decision-making unit (DMU) is on the production frontier to judge the relative effectiveness of the overall efficiency. 45 For the DEA methodology, CCR and BCC model could be applied for the context of constant returns to scale (CRS), and variable returns to scale (VRS), respectively. The BCC model should be used to measure the allocative efficiency of healthcare resources since the production technology of the healthcare system is VRS.13,46 The efficiency value measured using this model is the technical efficiency (TE), and TE can be divided into pure technical efficiency (PTE) and scale efficiency (SE), with TE being the product of the two.
DEA models can be set as input-oriented and output-oriented models according to the purpose of evaluation. The input-oriented model focuses on evaluating the relative effectiveness of inputs and observes how to adjust inputs when the output is given; the output-oriented model mainly evaluates the relative effectiveness of outputs and observes how to adjust outputs when the inputs are given. Because healthcare inputs are difficult to adjust in the short term, the crux of county-level efficiency of healthcare resource allocation lies mainly on the demand side, so the output-oriented model is chosen for this paper. The estimated efficiency values reside in the [0,1] range. When the TE value is equal to 1, the county is efficient in the allocation of healthcare resources; when the TE value is less than 1, an inefficient result is reached. However, when either PTE or SE is equal to 1, weak efficiency is expressed.
Assessment of Spatiotemporal Evolution in Efficiency
In the spatial dimension, we use Moran’s I index and local indicators of spatial association (LISA) clustering diagrams to analyze the county-level spatial clustering and distribution characteristics of healthcare resources. The global Moran’s I index is used to analyze the spatial correlation. 18 It can also provide evidence for adding the spatial effects to the regression model. If the index is significantly positive, there could be a positive spatial correlation, implying that neighboring counties would share with the spatial clustering. If the index is significantly negative, a negative spatial correlation would exist. An efficiency correlation means spatial dispersion. The closer the absolute value of the global Moran’s I index is to 1, the stronger the spatial correlation—and the closer the absolute value is to 0, the weaker the correlation.
We also combined Moran scatter plots with LISA significance to generate LISA clustering maps, which could portray the county-level spatial distribution of healthcare resources. This method allows 4 types of clustering: high-high clustering (HH), low-high clustering, low-low clustering (LL), and high-low clustering. This method can present local spatial “hot” and “cold” areas, where high- and low-value individuals are concentrated, respectively, revealing the heterogeneous characteristics of spatial distribution and forms of spatial correlation.
Convergence Estimation Based on Spatial Panel Models
To control for the marginal impact of county-level heterogeneity, a spatial panel model is introduced to estimate the convergence of allocative efficiency. 44 The β convergence model used in this paper can be further distinguished into absolute β convergence and conditional β convergence. Among them, the absolute β convergence can be estimated with equation (1).

In equation (1), ei,t denotes the efficiency value for the ith county in period t, α is a constant, β is the regression coefficient, and the rate of convergence is
To control the effect of county heterogeneity variables, we include control variables to the conditional β convergence model. If Xi,t is the control variable for county i in period t, we get the following:

Considering that the classical β convergence model does not address the spatial correlation of allocative efficiency, based on equations (1) and (2), we construct a spatial β convergence model to portray the spatial convergence as shown in equation (3), where Wij denotes the spatial weight matrix and δ denotes the spatial lag coefficients of the explanatory variables. It should be noted that the above spatial models could include the spatial Durbin model (SDM), spatial autoregressive model (SAR), spatial autocorrelation model (SAC), and spatial error model (SEM). In equation (3), if λ = 0, it is the spatial Durbin model (SDM). If λ = 0 and δ = 0, it indicates that a spatial autoregressive model (SAR) should be used. If τ = 0 and δ = 0, a spatial autocorrelation model (SAC) should be used. And if τ = ρ = 0 and δ = 0, we would use a spatial error model (SEM). We used the likelihood ratio (LR) test and the Hausman test to determine individual/time effects and fixed/random effects; we then choose the Lagrange multiplier (LM) test, the Wald test, and the LR test to determine the specific form of the spatial model. 47

Sample and Data
The span of this research is 2009 to 2019, and 2009 was the first year to implement the New Healthcare Reform. Our sample covers all 158 counties (county-level cities and municipal districts) in Henan Province, including 105 counties and county-level cities and 53 municipal districts.
According to the literature, the input indicator of the healthcare service system is mainly composed of capital and labor, while its output indicator mainly involves with treatment and hospitalization.41,48 Based on the data available from the Health Commission of Henan Province, the number of healthcare institutions and beds, and the number of health technicians are selected as proxies for capital and labor input indicators, respectively. Meanwhile, the number of outpatient visits, the number of inpatient visits and the hospital bed occupancy rate are used as proxies of output indicators for treatment and hospitalization, respectively. The descriptive statistics are reported in Table 1.
Descriptive Statistics for Input and Output Indicators.

Source. Henan Provincial Health and Wellness Commission upon Application.
According to the literature and data availability, counties with better levels of economic development have higher levels of supply and demand for healthcare resources 49 ; counties with larger populations may have more complete healthcare systems 3 ; fiscal indicators such as the scale of fiscal expenditure and fiscal self-sufficiency rate can also often influence the allocation of public health resources. 22 Therefore, 4 heterogeneity indicators are included in the spatial panel model (Table 2): per capita gross domestic product (PGDP), population size (POP), government fiscal capacity (GFC), and government fiscal self-sufficiency rate (GFS). Among them, GFC is the ratio of local budget expenditure to its GDP, and GFS is the ratio of local budget revenue to its expenditure. The relevant data is drawn from the China County Statistical Yearbook, the EPS database, and the statistical yearbooks of prefecture-level cities in Henan Province. In the regressions below, all control variables are logarithmized, and the monetary indicator (PGDP) was calculated at constant prices in 2009.
Descriptive Statistics for Control Variables.

Source. China County Statistical Yearbook, EPS Database and statistical yearbooks of various cities in different years.
Results
Allocative Efficiency Estimation Results
As is shown in Figure 2, the number of efficient counties first increased from 16 in 2009 to 22 in 2014 and then decreased to 11 in 2019. In 2009, efficient counties showed a very scattered dotted distribution. However, between 2014 and 2019, efficient counties were mainly concentrated in the urban areas near the provincial capital Zhengzhou and other nonmunicipal counties located in the southwest and southeast. The former are municipal districts of economically developed cities and the latter are typically economically backward areas.
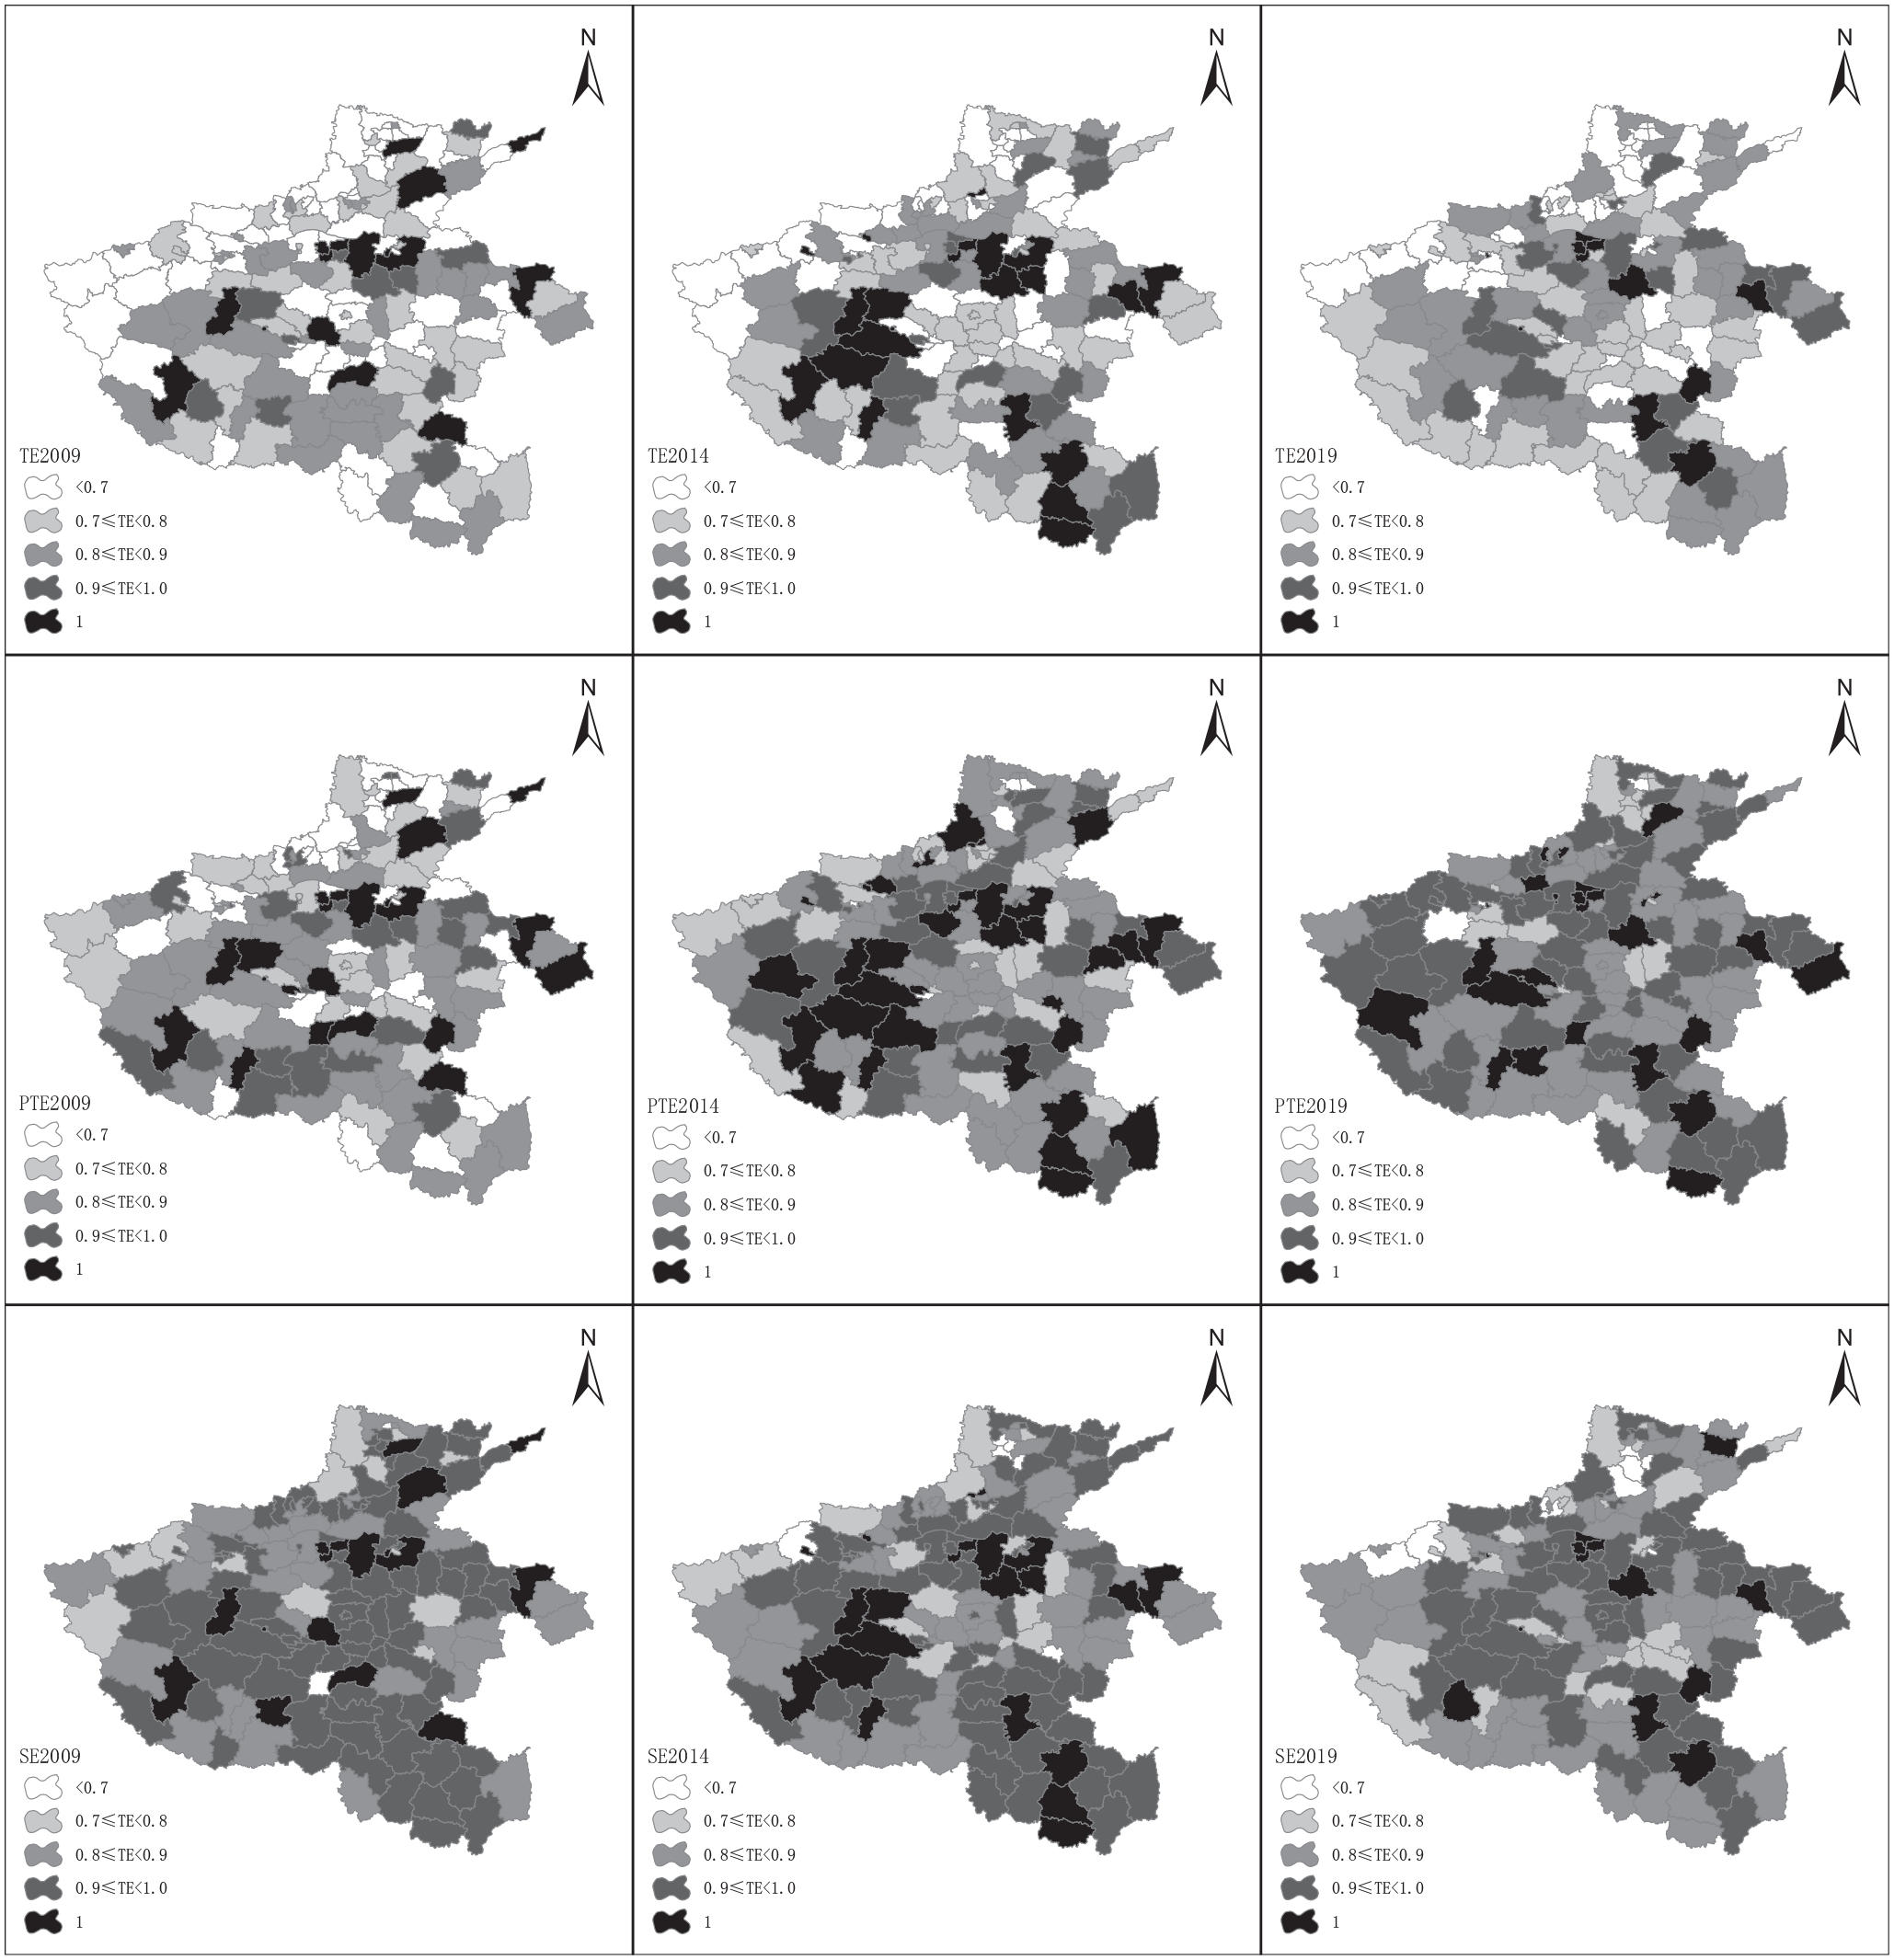
Spatial distribution of allocative efficiency of healthcare resources in Henan Province.
If we define those counties with an efficiency value below 0.70 as “very inefficient,” it can be observed that their values continued to decrease, from 35 in 2009 to 23 in 2014 to 18 in 2019. Because the differences among counties tend to decrease, a more balanced distribution of efficiency is generated. At the same time, the number of individuals with an efficiency rating at [0.90,1) is increasing rapidly, from 9 in 2009 to 13 in 2014 and finally up to 17 in 2019. The above results show an improving healthcare equity in the allocative efficiency for Henan Province. For PTE and SE, similar distribution dynamics can be observed generally.
Table 3 compares the average efficiency of municipal districts and nonmunicipal counties in Henan Province. We use the one-way analysis of variance (ANOVA) to determine whether there are significant differences between the 2 types of counties. If the results of an F-test in the ANOVA reach the threshold value, the mean of the 2 groups is significantly different. The SE experiences a fluctuating decline, while the PTE and the TE both show a fluctuating increase. When compared with the means of different sub-samples, findings show that the means are higher for nonmunicipal counties than for the municipal sub-sample. The ANOVA test provides evidence that the 3 efficiencies were significantly higher in nonmunicipal counties than in municipal counties during certain years.
Average Allocative Efficiency of Healthcare Resources in Municipal Districts.

Note. [1] Calculated using MaxDEA software; [2] I is for municipal districts, II is for non-municipal counties. [3] ***, **, and * denote significant at the 1%, 5%, and 10% levels respectively.
Spatiotemporal Evolution of the Allocative Efficiency of Healthcare Resources
Table 4 shows that Moran’s I indices from 2009 to 2019 are all positive. Among them, TE and SE show positive spatial correlation at the 5% significance level except for the year 2009; PTE does not show significant spatial correlation until 2017. The above results suggest a significant positive county-level spatial autocorrelation in the allocative efficiency of healthcare resources, suggesting that spatial effects should be considered in subsequent empirical studies.
Global Moran’s I Index Estimation Results of Allocative Efficiency in Henan.

Note. *** and ** indicate significant at the 1% and 5% levels, respectively.
The LISA clustering results are illustrated in Figure 3, which shows patchy distribution and a gradual increase in the number of HH agglomeration individuals in the TE, PTE, and SE over the sample period. From 2009 to 2019, the number of counties with LL agglomeration decreases. The hot spots of the HH agglomeration are mainly near the provincial capital, Zhengzhou, and in those counties near Xinyang in the southeast. The cold spots of LL agglomeration mainly exist in northern Henan: Anyang and Hebi. In total, inter-county imbalances could be observed for all the sample years; however, this imbalance tends to improve due to the decline in the number of spatially insignificant counties and the increased influence of high-level spatially clustered counties.

LISA clustering estimation results of allocative efficiency of healthcare resources in Henan Province.
Convergence Estimation Results
The exact form of the spatial effect in the spatial panel model needs to be determined before the estimation. The LM tests for all models reject the null hypothesis at the 5% significance level, indicating the existence of spatial effects. In addition, the results of the spatial Hausman test significantly suggest that we should use a two-way fixed effects spatial panel model. The results of the LR and Wald tests reject the null hypothesis, indicating that the SDM could not degenerate into SAR or SEM, so we selected a two-way fixed SDM model for β convergence estimation. The test table is shown in the Appendix Table A1.
The absolute β convergence results are reported in Table 5. For models with/without spatial effects, the β values are all negative at a 1% significance level, indicating that a significant convergence trend of allocative efficiency exists. The rate of convergence for PTE and SE models is faster than 9% with the SE model being relatively slow. In contrast, the TE model converges at a rate of slightly faster than 8%. The spatial lagged convergence coefficient W × β and the spatial autocorrelation coefficient ρ of the SE model are both significantly positive. This indicates that the growth rate of scale efficiency of certain counties is positively impacted by neighboring counties, generating a significant positive spatial spillover effect. However, the TE and PTE did not show a significant spatial correlation.
Absolute β Convergence Results of the Allocative Efficiency of Healthcare Resources.

Note. [1] (a) denotes model without spatial effect, and (b) means model with spatial effect; [2] ***, and * denote significant at the 1%, 5%, and 10% levels, respectively, with standard errors in parentheses.
Control variables were then introduced to the β convergence model as shown in Table 6. For the TE model, all control variables exert significant impact except for POP, which means these variables can inhibit the convergence rate. For the other efficiency models, differentiated estimation results reveal that certain control variables could impact the convergence rate, such as GFC and GFS’s impact on the PTE and SE models, respectively, which indicate that the evolution of a different efficiency indicator was driven by different factors.
Conditional β Convergence Results of Allocative Efficiency of Healthcare Resources.

Note. [1] (a) denotes model without spatial effect, and (b) means model with spatial effect; [2] ***, **, and * denote significant at the 1%, 5%, and 10% levels, respectively, with standard errors in parentheses.
Robustness Test Results
One main concern is that the maximum value of DEA efficiency must be limited to 1, which cannot reflect the variability of efficient counties and may affect the reliability of the empirical results. So, we re-estimate the county-level efficiency by using the SBM-super efficiency model and performing a robust test. The super efficiency method can take the maximum value of efficiency to greater than 1, allowing the variability of efficient units. For an efficient decision unit, the input is increased proportionally, provided its efficiency remains unchanged and the proportional increase in the input is recorded as the excess efficiency evaluation value. 50 The robustness test results are reported in Table 7, which indicate that the convergence coefficients β remain significantly negative by using the super efficiency measure, supporting the previous DEA model estimation results. Again, the convergence speed in the SE model is slower than in the PTE model. The convergence characteristics of allocative efficiency did not change after using the super efficiency method, indicating that previous empirical results are robust.
Results of the Absolute β Convergence Test for Super Efficiency.
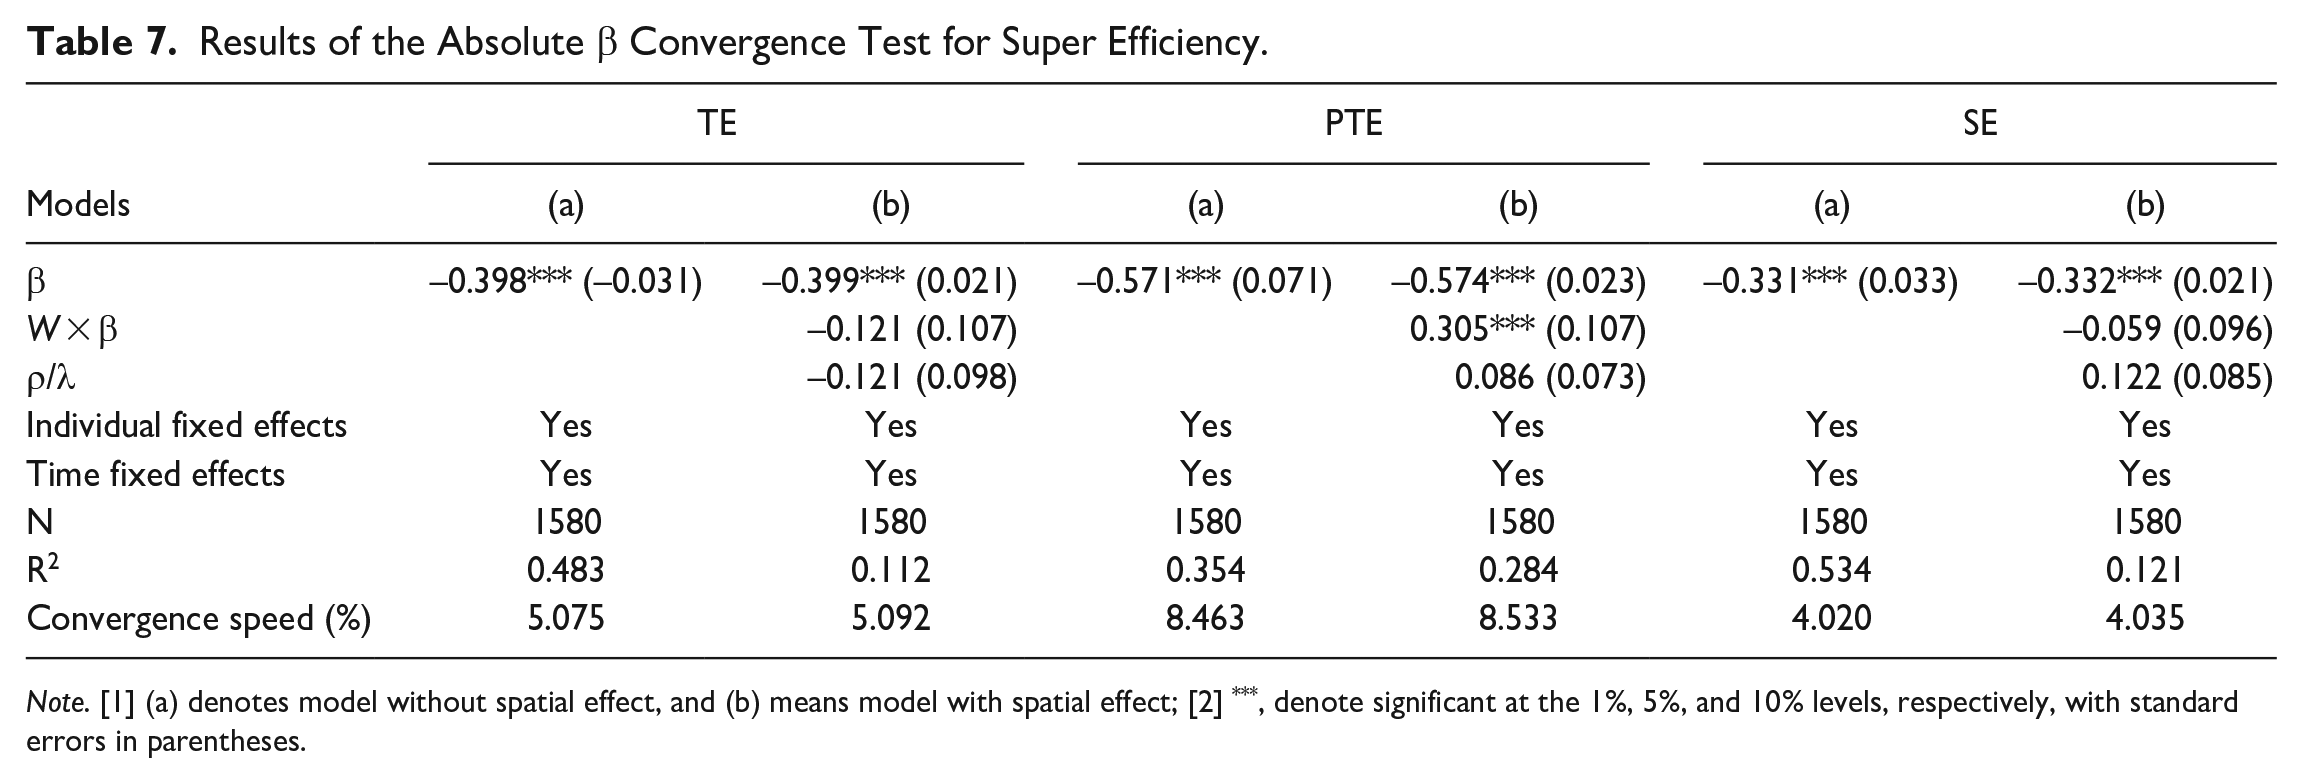
Note. [1] (a) denotes model without spatial effect, and (b) means model with spatial effect; [2] ***, denote significant at the 1%, 5%, and 10% levels, respectively, with standard errors in parentheses.
Heterogeneity Test Results
Another concern lies in the possible disparity of different subsamples, namely in municipal districts and other counties. The prevalent concept believes that municipal districts generally enjoy better economic development conditions and more concentrated healthcare resources, so their convergence dynamics should be different from nonmunicipal counties. We performed a heterogeneity test and reported the results in Table 8 and Appendix Table A2. As shown, in all the efficiency models, convergence could still be found, and this result is robust. For all 3 efficiency models, the municipal districts’ subsample converges slower than the nonmunicipal counties’ subsample, which is similar to ANOVA results. These results emphasized that the allocative efficiency of healthcare resources in nonmunicipal counties improved more rapidly after the 2009 reform, mainly because the focus of the past reform lies in nonmunicipal counties. The above results provide evidence of the effectiveness of the reform.
Results of the Conditional β Convergence Test for Municipal and Non-municipal Counties.

Note: [1] I and II denote municipal districts and non-municipal counties respectively; [2] ***, **, and * denote significant at the 1%, 5%, and 10% levels respectively, with standard errors in parentheses.
Discussion
The imbalance in the allocation of healthcare resources between urban and rural areas is a common challenge faced by major countries around the world. China’s 2009 New Healthcare Reform aimed to correct this imbalance with a comprehensive policy of expanding medical insurance coverage, increasing government investment, and descending healthcare resources with a focus on county-level hospitals. However, previous studies on this reform’s impact have resulted in mixed conclusions.25,35,39 The reform relaxed residents’ financial constraints and incentivized patients to flock to high-level hospitals in major cities, creating further congestion in the healthcare market. 8 More studies are needed to explore if improved efficiency and spatial convergence resulted in the use of healthcare resources after the activation of the 2009 reform. And, because the existing imbalance in resource allocation mainly occurs at the county level, a county-level empirical study would clarify the spatial evolution of resource allocation and its effect on healthcare equity.
The study’s 158-county sample of Henan Province, China, covers the municipal districts of major cities as well as those counties containing vast rural areas. The DEA efficiency estimation finds that the number of efficient counties did not increase since the 2009 reform but experienced an increasing pattern followed by a decreasing pattern. This signaled that the 2009 reform did contribute to spatial efficiency improvement over the sample period. However, since the number of inefficient counties kept decreasing, and the corresponding counties jumped to the adjacent higher efficiency internal, it can be concluded that a significant improvement in resource allocative efficiency exists after 2009 for Henan Province. When discussing PTE and SE, the mean of PTE tends to increase over the study period, implying an increase in factor utilization. However, the decline in SE provides clear evidence that healthcare inputs are not being used with the scale of economies. This is in line with previous findings that China’s healthcare reform has placed more emphasis on physical capital investment at the expense of human capital investment. 51
Since popular belief holds that significant differences exist between various county subsamples, we estimated the allocative efficiency of municipal districts and nonmunicipal counties separately and compared the means with the ANOVA method. Our findings show that nonmunicipal counties have a higher mean for different efficiency indicators than municipal districts. Additionally, significant between-group differences exist when using the ANOVA estimation. Although it is recognized that major cities usually have abundant healthcare resources, the above results suggest this is not the case for all municipal districts. One explanation could be the huge variability among municipal districts, which tends to correspond to larger inefficient samples. Comparatively, the variability among nonmunicipal counties is lower and corresponds to less divergence and higher average efficiency. Another explanation is patient choice: more patients choose a specific high-level hospital in a given district, which exacerbates inefficiencies in other districts because of low transportation costs within the major city. However, higher transportation costs and health insurance reimbursement rates enable nonmunicipal counties to attract local patients, which is strengthened when previous reform programs focus on improving diagnosis/treatment capability by descending healthcare resources. This is in line with the goal of the 2009 reform.
The results of Moran’s I index show the positive spatial correlation of allocative efficiency in Henan Province, especially in terms of SE and TE. This result supports previous supply- and demand-side studies, namely that significant spatial correlation and spatial spillover effects could also exist in allocative efficiency. Therefore, studies should consider interregional interactions and spatial effects in an empirical analysis of efficiency. Using the LISA clustering analysis, our study found that since the 2009 reform, the number of HH clusters has increased contiguously, which suggests the following: the expansion of demand due to the relaxation of financial constraints, the increased healthcare investment by local governments, and the matching efficiency change have a spatially competitive effect to drive efficiency county agglomeration and interaction. The HH agglomeration occurs mainly in the urban agglomeration where the provincial capital city Zhengzhou is located and in the adjacent counties of Xinyang in southeastern Henan. This is because more developed economies and higher levels of urbanization can contribute to higher levels of healthcare investment and corresponding financing needs and tend to present hotspots of HH agglomeration. In contrast, most agricultural counties in western and northern Henan are limited by their economic development and urbanization levels, so they tend to appear as LL hotspot areas. As a result, although the allocative efficiency has improved since the 2009 reform, the uneven county-level resource allocation is still there. This is a reminder that long-term investment and similar efforts are needed to correct the uneven resource allocation.
This paper also provides evidence of county-level convergence in allocative efficiency by using a spatial panel model. Convergence results have been found in existing supply- and demand-side studies at the provincial and city cluster levels. But county-level efficiency convergence provides evidence of the evolutionary and efficiency gains in the allocation of healthcare resources at smaller spatial scales since the 2009 reform. Moreover, this result holds significantly in both absolute and conditional β convergence estimations for models with/without spatial effects. While there are concerns that the DEA efficiency values are limited to ≤1, and that a DEA value of 1 for efficient counties may bias the estimates, the super efficiency model valuations answer such concerns. The robustness tests indicate similar convergence results. In addition, the estimated spatial lagged convergence and autocorrelation coefficients show that the growth rate of SE is positively influenced by neighboring counties, and this positive spatial spillover effect is consistent with the results of Moran’s I index measure.
There are limitations to this study. Due to data availability, the study used the county-level panel data of Henan Province to explore the evolution and convergence of allocative efficiency of healthcare resources. If further data is available, future studies should be extended to include different provinces in the eastern, middle, and western regions of the country using a longer time period and a larger sample to explore county-level heterogeneity. In addition, future research could provide richer empirical evidence on the differences and the reasons behind the differences between municipal and nonmunicipal counties. Finally, the marginal effects of the 2009 reform and the subsequent reforms on efficiency evolution should be discussed by using other empirical methodology like synthetic control method and Difference-in-Difference (DID) method.
Conclusion and Policy Implications
The main objective of China’s New Healthcare Reform triggered in 2009 is to promote a balanced distribution and convergence of healthcare resources among regions with a focus on county-level hospitals. However, the spatial evolution and convergence of county-level allocative efficiency of healthcare resources remain unclear in the years after the reform. This paper studied a 158-county sample of Henan Province to explore spatial distribution and convergence, utilizing a DEA-based efficiency measure and spatial panel model. Although the number of efficient counties does not increase, findings show that the number of inefficient counties keeps decreasing and the efficiency of municipal districts is lower than that of nonmunicipal counties, indicating a more balanced spatial distribution with obvious regional heterogeneity. Our spatial panel model provides clear evidence regarding the county-level convergence of allocative efficiency of healthcare resources. And using a different efficiency measure model, the super efficiency method, clearly demonstrated the robustness of the convergence estimation.
The study portrays a diversified picture of China’s county-level spatial evolution of allocative efficiency of healthcare resources since the 2009 reform. Although the existence of spatial efficiency convergence is evidenced, the complexity of efficiency evolution remains with the existence of spatial correlations. This study gives supporting evidence that China’s reform is effective in promoting the equity of healthcare resources; however, this is not enough. Long-term investment incentives and deeper supporting reforms are still needed to promote further convergence of efficiency and increase the number of counties with efficiency. During this process, spatial correlation and county heterogeneity should be fully considered, which calls for more targeted policy intervention and investment to exert incentives and to pressure those counties still in the ineffective range. For other developing countries facing the same healthcare equity problems, China’s reform experience and the lessons it brings could offer inspiration toward a more balanced and efficient healthcare system. If data availability improves, future studies could be extended to provinces in different regions to explore the heterogeneity and marginal effects of past reforms on the allocation of healthcare resources. This could provide further evidence for understanding the impact of China’s healthcare reform.
Footnotes
Appendix
Results of the Conditional β Convergence Test for Super-efficiency.

| Models | TE |
PTE |
SE |
|||
|---|---|---|---|---|---|---|
| (a) | (b) | (a) | (b) | (a) | (b) | |
| β | –0.400*** (0.023) | –0.408*** (0.034) | –0.572*** (0.082) | –0.578*** (0.035) | –0.333*** (0.033) | –0.344*** (0.019) |
| ln_pgdp | 0.038 (0.045) | 0.056 (0.062) | 0.022 (0.016) | 0.023 (0.019) | 0.011 (0.049) | 0.037 (0.044) |
| ln_pop | 0.167 (0.144) | 0.208 (0.149) | 0.077 (0.088) | 0.089 (0.075) | 0.114 (0.105) | 0.123 (0.131) |
| ln_gfc | 0.024 (0.038) | 0.037 (0.031) | 0.009 (0.042) | 0.012 (0.037) | 0.016 (0.041) | 0.045 (0.051) |
| ln_gfs | 0.036 (0.049) | 0.044 (0.051) | 0.017 (0.033) | 0.012 (0.023) | 0.012 (0.041) | 0.034 (0.028) |
| W × β | –0.116 (0.085) | 0.223** (0.102) | –0.099 (0.113) | |||
| ρ/λ | –0.083 (0.068) | 0.078 (0.094) | 0.039 (0.078) | |||
| Individual fixed effects | Yes | Yes | Yes | Yes | Yes | Yes |
| Time fixed effects | Yes | Yes | Yes | Yes | Yes | Yes |
| N | 1580 | 1580 | 1580 | 1580 | 1580 | 1580 |
| R2 | 0.478 | 0.145 | 0.358 | 0.167 | 0.421 | 0.134 |
| Convergence speed (%) | 5.108 | 5.242 | 8.486 | 8.627 | 4.050 | 4.216 |
Note. [1] (a) denotes model without spatial effect, and (b) means model with spatial effect; [2] *** and ** denote significant at the 1% and 5% levels, respectively, with standard errors in parentheses.
Declaration of Conflicting Interests
The author(s) declared no potential conflicts of interest with respect to the research, authorship, and/or publication of this article.
Funding
The author(s) disclosed receipt of the following financial support for the research, authorship, and/or publication of this article: The authors thank for the financial support from Key Projects of National Social Science Fund of China (22FJLA003).
Ethics Approval
This paper does not contain data collected from human subjects requires ethics approval.