
Abstract
This study analyzes hospital bed capacity and resource allocation using inflow and outflow indices to identify disparities in bed utilization. The COVID-19 pandemic highlighted the need for effective healthcare management, particularly in the allocation of specialized beds such as those in intensive care units (ICU). Despite a high bed-to-population ratio, South Korea faces regional disparities in bed distribution, especially in Seoul, which accounts for 12.4% of the nation’s hospital beds. Hospital beds were categorized based on the Medical Service Act, and the Relevance Index (RI) and Commitment Index (CI) were used to assess patient flow in 2019 across different bed types and functions. Data from the “Statistical Yearbook on the Usage of Medical Service by Region” provided insights into utilization patterns in tertiary referral hospitals, general hospitals, hospitals, and long-term care facilities. The analysis revealed high RIs for tertiary referral hospitals, indicating strong patient retention and minimal outflow, whereas lower RIs for long-term care hospitals suggested underutilization. Regional analysis within Seoul found a concentration of tertiary referral hospitals in the Southeast and a shortage of ICU beds in the Northwest and Southwest regions. The Inflow and Outflow Index confirmed significant patient inflow into tertiary referral hospitals, with some areas experiencing higher outflows, particularly for long-term care beds. These findings underscore the need for strategic hospital bed capacity management, prioritizing essential beds in underserved regions. Future research should incorporate more recent data and employ direct patient flow analysis to optimize resource allocation, addressing evolving healthcare demands, such as an aging population and new infectious diseases. This study offers valuable insights for regional health policy, aiming to enhance functional hospital bed management and improve overall healthcare resource utilization.
Keywords
Hospital bed capacity management is vital in urban areas, with notable disparities in bed distribution and utilization. Countries like the U.S., Germany, and Japan employ hospital bed categorization by function (eg, ICU, long-term care) to meet healthcare demands effectively. This underscores the importance of strategic resource allocation for bed capacity in regions such as Seoul to address health demands.
This study offers a comprehensive analysis of hospital bed capacity and utilization in Seoul using the RI and CI methodologies to measure patient flow. By highlighting regional disparities in hospital bed distribution, it provides a model for healthcare management that focuses on optimizing bed allocation, applicable even outside of pandemic scenarios, to enhance overall healthcare resource utilization.
The study’s insights into hospital bed capacity and resource allocation can assist hospital administrators and policymakers in making informed decisions about bed distribution. It emphasizes the importance of regular monitoring of bed usage patterns to address health services needs and ensure healthcare system stability, particularly in response to demographic changes and emerging health threats such as infectious diseases.
Introduction
On December 31, 2019, pneumonia of unknown origin emerged in Wuhan, Hubei Province, China and was later identified as COVID-19. South Korea reported its first confirmed case on January 20, 2020. 1 By midnight on March 18, 2022, as the number of COVID-19 patients surged, the hospital bed occupancy rate for severe cases reached 66.5%. Regional hospital bed capacity was stretched to 98.1% in Gwangju city, 86.4% in Jeollanam-do, and 85.7% in Gyeongsangnam-do, indicating saturation in certain areas. 2 This situation highlighted the critical need for the stable hospital bed capacity management, particularly for specialized beds, such as negative pressure isolation beds and intensive care unit (ICU) beds. Additionally, evolving demographics, changing disease patterns, and the emergence of new infectious diseases have increased the demand for strategic healthcare resource allocation and hospital bed expansion based on function.
In major developed nations within the Organization for Economic Cooperation and Development (OECD), including the United States, Germany, and Japan, hospital bed capacity is allocated by function, including bed types such as intensive care, rehabilitative care, and long-term care. As of 2020, South Korea had an average of 12.6 hospital beds per thousand people, nearly tripling the OECD average of 4.3. However, the distribution by function reveals disparities: rehabilitative care beds in Korea stood at 0.06 per thousand, significantly below the OECD average of 0.5, while long-term care beds were at 5.3 per thousand, almost 8 times the OECD average of 0.6. 3 This demonstrates a unique configuration within the Korean healthcare system.
In the same year, South Korea had a total of 685 636 hospital beds, with the capital being Seoul, accounting for approximately 12.4% with 84 678 beds. An analysis by type of medical institution revealed that tertiary referral hospitals accounted for 37.9% of the national total, with 17 269 of the 45 535 beds concentrated in Seoul. 4 A regional and functional analysis within Seoul showed that of the 7325 special hospital beds, 38.5% are in the Northeast region, 22.9% in the Southwest, 19.6% in the Southeast, and 18.9% in the Northwest. Notably, 1945 closed psychiatric beds are predominantly located in the Northeast, revealing significant regional and functional disparities. 5 This uneven distribution often fuels discussions regarding the shortage of hospital beds in Seoul and complicates the accurate assessment of bed supply and demand owing to a lack of detailed analysis, such as the Inflow and Outflow Index.
This study aims to define and categorize hospital bed capacity based on function to manage the supply and demand of essential beds in Seoul effectively, considering potential healthcare resource needs such as demographic changes and emerging infectious diseases. As of 2019, Seoul had a population of approximately 9.7 million and an area of about 605 km2. Surrounding Seoul are the neighboring regions of Gyeonggi-do and Incheon, which together cover approximately 11 229 km2 and have a total population of about 16 million. 6 Seoul and its surrounding regions forms a megacity complex that significantly impacts healthcare dynamics, illustrating the density and complexity of healthcare services management in this area.
To address these challenges, Seoul was divided into medical regions, and the study employed inflow and outflow indices to analyze hospital bed distribution. Using regional medical utilization statistics, methodologies such as the Relevance Index (RI) and Commitment Index (CI) were applied to categorize beds by type and function. Insights derived from this study can inform hospital bed allocation strategies within Seoul’s regional health policies, providing a framework for the distribution of essential beds to meet both current and future healthcare demands.
Literature Review
Hospital Bed Capacity Utilization Models
Hospital bed capacity utilization models have evolved from basic population-based approaches to more sophisticated methods. Initially, organizations like the World Health Organization (WHO) used population-based bed models, comparing the number of beds per 10 000 people. 7 While useful for large-scale comparisons, these models didn’t fully reflect actual healthcare demands based on demographic or regional variations.
Resource-normalized models were introduced to account for available resources like staff and equipment, offering a more dynamic approach. For example, Bagust et al 8 developed a stochastic simulation to optimize bed use during fluctuating emergency admissions. Moreover, geographic service area models like RI and CI, developed by Griffith, 9 assess the relationship between hospitals and the surrounding communities. These models enable better resource allocation based on local demand, identifying which communities are most dependent on specific hospitals.
The Erlang equation has also been effectively utilized to analyze bed requirements within hospitals based on average occupancy and arrival rates. Originally developed within queuing theory, the Erlang equation helps predict the probability of turn-away events, which occur when beds are fully occupied, preventing patient admissions. 10 This model is particularly useful in estimating bed requirements for specific departments or entire hospitals by considering patient flow and service intervals. By allowing healthcare planners to understand the relationship between occupancy rates and turn-away probabilities, the Erlang equation provides valuable insights into optimizing bed allocation, especially under fluctuating patient admission rates.
Another key advancement in hospital bed capacity planning is the Nearness to Death (NTD) model. The NTD model highlights the significant rise in hospital bed usage as individuals approach the end of life, particularly in aging populations where mortality rates serve as a more accurate predictor of bed demand than population size alone. 11 Furthermore, the model is expanded to project local and regional bed requirements, demonstrating its effectiveness in tailoring healthcare capacity to meet end-of-life care needs. 12 Most recently, artificial intelligence (AI) and machine learning have transformed bed forecasting. Models like Support Vector Machines (SVM) 13 predict bed demand using historical data on patient demographics and seasonal trends, offering real-time insights that help hospitals manage resources more effectively during peak periods.
Categorization of Hospital Beds by Function in Other Countries
The OECD categorizes beds by function into curative care beds, rehabilitative care beds, long-term care beds, and other hospital beds and counts the number of beds, including psychiatric beds. Curative care beds are all available for acute care, including treating diseases, injuries, surgery, illness or injury, or maternity care. Rehabilitation care beds are hospital beds that are available for rehabilitation treatment to stabilize, recover, and improve disorders of body functions and structures. Long-term care beds are intended to accommodate patients who need long-term care, and other hospital beds are all other hospital beds that are not otherwise classified. 3
In the United States, the American Hospital Association (AHA) classifies beds into staff and intensive care beds. Intensive care beds are divided into medical-surgical intensive care, cardiac intensive care, neonatal intensive care, pediatric intensive care, and burn care. 14
In Japan, the Ministry of Health, Labour and Welfare announced the “Regional Medical Initiative” in June 2014 to improve the medical supply system by estimating medical needs and hospital beds in preparation for the year 2025, when the Tankai generation (Baby boomers born in 1947 to 1949 account for 5.4% of Japan’s total population) becomes older. It divided bed functions into the advanced acute/acute phase (general ward), convalescent phase (convalescent rehabilitation ward, community comprehensive care ward), chronic phase (long-term care ward), and others (palliative care ward, dementia ward), planning to reduce acute and chronic beds and focus on expanding convalescent beds (Table 1). 15
Categorization of Hospital Beds According to Function in Japan.

Source. Japan’s Ministry of Health, Labor, and Welfare Homepage. 16
These examples reflect a global trend toward strategic hospital bed management based on specific healthcare functions, aimed at addressing demographic changes and evolving medical needs efficiently.
Classification of Hospital Beds by Function and Supply and Demand Status in Korea
In Korea, hospital beds are classified primarily according to the Medical Service Act. This categorization is essential when reporting the status of a medical institution under Article 33(3) of the Medical Service Act and Article 25 of its Enforcement Regulations. The categories included general beds, closed psychiatric beds, ICU beds (for adults, neonates, and pediatric patients), isolation beds, aseptic treatment beds, and beds for foreigners only. Special care areas include beds in delivery rooms, neonatal units, operating rooms, recovery rooms, emergency rooms (ER), and other specialized facilities. Each category is equipped with a specific number of beds, which are detailed in the regulatory reports, to manage healthcare resources effectively (Table 2).
Classification and Types of Hospital Rooms of Medical Institutions in Korea.

Source. Health Insurance Review and Evaluation Service (2015). 17 A plan to improve the health insurance system for efficiently operating hospital beds.
Closed psychiatric beds are located in secure wards that are separated from other departments, restrict public access, and are exclusively for psychiatric patients.
In “The fifth National Health and Medical Survey” 4 conducted by the National Health Insurance Service (NHIS), Seoul was strategically divided into 4 medical regions: central, northeast, southwest, and southeast. This segmentation aimed to accurately forecast the supply and demand for general hospital beds up to 2026. The forecast methodology started with the U.S. Hill-Burton formula 18 and was further refined using inflow and outflow indices, such as the RI and CI, to analyze regional healthcare utilization patterns and patient flows.
The analysis indicated that by 2026, Seoul is expected to have 27 214 beds in facilities with more than 300 beds, and 25 564 beds in facilities with fewer than 300 beds. However, demand projections were significantly higher, estimated at 32 136 beds for larger facilities and 35 133 beds for smaller ones, suggesting a potential shortfall of 4921 beds in the larger facilities and an even more considerable deficit of 9569 beds in the smaller facilities. A comparative analysis of other medical regions revealed similar trends, although the southwest region was an exception, predicted to have an excess supply of beds in facilities with more than 300 beds (Table 3).
Analysis of Hospital Bed Supply/Demand in Seoul (as of 2026). (Unit: number of beds).

Source. National Health Insurance Service (2022). 4 The fifth National Health and Medical Service Survey.
A-B/+: excessive, − : insufficient.
Methods
Data Sources
This study analyzed the categorization of hospital beds capacity and inflow and outflow indices in Seoul using health insurance fee codes classified by type and function according to the ICD-10 standard (Tables A1-A5 in Appendix A). Data regarding healthcare utilization status both within and outside Seoul’s city, county, and gu districts were sourced from the “Statistical Yearbook on the Usage of Medical Service by Region (2019),” 19 obtained from the Big Data Strategy Headquarters of the NHIS. The analysis focused on RI and CI to determine whether registered residents of Seoul utilized health services within the city or elsewhere. The 2019 data were specifically chosen to exclude the impact of COVID-19, mirroring the methodology employed in Section, 4 which used 2019 as a baseline year to avoid the pandemic’s effects, ensuring data stability and relevance.
As of 2019, there are 13 tertiary referral hospitals, 44 general hospitals, 228 hospitals, 124 long-term care hospitals, 8628 clinics, 65 dental hospitals, 4836 dental clinics, 53 oriental medicine hospitals, 3617 oriental medicine clinics, 25 public health centers, and 8 public health sub-centers located in Seoul. 19 The bed counts for these institutions are shown in Table 4. This study specifically focuses on tertiary referral hospitals, hospitals, and long-term care hospitals as the primary subjects of the research.
Classification and Counts of Hospital Rooms of Medical Institutions in Seoul.

Source. Statistical Yearbook on the Usage of Medical Service by Region (2019). 19
Categorization of Beds by Function
A comprehensive literature review of hospital bed capacity classification revealed various functional categorizations, all of which align with the Medical Service Act. Accordingly, this study adhered to the Medical Service Act’ framework, which organizes beds within medical institutions into inpatient and special care areas (Table 5). Medical institutions were further categorized into hospitals, general hospitals, tertiary referral hospitals, and long-term care hospitals based on specific criteria: hospitals must contain more than 30 beds; long-term care hospitals should provide facilities for extended hospitalization; general hospitals are required to have 100 to 300 beds and at least 7 medical specialties, or >300 beds with at least 9 specialties; and tertiary referral hospitals must feature more than 20 medical specialties and specialize in complex treatments for severe illnesses. 20
Categorization of Hospital Beds by Function in This Study.

Categorization of Medical Regions
The division of Seoul into 4 medical regions—northeast, southwest, southeast, and Northwest—was based on the “Research on Analysis of Medical Resources and Medical Utilization by Regions in Seoul (2021)” 5 conducted by the Seoul Health Foundation. This categorization aligns with the established regional segmentation used in the previous analyses (Figure 1), which was generated using Photoshop (Adobe Inc., San Jose, California, United States).

Medical regions of Seoul (Seoul Health Foundation 5 ).
Approach and Formulation of Relevance and Commitment Indices
This study adopted the RI and CI methodologies to analyze hospital bed utilization in Seoul due to the study’s focus on regional healthcare dynamics and the functional differentiation of hospital beds capacity. While other models, such as the NTD model, have been applied in previous studies to predict hospital bed utilization based on mortality rates, particularly in assessing acute care beds where end-of-life care plays a significant role in hospital bed occupancy, 11 a more detailed approach was necessary for this study. Given Korea’s single-payer national health insurance system, which provides comprehensive data on bed availability and healthcare utilization across different types of hospitals—including hospitals, general hospitals, and tertiary referral hospitals—this approach allows for tracking bed usage across different hospital functions, such as intensive care, long-term care, and isolation units. As a result, the RI and CI methodologies were deemed more appropriate for this research, as they offer the ability to analyze patient flow and resource allocation at a granular level.
Previous research in South Korea has extensively applied the RI and CI methodologies to analyze regional healthcare utilization. This includes a study that examined patient flow in emergency medical services, revealing regional disparities and patient movement between facilities, 21 as well as a retrospective analysis from 2016 to 2020 that used RI to track disease-specific healthcare demand across different regions, facilitating more efficient resource allocation. 22 Additionally, research into regional differences in dental service utilization further validated the effectiveness of RI and CI in identifying gaps in healthcare accessibility and optimizing the distribution of medical resources based on actual regional needs. 23
On an international level, methodologies for projecting hospital bed needs and planning healthcare facilities in Michigan have been influenced by the Certificate of Need (CON) program, which regulates healthcare facility expansion by evaluating community healthcare needs, such as population growth and seasonal fluctuations. These approaches emphasize the importance of regional data in healthcare planning and align with the use of RI and CI models for optimizing resource allocation. 24 By controlling the distribution of facilities, the CON program supports efficient resource allocation, reinforcing the relevance of RI and CI in regional healthcare strategies. 25
Relevance Index (RI)
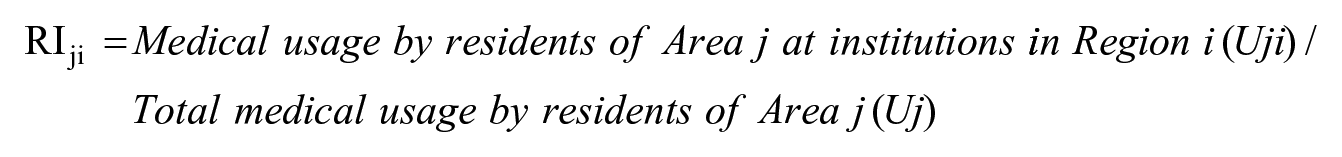
The RI quantifies the proportion of medical services utilized by residents of a specific area (Area j) at medical facilities within the same region (Region i), compared to the total medical services used by residents of that area. 4 This index is instrumental in analyzing medical service outflow within a region, as an RI of 100 indicates that residents of Area j exclusively utilize medical facilities within Region i, showing no outflow to other regions.
Commitment Index (CI)
The CI measures the percentage of medical services utilized by residents of a particular area (Area i) at facilities in another area (Region j), relative to the total medical services available from facilities in Region j. 4 This index aids in understanding patient inflow from other regions. This index aids in understanding patient inflow from other regions, as a CI of 100 signifies that all medical services provided by facilities in Region j are utilized exclusively by residents from Area i, indicating complete reliance on this patient population.

Inflow and outflow index
The inflow and outflow indices were calculated by dividing the RI by the CI. This index is interpreted as follows: if the index is greater than 1, it indicates a higher inflow than outflow; if it is less than 1, it suggests a higher outflow than inflow; and an index of 1 signifies that the inflow and outflow are in equilibrium. 4
Results
RI by Type and Function in Seoul
In 2019, the proportions of inpatients using medical care in the Seoul metropolitan area were as follows: tertiary referral hospitals (94.74%), hospitals (86.27%), general hospitals (85.45%), and long-term care hospitals (57.76%). For adult ICU beds, the proportion was highest in tertiary referral hospitals (93.64%), followed by general hospitals (81.59%) and hospitals (63.51%). The proportion of neonatal ICU beds was also the highest in tertiary referral hospitals (94.98%), followed by general hospitals (89.07%). The highest proportion of isolation beds was found in tertiary referral hospitals (95.04%), followed by general hospitals (84.92%), long-term care hospitals (75.84%), and hospitals (74.24%). The proportion of aseptic treatment beds was the highest in tertiary referral hospitals (98.01%) and general hospitals (78.57%). Pediatric ICU beds, available only in tertiary referral hospitals, accounted for 100%, and ER beds accounted for 88.05%, with no classification by type (Table 6).
2019 RI by Type and Function in Seoul (Unit: %).

When dividing Seoul by region and examining the main results by type and function, it was found that the highest proportions of tertiary referral hospitals (44.37%), hospitals (50.31%), and long-term care hospitals (28.79%) were in the southeast region. The proportion of ER beds (47.33%) was also the highest in the southeast region (Table 6).
CI by Type and Function in Seoul
In 2019, among all inpatients in Seoul, the proportion of medical use was 71.65% for long-term care hospitals, followed by 70.93% for general hospitals, 63.09% for hospitals, and 52.29% for tertiary referral hospitals. The proportion of adult ICU beds was highest in general hospitals (67.93%), followed by hospitals (62.67%), and tertiary referral hospitals (44.99%). The proportion of neonatal ICU beds was highest in general hospitals (60.89%), followed by tertiary referral hospitals (51.74%). The proportion of isolation beds was higher in hospitals (75.08%), followed by general hospitals (69.86%), long-term care hospitals (65.27%), and tertiary referral hospitals (48.10%). The proportion of aseptic treatment beds was higher in general hospitals (50.00%), followed by tertiary referral hospitals (26.06%). The proportions of pediatric ICU beds and ER beds in tertiary referral hospitals were 24.37% and 68.85%, respectively (Table 7).
2019 CI by Type and Function in Seoul (Units: %).

Considering the main results by region, the highest proportions of total inpatient beds were in general hospitals (41.12%) and hospitals (39.16%) in the Northeast region, tertiary referral hospitals (32.77%) in the Southwest region, and long-term care hospitals (41.17%) in the Northwest region. For ER beds, the highest proportion (40.74%) was in the Northeast region (Table 7).
Inflow and Outflow Index by Type and Function
In 2019, the Inflow and Outflow Index for inpatients by type and function in Seoul showed that tertiary referral hospitals had the highest indices for total inpatient beds (1.81), adult ICU beds (2.08), neonatal ICU beds (1.84), isolation beds (1.98), and aseptic treatment beds (3.76). The index for pediatric ICU beds in tertiary referral hospitals was 4.10, and for ER beds, it was 1.28 (Figure 2, Table B1 in Appendix B). Figure 2 was generated using Tableau (Tableau software, LCC., Seattle, Washington, United States).
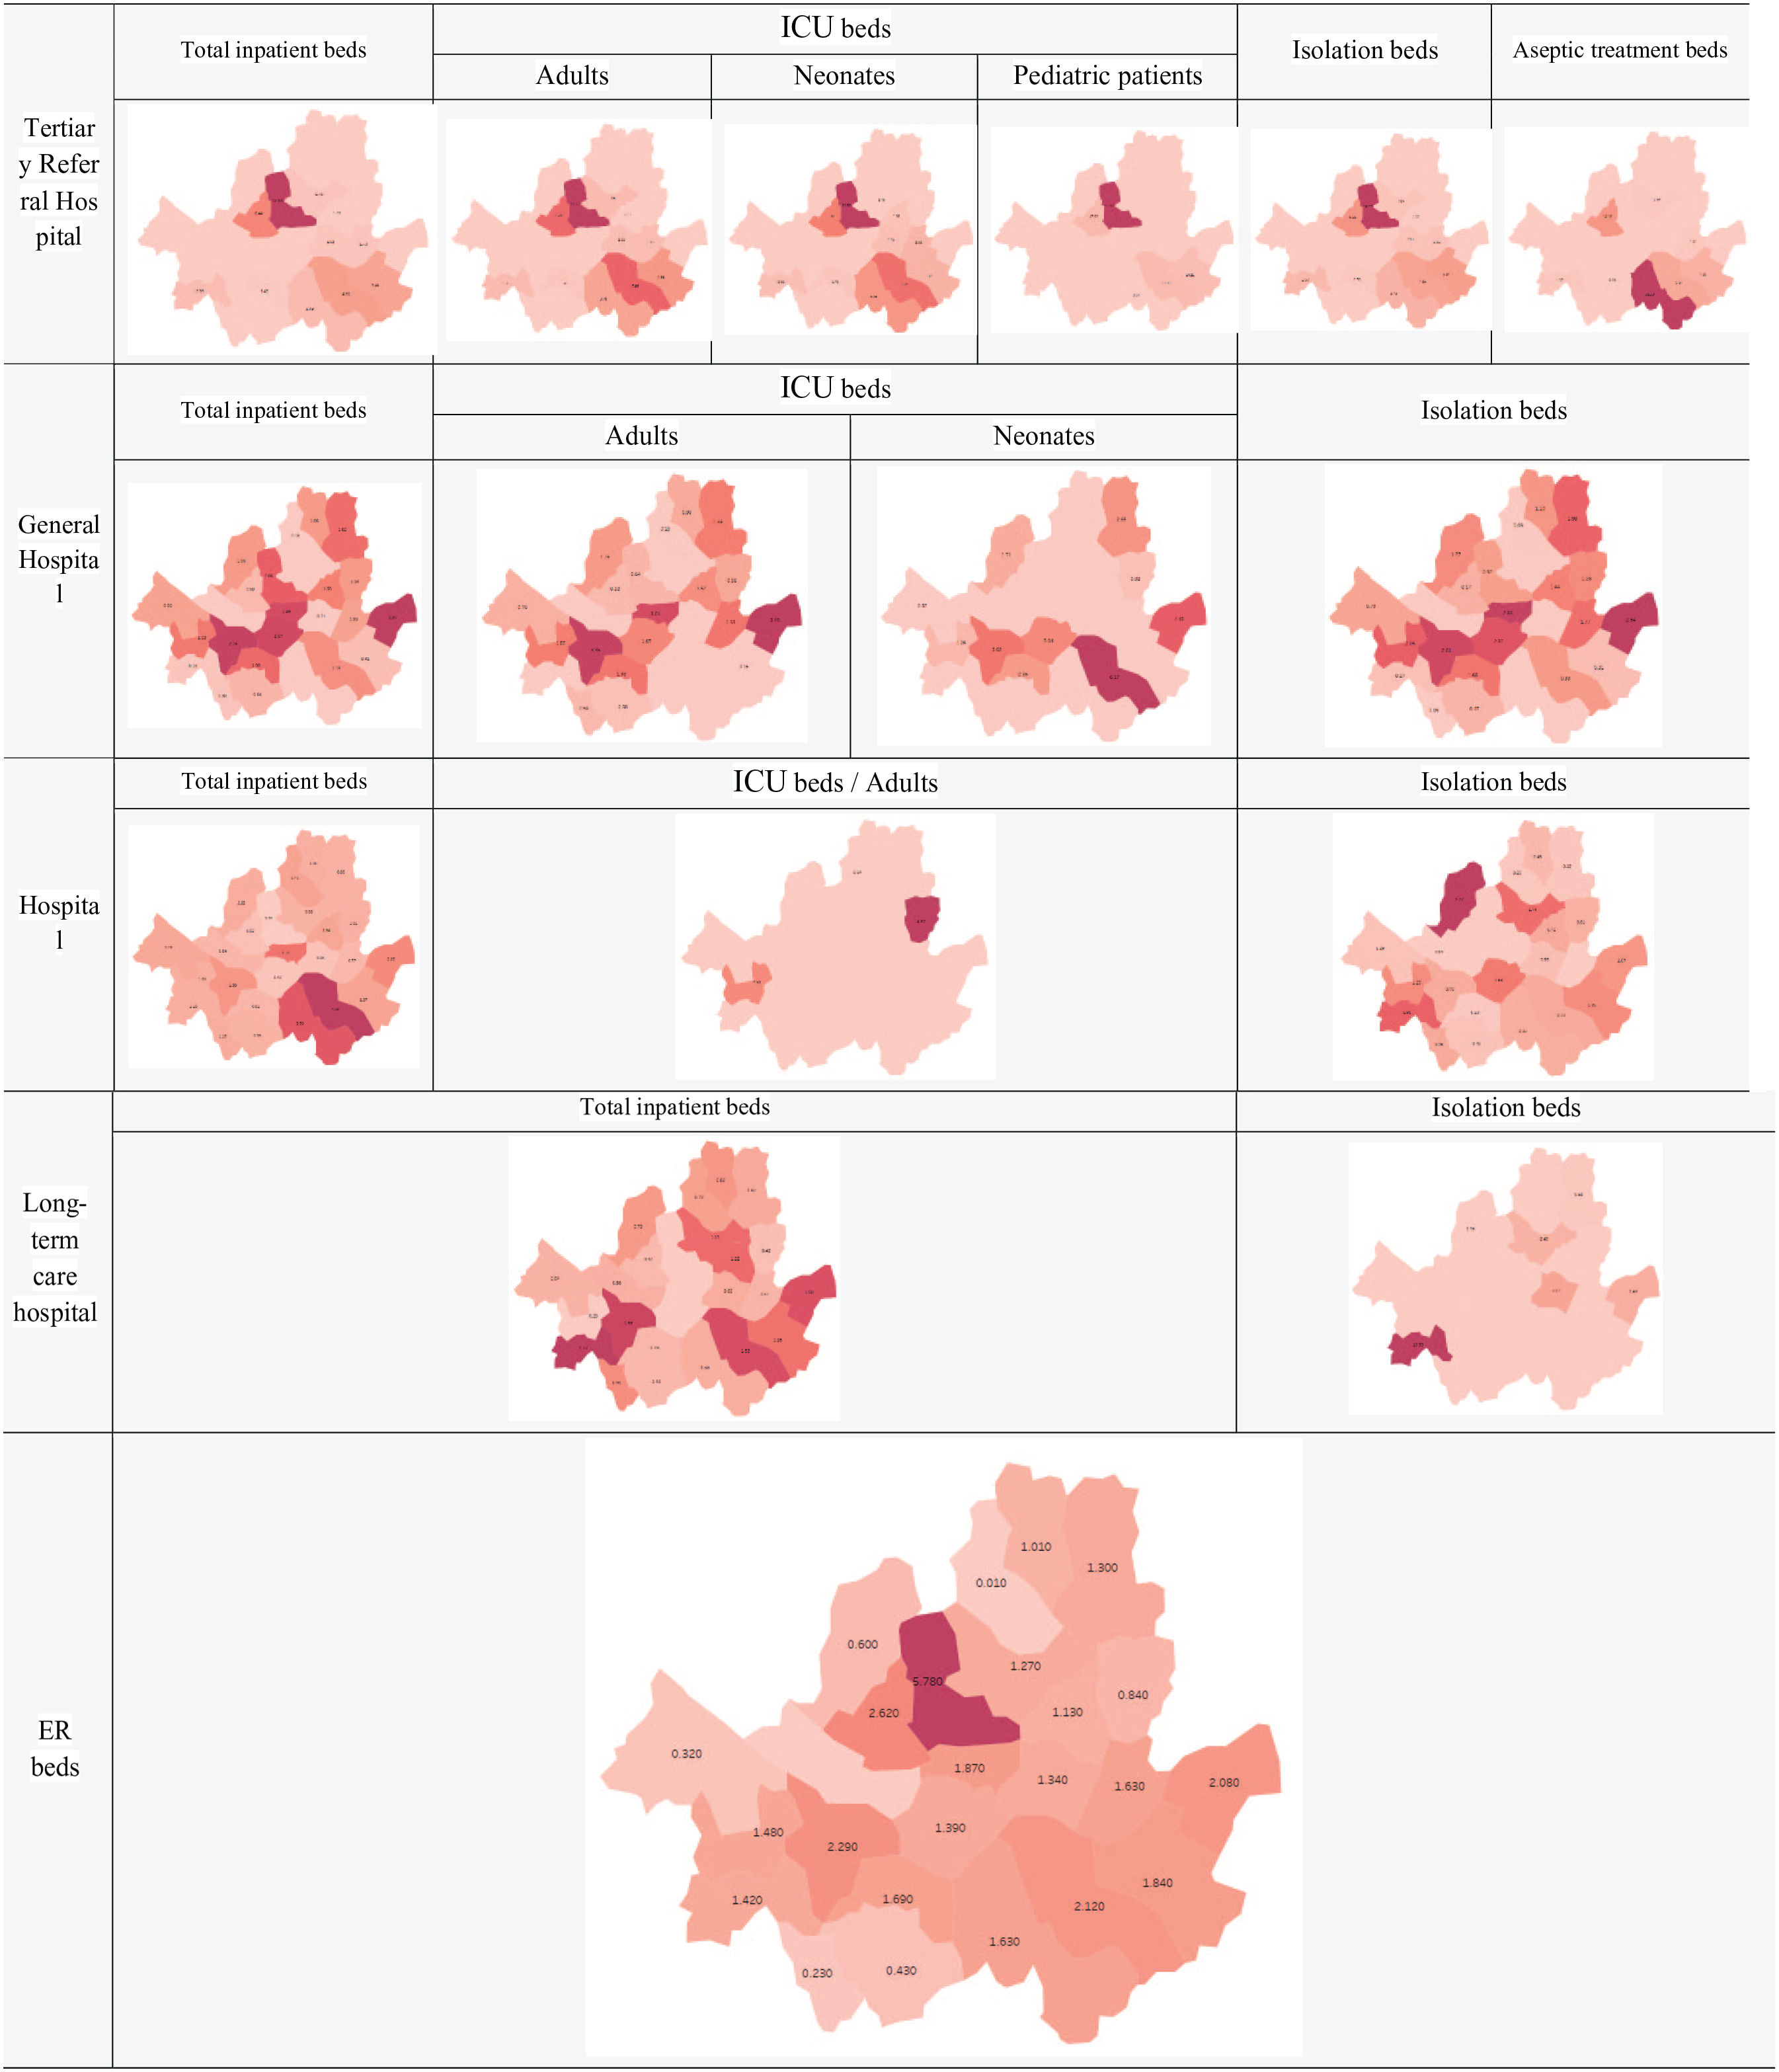
2019 Inflow and Outflow by type and function in Seoul.
In terms of total inpatient beds by region, the highest indices were observed in tertiary referral hospitals (3.35), general hospitals (1.51), hospitals (2.59), and long-term care hospitals (1.21) in the southeast region, as well as the ER beds (1.91) in the southeast region (Figure 2, Table B1 in Appendix B).
Discussion
Implications
RI refers to the proportion of patients admitted to a medical institution in the same area as their residence, helping to determine the degree of outflow by region. The higher the index, the lower is the outflow to other regions. Analyzing the RI of Seoul, all tertiary referral hospitals had the highest RI at more than 90%, followed by general hospitals, hospitals, and long-term care hospitals. These results align with those from previous research, 4 which showed that the RI of medical institutions in Seoul was the highest for tertiary referral hospitals (95.1%), general hospitals (500 beds or more, 84.9%), and hospitals (100 beds or more, 79.0%). Inpatients in Seoul tended to use medical institutions located in Seoul, the more advanced the hospital, the less outflow to other areas. However, when examined by region, the proportion of inpatient beds in tertiary referral hospitals was significantly lower in the northwest region (16.86%) and southwest area (26.02%) than in the entire city of Seoul and other regions.
CI refers to the proportion of patients who live in the same area among those admitted to medical institutions in that region. This helps to determine the degree of inflow from other regions, and the higher the ratio, the lower the inflow from other regions. Analysis of CI in Seoul revealed that long-term care hospitals had the highest index, exceeding 65%, followed by general hospitals, hospitals, and tertiary referral hospitals. In the northwestern region, the index was notably low for pediatric ICU beds (1.75%), aseptic treatment beds (4.06%), and total inpatient beds (5.90%) of tertiary referral hospitals, confirming the high inflow from other regions. Additionally, the pediatric ICU beds, which exist only in the northwest and southeast regions of tertiary referral hospitals, had the lowest CI of 24.37%. Therefore, it is necessary to consider new beds and budgets in the Northeast and Southwest regions, where pediatric ICU beds do not exist.
The Inflow and Outflow Index, which is the ratio of the total number of patients in medical institutions in a particular area to the total number of patients living in a specific area, indicates that if it is greater than one, the inflow is greater than the outflow. One of Seoul’s main features was that all beds by function in the tertiary referral hospitals showed the highest index compared to other types and functional beds. Except for hospital isolation beds (0.99) and long-term care hospital inpatient beds (0.81) in Seoul, the values for beds by type and function were greater than 1. These results were similar to those from earlier study, 4 with the index of Seoul being 1.60 for more than 300 general beds and 1.33 for less than 300 general beds. Compared with other cities and provinces, excluding long-term care hospitals, Seoul showed the highest index in the country, indicating that most of Seoul’s beds by type and function have more inflows than outflows. This is likely because 15 of the 45 (33.33%) tertiary referral hospitals nationwide are concentrated in Seoul, Thus, this trend continues in Seoul.
Limitations and Future Research Directions
This study has several limitations that highlight areas for future improvement. First, while the RI and CI models were effective in assessing hospital-community relationships in Seoul, they rely on centralized data available in systems like South Korea’s single-payer insurance, limiting their applicability in countries with fragmented healthcare systems. Additionally, alternative approaches such as the NTD model and the Erlang equation, which predict bed demand based on end-of-life care patterns and hospital occupancy dynamics, were not incorporated into this study. Integrating these models in future research could provide a more comprehensive understanding of hospital bed utilization by combining regional patient flow analysis with specific predictors of bed demand and resource allocation, allowing for more precise planning in varying healthcare contexts.
Second, this study relied on health insurance fee codes from the 2019 regional medical utilization data to determine inpatient bed usage by type and function. This reliance can introduce errors, such as duplications when patients are transferred between beds. Furthermore, using only 2019 data limits the ability to compare trends over multiple years, unlike prior analysis 4 that tracked changes from 2015 to 2020.
Based on these limitations, future research should consider the following points: Initially, to prevent errors, such as duplicates in calculating hospitalization usage based on fee codes, accurate predictions should be made if primary data are obtained, and direct analysis should be performed. Additionally, if the Seoul Metropolitan Government monitors hospital bed capacity through periodic estimation, it will be able to plan measures such as securing essential beds for each function; which will also assist with the local healthcare planning established by the district. If these results are reflected in the bed supply and demand plan in the local healthcare plan, it will help secure and stably manage beds for each function, responding to changes, such as the aging population and new infectious diseases.
Conclusion
This study analyzed hospital bed capacity in Seoul, focusing on the inflow and outflow indices to identify disparities in hospital bed utilization. The findings revealed that tertiary referral hospitals in Seoul show high utilization and minimal regional leakage, while long-term care hospitals are underutilized. Additionally, the study identified regional disparities in Seoul’s bed distribution, with the Northeast having many special beds, the Southeast concentrating on tertiary referral hospitals, and the Northwest and Southwest facing shortages, particularly of ICU beds.
Footnotes
Appendix A
ICD-10 Codes of Health Insurance Fee for Beds by Function in Emergency Rooms.

| Functions | Codes of fees |
|---|---|
| Central Emergency Medical Centers | V1100 |
| Regional Emergency Medical Centers | V1200, V1210, V1220 |
| Local Emergency Medical Centers | V1300, V1310, V1320 |
| Local Emergency Medical Institutions | V1400 |
| Regional Emergency Medical Centers-Regional Trauma Centers | V1500, V1510, V1520 |
| Local Emergency Medical Centers-Regional Trauma Centers | V1800, V1810, V1820 |
Appendix B
2019 Inflow and Outflow Index by Type and Function in Seoul.

| Category | Tertiary referral hospital | General hospital | Hospital | Long-term care hospital | ER beds | |||||||||||||
|---|---|---|---|---|---|---|---|---|---|---|---|---|---|---|---|---|---|---|
| Total inpatient beds | Intensive care unit beds | Isolation beds | Aseptic treatment beds | Total inpatient beds | Intensive care unit beds | Isolation beds | Aseptic treatment beds | Total inpatient beds | Intensive care unit beds | Isolation beds | Total inpatient beds | Isolation beds | ||||||
| Adults | Neonates | Pediatric patients | Adults | Neonates | Adults | |||||||||||||
| Seoul | 1.81 | 2.08 | 1.84 | 4.10 | 1.98 | 3.76 | 1.20 | 1.20 | 1.46 | 1.22 | 1.57 | 1.37 | 1.01 | 0.99 | 0.81 | 1.16 | 1.28 | |
| Subtotal | 2.86 | 2.96 | 2.05 | 12.47 | 3.11 | 6.95 | 1.30 | 1.14 | 0.95 | 1.32 | 0.93 | 1.41 | 0.42 | 0.26 | 1.63 | |||
| Northwest Region | Jongno-gu | 12.33 | 11.20 | 10.32 | 127.00 | 14.22 | 2.05 | 0.64 | 0.92 | 0.20 | 5.78 | |||||||
| Jung-gu | 2.49 | 3.01 | 2.83 | 2.72 | 1.87 | |||||||||||||
| Yongsan-gu | 2.57 | 1.67 | 3.04 | 2.32 | 0.42 | 1.53 | 1.39 | |||||||||||
| Eunpyeong-gu | 1.08 | 1.26 | 1.71 | 1.27 | 1.12 | 2.77 | 0.79 | 0.75 | 0.60 | |||||||||
| Seodaemun-gu | 6.44 | 7.56 | 5.90 | 17.94 | 6.16 | 14.18 | 0.50 | 0.53 | 0.57 | 0.52 | 0.47 | 2.62 | ||||||
| Mapo-gu | 0.84 | 0.13 | 0.56 | |||||||||||||||
| Subtotal | 1.03 | 1.10 | 1.27 | 1.17 | 0.67 | 1.05 | 1.04 | 1.16 | 1.12 | 1.02 | 1.49 | 0.79 | 0.79 | 1.03 | 1.08 | |||
| Northeast Region | Seongdong-gu | 1.63 | 2.00 | 2.20 | 2.10 | 0.21 | 0.48 | 0.35 | 0.60 | 3.27 | 1.34 | |||||||
| Gwangjin-gu | 1.70 | 2.10 | 2.81 | 2.21 | 1.41 | 0.93 | 1.98 | 1.77 | 0.77 | 0.52 | 1.63 | |||||||
| Dongdaemun-gu | 1.24 | 1.09 | 1.98 | 1.37 | 1.50 | 1.52 | 1.44 | 1.34 | 0.72 | 1.22 | 1.13 | |||||||
| Jungnang-gu | 1.08 | 0.98 | 0.92 | 1.28 | 1.01 | 4.87 | 0.61 | 0.42 | 0.84 | |||||||||
| Seongbuk-gu | 1.75 | 2.14 | 1.46 | 2.05 | 1.25 | 0.96 | 1.74 | 1.21 | 2.40 | 1.27 | ||||||||
| Gangbuk-gu | 0.18 | 0.19 | 0.09 | 1.41 | 0.64 | 0.20 | 0.72 | 0.01 | ||||||||||
| Dobong-gu | 1.06 | 0.90 | 1.10 | 1.05 | 0.46 | 0.82 | 1.01 | |||||||||||
| Nowon-gu | 1.82 | 1.86 | 2.65 | 1.98 | 0.98 | 0.23 | 0.62 | 0.98 | 1.30 | |||||||||
| Subtotal | 0.79 | 1.22 | 0.93 | 1.83 | 0.63 | 1.23 | 1.51 | 1.61 | 1.39 | 1.16 | 1.14 | 0.97 | 0.88 | 2.19 | 1.12 | |||
| Southwest Region | Yangcheon-gu | 1.63 | 1.82 | 1.26 | 2.05 | 1.09 | 2.51 | 1.25 | 0.29 | 1.48 | ||||||||
| Gangseo-gu | 0.92 | 0.76 | 0.52 | 0.79 | 1.28 | 0.29 | 0.54 | 0.32 | ||||||||||
| Guro-gu | 2.29 | 2.12 | 2.22 | 2.90 | 1.67 | 0.28 | 0.27 | 1.10 | 1.95 | 1.77 | 10.39 | 1.42 | ||||||
| Geumcheon-gu | 0.30 | 0.54 | 0.05 | 1.13 | 0.75 | 0.91 | 0.23 | |||||||||||
| Yeongdeungpo-gu | 2.76 | 3.35 | 3.62 | 2.61 | 1.80 | 0.70 | 1.66 | 2.29 | ||||||||||
| Dongjak-gu | 1.42 | 1.38 | 1.78 | 1.70 | 0.48 | 1.90 | 1.98 | 2.36 | 1.65 | 0.81 | 0.18 | 0.49 | 1.69 | |||||
| Gwanak-gu | 0.56 | 0.38 | 0.47 | 0.96 | 0.28 | 0.48 | 0.43 | |||||||||||
| Subtotal | 3.35 | 3.75 | 3.44 | 9.24 | 2.69 | 10.36 | 1.51 | 0.97 | 2.08 | 1.06 | 2.59 | 0.92 | 1.21 | 1.01 | 1.91 | |||
| Southeast Region | Seocho-gu | 2.49 | 3.78 | 4.64 | 3.14 | 3.48 | 38.20 | 3.50 | 0.65 | 0.58 | 1.63 | |||||||
| Gangnam-gu | 4.61 | 7.88 | 6.68 | 16.36 | 4.86 | 9.57 | 1.25 | 6.17 | 0.99 | 4.58 | 0.73 | 1.53 | 2.12 | |||||
| Songpa-gu | 4.18 | 4.66 | 2.97 | 14.21 | 5.24 | 7.26 | 0.41 | 0.15 | 0.31 | 1.37 | 1.25 | 1.15 | 1.84 | |||||
| Gangdong-gu | 2.87 | 3.49 | 4.48 | 2.94 | 2.13 | 1.07 | 1.50 | 2.63 | 2.08 | |||||||||
Acknowledgements
The authors thank the Policy Analysis Team of the Urban Policy Headquarters at the Seoul Health Foundation for their assistance in facilitating official communication with the NHIS for the acquisition of research data.
Author Contributions
IHO conceived and designed the study and revised the manuscript. JNK collected and analyzed the data, interpreted the results, and wrote the manuscript. All authors read and approved the final manuscript.
Declaration of Conflicting Interests
The author(s) declared no potential conflicts of interest with respect to the research, authorship, and/or publication of this article.
Funding
The author(s) disclosed receipt of the following financial support for the research, authorship, and/or publication of this article: This research was supported by a grant of the Korea Health Technology R&D Project through the Korea Health Industry Development Institute (KHIDI), funded by the Ministry of Health & Welfare, Republic of Korea (grant number : HI21C2122).
Ethics Approval and Consent to Participate
Our study did not require ethical board approval or consent to participate because it relied entirely on de-identified administrative data publicly available for research purposes. No human data were directly used. Permission to use medical usage of patient data (https://www.nhis.or.kr/nhis/together/wbhaec06900m01.do?mode=view&articleNo=10802577&article.offset=0&articleLimit=10) was granted through an application to the NHIS website (https://www.nhis.or.kr/nhis/index.do). Additionally, permission to use medical institutions data (https://opendata.hira.or.kr/op/opc/selectOpenData.do?sno=11925&publDataTpCd=&searchCnd=ttl&searchWrd=%EC%A0%84%EA%B5%AD&pageIndex=1) has been secured via the HIRA Bigdata Open Portal (![]() ), following a similar application process. According to Articles 13 and 14 of the Enforcement Rules of the Bioethics and Safety Act, as stipulated by the Korea National Institute for Bioethics Policy, institutional review board approval and consent to participate were not required.
), following a similar application process. According to Articles 13 and 14 of the Enforcement Rules of the Bioethics and Safety Act, as stipulated by the Korea National Institute for Bioethics Policy, institutional review board approval and consent to participate were not required.