
Abstract
Multiple Sclerosis (MS), a neurodegenerative disease of unknown etiology, which affects approximately 450 of every 100 000 women in the USA. Using an ecological observational study design and publicly available data from the Center for Disease Control and Prevention in the USA, we assessed trends in county-level, age-adjusted female MS mortality rates between 1999 and 2006 to determine if they were correlated with environmental factors, including the county’s PM2.5. In counties with colder winters, there was a significant positive association between the average PM2.5 index and the MS mortality rate, after controlling for the county’s UV index and median household income. This relationship was not apparent in counties with warmer winters. We also found that colder counties had higher MS mortality rates, even after controlling for the UV and PM2.5 indices. The findings from this study provide county-level evidence for a temperature-dependent association between PM2.5 pollution and MS mortality rates, which should be further investigated.
Multiple sclerosis is a neurodegenerative disease, and although the risk factors for this condition are not well known, the geographic clustering of this condition in the northern hemisphere suggests environmental factors may play a role in its manifestation.
This study examined, at an ecological group level, whether the relationship between the average air pollution index and multiple sclerosis mortality in a US county varied depending on air temperature, controlling for the area’s average UV index.
The implication of this study is that it provides a new hypothesis to explain, in part, the higher occurrence of multiple sclerosis in colder climates.
Introduction
Multiple sclerosis (MS) is a chronic neurodegenerative disease. The number of MS cases in the United States of America (USA) in 2010 was reported to be over 700 000. 1 Patients with this disease present with demyelination of the nerves in the central nervous system. The etiology and risk factors for this disease are unknown, but likely this condition is multifactorial. Researchers suggest inflammation mediated by different types of T cells is responsible for the damage to the nerve myelin sheaths. 2 However, the triggers for the immune-mediated response are not well known.
Several risk factors have been suggested for MS. For example, exposure to the Epstein-Barr virus seems to increase the probability of disease. 3 Smoking has also been reported to increase the risk of MS, 4 as well as being female.1,5 Several researchers have hypothesized that individuals living at high latitudes have a higher risk of MS, 6 and that this is likely because they are exposed to lower ultra violet light, which could lead to low vitamin D levels. Vitamin D appears to have a protective effect, which may be mediated through the role of vitamin D on the immune system. 7 Exposure to air pollution has been hypothesized as a possible risk factor for MS,8,9 as different types of fine particulate matter (PM2.5) can cross the blood brain barrier, leading to oxidative stress and inflammation 8 ; however, findings on this topic suggest mixed conclusions. 9 The biological mechanism underpinning the association between different factors and MS is difficult to confirm because the pathogenesis of the disease is still not fully understood, and there are likely different interactions between the environmental, behavioral and intrinsic factors driving this disease. The purpose of this retrospective ecological study was to assess the potential association between mortality due to MS and the PM2.5 air pollution index across counties in the USA, and explore whether this relationship was dependent on temperature.
Methods
We conducted an ecological study to evaluate whether, on an aggregated county level, temperature impacted the association between pollution and population MS rates. We used average annual age-adjusted MS mortality rates between 1999 and 2006 to estimate the incidence of MS, as these data are available at the county level through the CDC. 10 Only data on the female population within the counties were used, as MS is approximately 2.8 times more prevalent in this sub-population, 1 and endocrine disrupting pollutants, which can be an important component of the PM2.5 index, may impact females differently than males. Within this data set, counties with fewer than 10 cases were suppressed by the CDC and therefore excluded from our analysis. However, if these counties had a female population greater than or equal to 1 million, we imputed the “worst case scenario” MS rate by assigning 9 cases to these areas and estimating the MS rate based on this case count. This enabled us to reduce the amount of missing data for counties with low levels of MS mortality.
The average annual PM 2.5 levels in µg/m3 between 2003 and 2011 for counties across the US was extracted from the CDC Wonder website. 11 Additional information on environmental and socio-economic factors that might have influenced MS and or PM 2.5 were collected from CDC Wonder or the U.S. Department of Agriculture (USDA) to control for potential confounding in the regression analysis. These factors included county-level minimum air temperature in January and February, 12 the average daily UV index (KJ/ m2), 13 and median household income from 2017 to 2019. 14 The latter was used as a surrogate measure of the average socio-economic status of people within a county. The data for the environmental variables were collected from 1999 to 2011.
Statistical Analysis
A simple regression analysis was conducted between each variables and the age-adjusted MS mortality rates. We also assess the correlation between county-level UV index and minimum temperature. For our multiple regression analysis we standardized the variables by subtracting their means, then dividing by their standard deviations. This was done because the data were measured on different scales. We categorized temperature data to examine the interaction between this factor and PM2.5 levels. Counties with average minimum temperature ≤0°C in January and February were categorized as 0; warmer counties with an average minimum temperature between >0°C and ≤10°C were labeled as category 1, and counties above 10°C were categorized as 2. All four variables (UV, median household income, PM2.5, and temperature categorization), and the interaction term between the temperature category for the county and its PM2.5 levels, were included in the initial linear regression model. Predictor variables of MS mortality were removed from the regression analysis using a backwards elimination strategy if their association with MS mortality rates had a P value >0.05. The residuals of the final model were visually assessed to determine if they met the assumptions of a multiple linear regression model. Because the residuals from our first model were not normally distributed, and the variance was skewed, we transformed the MS mortality rate using a square root function and re-ran the analysis. All results are based on the multiple linear regression conducted on the transformed outcome.
To visualize the relationship between MS mortality rate of females per 100 000 and PM 2.5 in counties with different temperatures we created an interaction plot using the range PM2.5 values in our dataset. We set all other parameters at their mean values (Supplemental Table 1S). All regression analyses were conducted in STATA V. 17 (StataCorp, College Station, Texas, USA).
Results
The dataset for our analysis consisted of 834 counties with complete average annual female MS mortality rates and environmental data. The overall average age-adjusted MS mortality rate for our study period was 1.66 per 100 000 females. Note the CDC age adjustment of the data was based on the 2000 standard US population. All environmental factors had a negative association with MS mortality (Supplemental Figure S1-S4). The average daily UV index in counties was highly correlated with the minimum air temperature (R2 = 69.8%; Supplemental Figure S5).
The regression model suggested all variables initially included in the model were significantly associated with the square root of the age-adjusted MS mortality rate, including the interaction term between PM 2.5 and temperature (Table 1). Visual inspection of the transformed model’s residuals suggested that the assumptions for multiple regression were met (Supplemental Figure S6). The overall multivariable regression model explained approximately 42% of the variance in the square root of the county MS female mortality rates. The interaction between PM 2.5 and temperature, suggested a positive correlation between MS mortality and PM 2.5 when the temperature in counties was categorized as low (category 0) (Figure 1). Further, based on our final model, counties with cold air temperatures in the months of January and February (Category 0) appeared to have higher female MS mortality rates than warmer counties with the same level of PM 2.5, even after controlling for the UV index.
The Final Multivariable Regression Model Depicting the Association Between the Square Root Transformed Adjusted County-Level Female MS Mortality Rate (Outcome) and Environmental Factors.

Note. All predictors were standardized. Final model had an R 2 = 41.9% (n = 834).
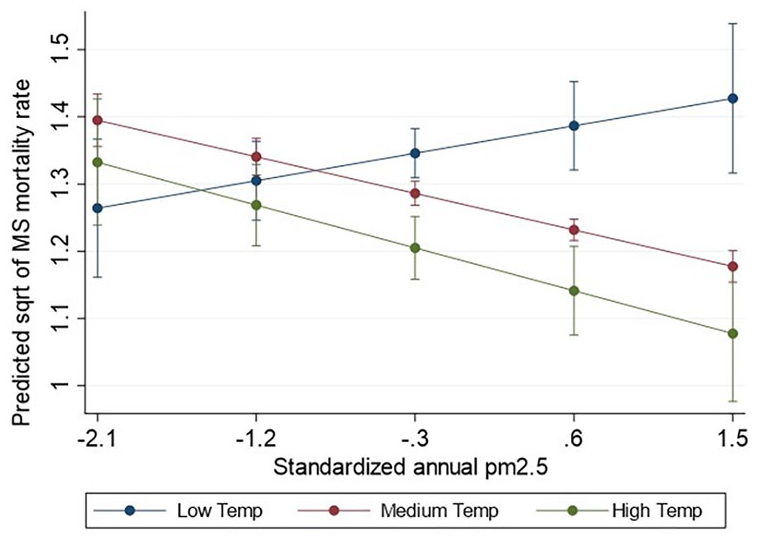
Interaction plot illustrating the association between the predicted square root of MS mortality rate (per 100k females) and standardized PM2.5 levels for counties with different categories of temperature. The whiskers indicate 95% confidence intervals for the predicted MS rates. All other variables in the multivariable regression analysis were set at their mean values.
Discussion
Our study suggests counties with colder winters may have higher rates of female MS mortality than counties with warmer winters, even after controlling for the counties’ UV indices. Further, our analysis suggests there was a slight positive association between PM2.5 and female MS death rates in counties with low winter temperatures, and interestingly, the inverse relationship was present in counties categorized as having warmer winters. The interaction between temperature and PM2.5 may partially explain the mixed results reported between pollution and the occurrence of MS by different researchers. 9 The findings of this study corroborate other studies that suggest air pollution may be a risk factor for MS or for the relapse of MS, specifically in colder geographic areas. 15
Temperature can impact the deposition rates of compounds. In colder climates, fractionation of chemicals, particularly volatile organic compounds, which are known endocrine disruptors and make up a proportion of the PM2.5 pollution index, is greater than in warmer climates. 16 Endocrine disruptors can augment the production of autoantibodies, especially in females, 17 and have been hypothesized to play a role in the progression of MS, based on animal models. 18 In this study, we were not able to refine the PM2.5 index to only include endocrine disruptors so we were not able to evaluate the effect of these specific chemicals on MS rates. Future research using data on specific types of pollutants may clarify the relationship between temperature, PM2.5 and MS rates.
Our study also found the level of MS mortality per 100K females was higher in colder counties regardless of the PM2.5 levels in the county (Figure 1). The general trend of elevated MS rates at higher latitudes or in colder areas is well documented, and generally attributed to low Vitamin D exposure. 18 However, in our study we controlled for the UV index by including this variable in our model so the effect of temperature on county-level MS mortality rate was superfluous to the UV index and, therefore, noteworthy. Our data suggests that both UV and temperature may be risk factors for MS. Interestingly, the correlation between MS mortality rate and the UV index in counties although significant was slightly less than the correlation between MS mortality rate and the minimum temperature in counties (Supplemental Figure 1S and 2S). By including both variables in the final model, we tried to account for the effect of these variables separately.
There are several biological mechanisms which may explain the association between extreme cold temperatures and MS. First, exposure to cold can cause the expression of cold shock proteins, which mediate gene expression of pro-inflammatory factors, some of which are thought to play a role in autoimmune diseases. 19 Further, although several researchers have found that clinical symptoms such as fatigue and weakness associated with MS are improved when exposed to short term cooling, 20 exposure to extreme cold temperatures, especially intermitted cold situations may cause peripheral nerve damage. 21 The cell death associated with this process may increase the risk or exacerbate immune mediated responses. Research is required to clarify the impact of cold exposure on the development and or progression of MS.
The findings in this ecological study give rise to several hypotheses regarding temperature and MS at the aggregated county level, but it is important to note that due to the type of study design used the conclusions that can be made in this study are limited. For example, we cannot assign county-level risk factors to individuals without knowing if the exposure truly represented their experience in time and space; therefore, we cannot interpolate findings at the individual level. Further, the time lag between exposure to environmental risk factors and mortality of patients with MS could not be captured in this type of study, and could bias results. Despite the limitations of ecological studies, they provide an easy and inexpensive method to examine population-level data for trends. These types of studies can be especially helpful for identifying hypotheses about multifactorial environmental diseases.
Conclusion
The findings from this ecological study suggest that counties with low temperatures had higher MS mortality rates, even after we considered the average household income in the county and the UV index. The hypothesis that temperature may be directly or indirectly associated with MS is consistent with biologically plausible pathways, and therefore should be further evaluated using a study design that can better elucidate causal relationships between this risk factor and the disease.
Supplemental Material
sj-tif-1-inq-10.1177_00469580231171018 – Supplemental material for Airborne Pollution: A Potential Risk Factor for Multiple Sclerosis in Colder Climates
Supplemental material, sj-tif-1-inq-10.1177_00469580231171018 for Airborne Pollution: A Potential Risk Factor for Multiple Sclerosis in Colder Climates by Nicola Chalmers and Sophie St-Hilaire in INQUIRY: The Journal of Health Care Organization, Provision, and Financing
Supplemental Material
sj-tif-2-inq-10.1177_00469580231171018 – Supplemental material for Airborne Pollution: A Potential Risk Factor for Multiple Sclerosis in Colder Climates
Supplemental material, sj-tif-2-inq-10.1177_00469580231171018 for Airborne Pollution: A Potential Risk Factor for Multiple Sclerosis in Colder Climates by Nicola Chalmers and Sophie St-Hilaire in INQUIRY: The Journal of Health Care Organization, Provision, and Financing
Supplemental Material
sj-tif-3-inq-10.1177_00469580231171018 – Supplemental material for Airborne Pollution: A Potential Risk Factor for Multiple Sclerosis in Colder Climates
Supplemental material, sj-tif-3-inq-10.1177_00469580231171018 for Airborne Pollution: A Potential Risk Factor for Multiple Sclerosis in Colder Climates by Nicola Chalmers and Sophie St-Hilaire in INQUIRY: The Journal of Health Care Organization, Provision, and Financing
Supplemental Material
sj-tif-4-inq-10.1177_00469580231171018 – Supplemental material for Airborne Pollution: A Potential Risk Factor for Multiple Sclerosis in Colder Climates
Supplemental material, sj-tif-4-inq-10.1177_00469580231171018 for Airborne Pollution: A Potential Risk Factor for Multiple Sclerosis in Colder Climates by Nicola Chalmers and Sophie St-Hilaire in INQUIRY: The Journal of Health Care Organization, Provision, and Financing
Supplemental Material
sj-tif-5-inq-10.1177_00469580231171018 – Supplemental material for Airborne Pollution: A Potential Risk Factor for Multiple Sclerosis in Colder Climates
Supplemental material, sj-tif-5-inq-10.1177_00469580231171018 for Airborne Pollution: A Potential Risk Factor for Multiple Sclerosis in Colder Climates by Nicola Chalmers and Sophie St-Hilaire in INQUIRY: The Journal of Health Care Organization, Provision, and Financing
Supplemental Material
sj-tif-6-inq-10.1177_00469580231171018 – Supplemental material for Airborne Pollution: A Potential Risk Factor for Multiple Sclerosis in Colder Climates
Supplemental material, sj-tif-6-inq-10.1177_00469580231171018 for Airborne Pollution: A Potential Risk Factor for Multiple Sclerosis in Colder Climates by Nicola Chalmers and Sophie St-Hilaire in INQUIRY: The Journal of Health Care Organization, Provision, and Financing
Footnotes
Acknowledgements
We would like to thank Mrs. Laura Brown at the American International School Hong Kong and Dr. Omid Nekouei for their support on this project.
Authors’ Contributions
Nicola Chalmers conducted the study as part of her senior project. She wrote the first draft of the manuscript. Sophie St-Hilaire assisted with the analyses and proof read the manuscript.
Declaration of Conflicting Interests
The author(s) declared no potential conflicts of interest with respect to the research, authorship, and/or publication of this article.
Funding
The author(s) received no financial support for the research, authorship, and/or publication of this article.
Ethics Approval and Consent to Participate
Study was approved by the American International School as a senior student research project. The human ethics committee at the City University of Hong Kong also endorsed the project (HU-STA-00000278).
Availability of Data and Materials
All data were publicly available.
Supplemental Material
Supplemental material for this article is available online.
References
Supplementary Material
Please find the following supplemental material available below.
For Open Access articles published under a Creative Commons License, all supplemental material carries the same license as the article it is associated with.
For non-Open Access articles published, all supplemental material carries a non-exclusive license, and permission requests for re-use of supplemental material or any part of supplemental material shall be sent directly to the copyright owner as specified in the copyright notice associated with the article.