
Abstract
The California Medical Supervision Program is designed to protect agricultural workers from overexposure to Toxicity Category I and II organophosphate (OP) and carbamate (CB) pesticides by routinely monitoring their blood cholinesterase (ChE) activity levels. ChE testing is conducted at State-approved laboratories and electronically reported to the Department of Pesticide Regulation (DPR) and the Office of Environmental Health Hazard Assessment (OEHHA) for review. In 2015, OEHHA and DPR evaluated the effectiveness of the Program by analyzing ChE data from pesticide handlers performed between 2011 and 2013, which revealed issues with the data quality that hindered the evaluation process. Several interventions have been implemented since then to improve data quality and the overall function of the Program. A new evaluation was conducted in 2020 to 2021 using data from 2014 to 2019 to determine the effectiveness of the Program, Program compliance, and efficacy of the interventions. The analysis revealed similar data quality issues identified in the last evaluation, however, an improvement in data quality was observed. The number of individuals with ChE depression below the action level threshold have decreased in recent years, corresponding to the implementation of certain interventions, indicating that the effectiveness of the Program has improved. Spatial and temporal analysis showed the proportion of pre-exposure baseline tests inversely correlated with pesticide use data while routine follow-up ChE test results showed a positive correlation, indicating a high degree of Program compliance across the state. Major improvements in the data cleaning and analysis since the last evaluation have also improved the evaluation: pesticide handlers under the Program were able to be identified with more certainty and ChE depressions were able to be calculated with increased accuracy. However, further improvements to the data collection process could enhance future evaluations of the Program.
Keywords
A prior analysis of the laboratory reporting using cholinesterase data from 2011 to 2014 determined the degree of compliance with Program requirements and evaluated the overall effectiveness of the California Medical Supervision Program.
The current study used ChE test results received between 2014 and 2019 in order to assess the efficacy of Program interventions implemented since the last Program evaluation, as well as changes made to the data processing and analysis methodology.
From this analysis, new recommendations to the California legislature to improve the Program were made, some of which are already in the process of being implemented.
Background
Organophosphates (OP) and carbamates (CB) are widely used pesticides for a variety of purposes including agriculture. Exposure to OP and CB pesticides has been linked to several adverse health outcomes.1-3 OP and CB pesticides are known to inhibit cholinesterase (ChE), a crucial enzyme in the brain that is responsible for breaking down the neurotransmitter acetylcholine. ChE inhibition may lead to over accumulation of acetylcholine between synapses may lead to cholinergic overstimulation. 4
The California Medical Supervision Program (hereafter, “Program”) was established in 1974 to protect agricultural workers who regularly handle the most toxic (Toxicity Category I and II) of these pesticides (hereafter, “Type I and II OPs and CBs”) from excessive exposure. Employers of pesticide handlers who regularly handle (i.e., more than 6 days in a 30-day period) these pesticides for agricultural purposes are required by law to refer these handlers to physicians (hereafter, “medical supervisors”) to monitor their ChE activity levels in the blood, which are used as proxy measurements of ChE activity in the brain. Two types of ChE are found in human blood: (1) red blood cell (RBC) and (2) plasma. Both types of ChE are monitored under the Program because specific OPs and CBs preferentially target ChE in RBC or plasma. A series of protective actions are required to be taken if ChE activity levels depress below threshold levels specified by the Program. Figure 1 briefly describes how the Program operates.

The Program requires all employers of workers handling Type I and II OP and CB pesticides for agricultural purposes to contract with a licensed physician to act as a medical supervisor. The medical supervisor orders baseline and follow-up tests and notifies handlers, as well as employers of the results. The medical supervisor must recommend to employer specific actions to be taken if ChE activity is depressed beyond certain thresholds levels.
In 2011, a California law (Health and Safety Code (HSC) § 105206) was amended to stipulate several changes to the Program, including requiring laboratories that analyze blood ChE activity levels of pesticide handlers under the Program to report laboratory ChE test results to the California Department of Pesticide Regulation (DPR), which in turn shares the information on an ongoing basis with the Office of Environmental Health Hazard Assessment (OEHHA).
In 2015, OEHHA and DPR evaluated the effectiveness of the Program and utility of the electronic laboratory-based reporting of ChE data using ChE test results received between 2011 and 2013. 5 The analysis of the ChE test results of this report was published later in a peer-reviewed article, 6 which concluded that the Program appeared effective at protecting workers from overexposure. However, the evaluation of the Program may have been hampered because the analysis revealed several issues with the quality of data received, including typographical errors, missing or incorrect information, and extraneous data from individuals unrelated to the Program, which could have skewed the results. Since then, several changes have been made in an attempt to improve data quality and the overall functioning of the Program, including amending data cleaning and analysis methodology Additionally, several recommendations were made in the 2015 Legislative Report 5 and have since been implemented to improve the Program. The recommendations included developing a list of active medical supervisors and promoting and expanding medical supervision training. In order to implement these recommendations, a registration process to register medical supervisors was initiated by OEHHA in 2017 (Section f of HSC § 105206). This allowed the Program to effectively target medical supervisors and provide them with training and resources, such as the Guidelines for Physicians. 7 OEHHA was able to determine which tests were ordered by medical supervisors, which helped identify individual handlers under the Program. Both OEHHA and DPR have also performed a number of outreach efforts to employers and physicians since the publication of the 2015 Report. 6
The current study used ChE test results received between 2014 and 2019 in order to (1) determine the degree of compliance with Program requirements and evaluate the overall effectiveness of the Program and (2) assess the efficacy of Program interventions implemented since the last Program evaluation, as well as changes made to the data processing and analysis methodology.
Methods
Data Collection
ChE test results
The 7 approved laboratories that analyze ChE activity levels in blood specimens for the Program submit test results and other information in its possession to DPR on a monthly basis. Other information collected by laboratories is specified in HSC § 105206 and includes the following: name, date of birth, and contact information of the individual tested; purpose of the test; name, address, and telephone number of the physician who ordered the test; name, address, and telephone number of the analyzing laboratory; accession number of the specimen; date of sample collection; date the result was reported; and employer’s contact information. DPR then shares this information with the OEHHA using a secure access website. Since this analysis was required by California law, it was exempted from IRB approval.
Pesticide use data
In California, all agricultural pesticide use, including quantity and purpose of pesticides applied, must be reported monthly to the County Agricultural Commissioners who, in turn, report it to DPR. DPR imports and summarizes this data into a publicly available database, the Pesticide Use Report (PUR) from which we extracted. All agricultural Type I and II OP and CB data analyzed in the current study was obtained from PUR between 2014 and 2019. Specifically, since the toxicity category of an OP or CB product (i.e., Type I and II) is determined by the amount of active ingredients (AI) in the product, the poundage of Type I and II OP and CB active ingredients was analyzed in this study.
Data Processing
A large proportion of tests received from reporting laboratories included extraneous tests (not related to the Program), thus exclusion criteria were developed and applied in an attempt to exclusively analyze tests under the Program (Figure 1). Data processing steps remained similar to those applied in Laribi et al. 6 Briefly, using R software, typographical and input errors in various data fields were first corrected (e.g., changing “serum cholinesterase” to “plasma cholinesterase” under test type). Then, tests with missing test accession numbers, duplicate tests, and test results that were neither RBC or plasma ChE (e.g., “whole blood”) as well as those that did not belong to a single test order (i.e., a pair of RBC and plasma ChE tests) were excluded from the dataset. Furthermore, employer or purpose of test information that indicated irrelevance to the Program were excluded (Figure 2).

Exclusion of ChE tests missing pertinent information (e.g., test accession numbers) or containing information indicating those tests were not ordered under the Program (e.g., firefighter).
In order to identify individuals within the dataset, unique identifiers were generated and assigned to individual handlers and physicians by assessing the similarity between names using the “stringdist” package (van der Loo) 8 in R software. This package contains a function that was able to compute pairwise differences between 2 strings (first and last names). A single unique numerical identifier was generated for different names (physicians or patients) if the similarity between names was under a threshold of similarity (<0.12 Jaro-Winkler string distance). Individuals were grouped by date of birth in order to avoid assigning the same unique identifier to separate individuals with similar or the same name. The names of individuals were not changed which allowed for manual verification of unique identifiers assignment.
Physicians’ names cross referenced with OEHHA’s list of registered medical supervisors and assigned a separate unique identifier. This allowed us to compare data received from medical supervisors and non-medical supervisors.
After identifying individual patients, the age of each patient at the time of the test was calculated. Individuals younger than 16 or older than 75 years were excluded since those individuals are unlikely to be working as pesticide handlers in California (Figure 2).
Data Analysis for Determining Efficacy of Interventions
R software was used to conduct data analysis. Results were then exported to Microsoft Excel to create the figures.
Dataset split
After the data cleaning and exclusion steps, individuals were first divided into 2 categories: those with periodic testing (at least 3 tests per year) and those without periodic testing. As shown in Figure 3, the majority of individuals did not undergo periodic testing (90.2%, n = 20 593). Those who received periodic testing were more likely to be related to the Program and have multiple tests which could be used to deduce which tests were baselines, thus baseline estimates were only determined for those individuals.

Flow chart of the data set split in groups whether individuals had periodic testing and whether individuals had 2 tests taken 3 to 14 days apart during low-spraying season. A total of 19 435 individuals’ ChE tests were analyzed.
Baseline Estimation
Real baseline values could not be identified due to poor data quality, namely for the test purpose field, which specifies whether the test ordered was meant for baseline determination, periodic monitoring (i.e., follow-up), or recovery. The purpose of some tests received indicated baseline or follow-up however, the majority of tests had missing, irrelevant, or mislabeled purposes. Therefore, we had to estimate baseline values for individuals. Baseline estimates could only be done for individuals with periodic testing (3 or more tests) because multiple test results were needed in order to identify potential baseline tests by analyzing temporal trends. Baseline estimates were calculated for each individual using the actual ChE test results:
The first approach used to estimate baseline was based on OEHHA’s official recommendation to medical supervisors as stated in the Guidelines for Physicians handbook 7 : “The baseline is calculated by averaging two tests collected at least 72 hours and less than 14 days apart when a worker has not handled OPs/CBs for at least 30 days.” Since baseline tests under the Program must be taken within a 30-day exposure-free period, baseline determination was limited to tests ordered during low-pesticide-use months or a “low-spraying season.” When available, the average of such tests was used to estimate baselines, that is, 14-day baseline estimates.
For individuals without 14-day baseline estimates, we used the maximum ChE values as surrogate measurements for baseline estimates as the baseline is expected to be equal or close to the max value.
14-Day baseline estimates (n = 1399)
In the previous study, state-level PUR data was used to identify a low-spraying season for California. However, spraying patterns on a smaller scale (e.g., region) may differ from that of the state, thus the previous approach could have masked local low-spraying seasons that may more accurately reflect individual handlers’ work practices. To address this issue, regional spraying patterns were analyzed. Analysis on the regional level was decided based on consultation with DPR, which revealed handlers usually work in multiple counties within the same region, rarely moving between regions or across the state. The regions were defined by using California Agricultural Commissioners and Sealers Association (CACASA) Area Groups because these 5 area groups are comprised of counties grouped by similarities in agricultural practices and issue areas: Northern Counties, San Joaquin, Sacramento Valley, Coast, and Southern California.
Low-spraying seasons, which consisted of 3 or more consecutive low-spraying months, were defined for each area group. A low-spraying month was defined as a month for which pesticide use is below half a standard deviation from the mean poundage applied for the area group.
Employee’s zip codes were rarely available and could not be used for identifying their work location. Employers’ zip codes were also not reliable for identifying the work location of handlers because this data field was often missing or indicated the location of corporate headquarters. Instead, physician’s zip codes were used to identify which region handlers worked in because this data element represented the optimal proxy measurement of handlers’ work location.
The majority of tests (73.0%) with geographical information (i.e., zip codes) were from Coast and San Joaquin area groups (data not shown); therefore, the analysis was restricted to these 2 area groups where pesticide use was also high.
Maximum value baseline estimates (n = 898)
Approximately half of the individuals with more than 3 tests per year did not have 14-day baseline estimates, thus several approaches were evaluated in order to identify the optimal surrogate measurement for the baseline of individuals without 14-day baseline estimates.
Similar to Laribi et al, 6 individual maximum ChE values were used to determine baseline estimates for this pool of individuals because, in theory, an individual’s baseline is the maximum ChE activity level. However, follow-up tests can sometimes exceed the baseline ChE activity level for various biological or clinical reasons (i.e., abnormal ChE activity fluctuation, laboratory error, etc.). Thus, outliers were removed in the current study prior to identifying individual maximum ChE values in order to prevent overestimation of ChE depressions. To avoid erroneously removing ChE tests, a high threshold was used to determine outliers. Only tests that exceeded the 99th percentile of all tests within that pool were ultimately removed.
The following steps were completed to determine the optimal surrogate measurement for baseline estimates:
The intra-individual ChE variation for both test types was determined by calculating each individual’s maximum total variation between baseline tests:

The mean RBC and plasma intra-individual variation was between 5.87% and 8.1%, respectively. The higher level of variation (8%) was used to determine the lower limit for baseline tests.
Tests that fell within 8% of an individual’s maximum ChE value were considered possible baseline tests. The maximum, mean, and minimum ChE value for tests within this range were all considered as possible surrogate measurements for baseline estimates.
In order to select the optimal surrogate measurement, the same steps described above were applied to individuals with 14-day baseline estimates and compared to their respective 14-day baseline estimates. Overall, the maximum ChE value (“max value”) was closest to the 14-day baseline estimate and was therefore used as a proxy baseline estimate for the pool of individuals without tests 3 to 14 days apart.
ChE Depressions
In the Program, any ChE depression equal to or greater than 20% of the individual’s baseline estimate is considered significant and requires preventative action(s) from the employer. Significant ChE depressions were calculated as described in Laribi et al. 6 Tests with ChE depressions over the 20% threshold (i.e., workplace evaluation) as well as RBC ChE depressions greater than or equal to 30% and plasma ChE depressions greater than or equal to 40% (i.e., workplace removal) were determined.
Correlation Analysis
Spatial and temporal trends of baseline, follow-up and depression ChE tests were analyzed and compared to pesticide use data across the state (2014-2019 PUR data). The number of individuals who had significant ChE depressions and the number of depressions within this time period were also evaluated.
Spatial correlation analysis
The distribution of poundage of Type I and II OPs and CBs and the total number of ChE tests ordered, as well as number of significant ChE depressions were visualized in each county using ArcMap 10.6.1. A Pearson’s correlation test was completed to assess the association between pesticide use and the total number of ChE tests, as well as number of significant ChE depressions.
Temporal correlation analysis
Indicators of Program improvements were defined and assessed. For example, the proportion of ChE tests and individuals under medical supervisors were used as indicators of efficacy of Program interventions and were compared before and after new Program initiatives (i.e., registration process) were implemented. Additionally, the trend in the proportion of tests with a purpose—a data element required under the law—indicated was also analyzed to measure any changes to data quality over time. These temporal correlation analyses were conducted on the area group-level using R and Microsoft Excel.
Temporal correlation analysis was also conducted to examine whether ChE tests were ordered in concordance with pesticide spraying seasons. The correlation between monthly number of tests (baseline, follow-up, and depression) ordered between 2014 and 2019 and monthly pesticide use within this time period was determined for each area group. In general, pre-exposure baseline tests are expected to occur before the spraying season or during low spraying season while follow-up and depression tests are expected to occur in-season or during high spraying season. Agricultural use of Type I and II OP and CB data from 2014 to 2019 was extracted from the PUR database. Then, the average poundage of AI used per month along with the corresponding total number of tests that were identified as baseline, follow-up, or significant depression were determined for each area group.
A Pearson’s correlation test was completed to assess the correlation between monthly pesticide use and number of ChE tests. This analysis was not completed for 14-day baseline tests because the criteria for baseline identification only included tests that occurred during low-spraying months, which, by definition, would have skewed the analysis toward a correlation.
Results
Program Compliance and Effectiveness
Spatial correlation analysis
There was a significant correlation observed between the total number of ChE tests ordered and the amount of pesticide used for each county (Figure 4). This finding suggests that a significant proportion of ChE tests after data processing and applying the exclusion criteria may have indeed been related to the Program. It also suggests that there is a high degree of Program compliance throughout the state. Although some low pesticide-use counties had high density of ChE tests, those counties were usually adjacent to high-use counties which could mean the locations of many individuals’ employers and physicians were in adjacent counties. Moreover, a significant correlation between number of significant ChE depressions and amount of pesticide used per county was observed (data not shown). ChE depressions being concentrated in high-pesticide-use counties increases the likelihood that these tests were ordered for handlers under the Program and indeed depressions. Evaluation of the spatial distribution of single ChE tests from individuals without periodic testing also revealed a significant correlation with the amount of pesticide used (data not shown). This finding suggests that single ChE tests may have indeed been baseline tests under the Program.

Geographic distribution of Type I and II OP and CB pesticide use (Lbs AI) and total number of ChE tests by county across California (2014-2019). There was a significant correlation between total number of ChE tests, as well as significant ChE depressions and poundage of active ingredients used per county (left: Pearson’s r = .39, P < .05).
Temporal correlation analysis
As expected, individual maximum ChE tests were inversely correlated with 2014 to 2019 agricultural Type I and II OPs and CBs use in both area groups, although not statistically significant (Figure 5). The majority of these tests were being ordered when pesticide use was low, that is when handlers were the least likely to be regularly handling these pesticides. During this period, pesticide usage was roughly 3 times higher in San Joaquin than in the Coast area group.
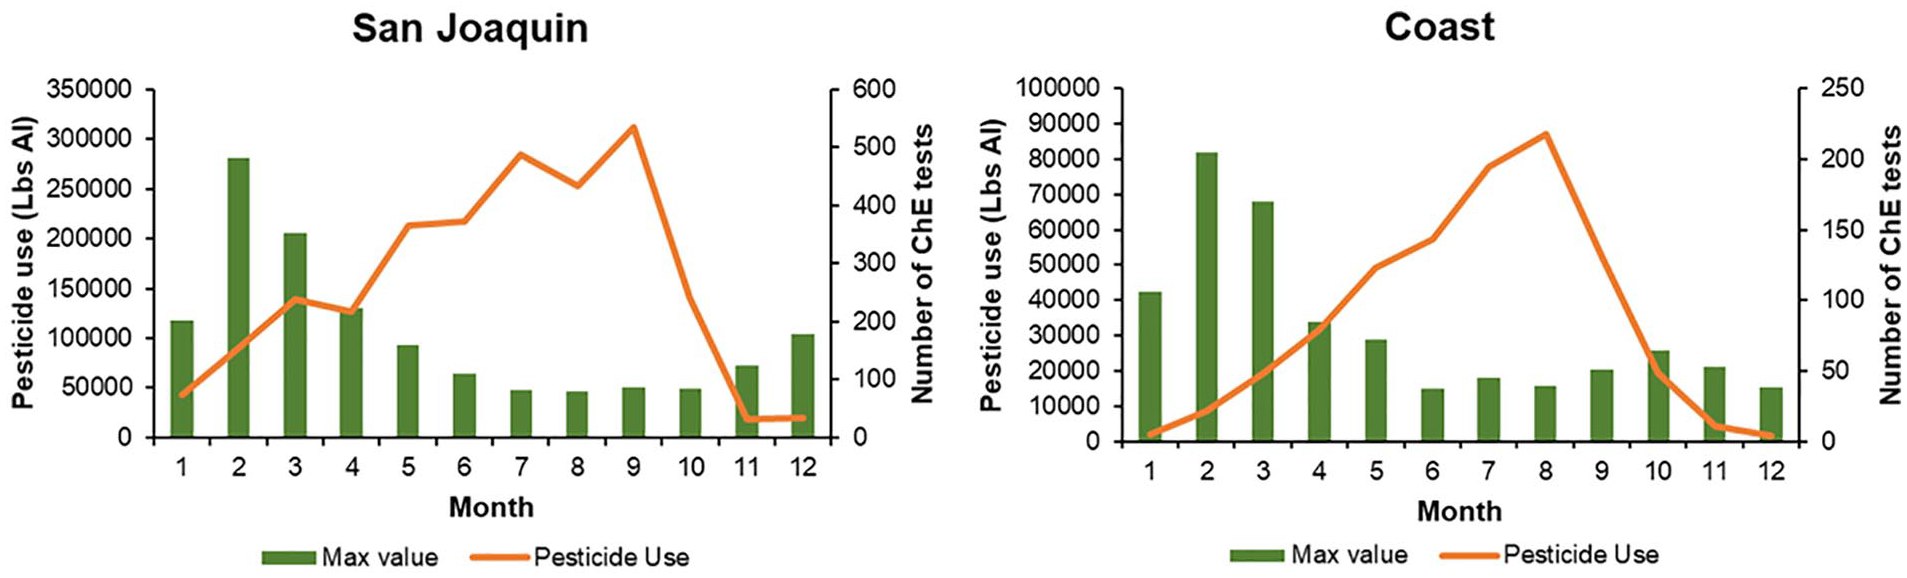
Monthly number of baseline tests from Coast (right) and San Joaquin (left) area groups inversely correlated with Type I and II OP and CB pesticide use (Lbs AI) between 2014 and 2019.
On the area group level, for both sets of individuals (with 14-day and max value baseline estimates), there was a significant correlation between the number of follow-up ChE tests and amount of pesticide used (Figure 6). Although pesticide use is much higher in San Joaquin, Coast had about 5 times more follow-up tests.

Monthly number of follow-up tests from Coast (left) and San Joaquin (right) area groups significantly correlated with Type I and II OP and CB pesticide use (Lbs AI) between 2014 and 2019 (Coast: Pearson’s r = .94, P = < .001; San Joaquin: Pearson’s r = .88, P = < .001).
Temporal correlation analysis of tests from individuals with only a single pair of ChE tests per year was also completed. A significant inverse correlation between the number of single ChE tests and amount of pesticide used was observed (Figure 7), similar to the trend observed between the number of max value tests and amount of pesticide used. This suggests that perhaps a large proportion of those single ChE tests may have been baseline tests.

Temporal correlation between number of single tests ordered and with Type I and II OP and CB pesticide use (Lbs AI) between 2014 and 2019 from Coast (right) and San Joaquin (left) area groups. An inverse correlation was observed in the San Joaquin area group (Pearson’s r = −.37, P > .05), but not for the Coast area group (Pearson’s r = −.02, P > .05).
ChE depressions
On the area group level, a significant correlation was observed between pesticide use and the amount of significant ChE depression tests derived from 14-day and max value baseline estimates (Figure 8). A correlation was also observed for ChE depressions based on 14-day baseline estimates (“14-day ChE depressions”), although not statistically significant. Therefore, significant ChE depressions are occurring when pesticide use is high, which is when handlers are more likely to be exposed. These findings further corroborate observations reported in Laribi et al 6 of tests being ordered in concordance with pesticide spraying seasons, which is consistent with Program requirements. The number of significant depressions detected was relatively low, which could explain why the correlation was not statistically significant for 14-day ChE depressions in both area groups. Furthermore, 14-day ChE depressions in the San Joaquin area group was only weakly correlated with the amount of pesticide used, which could be attributed to the spike in the number of depressions in the month of April, immediately before high-spraying occurred. Upon further investigation, it was determined that this spike was associated with multiple individuals under a single employer over a couple of days within a single spraying season, suggesting that it was an isolated incident.

Monthly number of 14-day depressions from Coast (right) and San Joaquin (left) area groups correlated with Type I and II OP and CB pesticide use (Lbs AI) between 2014 and 2019 (Coast: Pearson’s r = .7302, P > .05; San Joaquin: Pearson’s r = .45, P = .19) although it was not statistically significant for San Joaquin. Monthly number of max value depressions were significantly correlated for both area groups (Pearson’s r = .83, P < .001 Pearson’s r = .79, P < .05).
Overall, a low percentage of individuals experienced ChE depressions between 2014 and 2019. Figure 9 shows the number of ChE depressions (right) and number of individuals (left) with ChE depressions derived from 14-day and maximum ChE baseline estimates have decreased in recent years (2017-2019). From 2014 to 2019, 133 individuals had 211 ChE tests that showed significant depressions. The number of individuals with significant depressions have decreased since 2014, which could be partially attributed to the decrease in agricultural use of Type I and II OPs and CBs. Of the individuals who experienced significant depressions, only 25 of them exceeded workplace removal thresholds. In this 6-year period, only 19 individuals had multiple ChE depressions within a single spraying season, with 9 of the individuals experiencing significant ChE depressions across spraying seasons (data not shown).
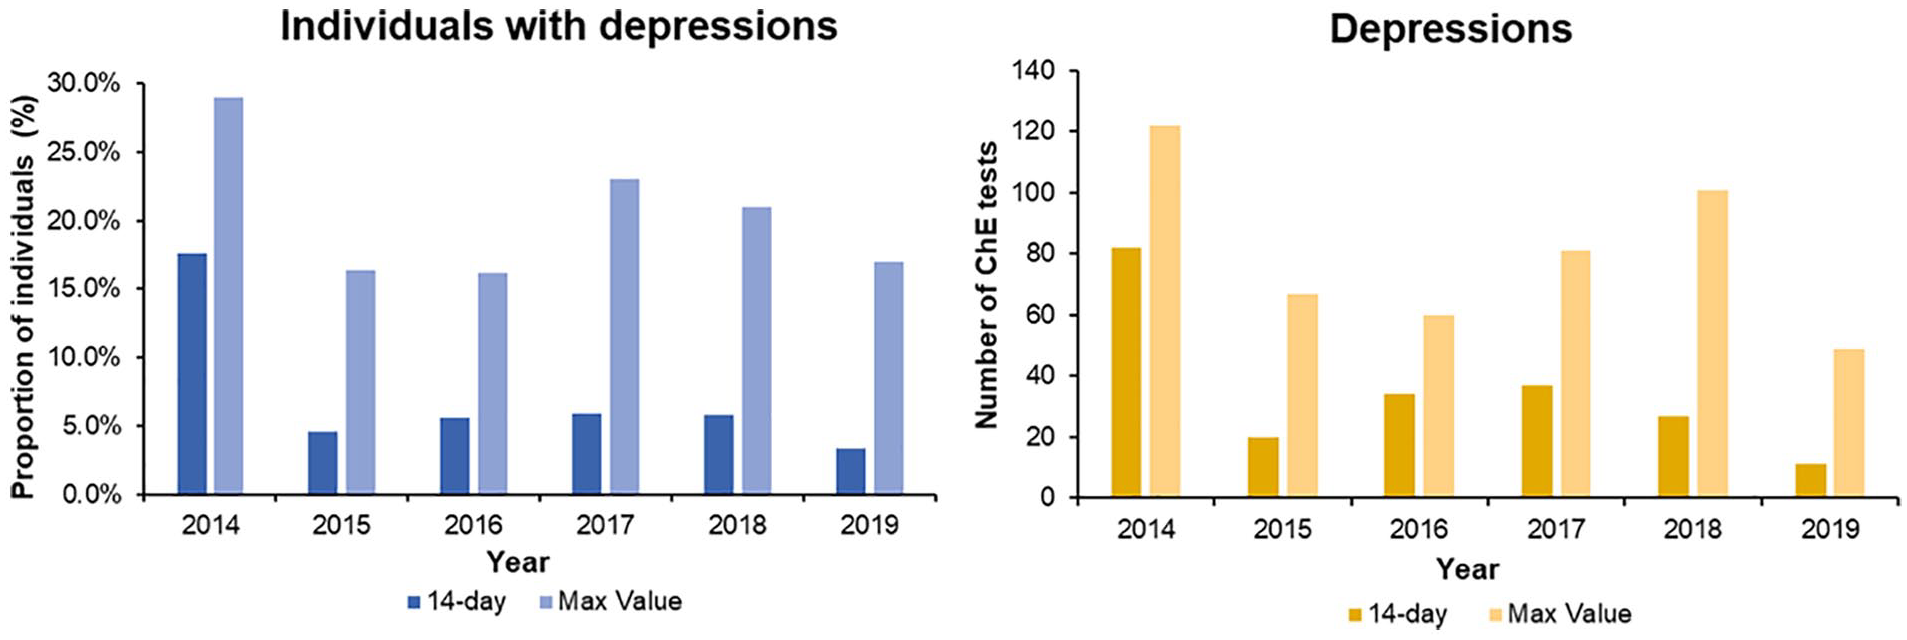
Yearly proportion of individuals (left) and tests (right) with significant ChE depressions (i.e., over 20%) from 2014 through 2019.
A higher proportion of individuals with max value baseline estimates had significant ChE depressions. Two hundred forty-eight individuals with maximum value baseline estimates had 480 ChE tests that were significantly depressed. ChE depression trends differed slightly from what was observed with individuals with 14-day baseline estimates. The proportion of significant ChE depressions for individuals with max value baseline estimates varied and a general decrease in ChE depressions was not observed. In addition, the annual number of ChE depressions was much higher compared to ChE depressions derived from 14-day baseline estimates, which may suggest that the max value approach may have led to an overestimation of ChE depressions.
Although the findings regarding max value depressions were less conclusive than those pertaining to individuals with 14-day depressions, the number of individuals with both max value and 14-day depressions decreased from 2017 to 2019, which aligns with the period in which medical supervisor outreach and registration efforts were conducted.
ChE depressions could not be determined for individuals who did not undergo periodic testing.
Recovery Tests
To determine whether appropriate actions were taken by employers to protect handlers from overexposure, tests indicating ChE recovery from depression were analyzed. Only 12 of the 43 470 tests with purposes related to the Program from 5 individuals indicated recovery. The temporal trend between all of the ChE tests from these 5 individuals and pesticide use was investigated to determine whether these tests were followed by significant depressions. An example of an individual’s ChE tests over time, including a recovery test, is shown in Figure 10.
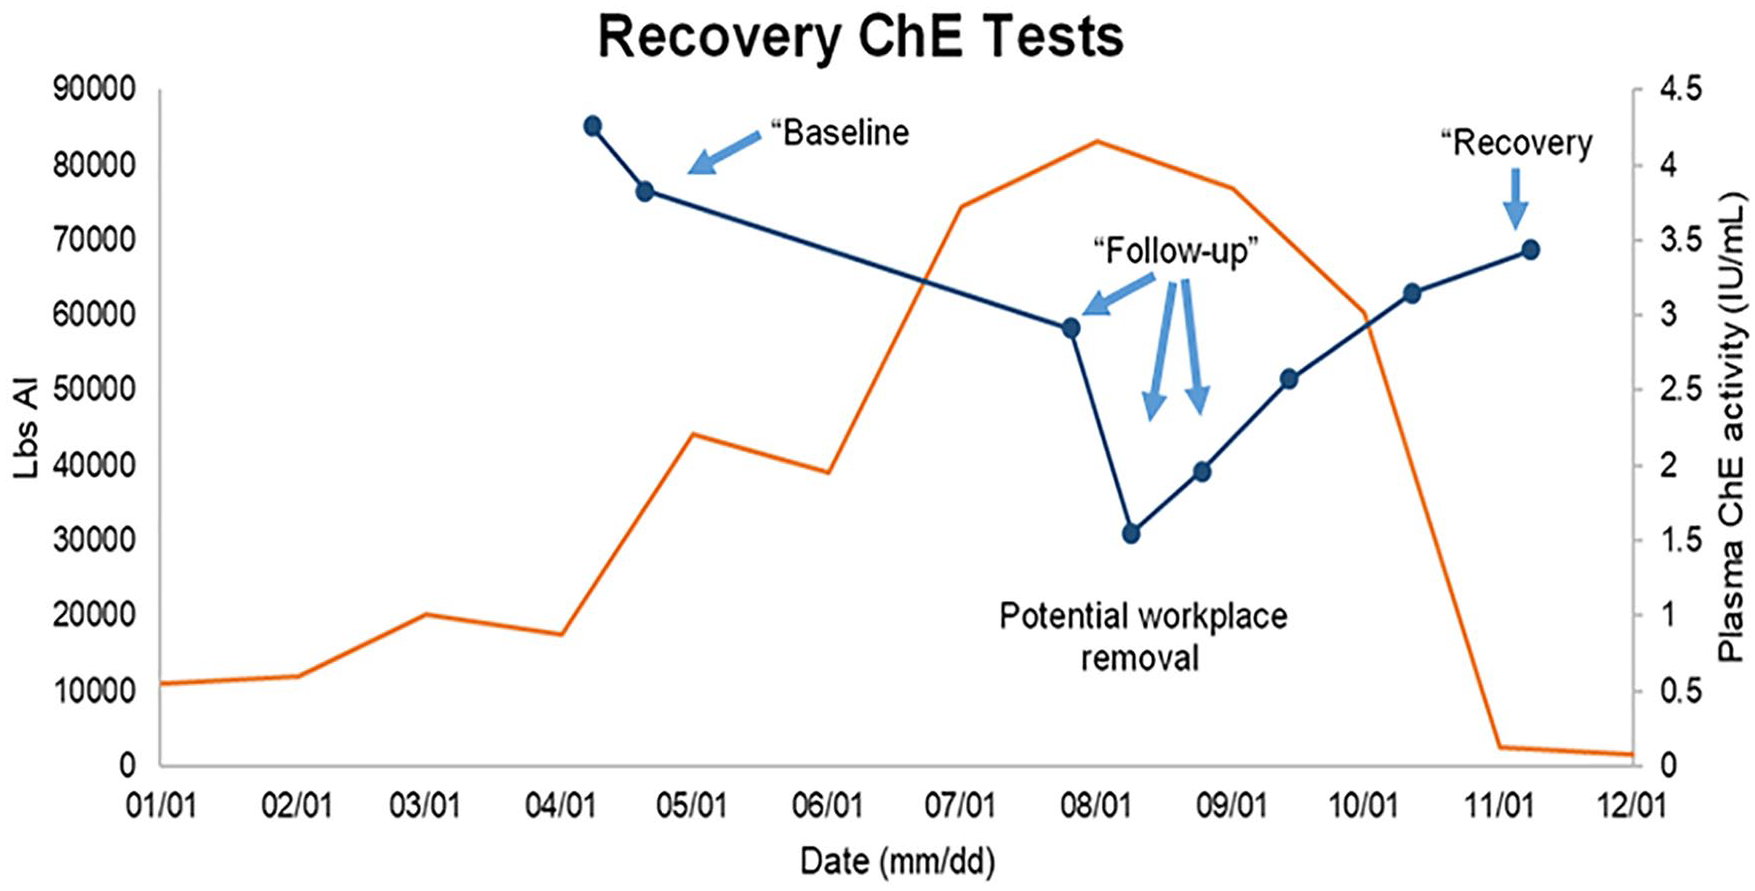
An individual’s plasma ChE tests over time (dark blue). The labels in quotations are the test purpose associated with each test, indicated by the arrows. There was a significant depression between July and August, which could have been due to excessive pesticide exposure. Workplace removal may have occurred in August, since ChE activity levels improved afterward. The last test within the spraying season was within 80% of the baseline level, which was labeled “recovery.” This trend was compared to the pesticide use data for Fresno County, where the ChE tests were ordered.
Although there were too few tests to fully evaluate whether employers took actions consistent with Program requirements, these tests do show a rebound trend back to baseline levels, suggesting that some protective actions may have been taken. All ChE tests that indicated recovery were preceded by tests that contained “baseline” or “follow-up” under the test purpose field. The trends of plasma ChE activity levels over time for all individuals represented non-monotonic curves that showed significant depressions following a single test or 2 tests taken 3 to 14 days apart, then a gradual increase. Some ChE activity levels of individuals recovered to levels within 80% of the initial test(s) after depressions. These observations reflect workers under the Program whose ChE activity levels exceeded the workplace removal action threshold (30% for RBC ChE and 40% for plasma ChE) thus removed from work, elucidating the gradual recovery to levels within 80% of their baseline. Figure 10 suggests that, for this individual, appropriate action(s) (e.g., workplace removal) were executed according to Program requirements to promote ChE recovery back to normal levels after a significant depression has occurred.
Efficacy of Program Interventions
In this section, we attempted to assess improvement in data quality and evaluate the impact of the registration of medical supervisors on data itself.
As previously mentioned above, the purpose of the test was analyzed to determine degree of compliance with Program requirements. An improvement in compliance with the purpose of test reporting requirements was shown when the proportion of tests indicating baseline, follow-up, or recovery increased every year between 2014 and 2019, with the highest percentage of tests reaching 24.9% in 2019 (Figure 11). In 2015, the number of tests containing a purpose related to the Program increased significantly, from 3.8% in 2014 to 11.1%, corresponding to OEHHA’s in-person visits to physicians. A closer look at the breakdown of the terms used for the purpose of test over this 6-year period revealed that the proportion of tests indicating follow-up remained low from 2014 to 2016, but nearly doubled between 2017 and 2018, and was almost 2 and a half times higher between 2018 and 2019. These changes in proportion of follow-up tests coincide with OEHHA’s Program interventions in recent years. Although the overall degree of compliance with the purpose of test requirement has been relatively low, there has been an improvement in recent years.
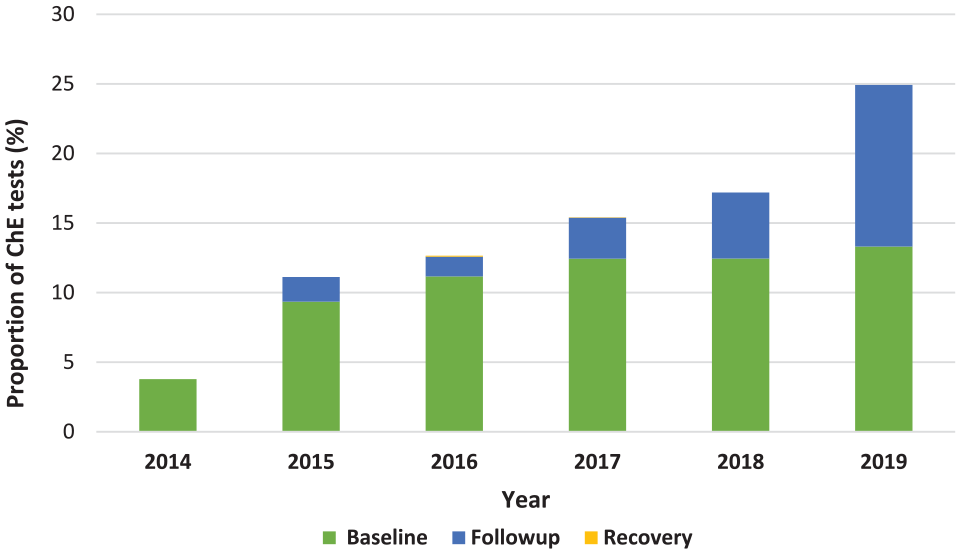
Yearly proportion of ChE tests correctly labeled as baseline, follow-up, and recovery from 2014 to 2019.
The number of tests ordered by medical supervisors versus by other physicians was analyzed to determine if the registration process had an impact on data quality. Physicians who registered with OEHHA from 2017 onward were identified within the 2014 to 2019 dataset (Figure 12). Although only 10.6% of physicians who ordered ChE tests were registered medical supervisors, between 2014 and 2019 they ordered 49.5% of ChE tests deemed under the Program (n = 122,917) and the proportion of tests ordered by those medical supervisors has increased annually from 22% to 65%. Furthermore, 70.5% of the ChE tests from individuals who received periodic testing (35.4%, n = 43 470) were ordered by medical supervisors.

Yearly proportion of tests ordered by medical supervisors between 2014 and 2019.
Discussion
The California Medical Supervision Program was implemented in the 1970s to protect agricultural workers who regularly handle Type I and II OPs and CBs from overexposure to those pesticides. Mandatory reporting of ChE test results to DPR, which shares that data with OEHHA, was enacted in 2011 in order to evaluate the effectiveness of the Program. Results from the first evaluation of the Program, which analyzed ChE data from 2011 to 2013, was conducted and were published in the 2015 Legislative Report 5 and in a peer-reviewed article. 6 This evaluation revealed issues with the quality of data received from certified reporting laboratories, which hampered data analysis and accurate interpretation of the results. With extensive data processing, the evaluation was able to conclude that the Program was effective in protecting pesticide handlers from excessive exposure to Type I and II OP and CBs. However, the data analysis revealed additional issues with data quality that could not have been addressed by previous data processing methods.
The current study analyzed 2014 to 2019 ChE data in order to continue to evaluate the Program, gage the degree of Program compliance throughout the state, and determine whether the changes implemented were successful in improving the effectiveness and evaluation of the Program. This study made changes to the previously employed data processing steps and new exclusion criteria were implemented. One major change was to automatically assign unique identifiers to individuals using the R software based on other unique data elements, if applicable (e.g., date of birth), and similarity between individuals’ names. This new process allowed OEHHA to more accurately identify and distinguish individuals who had missing parts to or typographical errors within their names. This step was key to identifying individuals with periodic testing and investigating individuals’ ChE activity levels over time.
Additionally, several recommendations were made in the 2015 Legislative Report 5 and have since been implemented to improve both data quality and the overall function of the Program. The recommendations included developing a list of active medical supervisors and promoting and expanding medical supervision training. In order to implement these recommendations, OEHHA was required to implement a registration process to register medical supervisors starting January 2017. This allowed the Program to effectively target medical supervisors and provide them with training and resources, such as the updated Guidelines for Physicians. 7
Similar to the results of the 2015 evaluation 6 , the findings of the current evaluation suggest that there has been a high degree of compliance with the Program. The temporal correlation analysis indicated ChE testing was done in concordance with regional OP and CB spraying seasons and showed that the number of follow-up and significant depression ChE tests correlated with the amount of pesticide used while the inverse was observed for baseline estimates. The number of follow-up tests was expected to correlate with spraying patterns because such tests are required for handlers once they are regularly handling pesticides. Spatial analysis indicated that the majority of ChE test results analyzed were related to the Program because ChE tests were ordered in areas with high agricultural use of Type I and II OP and CBs. These correlations suggest that a large proportion of ChE tests analyzed were indeed for pesticide handlers under the Program and there is a high degree of compliance with the Program requirements. However, we noticed a significant disproportionality in the amount of pesticide use and tests ordered between the 2 regions which may indicate that the Program is more effective in the Coast than in San Joaquin area.
This evaluation also found that there was a low number of individuals with ChE depressions below threshold requiring action. Although there could be many explanations for this finding, one likely possibility is that handlers under the Program have been removed from further pesticide exposure before reaching a significant level of ChE depression. This is supported by the fact that the proportion of handlers with significant depression in California was comparable to the one observed in Washington State (9.5% and 7%, respectively) 9 —the only other state with a program that monitors cholinesterase activity in pesticide handlers. Moreover, the majority of these tests were ordered by registered medical supervisors, which suggests that the low number of ChE depressions during this time period was most likely due to compliance with Program requirements. The increase in proportion of ChE tests ordered by medical supervisors signaled that Program interventions conducted during this time period may have successfully enhanced medical supervisors’ understanding of the Program. Namely, in 2015, OEHHA conducted in-person visits to provide resources and communicate Program responsibilities to medical supervisors and other healthcare providers under the Program. These findings point to the effectiveness of the Program in protecting handlers from excessive exposure to highly toxic OP and CB pesticides.
One major limitation with both the 2017 and current study is that the total number of agricultural workers who should be under the Program (those who regularly handle Type I and II OPs and CBs in California) is unknown. Thus, it is not possible to determine the participation rate of these handlers to the Program. Therefore, evaluation of effectiveness of the Program in protecting handlers from overexposure is notably limited due to this missing information. In future work, we propose to address this by conducting an occupational survey in geographically relevant areas (i.e., areas of high use of Type I and II OPs and CBs) to compare the number of handlers that should belong to the Program with those currently being monitored.
An inherent limitation with this Program is the lack of real-time surveillance of ChE depression from excessive pesticide exposure; the state and local departments are not alerted when significant ChE depressions occur from handlers in the Program. Several changes could be implemented to reduce the amount of time between occurrence of significant ChE depressions and when state departments are able to detect those cases. For example, laboratories could improve the collection and transfer of ChE test results related to the Program by making this data readily available for OEHHA and DPR, which could reduce the amount of data cleaning and exclusion that is currently necessary to perform data analysis. Future legislation could implement new drawing lab information requirements to include unique identifiers for patients and physicians, which would reduce data cleaning steps and allow for swifter data analysis.
Also, a new law was adopted in 2017 (Section d of HSC § 105206) for physicians under the Program to report ChE depressions indicative of pesticide exposure within 24 hours. However, between 2017 and 2019, there have been no such reports of suspected pesticide induced ChE depressions despite findings in the current evaluation that suggest significant ChE depressions in pesticide handlers occurred within this time period. This should be addressed because accurate and timely reporting of suspected ChE depression from excessive pesticide exposure could be used to confirm and validate significant ChE depressions when detected in the dataset, which would allow for prompt implementation of targeted interventions to protect pesticide handlers from further exposure. In the future, OEHHA should perform additional outreach in order to improve California physicians’ understanding of this new requirement.
Overall, routine monitoring of ChE has been successful in identifying significant depressions, taking action and overall protecting pesticide handlers from overexposure. Although there is much room for improvement, the Program has improved over time with appropriate interventions. If the Program continues to be improved by the implementation of new recommendations, such as those proposed above, state departments would be able to more efficiently and effectively assess the program effectiveness and more confidently make recommendations to physicians and employers. In 2015, the U.S. Environmental Protection Agency decided not to require a mandatory routine ChE monitoring program as part of the Worker Protection Standard, 10 stating that the “the benefits of routine ChE monitoring would not justify the cost.” The severity of adverse health outcomes associated with OP and CB overexposure justifies its cost. Moreover, protecting the health and safety of agricultural workers would also reduce various indirect costs (e.g., medical, legal, labor) associated with pesticide-related illnesses for the State, growers, pesticide manufacturers, individual handlers, and other stakeholders.
Conclusion
In summary, similar to what was observed in Laribi et al, 6 electronic-based reporting gives the Program the ability to analyze ChE test results on a statewide level and identify ChE testing patterns on a regional scale, valuable for evaluating the Program. Major improvements in the data processing since the last evaluation have enhanced the analysis and interpretation of the results. This analysis allowed for identifying the population of concern with more certainty and calculating ChE depressions with more accuracy. Additionally, Program improvements, such as registration of physicians, has somewhat increased our confidence in the findings from data analysis and has been useful in conducting targeted outreach and training. Unfortunately, the Program is still unable to review the test results in a timely manner to provide appropriate medical or toxicological consultation to medical supervisors when needed. If certain data elements, such as the purpose of the test, were accurately reported and unique personal identifiers were available, it would vastly improve the efficiency and confidence in the results of the analysis. Lastly, the Program would likely benefit from focusing the next evaluation on counties with high Type I and II OP and CB use and conducting a targeted study on a smaller population of individual handlers so that an in-depth evaluation of components of the Program can be done and further data gaps can be identified. 11
Footnotes
Declaration of Conflicting Interests
The author(s) declared no potential conflicts of interest with respect to the research, authorship, and/or publication of this article.
Funding
The author(s) received no financial support for the research, authorship, and/or publication of this article.