
Abstract
The California Medical Supervision program is designed to protect workers who regularly mix, load, or apply the highly toxic Category I and II organophosphates and carbamates from overexposure by monitoring cholinesterase (ChE) inhibition in plasma and red blood cells. Since January 2011, testing laboratories are required to report test results electronically to the California Department of Pesticide Regulation who shares it with the Office of Environmental Health Hazard Assessment for evaluation. The purpose of this study is to assess the utility of this reporting in evaluating the effectiveness of the Program for illness surveillance and prevention. From 2011 to 2013, we received more than 90 000 test results. Despite data gaps and data quality issues, we were able to perform spatial and temporal analyses and developed a screening tool to identify individuals potentially at risk of overexposure. The data analysis provided some evidence that the Program is effective in protecting agricultural workers handling the most toxic ChE-inhibiting pesticides even though it also identified some areas of potential concerns with individuals that appeared lacking corrective actions in the workplace in response to excessive ChE depressions and parts of the state with disproportionately at-risk individuals. However, changes to the electronic reporting are needed to more accurately identify tests related to the Program and therefore improve the utility of the data received. Moreover, data analysis also revealed that electronic reporting has its limitation in evaluating the Program.
Keywords
Introduction
Organophosphate (OP) and N-methyl carbamate (CB) pesticides are among the most widely used pesticides. However, in California, where all agricultural pesticide use must be reported, Pesticide Use Report (PUR) data show that the use of these pesticides has declined nearly 75% in 20 years (data available at http://www.cdpr.ca.gov/docs/pur/pur14rep/14_pur.htm). Nonetheless, the most recent data (2008-2014) indicate that millions of pounds continue to be used in the state every year.
Both OPs and CBs work as insecticides by inhibiting cholinesterase (ChE), an enzyme that breaks down the neurotransmitter acetylcholine, leading to the death of the insect. Similarly, they can also affect humans. ChE is critical for the normal function of the nervous system, and even transient reductions in ChE activity level can lead to toxic symptoms that are characteristic of these 2 pesticide classes. 1 The most common signs and symptoms of acute OPs/CBs toxicity are slow heart rate, low blood pressure, difficulty breathing, salivation, lacrimation, sweating, abdominal pain, loose stools, muscle weakness, anxiety, and confusion. Although OPs and CBs are 2 distinct chemical classes of pesticides that share a common mechanism of action, CBs are considered reversible inhibitors, whereas OPs bind irreversibly to the enzyme. Therefore, compared with OPs, CBs have a shorter duration of action and, generally, are less potent. 2
The California Department of Pesticide Regulation (DPR) has made vast efforts aimed at protecting the health of agricultural workers. Among these efforts, the California Medical Supervision program is designed to protect workers who regularly mix, load, or apply the highly toxic Category I and II OPs and CBs from overexposure. The purpose of the Program is to identify and prevent exposure resulting in illness or injury by monitoring the activity of ChE in the blood (plasma and red blood cell) of agricultural workers who regularly mix, load, or apply these pesticides. By monitoring ChE, the Program aims to detect ChE depressions in these workers prior to the onset of symptomatic illness.
This state-of-the-art program was enacted in 1974 (Title 3, California Code of Regulations 6728) and was the first of its kind. Washington State is the only other state with a similar program, which it modeled after that of California. Since its inception, the California Medical Supervision program has undergone several reviews3-10 that discussed changes and practical solutions to a number of implementation problems to increase its effectiveness, and it has consequently been updated to improve worker protection.
Recent changes in regulations (California Health and Safety Code, section 105206 added by Stats. 2010, Ch. 369, Sec. 2. And effective January 1, 2011) have led to mandatory electronic reporting of ChE test results by the testing laboratories to DPR who shares this information with the Office of Environmental Health Hazard Assessment (OEHHA). This has provided us the opportunity to analyze, for the first time ever, the electronic laboratory-based reporting and evaluate its usefulness in assessing the effectiveness of the Program.
Methods
Program Description
The Program requires all employers of workers handling OPs/CBs to contract a licensed physician to act as a medical supervisor. The medical supervisor monitors the ChE activity levels of pesticide handlers to ensure their safety (Figure 1a). The medical supervisor must first order tests before a worker begins handling OPs/CBs (minimum 30-day exposure-free period) for baseline levels of red blood cell (RBC) and plasma ChE. Routine monitoring of both RBC and plasma ChE levels of the workers who regularly handle OPs/CBs (defined as more than 6 days in a 30-day period) follows. The medical supervisor compares the follow-up monitoring test results with the baseline levels to evaluate ChE depression and makes recommendations, based on these results, to the employer and employee. These recommendations may include allowing a worker to continue working with OPs/CBs, reevaluation of workplace practices, or temporarily removing the worker from handling such pesticides (Figure 1b).
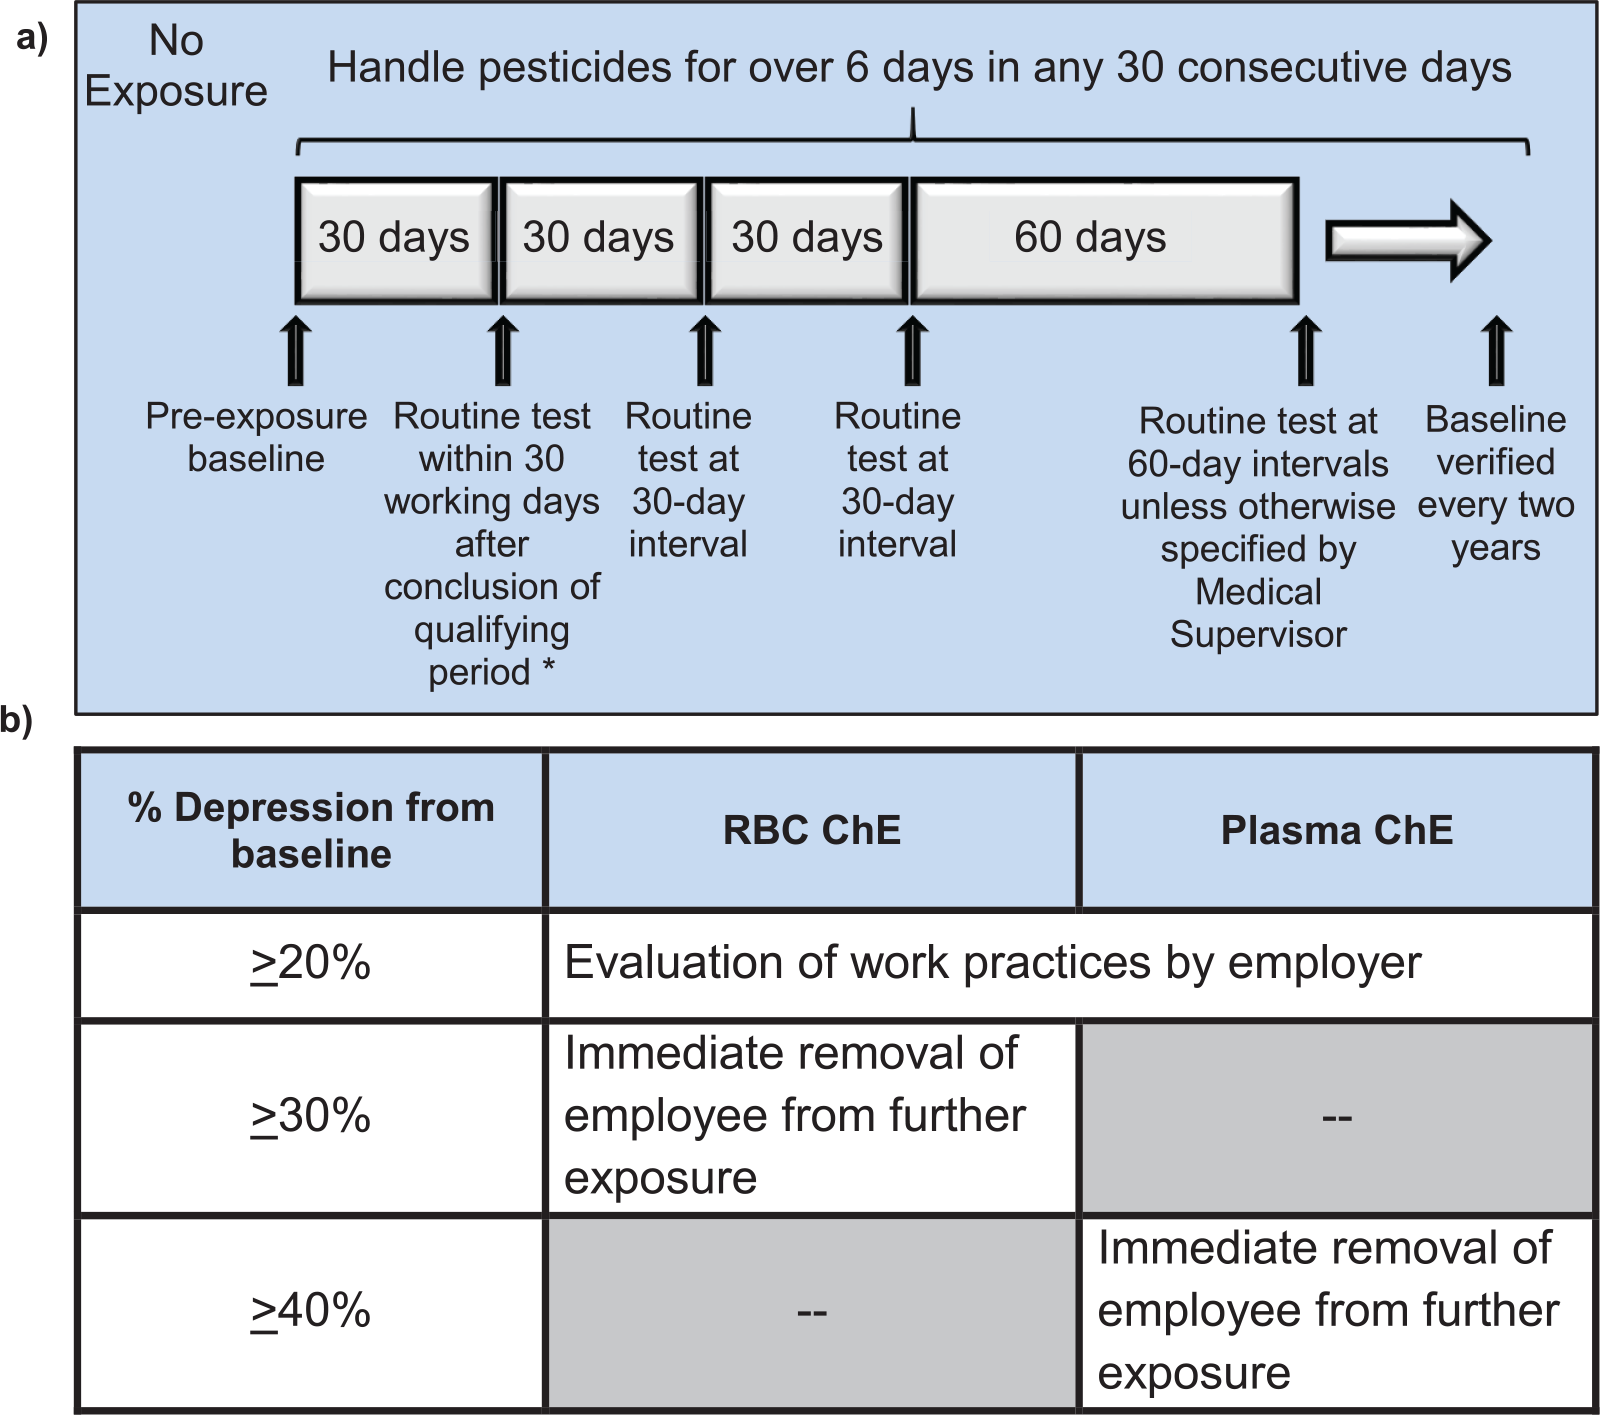
a) Summary diagram on the frequency of cholinesterase activity testing. b) Action levels of RBC and plasma ChE and the associated actions required under the medical supervision program.
The Program also requires that medical supervisors possess a copy of the Guidelines for Physicians Who Supervise Workers Exposed to Cholinesterase-Inhibiting Pesticides (http://oehha.ca.gov/media/downloads/pesticides/document-pesticides/physicianguidelines5thedition2015final.pdf). This document prepared by the OEHHA provides recommendations on baseline ChE level calculation, frequency, and interpretation of test results as follows 11 :
Data Collection
Medical supervisors send the workers to get their blood drawn directly at the doctor’s office or at a drawing laboratory. The blood samples are then shipped to one of the 6 laboratories approved by the California Department of Public Health (CDPH) for the analysis of ChE activity levels in blood specimens for the purpose of the Program. Each laboratory is required to send the test result and other information in its possession to DPR in Excel format, at minimum, on a monthly basis. The information collected is specified in California Health and Safety Code, section 105206 and includes the following: name, date of birth, and contact information of the person tested; purpose of the test; name, address, and telephone number of the medical supervisor who ordered the analysis; name, address, and telephone number of the analyzing laboratory; accession number of the specimen; collection date when blood specimen was drawn; result report date; patient’s contact information; and employer’s contact information. As mentioned earlier, DPR then shares this information with the OEHHA.
Data Cleanup
The OEHHA obtained the raw data from DPR through a secure access website. More than 90 000 records were downloaded for the period of 2011-2013. To assure data consistency within each laboratory, we used SAS version 9.1 statistical software (SAS Institute Inc., Cary, North Carolina) for data cleaning (eg, reformatting the data, flagging missing information, removing duplicates, and correcting typographical errors) and processing.
Application of Exclusion Criteria
The laboratories reported results of all ChE tests they performed to DPR, not just those related to the Program. This is due to the fact that they were not able to consistently determine whether the tests were taken as part of the Program. Therefore, ChE test results ordered for other instances such as preoperative testing, Alzheimer drug monitoring, liver disease screening, and aging research studies were also reported. As a result, we had to develop criteria for excluding irrelevant records (unrelated to the Program) from further analysis. Test results that met any one of the following criteria were excluded from further analysis:
Contained only 1 of the 2 ChE tests (both RBC and plasma being required by the Program)
Indicated employers that do not apply OPs/CBs for agricultural purpose (eg, San Francisco General Hospital)
Showed that the age of the test subject was below 16 (minimum legal age) or above 75 (higher probability for this age group to be monitored for treatment of disease)
Showed that the physician who ordered the test was located outside California (not belonging to the Program)
Showed that the physician only ordered ChE tests for one unique individual from 2011 to 2013 (low probability to be a physician part of the Program).
After application of our exclusion criteria, there were 58 064 paired ChE tests (RBC and plasma) for 11 735 apparent pesticide handlers (Figure 2a). The important reduction in the number of test results and individuals following the application of the exclusion criteria suggests that a large number of ChE test results reported by the laboratories were not related to the Program.

Methodological approach. (a) Total number of individuals before data clean-up, after data clean-up, and after application of exclusion criteria. (b) Diagram of the data set split in groups whether or not individuals had periodic testing and whether or not individuals had two tests taken 3 to 14 days apart during low-spraying season.
Data Set Split
To investigate the patterns of ChE activity and the frequency of ChE depressions, we divided the data set into 2 groups:
Individuals who only received less than 1 test per year: This group appeared to have received a baseline regularly (annually or every 2 years) but did not have other periodic testing (follow-up) taken.
Individuals who received 2 or more tests per year: This group appeared to have received a baseline regularly and other periodic testing (follow-up) taken.
Of the 11 735 individuals identified following data cleaning, 88.6% (n = 10 397) appeared to only have received 1 unique test (“individuals without periodic testing”), whereas 11.4% (n = 1 338) appeared to have received both baseline and at least 1 additional in-season test (“individuals with periodic testing”) (Figure 2b). This second group was used for the analysis of individual ChE activity patterns, and frequency and type of depressions.
Estimating Baseline Values
As mentioned earlier, the medical supervisor compares the follow-up monitoring test results with the baseline levels to evaluate ChE depression. But as the purpose of the test (eg, baseline, follow-up, recovery, illness) for nearly all the records (~90% of all the records received) was not indicated, we explored alternative methods to estimate baseline values to analyze the data (Figure 2). We based our decision on the recommendations in the Guidelines for Physicians, which state that (1) ideally, the baseline value should be the average of 2 or more tests taken at least 72 hours but not more than 14 days apart following a 30-day exposure-free period (called here “14-day baseline”) and (2) 1 baseline test is permissible if 2 cannot be obtained.
Approximately half the population of presumed pesticide handlers appeared to have 14-day baselines. Their baseline values were calculated by averaging the 2 test results, and this method of baseline estimation was referred to as Approach 1. However, 14-day baseline estimates were not available for the rest of the population. To include these individuals in our analysis of depression frequencies, a different approach (“Approach 2”) was adopted using the highest ChE test result obtained over the 2011-2013 period as an estimated baseline.
Approach 1 (n = 663)
Baseline ChE activity level was determined by averaging results from 2 tests taken 3 to 14 days apart during the low-spraying season because pesticide handlers were most likely to be free of exposure during that period of the year. According to the Guidelines for Physicians, if a patient is recovering from ChE depression that required removal from OPs/CBs handling activities, the medical supervisor should promptly verify that ChE activities are returning to baseline. This situation also might lead to 2 samples being collected within a 14-day period. To avoid misidentifying recovery values with baseline values, we restricted the “baseline period” to the low-spraying season. Using statewide PUR data, we defined the low-spraying season as the 5 months with the lowest OPs/CBs use in California: November through March. If the first 2 baseline tests differed by more than 15% and a third test was performed within 14 days, the baseline was calculated as the average of the 2 closest results.
Approach 2 (n = 675)
For those data that were not amenable to Approach 1, we assumed that the highest ChE test result obtained over the 3-year period (2011-2013) was the baseline. We hypothesized that as baseline samples should be taken following a 30-day exposure-free period, the value of the baseline should be close or equal to the maximum ChE activity observed.
The data set for subsequent analysis was comprised of records using either one or the other of the 2 approaches to define the baseline.
Data Analysis
We then analyzed the ChE data to determine whether it might provide insights and possible answers to these questions. The processed data were exported back into Excel and ArcGIS version 10.2 (Esri Inc, Redlands, California) software to be analyzed. Agricultural pesticides use of OPs/CBs used in California in 2012 in amounts of more than 100 pounds was extracted by DPR from the 2014 PUR data set and was provided in monthly pounds (lbs) of active ingredients (AI) used per month.
Results
Geospatial Analysis
As shown in Figure 3, we used geospatial analysis to determine whether the overall number of ChE test results, both from individuals with and without periodic testing, reported from each county (using the location of the physician who ordered the ChE test) was proportional to the amount of OPs/CBs (sum of all OPs/CBs I and II AIs in pounds) used in that county. There is generally good correlation between geographic density of ChE test results and the areas of high pesticide use (Pearson r = 0.67, P < .0001). In other words, the larger the quantity of OPs/CBs used in a county, the higher the number of ChE test results.

Geospatial analysis.
However, geographic analysis also revealed that there were very few ChE test results from several California counties that had relatively high OPs/CBs use (indicated with arrows on map). Indeed, some counties with relatively high pesticide use (eg, Butte, Glenn, Sutter, Yuba, and Colusa in the northern Sacramento Valley and Riverside in Southern California) did not have many ChE test results. In addition, geographic analysis revealed that some counties with no or very low pesticides use (eg, San Francisco) had a disproportionally high number of tests.
We then investigated the associations between the geographic distributions of apparent ChE depressions and county pesticide use to determine whether depressions occurred more often in areas of high OPs/CBs use (data not shown). The total number of depressions per county is significantly though weakly correlated with pesticide use (Pearson r = 0.32, P < .05). However, the lack of ChE test results previously noted in some counties with moderately high OPs/CBs use (eg, northern Sacramento Valley) reduced the strength of the correlation. In contrast, 3 high-use counties (Monterey, Ventura, and Kern) had a proportionally high number of depressions, and 1 county (San Benito) had a disproportionally large number of ChE depressions compared with the amount of OPs/CBs use. Even though we could not determine the reason(s) for these observations from analysis of the data alone, we were able to identify area(s) with potentially at-risk individuals for whom follow-up with the medical supervisor and/or the employer could be conducted.
Temporal Analysis
We performed temporal analysis of data sets to determine whether the monthly number of ChE test results reported was proportional to the monthly volume of OPs/CBs use (Figure 4).

Temporal analysis. Monthly OPs/CBs use (Pesticide Use Report) and (a) number of estimated baseline ChE test results, (b) number of estimated follow-up ChE test results, (c) proportion of follow-up tests with depressions from individuals with periodic testing between 2011 and 2013, and (d) number of “one-time only” test results from individuals without periodic testing.
Figure 4a shows statewide monthly pesticides use with number of estimated baselines, and Figure 4b shows statewide monthly pesticides use with number of estimated follow-up ChE tests between 2011 and 2013 from the data set of individuals with periodic testing (from both approaches combined). Periodic testing was defined as a record with more than 2 paired RBC and plasma ChE test results within any given year. As expected, the number of follow-up ChE tests (defined as total ChE tests minus baseline ChE tests) showed a strong correlation with the volume of pesticide use (Pearson r = 0.78, P < .0001), suggesting that an increase in the volume of OPs/CBs use leads to an increase in the number of follow-up tests being ordered. Conversely, the number of estimated baseline ChE tests was inversely correlated (Pearson r = −0.29, P > .5) with pesticide use, reaching a peak between January and March of each year, just before the beginning of the spraying season. Although results were more striking with Approach 1, both approaches had similar trends (data not shown).
Figure 4d shows statewide monthly OPs/CBs use and number of tests ordered from the group of individuals that had “one-time only” tests (no periodic testing). As mentioned earlier, this group represents the vast majority (88.6%) of the worker population. As expected, the pattern of number of tests from this data set is similar to the one observed with baselines from the group with periodic testing (Figure 4a) reaching a peak between January and May of each year, just at the beginning of the spraying season (Figure 4d). This suggests that a large number of these individuals most likely participate in the Program even though they did not have any follow-up testing. Nevertheless, some months with high pesticide use (eg, June-August 2011) still had many “one-time only” tests presumably from individuals not participating in the Program or from areas of the state where seasonality is not relevant (eg, Imperial County).
We then investigated the associations between the temporal distribution of depressions and monthly pesticide use to determine whether depressions occurred more often during the months of high OPs/CBs use (Figure 4c). Monthly frequency of depressions (number of tests with significant depressions/total number of tests) was strongly correlated with pesticide use (Pearson r = 0.69, P < .0001).
Analysis of Patterns of Depressions
To investigate the frequency of ChE depressions (2011-2013), we used the data set from individuals with periodic testing to look at the distribution of ChE test results that were at the action levels of 20% of RBC and/or Plasma ChE, 30% of RBC ChE, or 40% of Plasma ChE below baseline, as described in Figure 1b.
We first investigated the number of individuals with ChE depression that exceeded any action level and the number of those who required evaluation of workplace practices or immediate removal from work (data not shown). Overall, 24% (n = 324) of pesticide handlers had at least 1 plasma ChE depression and 7% (n = 95) had at least 1 RBC ChE depression requiring prompt ChE retesting. Four percent (n = 49) of the suspected workers had at least 1 depression requiring removal from work based on plasma ChE depression and 2% (n = 30) based on RBC ChE depression. Not all workers with plasma ChE depression had an RBC ChE depression, and not all workers with RBC ChE depression had a plasma ChE depression. However, we observed some overlap between these 2 groups.
A primary objective of the data analysis was to identify ChE test results that exceeded 1 or more action levels. As previously mentioned, there were 1338 individuals who were tested numerous times over the 3-year period, allowing a time course evaluation of ChE activity levels. To examine whether actions were being taken in the workplace in response to ChE test results that crossed an action level, we plotted the variation in ChE activity level over time for each individual. Often, the number of ChE tests over time is sufficient (at least 2 consecutive tests within a 3 month-period) to provide some indication that worker’s activities were being managed in accordance with the recommendations of the Guidelines for Physicians. In some cases, insufficient records (less than 2 tests within any 3-month period) for individual workers prevented us from assessing whether corrective actions had been taken, or follow-up monitoring had been initiated, following ChE depression.
If an individual has repeated or prolonged depressions that exceed action levels, this suggests that long-term remedies are needed (eg, implementing engineering controls, improving work practice, or providing better training to protect these workers). Therefore, taking into account the duration (slow vs rapid return to >80% of the baseline), and frequency (single vs multiple times) of depression of his or her ChE activity levels, we defined 5 different time courses of interest for ChE activity (Figure 5a):
No depression exceeding action levels: No depression below the minimum action level (<80% of baseline) occurred.
Single depression with rapid (<3 consecutive tests below the thresholds) return to acceptable level (“single not extended”): 1 or 2 consecutive depressions below the minimum action level occurred within a 3-month period, with rapid return to >80% of baseline (acceptable level).
Single depression with slow (≥3 consecutive tests below the thresholds) or no return to acceptable level (“single extended”): 3 or more consecutive depressions below the minimum action level occurred within a 3-month period, with slow return or no return to acceptable level.
Multiple depressions with rapid return to acceptable level (“multiple not extended”): More than 2 discrete depressions below the minimum action level occurred, with rapid return to an acceptable level.
Multiple depressions with slow or no return to acceptable level (“multiple extended”): More than 2 discrete depressions below the minimum action level occurred, with at least one of these depressions returning slowly or not returning to acceptable level.

Screening tool. (a) Diagram of patterns of depressions of ChE activity and (b) overall distribution (n = 1338) by type of ChE depressions (single, multiple, extended, or not extended): plasma (top) and RBC (bottom).
We developed a screening tool that allowed us to identify the number of individuals with these different time courses of either RBC or plasma ChE for the 2011-2013 period. We specifically investigated the percentage of individuals who experienced repeated depressions of ChE and those whose ChE activity level remained depressed for an extended period of time. These results are shown in Figure 5b. Seventy-six percent of the individuals had no plasma ChE depression that exceeded an action level, and 87% had no RBC ChE depression. With regard to plasma ChE activity levels, 15% experienced multiple depressions and 9% had a single depression, while 6% of individuals had single depressions and 7% multiple depressions of RBC ChE activity levels. However, multiple depressions were generally short in duration and promptly returned to a level that would allow a worker to return to pesticide handling activities (ie, >80% of the baseline). Five percent of the individuals experienced multiple plasma ChE depressions with slow return, while 2% experienced multiple RBC ChE depressions with slow return. These results suggest that in most cases, immediate action might have been taken following a depression of >20%, resulting in a prompt return to an acceptable ChE activity level. But this analysis also suggests that, in some cases, long-term remedies may not have been implemented to prevent further excess pesticide exposure and consequent reoccurrence of ChE depression.
Discussion
The California Medical Supervision program has been in effect since the 1970s. Since its inception, the Program has been reviewed on a number of occasions; these reviews have resulted in recommendations, some of which have been implemented. However, the analysis presented here, that was also used for the report to the Legislature, 12 was the first statewide evaluation of the Program done using the electronic laboratory reporting data.
We used these data to know whether the Program is helping to protect workers who regularly handle OP and CB pesticides. Therefore, we investigated (1) whether workers who regularly handle Category I and II OP and CB pesticides participate in the Program, (2) whether ChE depressions that exceed levels requiring action are prevalent, and finally (3) whether workplace actions are being taken in response to excessive ChE depressions.
Although the Program participation rate for existing workers who regularly handle OPs/CBs is not known, our analysis of the geographic distribution of ChE tests indicates that workers were more likely participating in the Program where OPs/CBs were used the most. We also noticed a lack of longitudinal monitoring (“no periodic testing”) for most individuals (89%) in the data set. We offered possible reasons for such observation: (1) These individuals did not need to be retested because they did not handle pesticides more than 6 days per 30-day period, (2) these individuals were not in the Program and the exclusion criteria failed to exclude them, or (3) medical supervisors and/or employers failed to comply with the Program’s requirements. In-person visits with medical supervisors carried out by OEHHA confirmed the first hypothesis without disproving the other ones. 12
Spatial analysis also revealed that some regions (eg, Northern San Joaquin Valley) had relatively high OPs/CBs use and very few workers tested. Possible explanation for the lack of test results from these counties could be (1) missing location information on the ChE test reports (more than 16% of tests did not indicate the address of the medical supervisor), (2) misclassification of certain pesticides as Toxicity I and II categories, (3) lack of information on the employee’s worksite, (4) seasonal migration of workers from one county to another, (5) small farms in these areas may have hired pest control operators located in other counties to apply pesticides, and/or (6) employers failed to follow the Program requirements. Unfortunately, the data alone did not allow us to validate any. However, subsequent inspections of the growers applying OPs/CBs carried out by DPR revealed that some employers, particularly in these same low-test regions, managed pesticide handlers’ schedule. 12 Thus, by limiting their exposure to less than 6 days within a 30-day period, workers were not required to participate in the Program. We also noticed that some regions (eg, San Francisco) with low OPs/CBs use had a significant number of tests taken. Further analysis of the data unveiled that these tests were from individuals not receiving periodic testing and most likely not participating in the Program (eg, preoperative testing, Alzheimer drug monitoring, liver disease screening, and aging research studies).
Our analysis of the temporal distribution of ChE tests and OPs/CBs use suggests that, as expected, baseline tests occur mainly during nonspraying season, whereas follow-up tests occur during spraying season.
Similarly, we analyzed temporal and geographical distribution of ChE depressions and OPs/CBs use to assess whether depressions that reached a level requiring action were occurring proportionally to pesticide use. We found that, overall, depressions occurred when and where pesticides were used the most and were proportional to the total number of tests. However, there were identifiable outliers of occurrence where depressions occurred disproportionately to pesticide use. Further investigation of the data revealed that most of these outliers originated from the same physicians and/or employers.
We developed a screening tool to further understand the level, frequency, and duration of depressions for each individual with periodic testing. This analysis of the ChE data indicates that a majority of individuals with periodic testing did not experience ChE depression that reached a level requiring action by the medical supervisor or the employer and that most of the workers with depressions requiring action had their ChE level rebound within a short period of time, suggesting that the employer took corrective measures and prevented the worker from further exposure to OPs/CBs. This immediate, corrective action would not be possible without routine ChE monitoring. However, we also found that some individuals had multiple short-term depressions in 2011-2013, suggesting that effective communication between medical supervisor and employer likely did not occur, or exposure to OPs/CBs was not minimized and/or eliminated and that long-term remedies were not implemented to prevent subsequent OPs/CBs exposure.
The data analysis gave us good insight into the Program’s functioning; however, the large number of extraneous ChE test results (not related to the Program) compromised our ability to focus our analysis on the population of interest (ie, OPs/CBs handlers). As a result, we applied broad inclusion criteria to increase our confidence that the data reflected the work activities of all workers in the Program. We can expect that this process has erroneously eliminated data that were actually relevant to the Program or inversely kept data that were not relevant to the Program. Therefore, limiting analysis of ChE test results to agricultural workers will greatly improve the ability to use these test results to evaluate the California Medical Supervision program. Another major obstacle we encountered in effectively analyzing the ChE test results was the fact that the data did not differentiate baseline, follow-up, and recovery tests. Because of this data gap, we had to use certain assumptions in evaluating the ChE data, and that could have affected our findings. We used 2 approaches to estimate baselines, one of which (Approach 2) produced higher estimates of baseline activity than the other (Approach 1) which led to a higher frequency of ChE depressions. Having the purpose of the ChE test indicated in the reports would greatly improve the potential of the data, allowing for both selecting the population of interest and accurately measuring depressions. When the ChE data are not accompanied by this information, the complexity and difficulty of analysis and interpretation are increased, therefore reducing the reliability of the findings.
Finally, another challenge to effectively interpreting the ChE monitoring results was data incorrectly and/or incompletely reported to the testing laboratories. However, we observed that the quality (eg, completeness) of the reports increased over time (2011-2013); therefore, some issues seem to have been resolved. That is most likely the product of DPR’s efforts working with the laboratories to provide consistent, complete, and accurate reporting of ChE testing results. Better quality data would greatly improve our ability to quickly and confidently review the ChE test results to provide appropriate consultation to the medical supervisor and to evaluate the effectiveness of the Program.
However, although the data could give us an indication of the effectiveness of intervention, it would not tell us with certainty (1) whether medical supervisors are following up on their patients in case of ChE depression or whether they are sending the employees for baseline every 2 years; (2) whether medical supervisors are ensuring that their patients receive a copy of the ChE test results and any recommendations, or whether this is done within 14 days of receiving the results; and finally (3) whether employers maintain a written record of the findings, any changes in equipment or procedures, time period removed from work with ChE-inhibiting pesticides, and any recommendations made to the employee. Therefore, follow-ups with physicians and employers were essential to fully assess the Program and make recommendations for improvement but also help us meet our mandates to protect California’s agricultural workers.
Based on these recommendations, an assembly bill (AB2892) was passed and signed by the Governor (September 29, 2016) in which: a) the sunset date was extended to January 2021, b) the medical supervisor is now required to report ChE depression indicating pesticide exposure to the local health officer, and c) a procedure for registering and deregistering medical supervisors for outreach and training. A subsequent Program evaluation planned before the sunset will assess whether these modifications have helped both electronic reporting and program effectiveness.
Conclusion
In summary, electronic-based reporting gives us the ability to analyze ChE test results on a statewide scale and is a valuable tool for evaluating the Program. However, its usefulness would be vastly improved by accurately reporting the purpose of the test upon submission. This would allow us to identify the population of concern with certainty and be able to calculate depression accurately. If data quality improves, the screening tool that was developed could also be useful to review the test results in a timely manner to provide appropriate medical or toxicological consultation to the medical supervisor and therefore protect employees from overexposure.
Moreover, because of the missing and inaccurate information, the analysis of the ChE data was time-consuming. However, we are hopeful that, in the future, the screening tool we developed will be used to review the test results in a timely manner to provide appropriate medical or toxicological consultation to the medical supervisor to protect employees from overexposure.
In addition, data analysis revealed that electronic reporting alone is not sufficient to fully evaluate the effectiveness of Program. Indeed, the work presented here was part of a report to the California Legislature that included other tools used by both DPR and OEHHA to evaluate the Program and concluded with recommendations to improve it such as additions to the electronic reporting system, further outreach to participants (eg, medical supervisor, employer), and coordination across agencies responsible for the Program (DPR, OEHHA, and CDPH).
Footnotes
Acknowledgements
The authors thank Rima Woods and Jesse Landis for their technical advice, and David Ting and Lauren Zeise for helpful discussion on the analyses and review of the document. They also thank California Department of Pesticide Regulation’s (DPR) Pesticide Illness Surveillance Program team for their input and suggestions on the data analysis and DPR’s Environmental Monitoring team for providing them with the Pesticide Use Report data.
Authors’ Note
The opinions expressed in this article are solely those of the authors and do not represent the policy or position of the State of California or the California Environmental Protection Agency.
Declaration of Conflicting Interests
The author(s) declared no potential conflicts of interest with respect to the research, authorship, and/or publication of this article.
Funding
The author(s) received no financial support for the research, authorship, and/or publication of this article.