
Abstract
The economic crisis in Greece, which began in 2010 and lasted for 10 years, highlighted the serious problems and challenges of the Greek Social Health Insurance system. The reforms that mainly took place during the crisis provided a temporary solution. They focused on establishing a new National Organization for Healthcare Services (named EOPYY) and merging all the old insurance funds. This paper aims to examine whether this social health insurance fund has been sustainable in the long run. An actuarial model was created to project future expenses and revenues. Demographic and economic trends were considered, while it was assumed that medical technology remains unaltered. The assessment of the system solvency was based on the ratio (Revenue/Liabilities) calculated for each year, from 2020 to 2050. The results led to deficits, the amount and the time point in which they appear depends on how optimistic or pessimistic demographic and economic assumptions were. A new financial flow model was proposed to address the deficits. The results show that under the new model, the system remains solvent until 2050. The state subsidy amount on the employees’ health insurance premium was estimated as a percentage of the employees’ wage.
Rising health spending worries state governments and it is a risk for economic growth. Many types of statistical and econometric models have been developed to estimate health costs and many reforms for the better functioning of the health market.
The research concerns the Greek Health Insurance system. The 10-year economic crisis has brought significant changes to the health insurance of the country. But is the existing system sustainable in the long term?
The paper presents a framework for estimating system costs and inputs. A new policy is also proposed to address future deficits.
The work proposes a different flow of money into the health system as well as the creation of reserves for future needs. These proposals radically change health financing policy.
Introduction
The first two decades after World War II, member countries of Organization for Economic Co-operation and Development (OECD) were able to finance policies that increased access and improved quality of health services due to high economic growth. However, since the mid-1970s, declining growth rates and repeated financial crises change the primary goal of the government formation at the time, from improving to maintain the provided services. Simultaneously, citizens’ demand for health services continues to grow, and consequently better-quality services are requested. Health spending continues to rise in recent decades, and governments worry about the burden on their budget and the sustainability of the healthcare system.
Theoretically, when the schemes are mature, and the demographic structure is stable, social insurance schemes under pay-as-you-go (PAYG) financial system remain sustainable, 1 but the reality is different. Covering the demographic effects requires a significant number of subsidies from the State. Reforms have been made to adapt to demographic changes. As part of these reforms, the number of social health insurance funds has been reduced, encouraged competition, and strengthened market orientation to protect the principles of solidarity and self-governance. The funds for their financial sustainability provide better and more economical services and goods to the insured population. A typical example is the case of Germany. 2 Other countries, such as France, converted the calculation of the contributions taking into account total income or increased cost-sharing policies. 3
The study of the long-term financing and expenditures of the health system allows the timely identification and management of risks for its sustainability. This article aims to study the future financing of the Greek healthcare system and present a reforming proposal to ensure its solvency and sustainability. The main research questions are two. The first examines the health system solvency under the current funding system and it presents a framework for monitoring the Greek health system, using the solvency ratio (S.R.), an index used for social security programs 4 and recently to health systems. 5 Solvency ratio is calculated as the present value of future assets and liabilities. If yearly S.R. and total S.R. are bigger than one, the system is solvent. Also, its design has the re-estimation of the S.R. index in a short period, annually or every three years. This allows for creating a long-term amortization schedule and timely identification of risks to the system, such as changes in demographics or economic context.
The second main research question concerns the necessary reforms in the financing and the contribution rate in EOPYY. The existing model leads to a dead end. As the health expenditures increase, the insured contributions increase, consistently losing the insured’s trust in the system. Instead, it proposes a new financial flow model that can replace the existing one. The pay-as-you-go systems have a small reserve (buffer fund) to cover short-term emergency costs in their design. The proposed financing system has in its design the creation of a reserve that will cover the needs of the insured in the long run. The proposed model aims at long-term stability in terms of benefits and contributions.
The Greek Healthcare System Generally in Financing and Provision
Financing the Greek healthcare system is characterized by the coexistence of compulsory social insurance (up to 1/3), through the unified sickness fund (EOPYY), state subsidies (up to 1/3), and voluntary private health insurance system and private payments (co-payments or out-of-pocket) (over 1/3). Over 98% of the insured population is covered by EOPYY, whereas 10% of the population maintains voluntary health insurance coverage bought on the private insurance market.
On the provision side, National Health Service (called ESY) is the leading player. The ESY provides universal coverage to the population and operates on the principles of equity and equal access to health services for all and social cohesion. 6 Besides, a private sector of solo practice doctors and diagnostic centers covers the inabilities of ESY in Primary Healthcare and private hospitals, in the main metropolitan hospitals, reimbursed both by EOPYY under a Diagnosis-related group (DRG) scheme and patients privately refunded or not by their private insurances.
Until 2011 health and pension social insurances were covered together by 35 different occupation-based insurance funds. Insurance was mandatory. Each had a different legal framework, and there were differences in the contribution rates paid, coverage, benefits and conditions for the award of benefits. 7 The reform of the insurance system was one of the main priorities of the first economic adjustment program. The reform foresaw the allocation of the funds to two public bodies, EFKA (Single Social Security Entity) that covered the pensions and the EOPYY that covered the population’s health. EOPYY was established in 2011, and the primary mission was to provide health services to active members, pensioners, and family dependents registered to merge healthcare funds. 8 A standard package of healthcare services, under EOPYY, replaced the benefits packages of the various social health insurance (SHI) funds. 7 In 2014, EOPYY became the leading purchaser of medicines and healthcare services for the insured, thus increasing the bargaining power against the providers. Participation in social security is mandatory for all employees and covers also their family members.
Financing of the healthcare system is through a mix of public and private resources. According to OECD (Figure 1), health expenditure in Greece was 5.5% of the gross domestic product (GDP) in 1988, under the Euro Area average (6.4%). Afterward, there was a significant increase in expenditure and in 1993 they exceeded the European average. Until 2012, Greek health expenditures remained above the European average; while in 2010, they reached the maximum value (9.5% of GDP). Due to the economic crisis and financial adjustment programs, expenditures were reduced. In 2019, expenditure fell by one fifth since 2008, at 7.8% of GDP.

Greece and Euro Area Health expenditures (% gross domestic product) 1988–2019
In the first Greek economic adjustment program, a public expenditure upper boundary, of 6% of GDP, was set and still applies. State funding on health arises from taxes and was less than 3% of GDP, in 2019. About the same was the funding from EOPPY. In 2019, Greece had the second-lowest share of public expenditure on health, after Cyprus, in the European Union (E.U.), only 59.2%, and the remaining 40.8% was made-up from private payments. 9 The latter mainly relies on out-of-pocket (OOP) payments: co-insurance for medicines, direct payments for services not covered by SHI and payments for SHI services bought outside the public system to enhance access and quality. 10
The primary financing source of SHI is the compulsory contributions by employees, employers, self-employees, farmers and the retired, as well as annual subsidies from the state budget. The health insurance contributions for salaried employees are 7.10% of wages, divided into two parts: 6.45% for benefits in kind (2.15% contribution by the insured and 4.30% by the employer) and .65% for cash benefits (.40% is contributed by the insured and .25% by the employer). For the retirees, the contribution rate is 6% of the pension. Self-employed and farmers can choose the rate of their contributions depending on their pension plan.
The SHI system can be described as defined benefits (D.B.), pay as you go (PAYG). In Greece, social security schemes are under the State supervision, increasing political risk. 4 The decisions are taken by politicians tied to their traditional planning horizon (four years).11,12
Literature Review of Models on Insurance Financed Healthcare Systems
Pay-as-you-go funding system represents a social contract between generations. In any given year, current contributors allow their contributions to pay current beneficiaries 13 and create a claim to future contributors’ contributions. No technical reserves, except a limited contingency reserve (buffer fund), accumulate. As Knell 14 mentions, PAYG is a “backwards-looking” system, as people have to shoulder the burden of changes in the size of cohorts determined before they were even born.
Unlike public spending on pensions, which are solely determined by demographic trends and the rules of the pension fund, expenditures on health care are driven by a complex set of interrelated demand and supply side-factors, as: 1. Demographic factors, such as the size and structure of the population;15,16 2. Health factors, such as health status of the population, death-related costs. Seshamani and Gray
17
suggest that health expenditures tend to concentrate in a period immediately preceding death, specifically about 25% of life health expenditures are concentrated in the last year of life.
18
Other authors examine other hypotheses like dynamic equilibrium, expansion of morbidity, and others. Dynamic equilibrium assumes that the morbidity period before death remains unchanged as life expectancy increases.
19
Under the “expansion of morbidity” hypothesis, an increase in life expectancy increases the time spent with illness. The opposite hypothesis is that longevity gains are associated with an increase in healthy life period.
20
3. Economic and social factors, such as national and individual income, healthcare demand elasticity of income, development of new technologies and medical progress. Fogel
21
argued that as nations become richer, people spend a larger share of their income on improving their health. New health technologies improve patients’ treatment’s intenseness, leading to cost-saving;22,23 4. Public policy factors, such as disease prevention policy, insurance schemes. According to Baltagi and Moscone,
24
the healthcare finance system is also a determinant of health expenditures growth.
Changes to the above risk-factors raise serious concerns for the sustainability of the Defined Benefits PAYG system. 25 DB PAYG systems require periodic adjustments to address the risk from demographic, economic and health factors uncertainty. On the other hand, Holzmann 26 claims that parametric reforms, like in contribution rates, lowers the system credibility and associates with reputational risk, which give contributors a reason to avoid paying contributions.
Following health economics literature, there are three most commonly used methodologies for forecasting social health insurance expenditures and revenues:
22
1. Micro-simulation models. These types of models set the individual as the unit of the analysis. They require a large amount of data to effectively assemble a sample that adequately represents the whole population of interest. Future health spending can be forecasted after the simulation of life-course events and the costs associated with related healthcare interventions are incorporated. 2. Macro-level models. These models are the least demanding in terms of data requirements,
27
and they aggregate health expenditures and revenues placed within an economic environment. Econometric regression and extrapolation methods are statistical forecasting methods. 3. Component-based models. These are the most widely used. They stratify individuals into groups based on financing agents, providers, services consumed characteristics. These models demand less data than micro-simulation models.
A subclass of component-based models is the actuarial (or cohort-based) models. According to Cichon et al, 28 actuarial models are a combination of simplified images of natural processes that determine the numerical development of a population (e.g., births, deaths, and migration). They also include images of human behavior (e.g., labor participation) and simplification of financial rules.
Cichon et al presented a framework for the financial modeling in social health insurance, taking into account contributions and expenses using actuarial models. There has been a significant development of the literature on expenditure and the factors that affect it but the contribution side has not had the same development. Skiadas and Skiadas 29 present a number of applications, in various countries, where methods of modeling the factors that affect spending were implemented. Unlike private insurance there have been many publications on health insurance, in recent decades. 30
European Union and its Member States use actuarial models to produce long-term budgetary projections based on population and economic projections under assumptions about health conditions.31-35 The report covers five government expenditure items: pension, education, long-term care, unemployment benefits and healthcare. According to the 2018 revision, public spending on healthcare in Greece will range from 5.8 to 7.4% of GDP, in 2050, depending on the assumptions made about the progress of the health of the elderly.
Proposed Finance Model
In Greece, the insurance reform of 2011 led, first, to the established of EOPYY. Second, EOPYY ceased to be a healthcare provider and remained as the primary health services buyer.
Polyzos et al6,36 proposed the conversion of EOPYY into a Health Insurance Fund. Moving this idea forward, EOPYY, as the only health insurance fund that will manage all public funding, will create and maintain reserves to cover future liabilities to the insured population. The financial flow model proposed can be simply described, with the help of Figure 2.

Proposed model of financial flow within the health system of Greece.
According to the proposal, EOPYY will manage total public funding. The State will participate in EOPYY funding by subsidizing employers’ contributions. The level of funding will estimate as a percentage of salaries, including employee and employer contributions. This policy allows a steady and predictable flow of funding to the system.
Social health insurance system in Greece as a pay-as-you-go (PAYG) system represents social contracts where, in any given year, current contributors allow the use of their contributions to pay current beneficiaries’ benefits. As a result, such social contracts create a claim for current and past contributors to contributions of future contributors. The proper assessment of the financial sustainability of a social security PAYG system by means of its balance sheet should take these claims into account.
The proper methodologies for these systems are open group methodologies. An open group includes all current and future participants of a plan, where the plan is considered to be ongoing into the future, that is, over an extended time horizon. This means that future contributions of current and new participants and their associated benefits are included in order to determine whether current assets and future contributions will be sufficient to pay for all future expenditures. The actuarial liability of the Plan under the open group approach is equal to the present value of future projected expenditures with respect to the current and future Plan participants. The assets of the Plan under this approach are the sum of the present value of future projected contributions of current and future contributors and the Plan’s current assets.
Another important element of the methodology is the length of the projection period. For pension plans the actuarial report should present financial information for at least a 75-year (Canada and USA Pension Plans), but for health insurance plans shorter projection period used, (E.U Aging Report projections regarding public expenditure on health for the next 50-year). In this article, the cash flows are projected over an extended period of 30 years because the economic parameters are exogenous to the model and the medical technology is considered to remain stable.
The proposed measure of whether the system can fulfill its obligations to its contributors is the solvency ratio. The solvency ratio indicator, at time t, is expressed as

The
Main Entries on the Balance Sheet of a Pay-As-You-Go system.
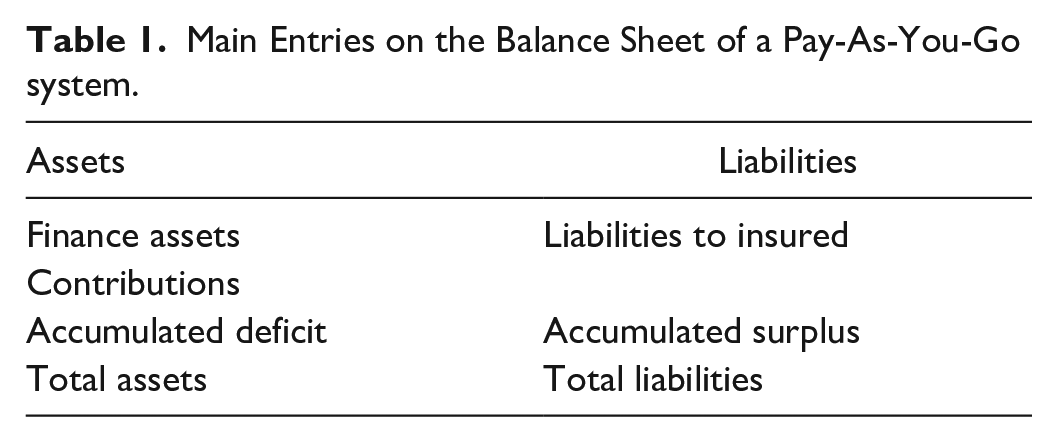
The “financial asset” is the value of the financial assets owned by the Greek health insurance system at the date of the balance sheet. The “liability to insured” is the present value of the amount of all health care expenditures in payment to all insured the next 30 years, considering life expectancy, gender and age-specific health spendings. The accumulated surplus is the “accumulated profit” or net worth of the social insurance system, which is owned by the system’s sponsor, in this case the EOPYY. The system’s annual profit or loss is the difference between the increase in assets and the increase in liabilities during the period. The loss is also identical to the increase in the accumulated deficit or the “accumulated surplus.”
At the date of the estimation, if S.R. is equal or more than one, participants have a realistic expectation of receiving the benefits they expect, as long as the rules of the system, the economic and demographic conditions prevail at the time of valuation following the assumptions. This increases the credibility of the healthcare system from the insured population. If S.R. is less than one, actions must be taken, to give an example by increasing contribution rates or the State having to make periodic contributions. Reassessment is necessary frequently, as solvency is never wholly assured in the long term, as neither the assets nor the liabilities are known in their entirety. 38
The system is solvent if the following mathematical relation holds

alternatively, if the accumulated deficit is nil or negative.
However, if

or the accumulated deficit is positive, then, the system is insolvent.
For health insurance funds, the solvency ratio must be calculated both in the long and the short run. Short-term solvency ensures the ability of the fund to meet the insured population’s needs within the current year. Long-term solvency ensures that the current generation of employees will receive their benefits even when they have retired, without the risk of changing insurance regulations. Both increase the reliability of the health insurance system.
The Methodology of the Research
This work aims to study the solvency of the Greek health insurance system. The study is divided in two distinct parts. The first part examines health insurance and its financing projections under the current environment. In the second part, the State’s required contribution calculates, under the proposed financial flow model, so that the system remains solvent for a long time.
The solvency ratio (S.R.) for Greek SHI system defined as

where


Estimates for the revenue and expenditure of the system are made to achieve the first goal. Following Cichon et al, 18 this section can be divided into the following steps:
Step 1: The demographic and economic framework is determined.
Step 2: Estimation of revenue according to employment and wage assumptions.
Step 3: Estimation of health expenditures, under the assumptions for sex and age-specific health spendings.
Step 4: Calculation of balance sheet and the solvency ratio for each year up to 2050.
For population projection come from the assumption that the fertility and mortality of the Greek population convergence with the average of the EU countries, over a period of 30 years. The convergence was linear. Data came from the base of the United Nations (U.N.).
The economic framework follows the E.U. forecasts for productivity. GDP emerged from productivity and employment using the VAR model, while the percentage of self-employed/employees using the ARIMA model. Health expenditures estimations are done under the assumption of the expansion of morbidity. This assumption assumes that health expenditures per capita, as a percentage of the GDP per capita, remain constant by age group.
Three scenarios were examined, the basic one from the median values of the population, employment, and wage estimations, the optimistic scenario from the upper limits of 95% confidence interval (C.I.) of the estimations and the pessimistic with the lower limits of the estimations accordingly.
An actuarial model was used for a long-term estimate of total health expenditure and contributions. The model is based on the per capita medical expenditure estimated as a percentage of GDP per capita. The formula to estimate the health expenditures by age group is

where
The formula to estimate the contributions is


The proposal concerns the creation of a reserve exclusively to serve the future needs of the insured. Present value of the reserve arises as the present value of the difference between revenue and liabilities each year. The general formula to estimate the reserve at time k, in the continues case, is

where
C(t): public (State and EOPYY) finance to the system at time t,
δt: force of interest at time t,
Ex(t): public health expenditures at time t,
Under the assumption that C (t) follows uniform distribution, equation (6a) becomes

Equation (6b), under the assumption that the interest rate

i (t): discount rate at year t,
To estimate the required State subsidies as a percentage of the salary, at time k = 0, the reserve must be equal to zero. For the estimation of the State subsidies, three restrictions were set: 1. For each year the S.R. is greater than one, 2. The S.R. resulting from the present values of liabilities and income to be greater than the unit, 3. The percentage to meet the above two rules for 10 years for all three scenarios.
Results of the study
Projecting demographic and economic development over the long run is surrounded by a high degree of uncertainty. Demographic determinants are: (1) the fertility rate, (2) the mortality rate, and (3) the level of net migration. The last decade demographic changes have origins to reducing fertility, the increase in life expectancy and the wave of migration, mainly of young people, in the last decade of the economic crisis.
Looking at the birth projections of the E.U., expected life and migration flow, as shown in the Aging Report,31,32,34,35 a deduction emerges of a declining and aging Greek population until 2050. According to the 2018 revision, the alarming demographic findings seem tο extend overtime beyond 2050. From the U.N. and the E.U., the forecasts show a continuous decrease of the Greek population by 2050. In the optimistic scenario the decrease reaches 5%, while in the neutral scenario at 8.6% and in the pessimistic scenario exceeds 18%. Population, in 2050, for the neutral scenario, was estimated in 2009 at 11.4 million, whereas the corresponding forecast in 2018 was 8.9 million.
A shift to the age pyramid follows the population decrease. People aged 65 and over in 2050 are estimated at 34% of the total population, higher than the 22% in 2020. For people over 80 years old, the percentage of 7% in 2020 doubles in 2050.
The estimations of the dependency rate and aging ratio conclude that the system will face significant challenges by 2050. The dependency ratio, that is, retiree ratio to insured, from 1:2 in 2019, will fall to 1:1.4 in 2050. Respectively the aging ratio, the ratio of population 65+ to population 0–14, from .35 in 1960 and 1.5 in 2018, will jump to 2.5 in the neutral demographic scenario. Demographic developments will affect both funding and expenditures of the system.
Employers’ contributions to EOPYY depend on (1) the labor force participation rate, (2) employment rates by sex and age, (3) the wage level for the dependent work and pensions for the pensioners, and (4) the contribution rate. It has been assumed that the contribution rates remain unaltered for all periods.
Looking at labor force participation rates, the entire population was 68.4% in 2019; it rose only .7% since 2010, the first year of the economic crisis decade. This rate is much lower in the 55–64 age group, which reaches 50%, particularly for the women, 34%. 39
The low participation rate of the 55–64 age group is a longstanding labor market problem in Greece. It is primarily due to early retirement from the workforce. 40 The reforms in the Greek pension system that have taken place in recent years aimed to keep employees active longer, especially women. Over the past 10 years in Greece, employment rates were low due to the major economic crisis that has hit the country.
Projections for labor market indicators show a significant increase in the participation rate and employment rates, reaching 77% and 70.5%, respectively, in 2050.
The distribution of workers among employees, self-employed, and farmers is considered stable throughout the study period (Table 2).
Distribution of Workers by Employment Status and Age.

Source. Greek Actuarial Authority. 37
A model of wage relation with GDP was composed. First, the wage elasticity to GDP was estimated by an econometric model using historical data (1990–2019). The assumption of constant elasticity between GDP and wages throughout the study period was taken. In the wage data of 2019 by age and gender, the elasticity was applied. According to the analysis results, the average salary change, for 1% of GDP growth, is 1.23, 95% CI: (1.19, 1.27).
Since 2020, the contribution of self-employed persons to EOPYY has been separated from income related to the pension fund’s contribution. This change effects the solidarity that characterizes Greek social security insurance. There are two categories of health insurance contributions. The benefits are the same for the two categories; the only motivation to pay a premium health insurance is to obtain a higher pension. It has been assumed that the percentages of self-employed who chooses the lowest contribution in the 15–24, 25–54, 55–64 and 65+ age groups, are 100%, 80%, 60%, 44 0%, respectively. The overall percentage of self-employed, which selects the lowest contributions, is 76% of insured persons in 2020 and estimated to reach 73% in 2050.
Finally, the assessment of the contribution of pensioners was based on the projections of pension expenditure. 41 Under the assumptions presented in the previous above, contributions will decrease by about .5% of GDP in the neutral scenario, .6% in the pessimistic scenario and .4% in the optimistic scenario (Figure 3). Even though the optimistic scenario was adopted by the Greek State for women’s participation rates in the labor market, a reduction in health contributions appears in all three scenarios. The original amount of .15% of GDP is reduced to .28%. Similar results are obtained for the self-employed, where the decrease is from .16% to .18% of GDP. Considering retirees’ contributions, the downward trend remains, with a reduction ranging from .08% to .05% of GDP. The reducing of total contributions is about .5% of GDP for all scenarios.

Contributions to EOPYY, (% gross domestic product), 2020–2050
The data from the last 10 years, up to the year 2019, were used to estimate State funding for health insurance. The median value is 2.4% of GDP, and the 95% confidence interval from 2.3% of GDP, to 2.6% of GDP. Private funding has been assessed similarly. The median is 3.1% of GDP, with the 95% confidence interval from 3.02% to 3.2% of GDP. These rates were used to estimate the total funding of the healthcare system in the pessimistic, optimistic, and neutral scenarios.
An actuarial model has been developed to assess health costs. The assumption for the estimation reflects the expansion of the morbidity hypothesis, if age-specific morbidity rates do not change over time. This implies that public age-related healthcare spending per capita remains constant over the projection period. For the neutral scenario, health expenditures were calculated by multiplying the population with the average expenditure per capita (expressed as a percentage of GDP) by age and year. Accordingly, for the optimistic and the pessimistic scenarios the appropriate demographic framework and limits of 95% CI of the average per capita expenditure were used.
Figure 4 presents the results of the analysis for the pessimistic scenario. According to the results, in 2050, health expenditures will be 9.6% of GDP, 33% of total expenditures will be covered from private spending, and the remaining 67% from public funding. Funding is getting increased until 2028, where it is close to 8% of GDP, but then it starts to decline and ends up at 7.8% of GDP in 2050. The contribution rate of employers and employees from 2.35% of GDP in 2020 will be reduced to 1.84% of GDP in 2050. The State participation is falling from 3.68% of GDP in 2020 to 3.20% of GDP in 2050. The system deficits will be risen starting in 2029, from .06% of GDP and will reach 1.8% of GDP in 2050. The projection for funding falls below 8% of GDP and government funding is below 5%. The system’s pressure will lead to either a greater share of private funding in health spending or a reduction to benefits.

Expenditures and Finance estimations (% gross domestic product), 2020–2050 (pessimistic scenario).
The neutral scenario follows the same pattern (Figure 5), with six years less compared to the pessimistic scenario. Health expenditures will exceed 9% of GDP (9.1% of GDP) in 2050, and individual payments will cover 33% of the total expenditures. SHI contributions and taxes have to cover the remaining 67%. Employer’s contribution will reduce from 2.38% of GDP in 2020, to 1.92% of GDP in 2050. State contributions will decline slightly from 3.09% of GDP in 2020, to 3.05% of GDP in 2050. The total funding and the deficit in 2050 will be 8.1% and 1% of GDP, respectively.

Expenditures and Finance estimations (% gross domestic product), 2020–2050 (basic scenario).
In the projections under the optimistic scenario (Figure 6), the system appears sustainable. The deficit will appear in 2045, and in 2050 will be .2% of GDP. Health expenditures estimations are significantly less than the other two scenarios for all the period: 8.6% of GDP in 2050. Funding will increase until 2045, reaching 8.4% of GDP, and remain stable until 2050. The contributions of employers and employees from 2.41% of GDP in 2020 will reduce to 2% of GDP in 2050. State participation will remain stable at 3.19% of GDP.

Expenditures and Finance estimations (% gross domestic product), 2020–2050 (optimistic scenario).
The solvency ratio (Figure 7) for the neutral scenario, decline in value from 1.25, in 2020, to .88, in 2050. Respectively, the pessimistic scenario starts from a value of 1.19, in 2020, and ends in 2050 at .72. For the optimistic scenario, the solvency ratio throughout the period remains above one.

Solvency ratio, 2020–2050, current and proposed models.
To address the deficits, significant resources will be required from the State budget. Two policies can be followed to address these deficits. Τhe former acknowledges the deficits, and covers them as soon as they appear, with additional public and private funding and reduction in the health services provided, the latter addresses them using the mathematical reserve that EOPPY has created. Comparing the additional funding required for the two policies, under the neutral scenario, the latter requires only 11.67% of the funds former. Respectively, the second policy requires 72.75% of the first policies funds for the pessimistic scenario. Following the second policy, the solvency ratio, under the neutral scenario, starts, in 2020, from 1.26 and ends in 2050 at 1.02. For the pessimistic scenario, S.R. starts from 1.37 and ends in 2050 at 1.0.
The proposed model concerns all public funding in the health system managed by EOPYY. State funding is converted into a health insurance subsidy for employees and their protected members. EOPYY maintains part of the state funding to create a reserve, which will ensure the coverage of future liabilities to the insured.
Table 3 presents the government subsidies as a per cent of wages.
Proposed Contributions.

aon the salary.
bon the pension.
con the contributions.
Conclusion
The economic crisis in Greece, which began in 2010 and lasted for 10 years, highlighted the serious structural problems, and challenges the Greek social security system had to face. Both the pension and health insurance funds faced significant deficits.
The reforms that took place during the crisis provided a temporary solution, mainly in the pension sector.
Health insurance in Greece can be considered as one. 7 The reforms focused on creating a new insurance fund and merging all the old insurance funds under it. 8 However, is this social health insurance fund sustainable in the long run? This article wanted to answer this question.
As the factors that affect the cost and revenue of health insurance, the long-term monitoring of the system is critical. Such factors are the population aging, demographic developments, economic growth, and medical technology change. 22 The increase cost should be covered by the insured (with direct payments or through private insurance companies) or by the state budget, or by increasing contributions. All three solutions will have a significant impact on economic development and social cohesion. Taking measures, in time, leads to the requirement of less financial resources.
An actuarial model was created to project future expenses and revenues. Demographic and economic trends were considered, while it was assumed that medical technology remains stable.
The assessment of the health insurance system solvency was based on the ratio (Revenue/Liabilities) calculated for each year, from 2020 to 2050. 4
The results in all three developed scenarios led to deficits, the amount of which and the time point in which they appear depends on how optimistic or pessimistic demographic and economic assumptions were (Figures 4–6). These results are in line with those of the EU.33-35
A new financial flow model proposed to address the deficits (Figure 2). According to this, State funding is transferred to the health insurance fund, in the form of subsidies for employees. The EOPYY will create reserves in order to cover future benefits of the system. This will increase the confidence of the new generations that they will be able to receive health services in the future, without changes in their insurance regulations.
The state subsidies on the employees’ health insurance premium were estimated as percentages of the employees’ wage (Table 3). The proposed flow of funding requires the conversion of EOPYY into an insurance fund and the creation of reserve like private live insurance programs. Apart from these and according to the international experience, 42 it was also proposed: (a) EOPYY to develop supplementary, voluntary, health programs in addition to the basic mandatory health program, such programs can cover the out-of-pocket (OOP) private expenditures; (b) it is important to create a program for long-term care as well as to cover diseases of the elderly; (c) the continuous monitoring of expenditure distribution by age, gender and illness. Proposals (a) and (b) are important because they will activate private insurance companies to create complementary health insurance products.
The Greek health insurance system has a complex financing structure that does not allow the planning of long-term policies. The proposed structure includes the unified management of funding from EOPYY and the possibility of long-term policies. In addition, the use of a sustainability index allows a better assessment of future changes and timely response to challenges.
The proposal has taken elements from policies implemented in other countries but is also a good proposal for the transformation of systems of the same structure as in the case of Greece.
Suggested future research concerns the study of the distribution of health cost per capita, gender and age, according to the big data of EOPYY and also the study of wage distribution. Finally, it would be useful to repeat similar studies at regular time intervals to continuously monitor expenditures and contributions.
Supplemental Material
sj-docx-1-inq-10.1177_00469580221092829 – Supplemental material for Sustainability of Healthcare Financing in Greece: A Relation Between Public and Social Insurance Contributions and Delivery Expenditures
Supplemental material, sj-docx-1-inq-10.1177_00469580221092829 for Sustainability of Healthcare Financing in Greece: A Relation Between Public and Social Insurance Contributions and Delivery Expenditures by George Mavridoglou and Nikolaos Polyzos in INQUIRY: The Journal of Health Care Organization, Provision, and Financing
Footnotes
Declaration of Conflicting Interests
The author(s) declared no potential conflicts of interest with respect to the research, authorship, and/or publication of this article.
Funding
The author(s) received no financial support for the research, authorship, and/or publication of this article.
Supplemental Material
Supplemental material for this article is available online.
References
Supplementary Material
Please find the following supplemental material available below.
For Open Access articles published under a Creative Commons License, all supplemental material carries the same license as the article it is associated with.
For non-Open Access articles published, all supplemental material carries a non-exclusive license, and permission requests for re-use of supplemental material or any part of supplemental material shall be sent directly to the copyright owner as specified in the copyright notice associated with the article.