
Abstract
Ophthalmology is both a procedure driven and high-cost technology intensive area of medicine that commonly treats age related conditions such as cataract and diabetic eye disease which are also some of the most common, high volume, and total dollar billable services in the Medicare program. However, ophthalmologists’ payment and financial viability have a delicate financial relationship tied to Medicare reimbursement. This paper examines inflation-adjusted Medicare reimbursement trends across 6 major ophthalmology subspecialties in both facility (eg, inpatient hospital) and non-facility (eg, private practice) settings, and evaluates the contribution of relative value unit (RVU) component values and Medicare conversion factor (CF) to overall payment erosion from 2003 to 2024 using Medicare physician fee schedule data. Ophthalmology-related common procedural terminology (CPT) codes continuously billed to Medicare were classified by 6 major surgical subspecialties: comprehensive, cornea, glaucoma, oculoplastics, pediatric, and retina. Inflation-adjusted Medicare facility (eg, inpatient hospital) and non-facility prices (eg, private practice) were calculated for each CPT code using the Consumer Price Index. Non-facility reimbursement declined more than facility reimbursement across all procedures (−38.9% vs −33.5%, P < .001). Inflation-adjusted Medicare CF declined by 46.9%, while component RVUs remained relatively stable. Decline in ophthalmology reimbursement is primarily driven by sustained reductions in Medicare CF rather than changes in RVU assignments. Retina experienced the steepest decline, showing greater decline in non-facility than facility settings. Medicare payment reforms may be needed to slow reimbursement decline to sustain ocular care delivery, while preserving the long-term financial viability of the Medicare program.
What is already known about this topic?
Medicare reimbursement for ophthalmologists has been declining, but the extent of cuts across different eye subspecialties and practice settings remains unknown.
We discovered that eye doctors have lost nearly 47% of their Medicare payments after adjusting for inflation since 2003, with private practices suffering significantly worse cuts than hospitals.
Unless Medicare payment reforms reverse this decline, America faces a dangerous shortage of eye care providers, especially as the Medicare program approaches insolvency in 2033.
Introduction
Physician Medicare reimbursement has had minimal growth over the past 2 decades, with inflation-adjusted payment rates declining for numerous specialties, including general surgery, emergency medicine, and otolaryngology.1 -3 This trend has been compounded by federal budget sequestration, the now-repealed Sustainable Growth Rate (SGR) formula, and the Medicare Access and CHIP Reauthorization Act (MACRA)—all of which have either directly reduced payments or frozen rate growth, particularly for procedural specialties. 4 These reductions have far-reaching implications as Medicare rates often serve as a benchmark for Medicaid physician fees (albeit fractionally lower) and are routinely referenced by private insurers in contract negotiations. 5
Reimbursement for physician services under Medicare is based on the Resource-Based Relative Value Scale (RBVS), which assigns each Current Procedural Terminology (CPT) code a total relative value unit (RVU) based on the sum of 3 components: work RVU (wRVU), malpractice RVUs (mRVU), and practice expense RVUs (peRVU). 6 The RVUs are adjusted by the Centers for Medicare and Medicaid (CMS) based on geographic variations in practice costs, as well as the national conversion factor (CF), which is a flat dollar amount set annually by the CMS. The mechanisms guiding annual adjustments to Medicare reimbursement are multifactorial, reflecting policy recommendations from the American Medical Association’s Relative Value Scale Update Committee, Medicare Payment Advisory Committee, and site-of-service cost analyses conducted by the CMS. 7 Medicare wRVUs and mRVUs are identical across different sites of service, but peRVUs differ based on whether the service is performed in a facility setting (eg, in-patient hospital, ambulatory surgical center, emergency room) or a non-facility setting (eg, private practice, urgent care center, rural health clinic) as defined by the CMS. 8 While nearly all CPT codes are assigned a facility price, not all have a corresponding non-facility price, since certain surgical procedures must be performed in facility settings. Given that ophthalmology is a predominantly outpatient specialty with a steady rise in private equity acquisitions 9 and practice consolidation, 10 examining changes in both facility and non-facility prices is critical to understanding physician reimbursement trends across the full range of ophthalmic care delivery.
Inflation-adjusted declines in Medicare reimbursement have been reported for various ophthalmic subspecialties, including glaucoma, 11 oculoplastics, 12 and retina, 13 but without stratification by site of service. These studies highlight the influence of both policy changes, such as the transition from the Sustainable Growth Rate (SGR) to the Quality Payment Program (QPP), and evolving clinical practice patterns on Medicare reimbursement trends. 14 However, there is a dearth of studies that (a) systematically compare inflation-adjusted reimbursement trends across multiple ophthalmology subspecialties over the last 2 decades and (b) integrate facility price, RVU components and the effects of major policy transitions on reimbursement across the breadth of ophthalmic care. These gaps are particularly relevant as the Hospital Insurance (HI) Trust Fund is projected to be insolvent by 2033, 15 raising concern for future reductions to the Medicare CF, RVU components, and physician reimbursement.
The goal of this study is to characterize inflation-adjusted Medicare reimbursement trends across facility and non-facility settings in 6 major ophthalmology subspecialties—comprehensive ophthalmology, cornea, glaucoma, oculoplastics, pediatric ophthalmology, and retina—from 2003 to 2024. This analysis will help identify the primary structural forces driving reimbursement erosion and provide data to inform future policy and advocacy efforts in ophthalmology.
Methods
This retrospective analysis examined Medicare reimbursement trends across ophthalmology subspecialties from 2003 to 2024 using publicly available, de-identified data.
CPT Code Selection & Classification
Ophthalmology CPT codes were identified from the 2022 Medicare Part B National Summary files, which contain aggregate data on allowed services, charges, and total payment amounts for all physician services organized by CPT codes. All CPT codes classified under the “EYE” description category were extracted as the comprehensive list of ophthalmology codes covered by Medicare. From this initial list, only CPT codes present continuously throughout the entire 21-year study period were included in the analysis. While this approach may exclude newer procedures introduced after 2003 or discontinued procedures before 2024, it helped avoid bias from code introduction or discontinuation, ensuring longitudinal consistency. This approach yielded a census of 251 ophthalmology CPT codes representing the complete population of continuously billed procedures. As this study analyzed the complete set of eligible codes rather than a statistical sample requiring inference to a larger population, formal sample size or power calculations were not performed.
All CPT codes were manually classified into ophthalmology subspecialties by the authors. Due to the procedural focus of Medicare reimbursement analysis and the predominance of surgical codes in the dataset, classification was limited to the 6 most surgically oriented ophthalmology subspecialties: comprehensive ophthalmology, oculoplastics, retina, glaucoma, cornea, and pediatric ophthalmology. This classification was supported by recent large-scale analyses of Medicare claims, which use procedural minimums, fellowship training requirements, credentialing guidelines, and expert consensus to define the major surgical subspecialties in ophthalmology. 16 Specifically, Ahmed et al 17 identified cornea, glaucoma, oculoplastics, retina, and strabismus as the primary surgical subspecialties. Our approach focused on subspecialties with substantial procedural volumes that meaningfully contribute to Medicare reimbursement patterns.
Data Collection & Calculations
For each eligible CPT code, the following variables were collected from the CMS Physician Fee Schedules between 2003 and 2024: procedure description, wRVU, peRVU, mRVU, total facility RVU, total non-facility RVU, and conversion factor. Consumer Price Index (CPI) data for January of each corresponding year were obtained from the U.S. Bureau of Labor and Statistics for inflation adjustment. Nominal facility and non-facility prices were calculated as the product of the annual CF and total RVUs applicable to each practice setting. These prices were not adjusted using the Geographic Price Cost Index (GPCI), a regional adjustment factor applied by CMS to account for geographic variation in practice costs, because the primary focus of this analysis was national-level comparisons across subspecialties. Both inflation-adjusted prices and total percent changes for each reimbursement used 2003 as the baseline year and were calculated as:

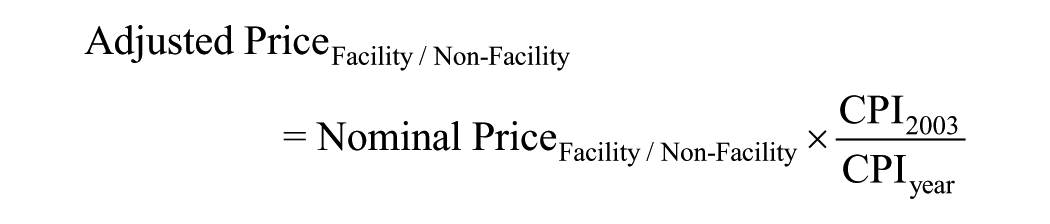

The total percent change formula was applied consistently across all analyses but used in 2 distinct ways. For subspecialty comparison-based analyses, we compared the cumulative percent change in inflation-adjusted facility price between 2003 and 2024 only. For longitudinal trend analyses, we computed the percent change from the 2003 baseline to each individual year in between 2004 and 2024, generating a time series to examine how change from baseline evolved over the 21-year period. In all cases, values represented total percent change from 2003 and did not reflect average annual growth rates.
Statistical Analyses
The average percent change in inflation-adjusted facility and non-facility prices for each subspecialty was calculated from 2003 to 2024. Dunn’s test for multiple comparisons with Bonferroni correction identified statistical differences between individual subspecialty pairs, excluding overlapping CPT codes from each pairwise comparison. Facility and non-facility price changes were directly compared using paired t-tests for each subspecialty and overall, since the same CPT codes were analyzed in both practice settings. Time series analysis generated running percentage changes for each year using 2003 as baseline, examining trends in inflation-adjusted facility prices, non-facility prices, and individual RVU components. Analysis at the CPT-level provided granular comparison of facility versus non-facility price changes for subspecialty-specific examination. Statistical significance was set at α = .05 for individual comparisons and α = .0033 for Bonferroni-corrected multiple comparisons, with analyses performed using Python (version 3.12).
Results
Each subspecialty’s total price change in nominal facility (eg, inpatient hospital) and non-facility (eg, private practice) prices was plotted from 2003 to 2024 (Figure 1A and B). After adjusting for inflation, all subspecialties experienced substantial cumulative decreases in both facility and non-facility prices (Figure 1C and D). Non-facility reimbursement declined more than facility reimbursement across all procedures (−38.9% vs −33.5%, P < .001; Table 1). Among individual subspecialties, oculoplastics (−39.6% vs −29.3%, P < .001) and retina (−47.6% vs −44.3%, P = .014) demonstrated significantly steeper declines in non-facility prices than facility prices (Table 1). In multiple pairwise comparisons between subspecialties, no significant sub-specialty level differences were observed in the non-facility setting, but oculoplastics (−29.3%) and retina (−44.3%) differed significantly from each other in the facility setting (Table 2).
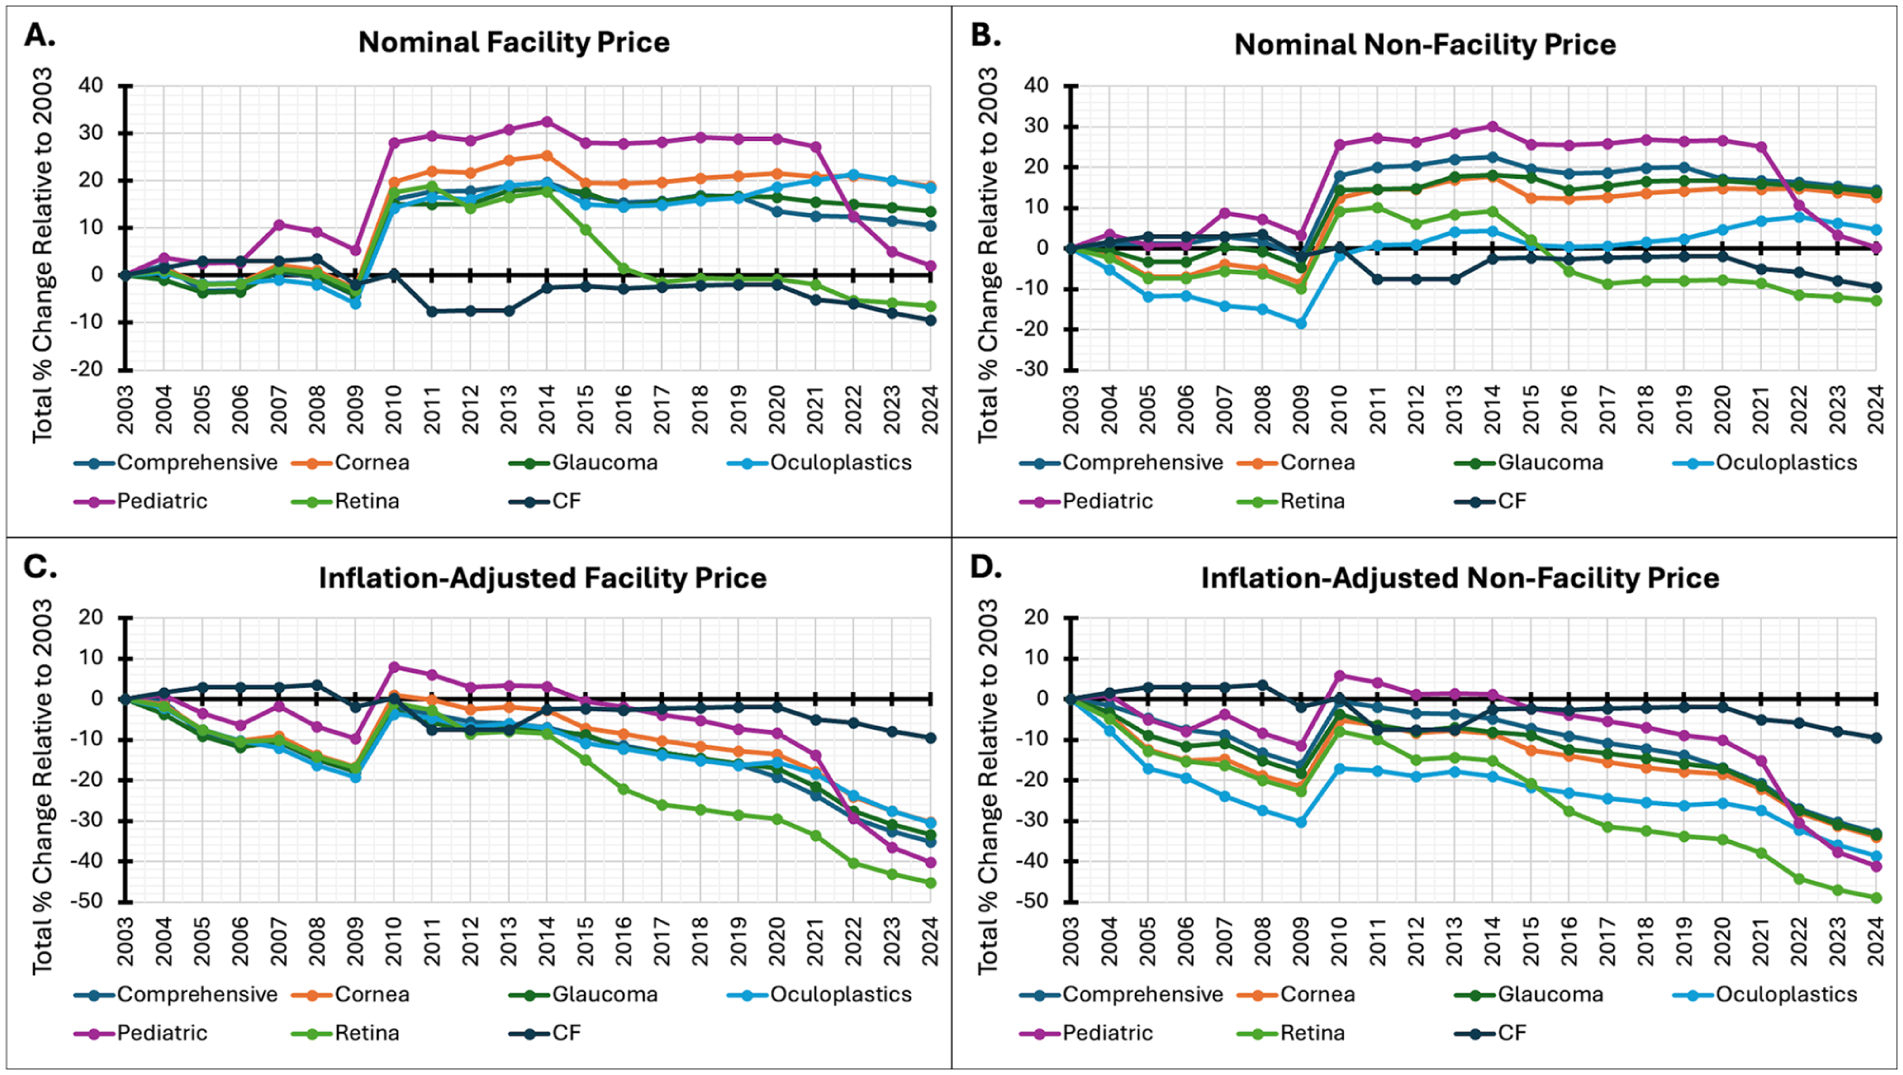
Changes in Medicare Reimbursement Rates in Ophthalmology, 2003 to 2024. Legend: Cumulative percent change in Medicare reimbursement for ophthalmology subspecialties from 2003 to 2024, stratified by: (A) nominal facility price (B) nominal non-facility price (C) inflation-adjusted facility price, and (D) inflation-adjusted non-facility price.
Inflation-Adjusted Facility vs Non-Facility Price Changes by Subspecialty, 2003 to 2024.

Note. Data presented as mean ± standard deviation of cumulative percent change from 2003 to 2024. P-values calculated using paired t-tests comparing inflation-adjusted facility and non-facility price changes for the same CPT codes within each subspecialty over the 21-year study period.
Multiple Pairwise Comparisons by Subspecialty.
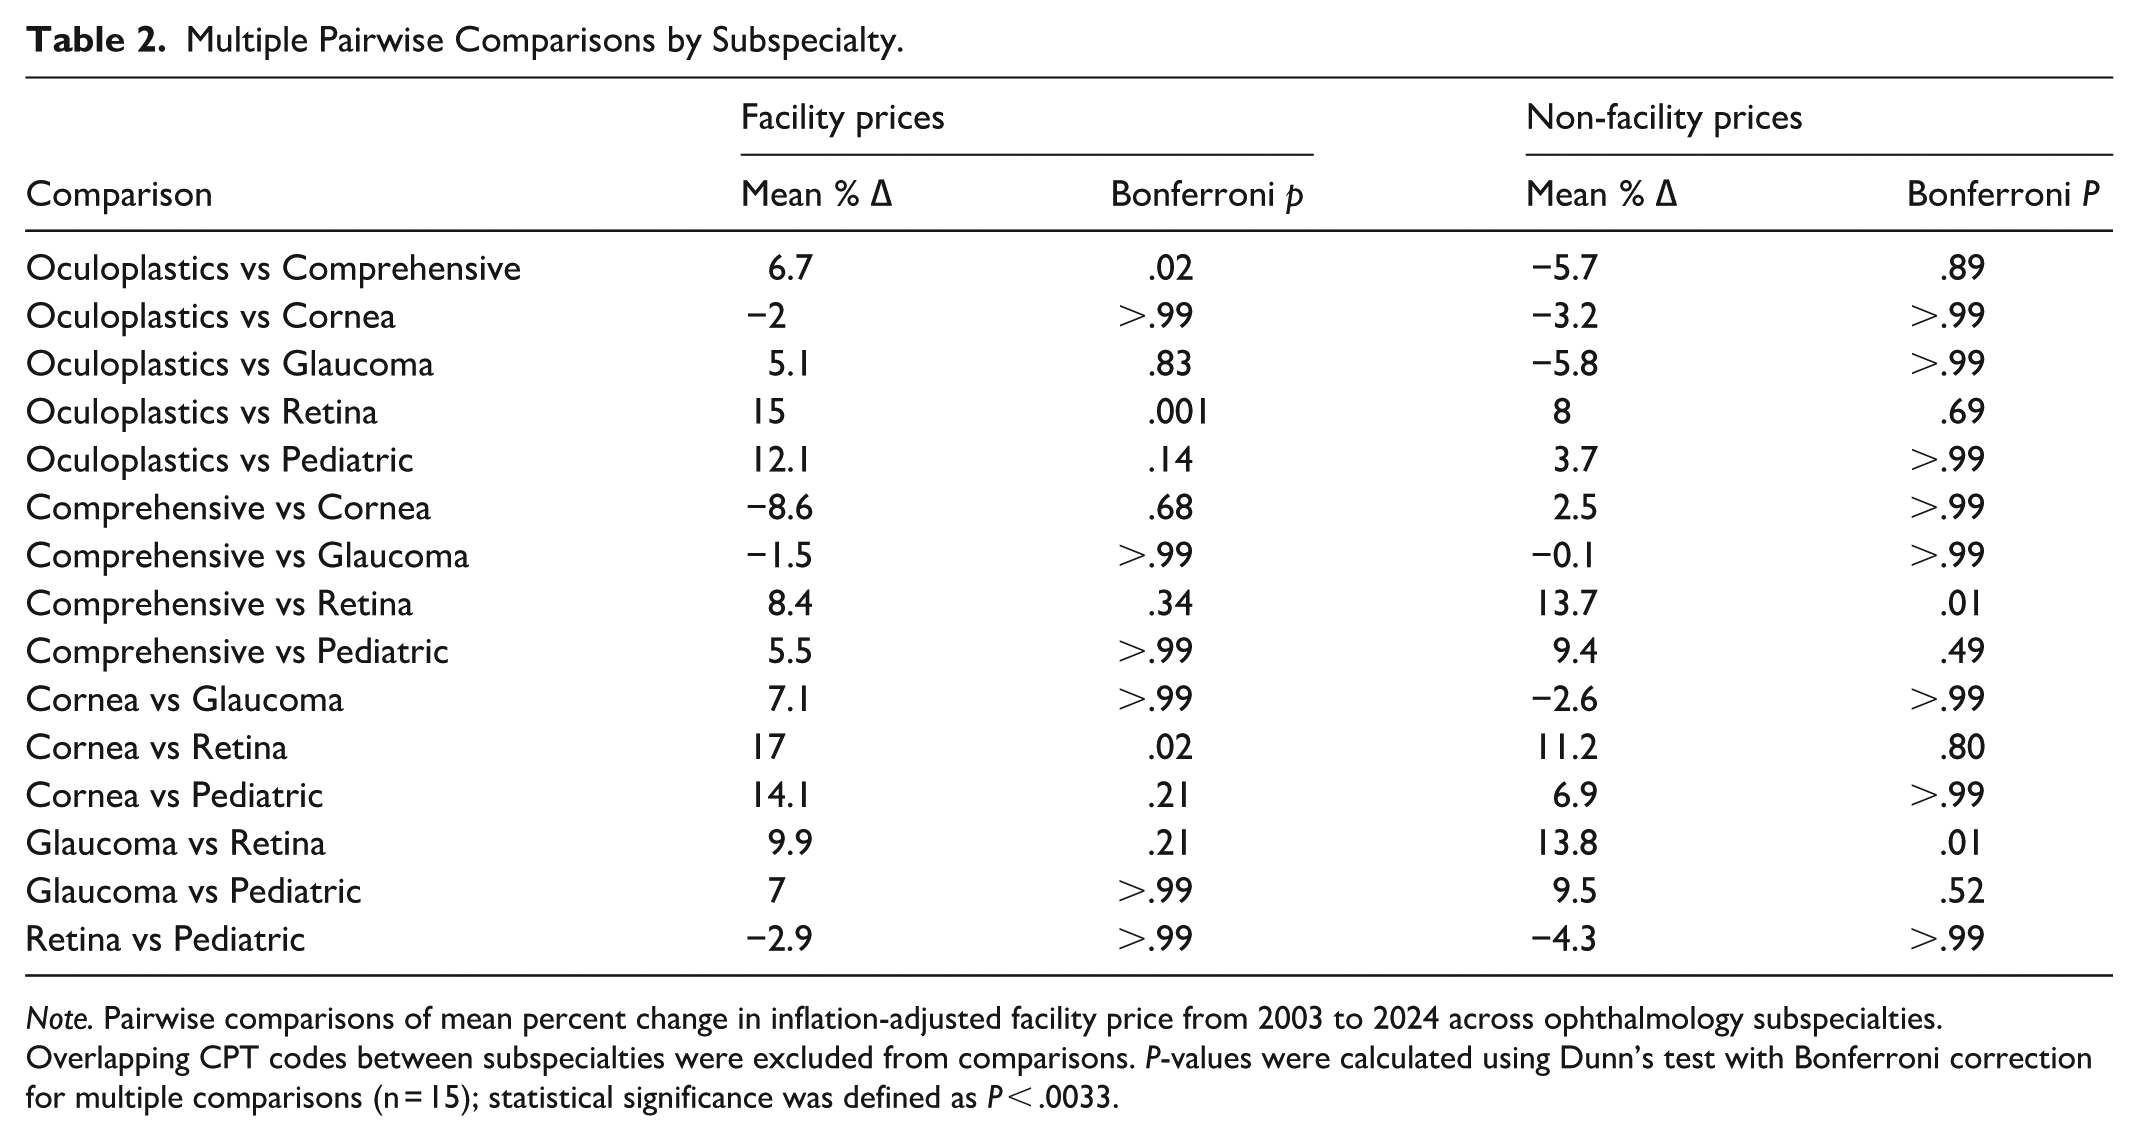
Note. Pairwise comparisons of mean percent change in inflation-adjusted facility price from 2003 to 2024 across ophthalmology subspecialties. Overlapping CPT codes between subspecialties were excluded from comparisons. P-values were calculated using Dunn’s test with Bonferroni correction for multiple comparisons (n = 15); statistical significance was defined as P < .0033.
Unadjusted Medicare CF declined from $36.79 in 2003 to $33.29 in 2024 (−9.5%), while inflation-adjusted Medicare CF declined to $19.52 (−46.9%; Table 3). Medicare wRVUs increased sharply across all subspecialties in 2007 and remained relatively stable through 2024, with modest declines in retina and pediatric ophthalmology and late-period stability in most others (Figure 2A). Medicare mRVUs followed a distinct pattern, with a uniform increase between 2009 and 2011, a system-wide reduction in 2016, and stability thereafter (Figure 2B). Both facility and non-facility Medicare peRVUs declined from 2003 to 2008, rose through 2011, and fluctuated minimally since 2014 (Figure 2C and D).
CF Change.
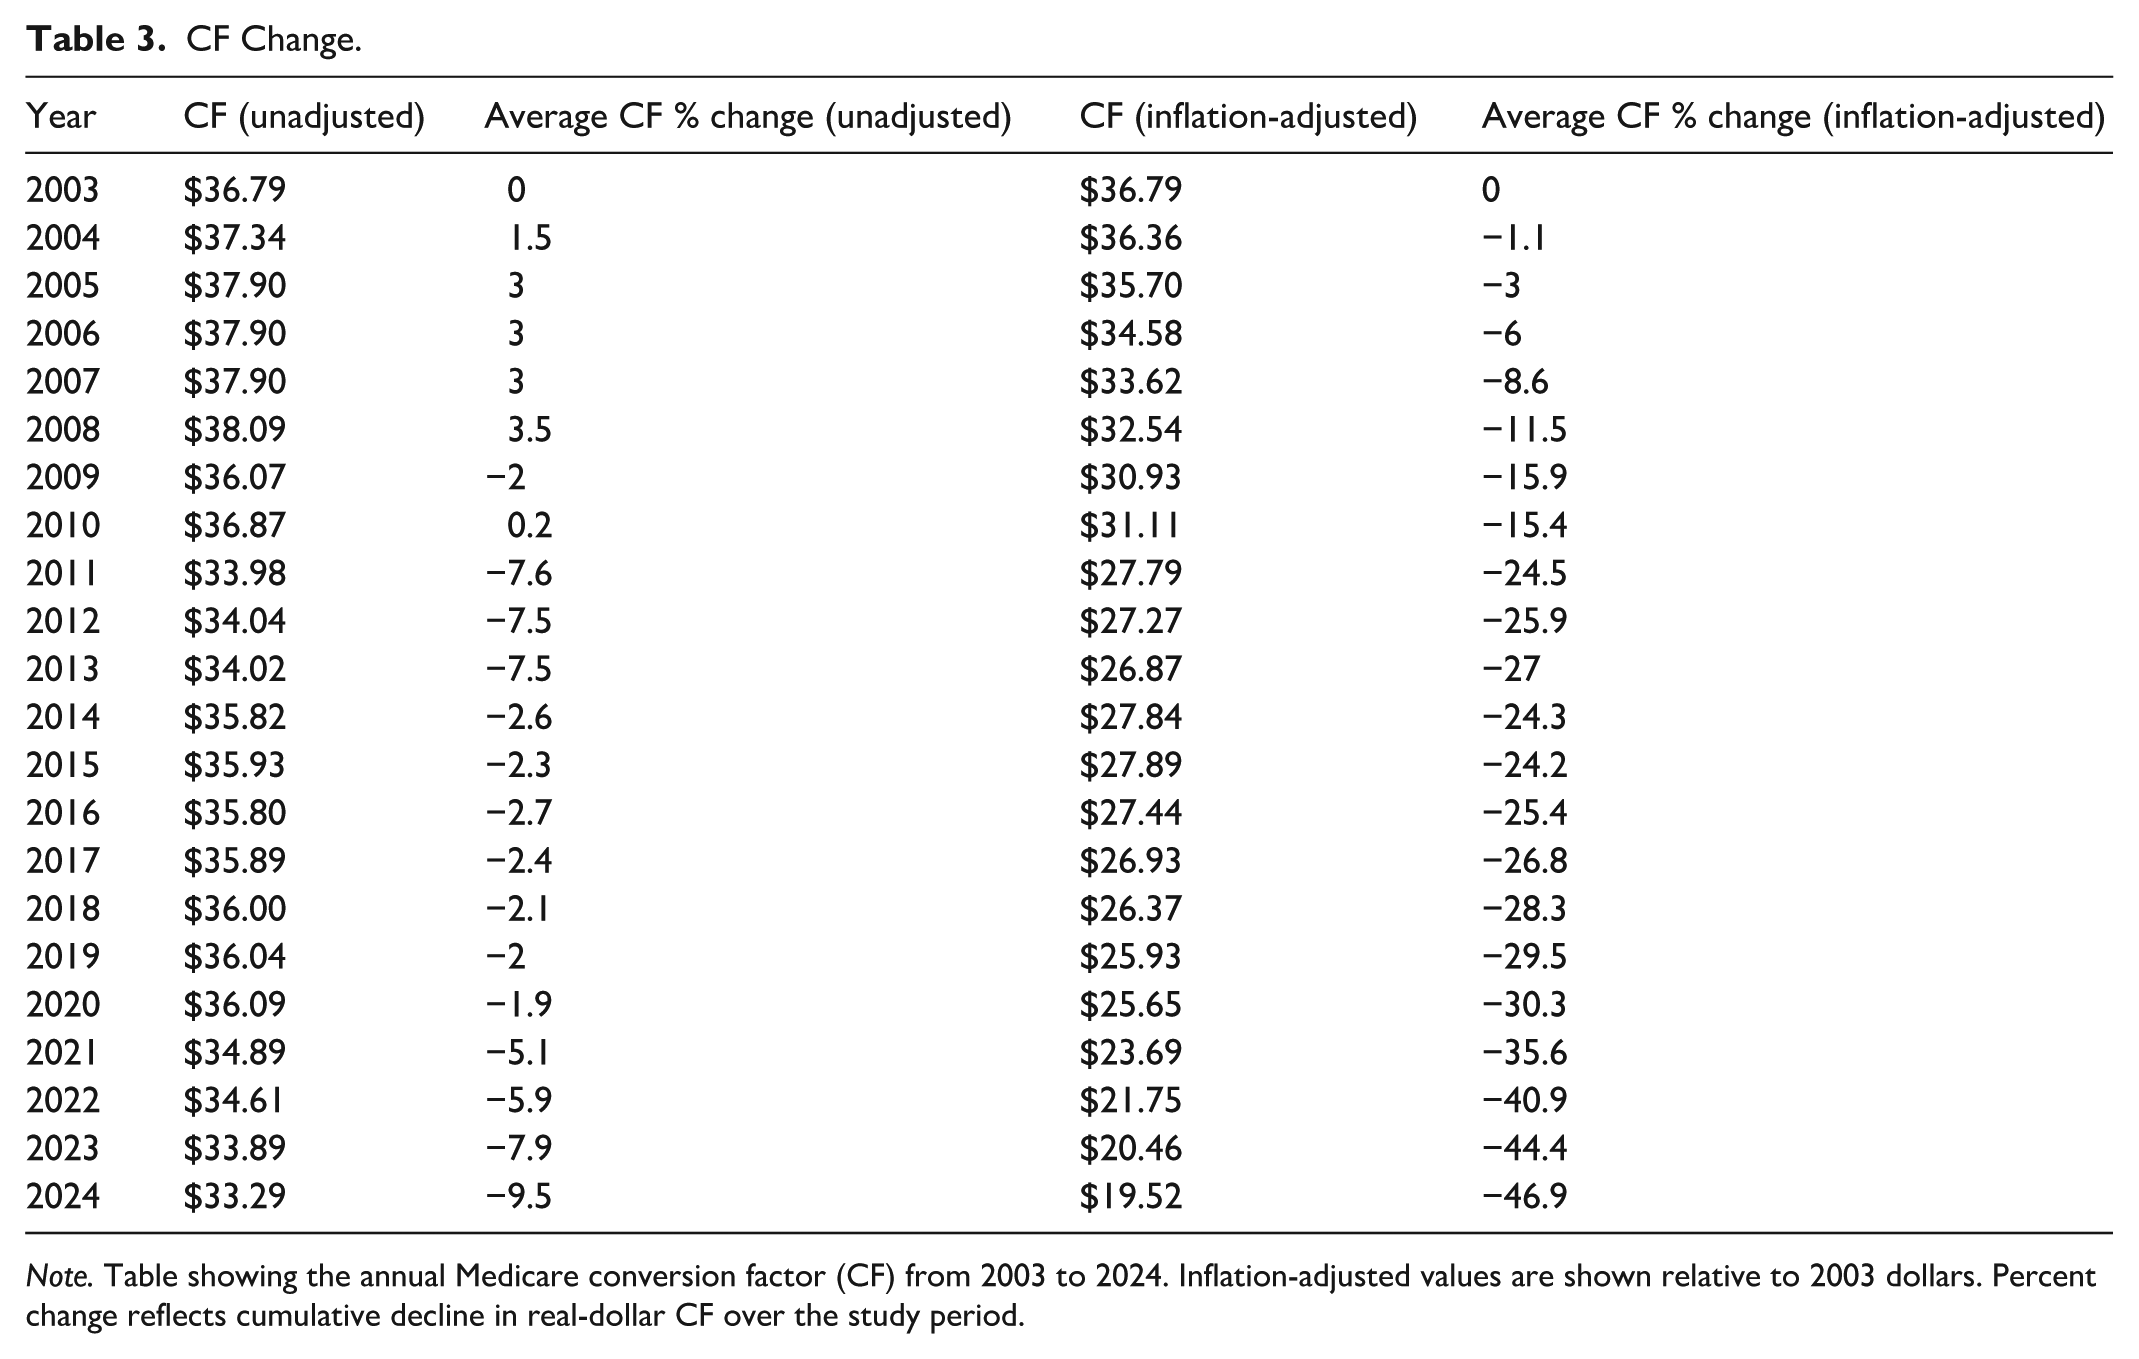
Note. Table showing the annual Medicare conversion factor (CF) from 2003 to 2024. Inflation-adjusted values are shown relative to 2003 dollars. Percent change reflects cumulative decline in real-dollar CF over the study period.

Changes in component RVUs in ophthalmology, 2003 to 2024. Legend: Cumulative percent change in Medicare component relative value units (RVUs) for ophthalmic subspecialties from 2003 to 2024, stratified by: (A) work RVUs (wRVU) (B) malpractice RVUs (mRVU) (C) facility practice expense RVU (Facility peRVU), and (D) non-facility practice expense RVUs (non-facility peRVU).
For individual procedures, several high-volume ophthalmic services experienced substantially greater declines in non-facility reimbursement than in facility reimbursement. This was most evident in removal of foreign body (CPT 65220, −77.3% vs −30.6%) in comprehensive ophthalmology, anterior stromal puncture (CPT 65430, −81.6% vs −28.0%) in cornea, trabeculectomy (CPT 66625, −47.7% vs −43.1%) in glaucoma, probing of nasolacrimal duct (CPT 68440, −80.4% vs +12.1%) in oculoplastics, strabismus surgery (CPT 67345, −48.1% vs −22.9%) in pediatric ophthalmology, and intravitreal injection (CPT 67028, −86.3% vs −62.1%) in retina (Supplemental Table 1).
Discussion
The combined effects of RVU revaluation, CF reductions, and inflation produced substantial, long-term declines in Medicare reimbursement for the 6 ophthalmic subspecialties. These reductions were more pronounced in the non-facility setting and were driven primarily by cuts in Medicare CF, which fell nearly 47% after adjusting for inflation. The impact of these CF-driven reductions was mostly uniform across practice settings in the 6 subspecialties, with retina showing the greatest decrease in facility reimbursement (−44.3%) and non-facility reimbursement (−47.6%). Procedures such as intravitreal injection (CPT 67028), eyelid lesion removal (CPT 67801), and foreign body removal (CPT 65220) exhibited steeper declines in non-facility prices than facility prices, mirroring the trend observed at the subspecialty level.
Previous studies demonstrated reimbursement erosion in individual subspecialties, such as glaucoma, 18 oculoplastics, 12 and retina, 13 but these analyses have been limited by select CPT code ranges,19,20 shorter timeframes,21 -23 and focus on single practice settings (either office or facility only). 23 Our study offers a comprehensive view of Medicare reimbursement trends across 2 decades, 6 subspecialties, and both facility and non-facility practice settings. By linking reimbursement trends observed at the subspecialty level to those at the individual CPT level, this analysis demonstrates that reimbursement erosion is both widespread in nature and structurally driven by reductions in the Medicare CF.
As Medicare CF is applied uniformly to all services and specialties, its decline offers a more compelling structural explanation for the observed trends than periodic revaluations of RVU components, which by comparison, have remained relatively stable. This is consistent with prior studies showing that payment rate adjustments, including reductions in the CF, have been a principal policy lever to slow Medicare spending growth and extend program solvency. 4 For some subspecialties like retina, however, this erosion appears to be compounded by revaluations to individual RVU components, such as wRVU. Indeed, our findings show that wRVU values declined the most for retina procedures over the study period, coinciding with the largest overall decrease in inflation-adjusted facility and non-facility reimbursement (Table 1). Nevertheless, despite more than 2 decades of downward CF adjustments, the HI Trust fund is still projected to reach insolvency by 2033, 15 3 years earlier than previously predicted by the Social Security and Medicare Trustees Reports. 24 While Medicare CF cuts have recently accounted for 44% to 63% of the slowdown in per-beneficiary spending, 4 these measures primarily affect the rate of spending per beneficiary, not the total program expenditure, which are increasingly driven by demographic shifts in life expectancy and the absolute number of enrollees. 25 As the Medicare population ages and grows, the aggregate cost burden rises even if per-beneficiary growth is constrained. Continued reliance on blanket CF reductions may produce short-term savings, but, without structural reform, risks undermining provider participation and the long-term solvency of Medicare.
The consequences of persistent CF-driven payment erosion are multifaceted. Declining reimbursement has accelerated the closure of private practices among U.S. physicians generally. 26 Within ophthalmology specifically, the total number of practices decreased by 18% between 2015 and 2022, accompanied by a growing shift toward larger, often hospital- or private-equity affiliated groups. 10 This corporatization often comes at the expense of physician autonomy, as decision-making shifts from individual providers to administrative stakeholders. Combined with pressure to maintain financial viability by increasing patient volume, these trends contributed to increased rates of burnout,27,28 leading to dissatisfaction and early retirement among ophthalmologists. 28 Of particular concern is non-facility settings, which are the predominant site of ophthalmic care delivery and bear the full burden of overhead costs. 29 As reimbursement continues to erode, practices may limit service offerings and physicians may reduce Medicare participation, raising concern about long-term access to ophthalmic care, particularly for Medicare beneficiaries in underserved or rural regions.30,31
Our findings and the projected 30% shortfall in the ophthalmology workforce by 2035 32 highlight the need for payment reforms that address the structural limitations of the current reimbursement system. The funding for these reforms could come from explicit Congressional appropriations or reallocation of existing Medicare resources. The American College of Physicians has endorsed a policy recognizing certain Part B services that prevent costlier Part A utilization as justification for increased reimbursement. 33 For instance, Part B services like intravitreal injections (CPT 67028) can preserve vision and prevent fall-related injuries, potentially reducing hospitalizations that would otherwise have to be covered by Medicare Part A. Another approach is to correct misvalued services within the Medicare Physician Fee Schedule and use budget-neutral adjustments to better support vulnerable ophthalmic subspecialties. 34 Proposals such as inflation-indexed CF adjustments, site-neutral payments, and hybrid value-based models have also been discussed as potential solutions, but face significant legal, regulatory, and political barriers to implementation. 33
Recent provisions in the 2025 reconciliation bill suggest tentative movement toward structural reforms to the Medicare Physician Fee Schedule: beginning in 2026, the CF may be updated using the Medicare Economic Index (MEI), which better reflects inflation in practice costs. 35 However, the proposed link remains partial—starting at only 75% of MEI growth in 2026 and dropping to 10% thereafter—raising concerns about whether this adjustment will meaningfully counteract long-term payment erosion. The bill also includes a 1-year increase to some Medicare physician payments and is expected to cost the federal government $1.9 billion, 36 further raising concerns about the impact of this reform.
This study has several limitations. First, its analysis was restricted to Medicare Part B fee-for-service claims and did not include commercial insurance or Medicare Advantage, which accounted for approximately 55% of the Medicare market in 2024, potentially limiting generalizability. 37 Second, changes in coding practices, service mix, and clinical guidelines over time may have influenced the findings, though the observed stability of RVU components suggests that these effects are likely modest. Third, no formal sample size or power calculation was performed as this study analyzed the complete census of ophthalmology CPT codes meeting inclusion criteria rather than a statistical sample. While this eliminates sampling bias, it may not capture trends for newer procedures or those discontinued during the study period.
Conclusion
In summary, this study underscores the urgent need for policy intervention to halt the ongoing decline in Medicare reimbursement for ophthalmologists. Future research should focus on payment model reforms that (a) support the field’s financial sustainability, (b) incorporate utilization data to contextualize reimbursement trends by procedural volume, (c) examine downstream effects of reimbursement erosion on patient outcomes, and (d) compare these trends across other procedural specialties.
Supplemental Material
sj-docx-1-inq-10.1177_00469580251399357 – Supplemental material for A Blurry Bottom Line: The Economics of Declining Medicare Payment Trends in Ophthalmology Subspecialties, 2003 to 2024
Supplemental material, sj-docx-1-inq-10.1177_00469580251399357 for A Blurry Bottom Line: The Economics of Declining Medicare Payment Trends in Ophthalmology Subspecialties, 2003 to 2024 by Arjun N. Bhatt, David Brower, Eric Pan, Asim Ahmed, David Fei-Zhang, Kyle Chan, Jessica Minjy Kang, Paul B. Greenberg and Dustin D. French in INQUIRY: The Journal of Health Care Organization, Provision, and Financing
Footnotes
Acknowledgements
None.
Ethical Considerations
Not applicable.
Consent to Participate
Not applicable.
Consent for Publication
Not applicable.
Funding
The authors disclosed receipt of the following financial support for the research, authorship, and/or publication of this article: Supported by a grant from the National Eye Institute 1R01EY034444-01 “Health Disparities in Utilization, Quality, and Outcomes for Three Common Ocular Conditions” (HealthDOC), “Health Equity and Access to Leverage Technology for Improved Diabetic Retinopathy Outcomes” (HEAL-DR) 1R01EY036341-01 and supported by an unrestricted grant from Research to Prevent Blindness, New York, NY.
Declaration of Conflicting Interests
The authors declared no potential conflicts of interest with respect to the research, authorship, and/or publication of this article.
Data Availability Statement
Disclaimer
The views expressed here are those of the authors and do not necessarily reflect the position or policy of the US Department of Veterans Affairs or the US government.
Supplemental Material
Supplemental material for this article is available online.
References
Supplementary Material
Please find the following supplemental material available below.
For Open Access articles published under a Creative Commons License, all supplemental material carries the same license as the article it is associated with.
For non-Open Access articles published, all supplemental material carries a non-exclusive license, and permission requests for re-use of supplemental material or any part of supplemental material shall be sent directly to the copyright owner as specified in the copyright notice associated with the article.