
Abstract
Low levels of neonatal health services utilization and high neonatal deaths are often concentrated among socially and economically disadvantaged groups, especially in low-income countries. Therefore the aim of this study was to assess inequity in the use of neonatal health services in Southwest Ethiopia. A community-based cross-sectional study was conducted in 8 districts located in Jimma Zone, Southwest Ethiopia from 19 March to 28 April 2018. A total of 835 mothers were included in the study with systematic random sampling. Principal component analysis was conducted to develop wealth quintiles of the households. Equity in neonatal health services was measured using rate-ratio, concentration curve, concentration index, and analyzed by binary logistic regression. Neonates from richer families were 1.25 times more likely to use neonatal health services than the poorer households with a concentration index value of 0.07. Neonates from highly educated mothers have better used the services and the corresponding concentration index value of 0.03. Neonatal service utilization was 1.32 times higher in the highest wealth quintile in rural settings. Similarly, services delivered at health posts and hospitals were used 2.4 and 2 times more by the wealthy, whereas services given at health centers are more utilized by the poorest. Outputs of binary logistic regression analysis indicated that neonates from middle quintile wealth households were found to be better neonatal health service users [AOR_1.72, 95% CI: 1.04, 2.82]. Neonate born from a secondary school attended mother [AOR_3.56, 95% CI: 1.90, 6.69] were more likely to use neonatal health services. Neonatal health service utilization in Southwest Ethiopia is more common among neonates from richer households and more educated mothers. There is a big difference among the wealthy and poorer in a rural setting and among those who used health posts. Working on the social-determinants of health will facilitate eliminating inequity.
• Despite the health sector in Ethiopia working tirelessly to assure universal health coverage, evidence in different health indicators like maternal health services indicate that there is a socio-economic based disparity in service use.
• The methodological approaches and the absence of study on neonatal health services make this study of its kinds. The study utilized quantitative methods of equity measure including rate ratio, concentration index, and binary logistic regression analysis. We did disaggregated analysis for residence, and for health facility type. • The findings revealed that, neonatal health services were being utilized more by the wealthiest and most educated portion of the community. Services given at health centers were better used by the poor proportion of the population. Hospital and health post services, however, were better utilized by richer households.
• A collaborative multi sectorial effort should be exerted to eliminate disparities in neonatal health service use. • Since the community health services are the most accessible to the society, the health sector should review their performance, to strengthen services to the poor and vulnerable people in the society.
Introduction
Despite extensive global efforts, neonatal mortality and morbidity remain the major contributor to under-five mortality in the world.1,2 Data from a United Nations International Children’s Emergency Fund (UNICEF) survey indicated that in 2018, more than 2.5 million neonatal deaths were recorded, which accounts for 46.77% of under-five mortality. 3 The major reasons for neonatal death include; intrapartum-related complications like birth asphyxia and breathing problems during birth, preterm birth, pneumonia, infections and birth defects.4,5 Currently, 18 neonates die out of 1000 live births, with most newborns dying from preventable causes. 6 Sub-Saharan Africa (SSA) is the region of the world struggling the most with neonatal health problems. It has the highest rates of neonatal deaths, and progress toward reducing mortality has not been as promising compared to other regions. 7 The region accounts for 40% of the world’s neonatal deaths. 3
Although there are significant challenges observed in the region, remarkable progress has been seen in reducing child mortality in Ethiopia. Between 2005 and 2019, under 5 and infant mortality decreased by about 68% and 34% respectively in Ethiopia. However, the reduction in neonatal mortality has been less marked, with a 9% reduction in the same period. About 30 neonates die per 1000 live births in Ethiopia. 8 This difficulty in reducing neonatal mortality is attributed to both social and health system factors. Problems related to access, quality and equity remain significant. With regards to social factors, there is a concentration of favorable health outcome statistics among economically and socially advantaged groups, especially in less-developed nations such as Ethiopia.9,10 Health service utilization is also highest among the highest economic groups.
Ethiopia is among the least developed countries in the world with a per capita income of US$ 850 according to the World Bank. The economic status and the living standard are almost comparable all over the country. For instance, the poverty rate is between 20 and 27 in almost all of the regions of the country except the 2 city administrations and Harari region. 11 Socio-economic variations contribute to many disparities experienced by different sectors of society. 12
Such disparities in socio-economic status translate into health service inequalities. This is due both to insufficient action by stakeholders to ensure universal health coverage, lack of proactive measures to address the health needs of the poor, and to pro-rich bias in the health system, such as geographical concentration of health services and presence of user fees. 13 In many settings, underutilization of neonatal health services is associated with economic-status, area of residence, level of education, and other demographic variables. For instance, findings from India showed that most actually encountered catastrophic expenditure, and therefore fail to seek and use neonatal health services. 5 The variations in socio-economic status are also major reasons for disparities in adverse child health outcomes and death.6,14 The same results we found in studies conducted in various parts of Ethiopia. Socio-economic disparity is one of the major reasons for differences in health service used and health outcomes.15-18
As one of the principles of primary health care (PHC), equity in health and health services use is a focus in the global discourse on health. 19 The United Nations (UN) has set a goal to minimize the global neonatal deaths to 12 per 1000 live births by the year 2030. Achieving this target will require strong commitment from both service providers as well as financers of the health sector, including government. 20 Among the World Health Organization’s (WHO’s) 6 main focus areas for neonatal health, one is to reduce inequities in accordance with the universal health coverage principles, including addressing the health needs of neonates in fragile and humanitarian settings. 4 Many countries have implemented various programs aimed at minimizing unnecessary disparities in health service utilization. Community-based health services in particular have been found to be effective in minimizing inequities in health status and health service utilization.21,22 For example, Ethiopia’s Health Extension Program, which provides health services at the community level, is widely hailed as an effective strategy for improving health and reducing inequities.
In Ethiopia, there are different types of neonatal health service packages offered both in health facilities and at the community level. Community-based newborn care (CBNC) is a community-based service being delivered mostly by health extension workers (HEWs) based in community-level health posts. 23 On the other hand, integrated management of newborn and childhood illness (IMNCI) and neonatal intensive care units (NICU) are facility-based services delivered at health centers and hospitals.24,25 This study aimed to assess socio-economic differences in neonatal health service utilization measured as receiving services in public health institutions and community service.
Methods
Study Design and Setting
A cross-sectional study was conducted in 8 districts of Jimma Zone from 19 March to 28 April 2018. Jimma zone is located in the Southwestern part of Ethiopia. The capital of the zone, Jimma town is 345 km away from Ethiopia’s capital, Addis Ababa. According to the 2018 population projection there were more than 3.56 million people living in Jimma zone, with males and females being almost in equal proportion. The people living in the area are mostly agrarian. Their income is based on cash crop production like coffee, and cereals being dominant sources of income.
At the time of data collection, there were 6 hospitals (4 primary, 1 general and 1 specialized), 114 health centers and 502 health posts in the zone.
Sampling and Population
The sample population of the study consisted of households who had neonates in the last 12 months preceding the study period. Sample size was determined using a single population proportion formula. Using proportion (p) 50%, confidence level 95% and margin of error 0.05 the calculated sample size was 384. Because we have followed a multi-stage sampling procedure, we multiplied the calculated sample size with a design effect of 2. Considering 10% expected non-response rate, the final calculated and achieved sample size was 853.
As per the suggestion of Tools for Assessing the Operationality of District Health Systems, WHO, we have randomly chosen 8 (40%) from a total of 20 districts in Jimma Zone. 26 Nine kebeles (the smallest administrative unit in Ethiopia) were then selected randomly from each district, which made up a total of 72 kebeles. There were about 10 440 households with neonates in the last 12 months before data collection started. The calculated 853 sample was then proportionally allocated by the number of households (HH) in the respective kebele (Figure 1).
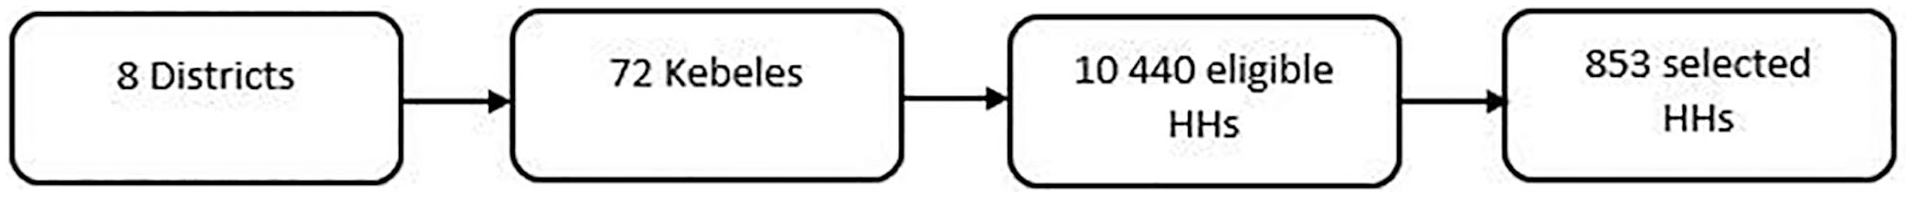
Sampling procedure of the study.
Systematic random sampling was used to select study households. The sampling interval (K) was calculated for each of the kebele by dividing the total households with neonates in 12 months period in each of the kebele by the total allocated sample size to the respective kebele. The first household with an eligible infant was selected by systematic random sampling technique and every Kth household was then included in the study. Prior to data collection, the team used a register available in health posts to identify households that had birth in the year to develop sampling frame.
Data
The tool used for collecting household wealth data was adapted from the Demographic and Health Survey (DHS) program. 27 Other items in the tool were adapted from other relevant literature.14,24,28,29 The data collection tool was then translated to the local language, Afan Oromo, and translated back to English to check consistency.
The data collection tool included different variables like socio-demographic variables; age, place of residence, educational status, ethnicity, religion, and occupation of the respondent (mother); and age and sex of the children. The tool further included 22 wealth index items. It also included a neonatal health service use section consisting of 10 items. Moreover, additional socio-demographic and economic variables were also included in the data collection tool.
Two trained MSc and 5 BSc degree holder nurses collected the data using a paper based interviewer administered questionnaire. Three supervisors have overseen the overall data collection.
Method of Analysis
The collected data were checked for completeness, coded and entered into Epidata version 3.1. The data were then exported to STATA version 14, and cleaned to make it ready for analysis.
Five categories of wealth (quintiles) were developed using principal component analysis (PCA). An Eigen value >1.0 and Varimax rotation assumptions were used to run the analysis. The sampling adequacy was checked, and the Kaiser-Meyer-Olkin (KMO) measure of sampling adequacy was 0.73. This indicated that the sample for this analysis were adequate. The loaded components explain about 54.11% of the items’ variance. Finally, the extracted values were categorized into 5 wealth quintiles, from poorest to richest [Supplemental file I].
Equity of neonatal health service utilization was measured using rate-ratio, concentration curve, and concentration index (C). The percentage re-distribution of health variables was then estimated. The rate-ratio indicates the degree to which the socio-economically better off utilize health services and/or experience health outcomes as compared to socio-economically poorer quintiles. It was computed by dividing the proportion of service users in the highest wealth quintile by the proportion in the bottom wealth quintile. Concentration curves were then plotted considering the cumulative percentage of the neonatal health service use (y-axis) against the cumulative percentage of the population, ranked by wealth and educational level from the lowest to highest (x-axis).
In order to quantify equity differences, concentration index values were computed with respective standard errors and a 95% confidence interval. The concentration index is twice the area between the concentration curve and the line of equality (the 45° line). The concentration index value ranges from −1 to +1. The convention is that the index takes a negative value when the curve lies above the line of equality (the 45° line), indicating disproportionate concentration of the health variable among the poor, and a positive value when it lies below the line of equality. If the health variable, is a “bad” such as ill health, a negative value of the concentration index means ill health is higher among the poor.30,31
The concentration index for t = 1, . . ., T groups was computed in a spreadsheet program using the following formula (Fuller and Lury, 1977) 30 :

We have also estimated the percentage redistribution of health variables (neonatal health services) to ensure equity among the population with different socio-economic status. The concentration index was multiplied by 75 as suggested by Koolman and van Doorslaer.30,32
Furthermore, we analyzed variation in the use of services by binary logistic regression. We fitted both simple and multiple logistic regression models. The independent variables of largest interest were wealth quintile and educational status. In the multiple logistic regression model, we controlled for factors like the mother’s age, marital status, occupation and residence and for sex of the child and distance of health facility from residence. Variables with P-value <.25 at the simple logistic regression analysis were considered candidate to multiple logistic regression analysis [Supplemental file II]. In the multiple logistic regression model, we considered variables with P-value <.05 as significantly associated variables with the outcome. The model fitness was checked, and we found the Hosmer and Lemeshow’s goodness-of-fit test not significant. This indicates the observed model does not significantly differ from the expected model. This eventually depicted, the whole model is fit enough to explain the distribution.
Results
Neonatal Health Services Use
We interviewed 835 respondents. The majority of the respondents were farmers (n = 636 (76.2%)) and living in rural areas (n = 711 (85.15%)). The largest proportion of mothers were not able to read or write (n = 317 (38%)), and a significant proportion (n = 270 (32.3%)) had attended primary school as their highest level of education (Table 1). The majority of respondents were married (n = 780 (93.4%)), and Muslim (n = 716 (85.7%)).
Use of Neonatal Health Services Categorized into Different Socio-Demographic and Economic Variables, Southwest Ethiopia, 2018.
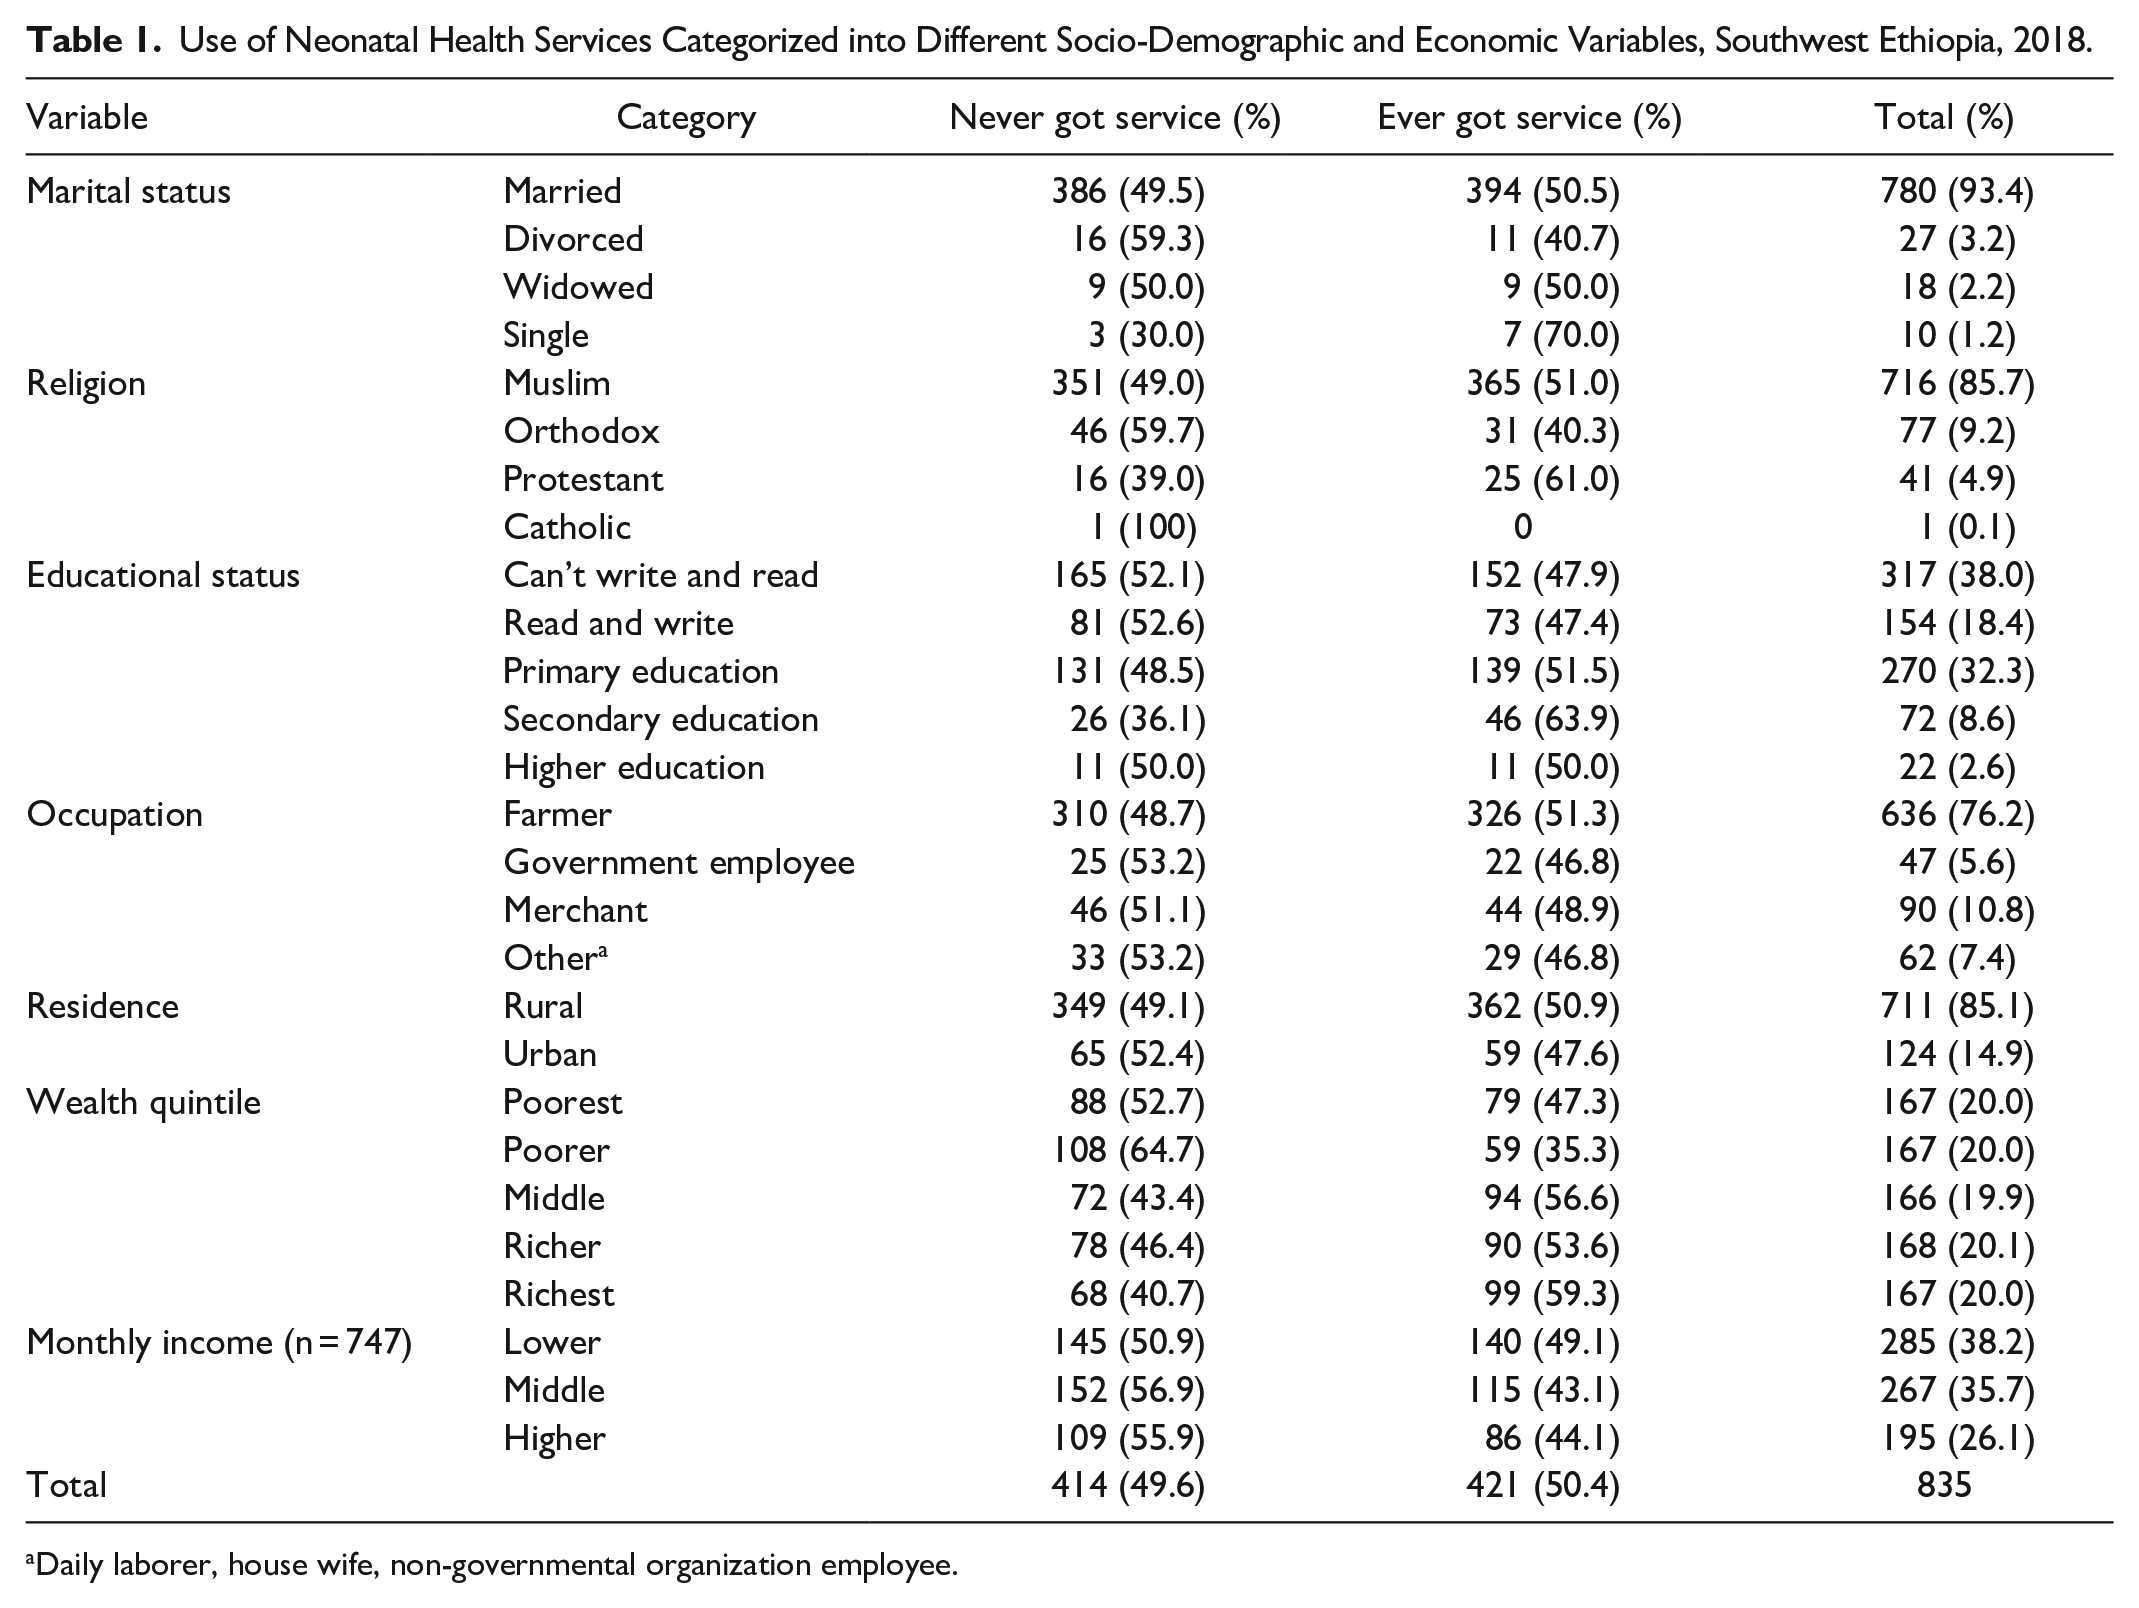
Daily laborer, house wife, non-governmental organization employee.
Among the 835 respondents interviewed, 421 (50.4%) had used at least one type of neonatal health service for their recent child. Out of these, most neonates (n = 356 (84.6%)) received vaccination services, while (n = 56 (13.3%)) received medical services, and (n = 9 (2.1%)) received growth monitoring. Of those who had received services, the majority of respondents reported receiving services for their neonates in health centers (n = 254 (61.4%)) or health posts (n = 157 (37.9%)) and the remaining (n = 10 (2.4%)) have visited hospital for service.
When we look at the wealth status, neonates from middle (n = 94 (56.6%)), richer (n = 90 (53.6%)) and richest (n = 99 (59.3%)) wealth households have used health services at least once. The poorest and poorer on the contrary have relatively low use of neonatal service, 79 (47.3%) and 59 (35.3%) respectively. From those neonates whose mothers were educated above primary education, more than 50% (139) have used neonatal health service. Residents in the rural setting had better health service utilization (n = 362 (50.9%)) as compared to the urban residents (n = 59 (47.6%)).
The proportion of neonatal health service use was 1.33 times higher among secondary level educated mothers as compared to those who cannot read and write. Although rural residents have slightly better neonatal health service use, urban rural neonatal health service use was almost equivalent. Similarly, neonates from richest family have used neonatal health services 1.68 times higher than those from poorer households (Table 1).
Inequity in Neonatal Health Services Use
The comparative results from the concentration curve indicated that, overall, neonatal health service use was pro-rich (Figure 2A). This relationship was more pronounced in rural areas while in urban settings there was no difference among the poor and richer (Figure 2B). When comparisons are made between services, it is services delivered in health posts that have a pro-rich bias while services delivered at health centeres and hospitals were relatively equtably used by neonates from various wealth quintiles (Figure 2C). We have also seen the effect of educational status on equitable use of neonatal health services. The concentration curve give less support for the view that neonatal health service delivered in Southwest Ethiopia favors those children whose mothers have higher educational status (Figure 2D). However, all these relationships will be clearar following the multivariate regression.
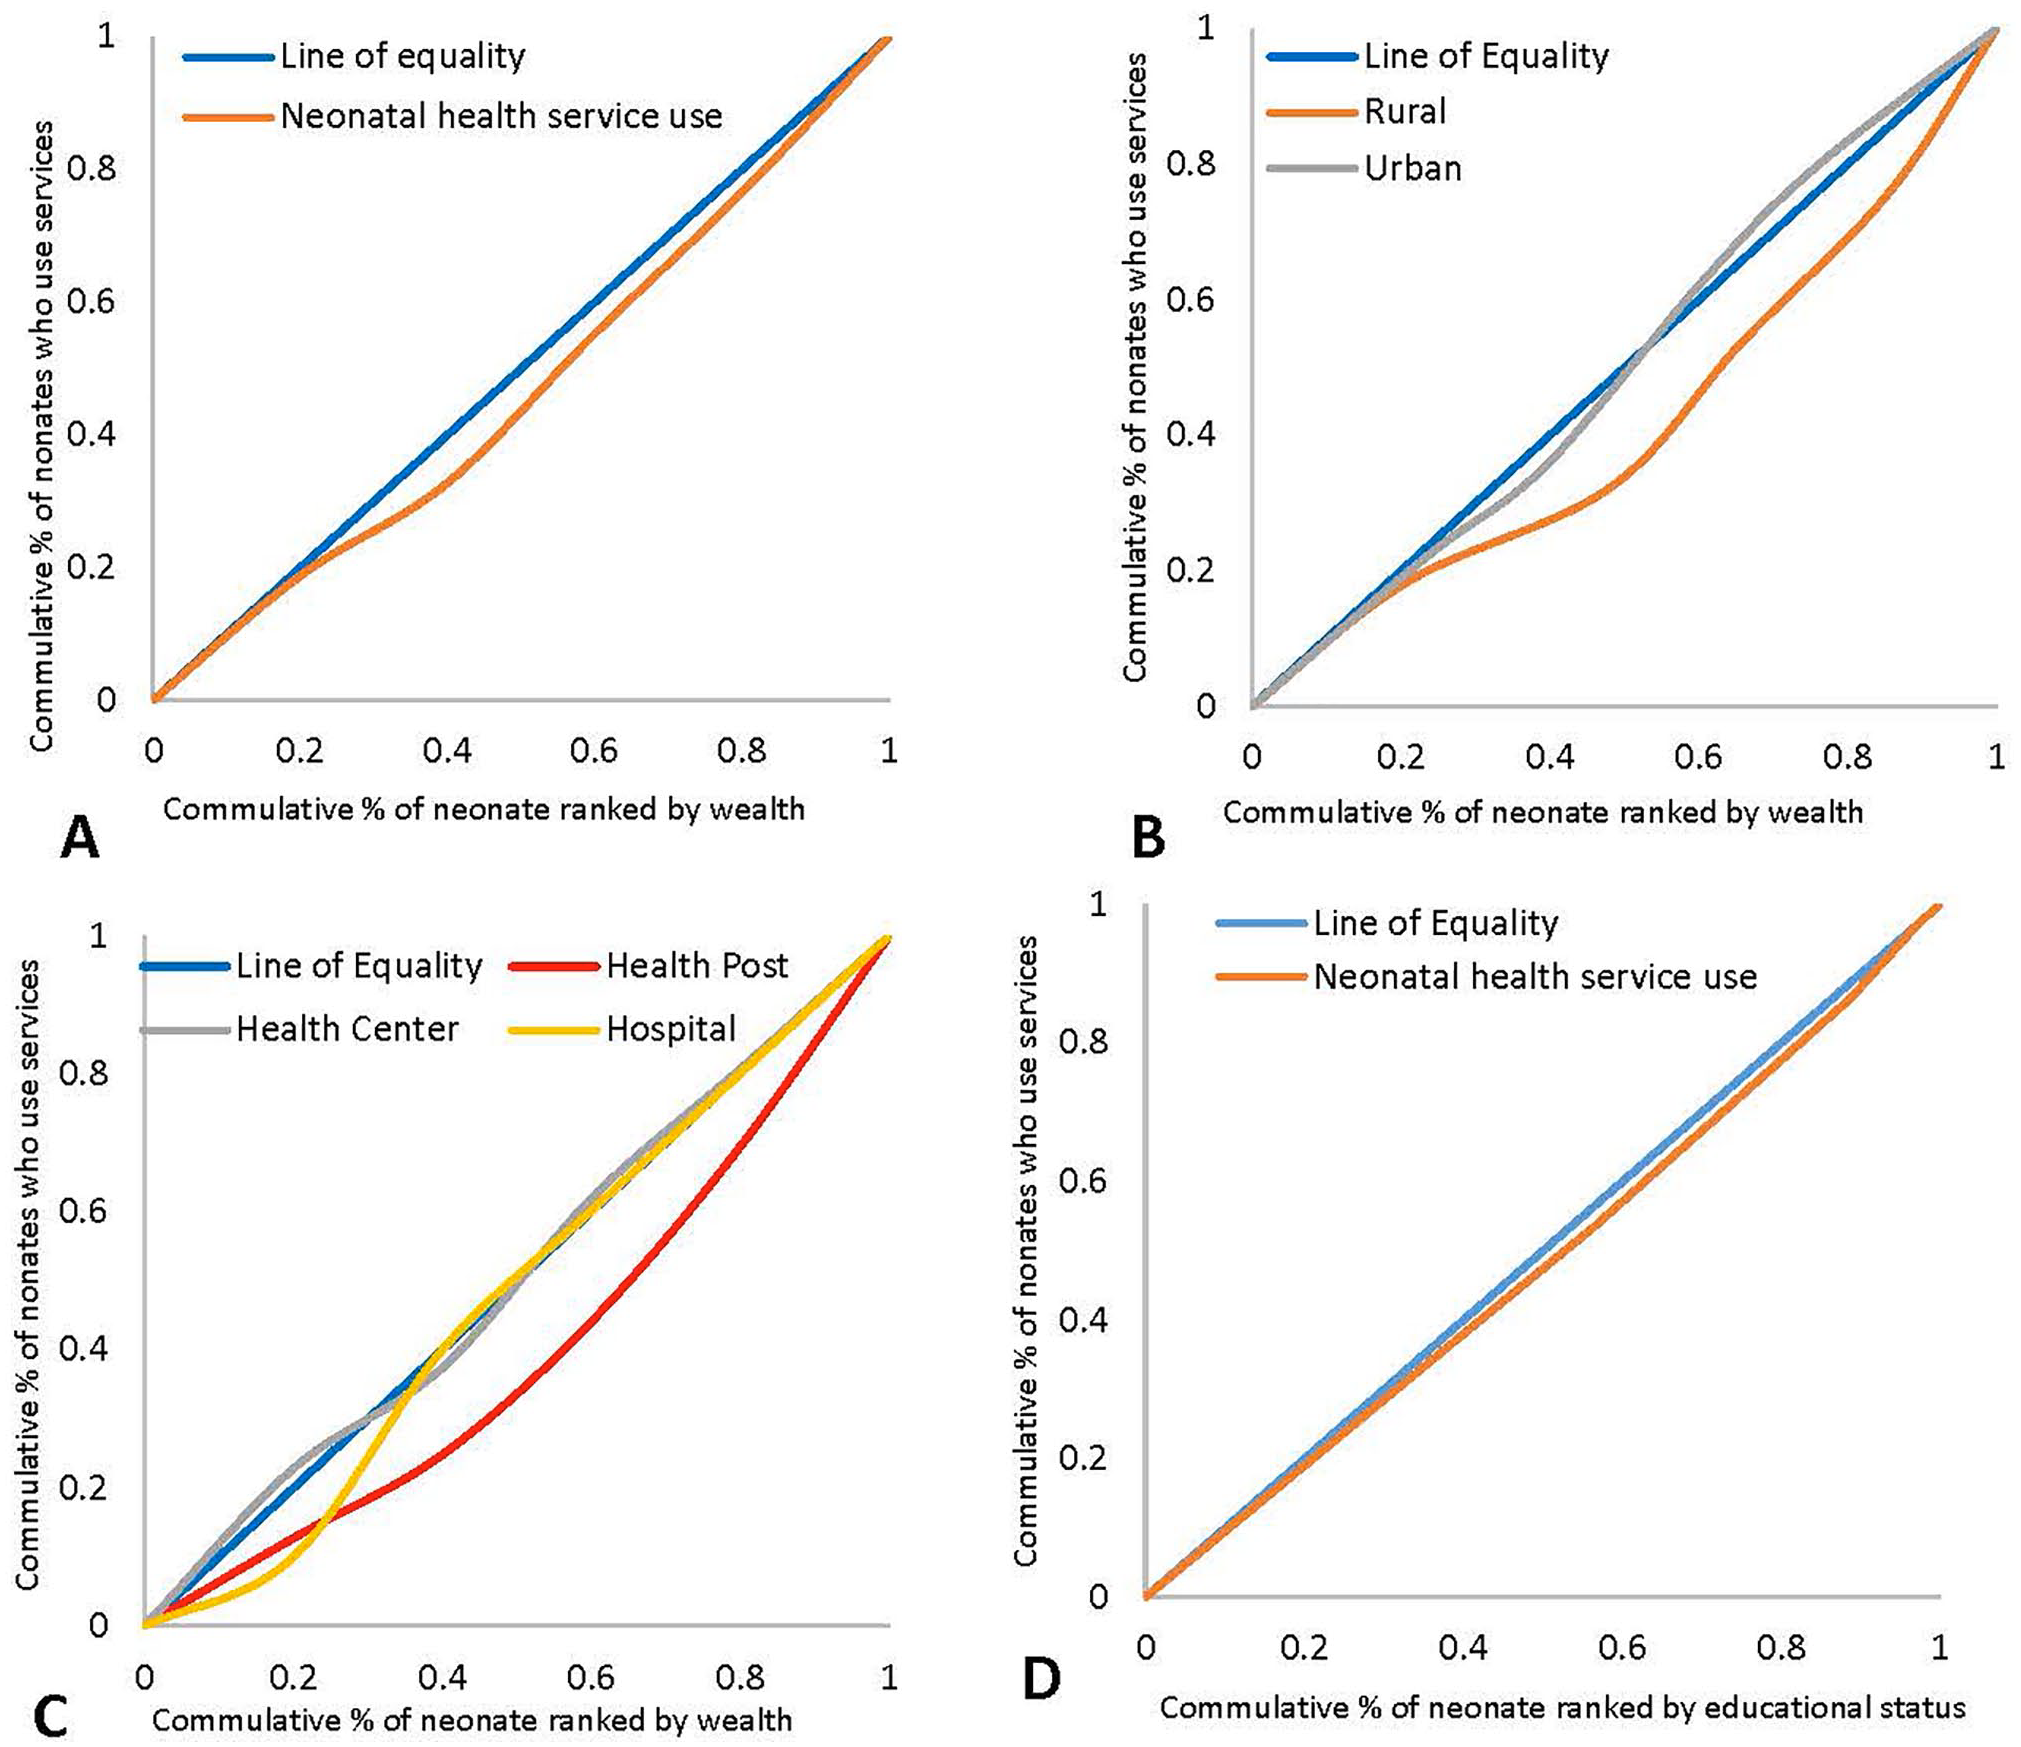
Concentration curve indicating equity differences in neonatal health services utilization, Southwest Ethiopia, 2018.
The rate ratio result indicated, mothers from richer families are 1.25 times more likely to use neonatal health services than mothers from poor families. This was also demonstrated in the concentration index which also indicated neonatal health use as being pro-rich [C = 0.07; 95% CI, 0.02, 0.12]. A 5% redistribution of service to the poor results in equitable distribution of neonatal health services. The equity differences are contrary in urban and rural settings. In the rural setting neonatal health service use was found pro-rich, contrary to the urban residents. Service use in urban areas have no significant difference among different economic quintiles, but little bit favors the poor [Supplemental file III].
Table 2 presents the results from the simple and multiple logistic regression analyses. In the multiple model, we controlled for various socio demographic variables of the mothers and neonates.
The Relationship between Neonatal Health Service Utilization and Equity Parameters, Southwest Ethiopia, 2018.

Note. Hosmer and Lemeshow’s goodness-of-fit test: prob > χ2 = .78.
COR = crude odds ratio; AOR = adjusted odds ratio; CI = confidence interval.
The results indicated that, there is a significant difference on neonatal health service use among households in different wealth quintiles. Those neonates in the middle quintile are more likely to use neonatal health services as compared to the poorest ones [Adjusted odds ratio (AOR) _1.72, 95% CI: 1.04, 2.82]. Similarly, neonates from better off mothers in educational status were found significantly higher service users compared to their counterparts. Neonates from mothers who have completed secondary education [AOR_3.56, 95% CI: 1.90, 6.69] are more likely to use neonatal health services when we compare it to mothers who cannot read and write (Table 2).
We have conducted a separate logistic regression analysis to see the relationship between utilization of neonatal health services and households categorized into wealth quintiles among urban and rural residents. The result showed that in urban setting there is no significant difference of neonatal health service use in different wealth quintiles. Among the rural residents however, the service is highly pro-rich. Richest households are about 2 times more likely to use neonatal health services as compared to the poorest households [AOR_2.00, 95% CI: 1.16, 3.43] (Table 3). The same separate analysis was done for income quantile and educational status of mothers which have indicated relatively similar relationship as indicated in the above multiple regression table. The relationship between neonatal health service utilization and other socio-economic variables among urban and rural residents is included in Supplemental file IV.
The Relationship between Neonatal Health Service Utilization and Wealth Quintile among Urban and Rural Residents, Southwest Ethiopia, 2018.

Discussion
Children under the age of 5 are either victims or beneficiaries of the effect of socio-economic disparities, since they are totally dependent on their families to ensure their health. Children from poor families lag behind those from the better-off in relation to development, morbidity, health service use and mortality. 33 Tackling inequities demands various interventions and the contribution of several stakeholders, both internal and external to the health sector, which should also address the social determinants of health. 13 Recognizing social determinants of health is paramount important in changing the adverse effects of inequity. 34 Aiming to see the effect of socio-economic variables, we have assessed equity in neonatal health service use in Southwestern Ethiopia.
According to studies conducted in different parts of Ethiopia, there are disparities in different health related indicators because of socio economic differences among the population.16-18 The primary neonatal health services being delivered in our study area were vaccination, growth monitoring and medical services. Our assessment highlighted that the richest proportion of the community experience higher rates of neonatal health service use. Especially neonates from the middle wealth quintile household were significantly higher users of neonatal health services. The equity difference is even significantly wider in rural areas. Various other studies conducted in a relatively similar setting have also indicated that use of health services is highest in the highest wealth quintile.29,35,36 This is likely due to the fact that more wealthy households have better economic ability to pay for services. Even if the service is free, as in the case of neonatal health services in Ethiopia, 37 there are additional costs that the poor cannot afford, like transportation, and accommodation when seeking care far from home. The wealthy also often have increased health awareness because they have better access to media and other sources of information, and are also often more educated than the poor. 38 Their better decision making capacity in the society may also contribute to better health and health service use. 39
Our study found that equity gaps are severe in rural setting. The rural dwelling wealthy households were more likely to use service than the rural poor, whereas in the urban areas, neonatal health service actually favors the poor. Community-based health services in many low-income countries target the poor in order to minimize unnecessary disparities between the “haves” and “have nots.”22,25,40 However, according to our findings, there is large inequity in the rural setting where community-based services for neonates are being delivered. The expected and actual result is thus disparate, perhaps because of incapacity of community-based neonatal health services by HEWs to meet one of the major objective, equity. Our study has also demonstrated that, about 6% redistribution of service to the disadvantaged group in the rural setting balances the equity gap.
The other major type of disparity in neonatal health service utilization was type of facility where neonates are served. According to our findings, services delivered in health posts are pro-rich. Neonatal health service uptake in health posts was about 2.4 times higher among the richer portion of the population. Service in health centers, on the contrary, favor the poor. This finding can be seen in relation to the areas of residence of neonates. Our study found that disparities in rural areas are higher than in urban areas. All health posts in the study area are located in rural kebeles and most of health centers are located in urban kebeles. Therefore, the findings are consistent. However, services delivered in hospitals also favored the rich, which aligns with the wealthy being far more likely to use medical services for their neonates, and medical services are offered more from hospitals. However, the use of hospitals for neonatal care in this study was very small, so the association with wealth status should be interpreted cautiously.
Level of mothers’ education was one reason for disparity in using neonatal health services, with a favorable impact of mothers’ education on neonatal health service utilization. Our empirical finding has also supported this information. Neonates of mothers who completed secondary education are about 3 times more likely to use neonatal health services. There are several studies that have shown that maternal education has a positive effect on child health service use and wellbeing.41-43 When educational level increases, it is also expected that the health literacy of an individual increases. Therefore, it is understandable for educated individuals to seek health services at highest rates than those not educated or with a low level of education. Income is also often associated with higher levels of education. Educated people have more employment opportunity and thus have sufficient income for their living, including expenses for health services for their family.
Limitations
We have collected information from mothers based on their history of neonatal health service utilization for up to 1 year preceding the survey. The accuracy of such data may be subject to recall bias. Family folder available with HEWs in health posts was used to develop a sampling frame. The record may rarely be incomplete and miss some households. This may have resulted in exclusion of some households from the study.
Conclusion
The neonatal health service delivered in Southwest Ethiopia favors neonates from rich households and educated mothers in general. The disparities were seen more in rural areas, and in the use of health posts and hospitals. Furthermore, neonatal medical service utilization was highly concentrated among the rich. Health center use, conversely, was concentrated among the poor. These findings vary from previous studies, which have shown targeting community-based services to the poor (such as the Ethiopian model of care in health posts) to be effective.
Understanding the level of inequity helps policy makers to understand the need for intervention and ensure no one is left behind. As one of the major component to guarantee the universal health coverage unnecessary disparities because of socio economic statues need to be addressed with appropriate strategies. Policy and decision makers need to implement pro-poor and pro-rural strategies to improve neonatal health service use and safeguard neonates from adverse health outcomes giving emphasis to the rural setting.
It is not only up to the health sector to invest in minimizing disparities in neonatal health service utilizations. There should also be an effort from other sectors such as education, and job creating sectors. The health sector on the other hand should review the performance of community-based health services so as to strengthen their service to the poor and vulnerable in society.
Supplemental Material
sj-pdf-1-inq-10.1177_00469580211018290 – Supplemental material for Inequitable Utilization of Neonatal Health Services in Southwest Ethiopia: The Effects of Socioeconomic Disparities
Supplemental material, sj-pdf-1-inq-10.1177_00469580211018290 for Inequitable Utilization of Neonatal Health Services in Southwest Ethiopia: The Effects of Socioeconomic Disparities by Kiddus Yitbarek, Sarah Hurlburt, Terje P. Hagen, Melkamu Berhane, Gelila Abraham, Ayinengida Adamu, Gebeyehu Tsega and Mirkuzie Woldie in INQUIRY: The Journal of Health Care Organization, Provision, and Financing
Footnotes
Acknowledgements
We would like to acknowledge Oromia Regional Health Bureau for permitting this study. We are also grateful to all the data collectors, supervisors and respondents to this study.
Authors’ Contributions
KY, MW, GA, AA, GT: initiated and designed the study; KY, GA, AA, MB: Performed the study; KY: Analyzed the data; KY: drafted the report and manuscript; MW, SH, TPH, MB, AA, GT: reviewed the report and manuscript. All authors read and approved the final manuscript.
Declaration of Conflicting Interests
The author(s) declared no potential conflicts of interest with respect to the research, authorship, and/or publication of this article.
Funding
The author(s) disclosed receipt of the following financial support for the research, authorship, and/or publication of this article: Jimma University has funded this study
Ethical Considerations
The proposal of the study was reviewed and approved by the Institutional Review Board (IRB) of Jimma University institute of health. Before data collection, an official letter of support was written to Oromia Regional Health bureau. Moreover, respondents of this study were informed about the study objectives and were assured of the anonymity of their participation. We then obtained verbal informed consent from the study participants.
Availability of Data and Materials
Relevant data used in this analysis can be accessed with a reasonable request to the corresponding author.
Supplemental Material
Supplemental material for this article is available online.
References
Supplementary Material
Please find the following supplemental material available below.
For Open Access articles published under a Creative Commons License, all supplemental material carries the same license as the article it is associated with.
For non-Open Access articles published, all supplemental material carries a non-exclusive license, and permission requests for re-use of supplemental material or any part of supplemental material shall be sent directly to the copyright owner as specified in the copyright notice associated with the article.