
Abstract
The exclusion of employment-based health insurance from income and payroll taxes is thought to increase the generosity of insurance coverage and, in turn, increase the overutilization of low-value health care services. We examine this inefficiency of overinsurance by quantifying the change in expected utility across 4 benchmark plans varying in actuarial value (AV) and focus on the distribution of each of these estimates across different groups of people varying in health status. Specifically, we quantify the changes in health care spending due to moral hazard and the changes in uncertainty tied to risk aversion using data from the nationally representative sample of adults with employment-based coverage from the 2007-2016 Medical Expenditure Panel Survey, and produce estimates of expected utility for 24 groups of people based on their age, gender, and preexisting conditions. Our model suggests an average preferred AV of 78% without the tax exclusion, with 29.0% of the population preferring a 60% AV, 6.5% preferring a 70% AV, 18.1% preferring an 80% AV, and 46.4% preferring a 90% AV. When incorporating the distortionary effect of the employment-based tax exclusion, the preferred plan increases to an 83% AV for low-income people (with 71.0% of the population preferring a 90% AV) and an 84% AV for high-income people (with 76.0% of the population preferring a 90% AV). We estimate that policy changes to make subsidies independent of a plan’s AV could result in increases in utility equal to about 2.7% of total health care spending, but with those net gains concentrated among the healthy.
Keywords
The tax exclusion of employment-based health insurance creates inefficiency through overinsurance.
This article quantifies the extent to which expected utility is affected by overinsurance induced by the tax exclusion, with an emphasis on examining the heterogeneous effects across a range of people varying in their underlying health status.
While reforms to limit the tax exclusion for employment-based insurance could increase aggregate expected utility, people with chronic health conditions could be made worse off.
Introduction
Mark Pauly’s 1968 comment on Kenneth Arrow’s 1963 seminal article on uncertainty in health care markets suggested that the “moral hazard” effect of increased consumption of relatively low-value care due to health insurance lowering the out-of-pocket price of health care introduced an important welfare loss.1,2 Martin Feldstein subsequently considered the extent to which this utility loss from overconsumption of health care resulting from overinsurance exceeded the utility gain from reducing the uncertainty of variation in out-of-pocket spending and concluded that the welfare loss in the United States associated with excess health insurance at that time was perhaps at least 30% of health care expenditures. 3 A follow-on article by Roger Feldman and Bryan Dowd produced an updated estimate of the welfare loss of excess health insurance, with their conclusion that the welfare loss was between 10% and 32% of health care spending among the nonelderly. 4 Willard Manning and Susan Marquis also produced estimates of the utility losses from overconsumption exceeding the utility gains from reducing uncertainty for a range of different insurance plans. 5
We use the general economic framework from these seminal studies to focus on 2 particular issues that were not examined in these articles to further increase our understanding of overinsurance and its policy implications. Specifically, we evaluate the extent to which overinsurance is directly attributable to the employment-based tax exclusion and the heterogeneity of the effects of this overinsurance across groups with varied levels of expected health care spending.
While the above articles focused on the overall effect of overinsurance, here we target the direct impact of the tax exclusion on overinsurance. (A 1977 article by Martin Feldstein and Bernard Friedman did focus on the extent to which the employment-based tax exclusion led to a welfare loss.) 6 This focus on the effects of a specific public policy can help enable policymakers to better focus on the direct implications of potential reforms to the tax treatment of employment-based insurance. We do not, however, consider potential inefficiencies arising from the fact that employees generally select from among only 1 or a few product options preselected by their employer rather than a broader menu such as would be available in a direct-purchase market. Moreover, we do not consider the larger implications of the employment-based tax exclusion outside the scope of the health care system; in particular, the tax revenue not collected by federal and state governments due to this tax exclusion implies that marginal tax rates are higher than they otherwise would be, leading to inefficiencies associated with the deadweight loss of taxation.
With the House of Representatives recently voting to repeal the Affordable Care Act’s “Cadillac Tax,” more formally known as the High-Cost Plan Tax, future policymakers may start considering alternative approaches to reforming the employment-based tax exclusion, such as capping the exclusion at a certain percentile, converting the exclusion to a system of refundable credits, or perhaps eliminating the tax exclusion altogether. Most simulation analyses of such reforms to the employment-based tax exclusion, such as Bradley Herring and Lisa Lentz, 7 the Congressional Budget Office, 8 or Charles Phelps and Stephen Parente, 9 focus on expected changes in health care spending resulting from reform, generally relying on elasticity estimates from the literature, such as Jonathan Gruber and Michael Lettau’s analyses of the association of health plan generosity with the employment-based tax exclusion. 10 In contrast, our analysis presented here expands on those types of simulation analyses by examining changes in expected utility.
The second extension in our analysis presented here, relative to these prior analyses of either overinsurance or the effects of employment-based tax exclusion on health care spending, focuses on the heterogeneity across people in their expected medical spending, as neither the Feldstein article, the Feldman and Dowd article, nor the Manning and Marquis article considered heterogeneous effects across different groups of people. This extension can thus help enable researchers and policymakers concerned with gaining a better understanding of the distribution of changes in utility associated with overinsurance induced by the employment-based tax exclusion (though we focus here on differences in utility across people differing in expected health care spending rather than differences across any number of other dimensions relevant to health insurance and the tax exclusion). We ultimately find that there is considerable variation across people in how they would be impacted by moving to relatively less-generous health plans, and we find that the value of the tax exclusion to workers with employment-based insurance is likely an important determinant of plan choice for a nontrivial number of people. In this sense, our results are tangentially related to the recent literature focusing on the impact of one’s health status on plan choice in the employment-based setting.11-13
Overview of Our Analyses
We model preferences for private health insurance generosity in this article, focusing on both the effect of the employment-based tax exclusion and the variation across people varying in underlying health status. We apply and extend the general methodological approach used by Mark Pauly and Bradley Herring in which an expected utility framework was constructed to simulate the choice of a newly available Health Savings Account coupled with a high-deductible health plan relative to an existing low-deductible plan. 14 Subsequent analyses by Mark Pauly and Bradley Herring used this simulation framework to make projections of the likely take up of individual market insurance with newly available hypothetical tax credit subsidies. 15
In our article here, we evaluate the variation in expected utility of enrollment in each of 4 benchmark plans with varied generosity: a “platinum” plan with a 90% actuarial value (AV), a “gold” plan with an 80% AV, a “silver” plan with a 70% AV, and a “bronze” plan with a 60% AV. (In principle, the employment-based tax exclusion presumably incentivizes increased generosity of health plans on nonfinancial dimensions as well, such as plan quality, provider network breadth, and pharmaceutical formularies, but we do not consider these nonfinancial effects in our analyses presented here.)
For our methodological approach, an estimate of a person’s change in utility from switching to a given health plan is constructed by summing estimates of that plan’s changes in premium, expected out-of-pocket spending, and valuation of risk (ie, the variance in out-of-pocket spending times the Arrow-Pratt absolute risk-aversion coefficient), and then subtracting estimates of the changes in the tax subsidy and consumer surplus from medical care.
One key aspect of this approach is that the overall level of health care spending (and thus an estimate of the “moral hazard” overconsumption effect) will be dependent on the generosity of the health plan through incorporating the price elasticity of medical care. That is, our analysis reflects the fact that the same person will have higher health care spending in a more generous plan than they would in a less generous plan, which enables us, in turn, to quantify the effects of that additional spending on different components of their expected utility. Another key aspect of this approach is that we ultimately compute what level of plan generosity different groups of people would actually prefer (among the 4 benchmark plans), as a function of their underlying expected health care spending.
Specifically, we examine broad groups of people based on their age, gender, and absence/presence of preexisting chronic health conditions and then compute estimates of expected utility based on the underlying distribution of health care spending within groups. We then focus on comparing the range in resulting average expected utility across the 4 benchmark plans, the distribution of expected utility across these 4 plans for these groups of people differing in health status, and the effect of incorporating the tax exclusion’s effects on expected utility and, in turn, one’s preferred plan if given a choice of all 4 benchmark plans. We consider a relatively simple model which assumes away both heterogeneity across people due to varying levels of risk-aversion and heterogeneity across plans due to adverse selection to demonstrate that there is considerable variation in preferences across people linked solely to their expected medical spending.
Methods
To estimate these components of one’s expected utility, we need person-level data for health care expenditures. We use a sample of 42 607 adults between ages 21 and 64 with private employment-based health insurance from the 10 most recent years of the Medical Expenditure Panel Survey’s (MEPS) Household Component (ie, years 2007 through 2016). We inflate spending across all years to be in 2016 dollars and incorporate the MEPS sample weights for our estimates. We categorize people by their age, gender, and health status. The relatively broad categories of people described below are necessary for estimating the variance of out-of-pocket spending across a sufficient number of observations within a given category. For age, we consider 4 categories: ages 21 to 34, 35 to 44, 45 to 54, and 55 to 64.
For health status, we use a detailed set of 15 chronic health conditions to create 3 subcategories for each age/gender group. (These 15 conditions include skin cancer, cancer [other than skin cancer], diabetes, emphysema, high cholesterol, HIV/AIDS, hypertension, heart disease, stroke, arthritis, asthma, gall bladder disease, stomach ulcer, back problems, and mental health conditions.) As people are in the MEPS for a 2-year period, we examine private insurable health care spending in the second year of the survey (for those with employment-based coverage all 12 months of that year) and use conditions collected during the first year of the survey to examine the effect of preexisting health conditions on spending (as opposed to contemporaneous, and thus unforeseeable, health conditions). Specifically, we run 2 relatively standard sets of 2-part models to predict health spending; that is, a logistic regression for any spending and generalized linear model with a gamma distribution and log link for nonzero spending. 16 One set of the 2-part models is based on age, gender, and indicators for each of the 15 chronic health conditions, and the second set of the 2-part models is based on age and gender alone. The reason for running the 2 sets of models is to subsequently create a “risk score” of spending solely due to chronic health conditions comparable to others with the same age and gender.17,18 To do so, predicted spending from the former set of characteristics (ie, age, gender, and the 15 chronic health condition indicators) is divided by the predicted spending from the latter set of characteristics (ie, age and gender), thereby creating a “risk score” index of condition-related expense (ie, spending attributable to chronic health conditions while controlling for age and gender). The index equals 1 for someone in average health relative to others of their same age and gender, is lower for someone in better relative health, and is higher for someone is worse relative health.
We then use this condition-related expense index to create 3 categories for each age/gender group: those with no chronic conditions, those with moderate chronic condition-related expected spending, and those with high chronic condition-related expected spending, where the distinction between the latter 2 is based on being below or above the median index value of about 1.3 for those with at least 1 chronic health condition. Another way to think of these categorizations is grouping people into low, moderate, and high health care spending, given one’s age and gender. For example, a 50-year-old man with none of the 15 chronic conditions would have relatively low levels of expected spending, another 50-year-old man with diabetes might be categorized as having relatively moderate levels of health care spending, and yet another 50-year-old man with diabetes and HIV might be categorized as having relatively high levels of health care spending.
We evaluate all nonelderly adults with employment-based coverage in the 2007-2016 MEPS (with continuous coverage throughout their second year) as if they were insured in single coverage (rather than family) plans. For the purposes of our analyses, this is not problematic, in that observed demographics, health conditions, and health care spending can be directly linked to an individual. That is, although the MEPS is a household survey, it collects this information separately for each person in the household, and our data and measures reflect person-level spending even if that person was enrolled in a family plan. Moreover, as illustrated below, our modeling does not rely on information about the features of the plan in which the person was actually enrolled, so whether one was enrolled in a single or family plan would not impact our results. While modeling expected utility at the household rather than individual level would be feasible, we instead focus on person-level analyses here to more simply illustrate the impact of various policy and plan parameters on expected utility across people with varied attributes.
We use these detailed person-level health care spending data to first generate revised estimates of total health care spending in the 4 benchmark plans identified above (ie, AVs of 90%, 80%, 70%, and 60%). To account for the “moral hazard” effect where a given person is expected to have higher health care spending when they face lower cost sharing, we employ “induction factor” methods developed by the American Academy of Actuaries and subsequently used by Mark Pauly and Bradley Herring.,19,14 Simply put, this method compares one’s actual out-of-pocket spending (observed in the data) to the hypothetical out-of-pocket spending one would have based on their total (insurer-paid plus out-of-pocket) spending in an alternative plan, and then computes a modified total spending estimate for that alternative plan based on this change in out-of-pocket spending. This approach therefore enables us to adjust the distribution of actual health care spending in the MEPS to reflect different plans’ cost-sharing parameters. (We selected the following four sets of cost-sharing parameters [through an iterative process] to generate the four target AVs. Specifically, we constructed a “platinum” 90% AV plan using a $250 deductible, 10% coinsurance, and $1500 out-of-pocket maximum; a “gold” 80% AV plan using a $500 deductible, 20% coinsurance, and $4000 out-of-pocket maximum; a “silver” 70% AV plan using a $1000 deductible, 30% coinsurance, and a $6500 out-of-pocket maximum; and a “bronze” 60% AV plan using a $2000 deductible, 40% coinsurance, and a $9000 out-of-pocket maximum.)
This “induction factor” methodology from the American Academy of Actuaries was developed to produce estimates consistent with the -0.2 elasticity of demand for health care observed from the RAND Health Insurance Experiment. 20 We note that we do not observe (nor do we need to observe) information on the AV of respondents’ actual plans in the MEPS; rather, this “induction factor” method takes the underlying distribution of actual health care spending across all people in the MEPS as given, and then generates estimates of adjusted actual spending for each person across our 4 benchmark plans with varying generosity. In addition, we note that there is no change in spending for those with no spending during the year; that is, people with $0 health care spending in the MEPS continue to have $0 health care spending at every level of plan generosity; this is a limitation to this approach. We then use the new distribution of health care spending for each of the 4 plans to create age/gender/health category-level measures of average total health care spending, average spending covered by the insurer, average out-of-pocket spending by the insured, and the variance of out-of-pocket spending by the insured.
These data for the distribution of actual health care spending (adjusted for each of the 4 benchmark plans varying by generosity of coverage) then enable us to estimate each of the following 5 components of one’s expected utility (in any given plan).
The first component is the total premium paid (again, for each given plan varying by generosity). We assume that the total premium includes both an employer contribution and employee contribution, where that employer contribution to a given individual is independent of plan generosity and thus differences in plan generosity are reflected in differences in the employee contributions to each plan. We assume that employees ultimately pay for the employer contribution to premiums through relatively lower wages, and we present our results in a way that is not dependent on whether the incidence of these employer contributions actually varies by the worker’s age, gender, or health status. As highlighted above, our main objective is to focus on the relatively narrow effect of the generosity of insurance (and distortions in this generosity induced by the tax exclusion) on the tradeoff between moral hazard and uncertainty risk; we do not want to also incorporate incentives for the healthy and sick to gravitate toward separate plans with premiums reflecting the expected medical expense of those actually enrolled. 21 We therefore assume that each of the 4 benchmark plans have employee premium contributions that are risk-adjusted to reflect the underlying generosity of the plans but not any favorable/adverse selection into the different plans; such a risk adjustment scheme appears common among large employers offering multiple plans. Mechanically, we calculate employee-paid premiums for each of these 4 benchmark plans based on the average health care spending of the entire MEPS sample in that plan after applying these induction factor adjustments applicable to the plan generosity (and subtracting off the fixed employer contribution). We also incorporate 15% administrative loading for premiums.
The second component of one’s expected utility is the average out-of-pocket spending, by plan generosity and enrollee category. We calculate this by taking the average of each plan’s out-of-pocket spending across all people in each age/gender/health category; we calculated these averages by group for each of the 4 benchmark plans; thus, the variation in this measure (within a given age/gender/health category) reflects both differences in the generosity of the plan (and thus the share of total spending covered by the plan rather than paid out-of-pocket), as well as the underlying differences in total spending across plans induced via moral hazard by the differing amount of cost sharing.
The third component of one’s expected utility is the valuation of the risk from uncertain out-of-pocket spending; following Roger Feldman and Bryan Dowd’s framework, an estimate of the risk associated with uncertainty can be approximated by one half times the variance of plan out-of-pocket spending times the Arrow-Pratt absolute risk aversion coefficient. 4 We use an estimate of 0.001 for this Arrow-Pratt absolute risk aversion coefficient based on Alma Cohen and Liran Einav’s structural empirical analyses for the choice of deductibles in auto insurance, which is generally comparable to other articles’ empirical estimates for risk aversion. 22 As highlighted above, we purposefully do not incorporate variation across people in risk aversion (which certainly exists), so that the plan-level variation across people in the analyses we present is driven solely by variation in expected health care spending across our age/gender/health categories.
The fourth component of one’s expected utility is the expected consumer surplus from medical spending above what one actually pays for that care. This willingness to pay is assumed to vary by plan (due to the differential health care spending induced via moral hazard across plans with varying generosity) and by enrollee category (due to differential health care spending for people of different age, gender, and health status). While Pauly and Herring’s 2000 analyses assumed that the change in consumer surplus associated with a change in health care spending simply equaled one half of that change in total health care spending, 14 there is no clear consensus in the literature on how to estimate the willingness to pay for health care spending. A lower bound for the last dollar that one spends in a given year is the out-of-pocket price for that care, while presumably the prior dollars one spent indicate that they had some willingness to pay above that actual out-of-pocket price paid (due to downward sloping demand); but knowing the willingness to pay for those earlier dollars is a challenge, and basing it on the out-of-pocket price seems unrealistic in the context of health care. In particular, John Nyman’s research on the “access motive” suggested that very expensive health care services are likely fully valued by patients who would find those treatments otherwise unaffordable in the absence of the insurance plan’s cash transfer to enable their purchase; he estimated a lower bound for the welfare improvement of insurance attributable solely to this “access motive” equal to about 30% of total health care spending. 23 With this in mind, we follow Pauly and Herring’s 2000 analyses by assuming that the consumer surplus from additional health care averages one half of that change in total health care spending (with the thought that the “access motive” for relatively expensive treatments plus the traditional consumer surplus for most other health care is in the neighborhood of this amount). In particular, we assume that the consumer surplus for the reduced health care spending associated with the move from the 90% AV plan to the 70% AV plan is one half of the difference in spending, but that the consumer surplus for changes in health care spending into the 60% AV plan is relatively higher (in proportion to the difference in out-of-pocket prices across those plans) and the consumer surplus for changes in health care spending into the 80% AV plan is relatively lower (again, in proportion to the difference in out-of-pocket prices across the plans).
The fifth component of one’s expected utility is the value of the exclusion of employment-based health insurance premiums from income and payroll taxes. This is assumed to equal one’s effective marginal tax rate times the plan’s total premium, where one’s effective marginal tax rate is based on the combination of federal income marginal tax rate, the employee and employer federal payroll tax rates, and state income tax rates; we assume that the employee premium contribution can be made with pretax dollars under a Section 125 Cafeteria Plan. (We do not incorporate the implicit marginal tax rate of the EITC phase-out or other similar social transfer programs.) We illustrate the effect of the tax exclusion by considering a hypothetical low-income worker and a hypothetical high-income worker. We consider a hypothetical set of low-income workers to be in the 10% federal income tax bracket and face a 2.5% state income tax; incorporating payroll taxes gives an effective marginal tax rate of 25.8%. We consider a second hypothetical set of high-income workers to be in the 24% federal income tax bracket and face a 6% state income tax; incorporating payroll taxes gives an effective marginal tax rate of 42.1%; alternatively, a high-income worker in the 37% federal income tax bracket is over the Social Security cap in income and would have a relatively similar effective marginal tax rate of 41.8%. Similar to our rationale for not considering variation in risk aversion (or the effect of adverse selection), we do not examine further variation in marginal tax rates across people, besides these 2 amounts for low-income versus high-income workers, so that the variation we do observe in expected utility is driven solely by the variation across the age/gender/health categories tied to their expected medical expense.
We then aggregate these 5 different components of expected utility described above into the following 3 main measures for each of the 4 plans: expected utility in the absence of the tax exclusion, expected utility incorporating a hypothetical low-income worker’s tax exclusion, and expected utility incorporating a high-income worker’s tax exclusion. We then compute 3 changes in expected utility associated with switching from the 90% AV “platinum” plan to either the 80% “gold” plan, the 70% “silver” plan, or the 60% “bronze” plan, where the change in utility is in the absence of the tax exclusion, the second change in utility assumes a low-income worker’s tax exclusion, and the third change in utility assume a high-income worker’s tax exclusion. (Having the 90% AV plan represent the status quo for examining subsequent switches to less-generous plans is justified by the next section’s main result that a 90% AV plan is the preferred plan for about three fourths of the population when the tax exclusion is in effect.)
We conclude by indicating which of the 4 benchmark plans would be each age/gender/health category’s preferred plan under the 3 scenarios: no tax exclusion, a low-income tax exclusion, and a high-income tax exclusion. In doing so, we make the relatively strong assumption that people are able to accurately select the plan that maximizes their expected utility and thus not incorporate the potential influence of behavioral economics on health plan choice observed in several recent studies.24-26 For these comparisons of the preferred plans with and without the tax exclusion in effect, we produce an estimate of the change in utility (both in absolute dollars and as a percent of total health care spending) purposefully not adding the actual value of the tax exclusion to the sum of utility. That is, we implicitly assume that one pays an amount of relatively lower taxes equal to the foregone tax exclusion.
Results
Table 1 shows the variation in average total spending, average out-of-pocket spending, and estimated uncertainty risk (derived by the variance in out-of-pocket spending) by both the age/gender/health categories and the 4 benchmark health plans. The first column shows the distribution of these age/gender/health categories across the privately insured nonelderly adult population (eg, 10.4% are males aged 21 to 34 with no chronic health conditions). The bottom row of the table shows the average of these amounts across the full population (eg, out-of-pocket spending in the 90% AV “platinum” plan averages $407 across the full population, but varies from $135 for the youngest males with no chronic conditions to $893 for the oldest females with multiple chronic conditions). As one would expect, spending across the categories of people increases with age and chronic conditions; as the plans’ AVs decrease, total spending decreases (driven by the induction-factor methodology estimating the effect of moral hazard) and both out-of-pocket spending and uncertainty risk increase.
Total Spending, Out-of-Pocket Spending, and Uncertainty Risk by Age/Gender/Health and Plans.

Note. Data for N = 42 067 nonelderly adults with employment-based insurance from the 2007-2016 Medical Expenditure Panel Survey (MEPS) Household Component. Estimates incorporate the survey’s sample weights. For the age/gender/health categories, “few” vs “high” chronic conditions are defined by either below vs above 30% higher-than-average expected spending by age/gender, where expected spending comes from a 2-part regression model. AV = actuarial value; OOP = out-of-pocket spending; CC = chronic conditions; PCT = %.
Table 2’s left-side columns show the expected utility components across these 4 health plans, and the table’s right-side columns show the resulting changes in utility caused by switching from the 90% AV plan to either the 80%, 70%, or 60% AV plan. Consider, for example, the average change in utility from switching from the 90% “platinum” plan to the 80% “gold” plan. The decrease in the premium is $731 (ie, from $4380 to $3649), but this is offset by an average $358 increase in out-of-pocket payments (ie, from $407 to $765), an average $334 increase in the uncertainty risk of out-of-pocket payments, and a $99 loss in consumer surplus from receiving less health care. If one were not affected by the value of the tax subsidy, the change in utility from everyone switching from the 90% AV plan to the 80% AV plan would, on average, be a relatively negligible $59 loss. But instead incorporating either the low-income worker’s $189 reduction in the tax exclusion or the high-income worker’s $308 reduction in the tax exclusion generates an average loss in utility of either $248 or $367, respectively. The average reductions in utility across all groups are even greater for the movement of all people into the “silver” or “bronze” plans. Interestingly, the differences for high-income workers versus low-income workers are not as dramatic as one might expect; this is driven by relatively modest differences in the effective marginal tax rates (eg, 25.8% vs 42.1%) once one incorporates payroll taxes (and, in particular, the cap on Social Security taxes).
Expected Utility Components Across the 4 Plans and the Resulting Changes in Utility From Switching.
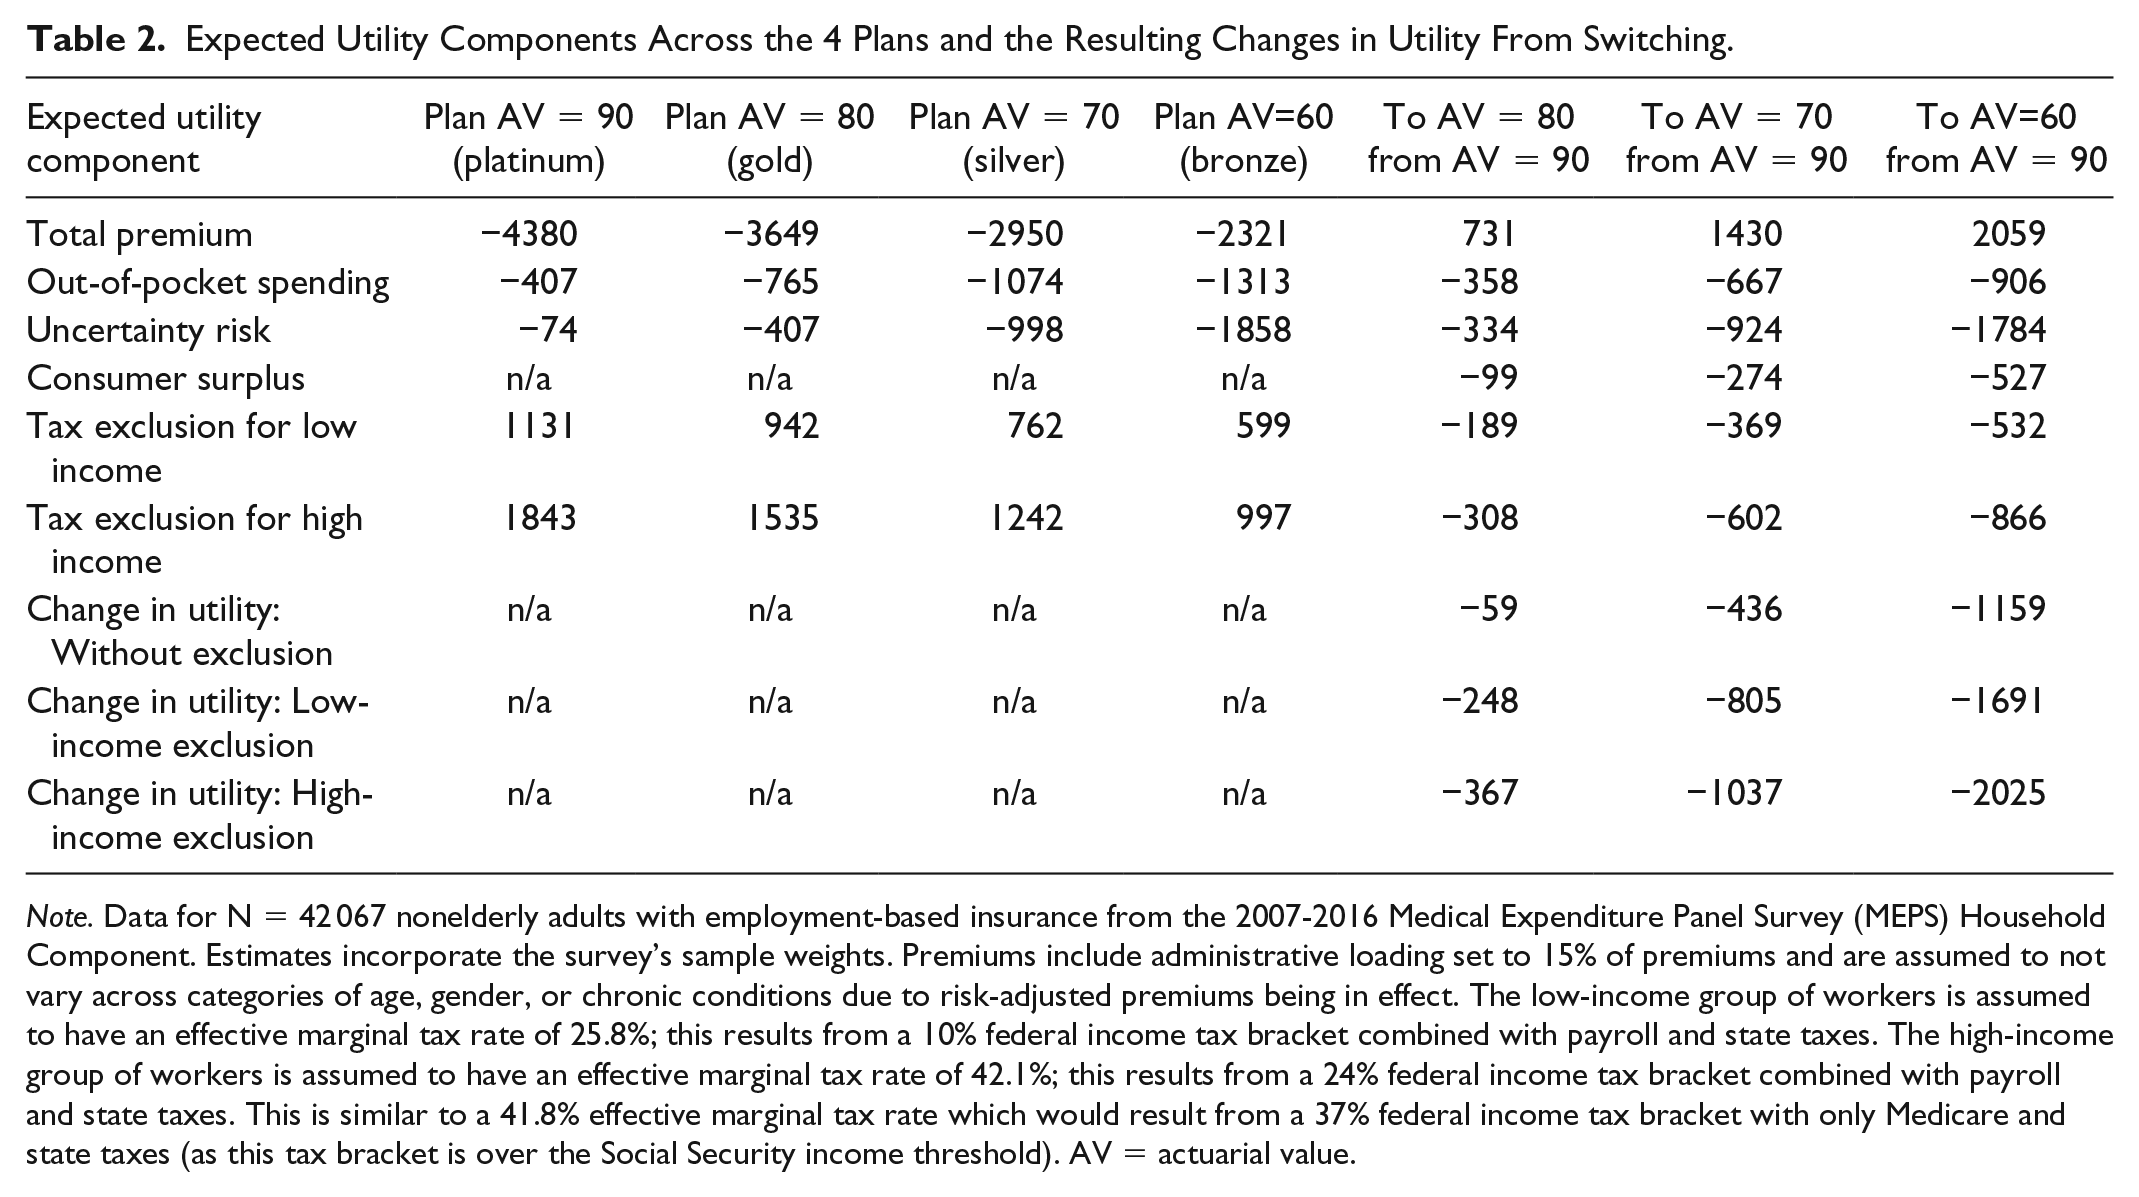
Note. Data for N = 42 067 nonelderly adults with employment-based insurance from the 2007-2016 Medical Expenditure Panel Survey (MEPS) Household Component. Estimates incorporate the survey’s sample weights. Premiums include administrative loading set to 15% of premiums and are assumed to not vary across categories of age, gender, or chronic conditions due to risk-adjusted premiums being in effect. The low-income group of workers is assumed to have an effective marginal tax rate of 25.8%; this results from a 10% federal income tax bracket combined with payroll and state taxes. The high-income group of workers is assumed to have an effective marginal tax rate of 42.1%; this results from a 24% federal income tax bracket combined with payroll and state taxes. This is similar to a 41.8% effective marginal tax rate which would result from a 37% federal income tax bracket with only Medicare and state taxes (as this tax bracket is over the Social Security income threshold). AV = actuarial value.
Table 3, however, indicates that there is sizeable variation across the age/gender/health categories in these changes in utility, suggesting that while not everyone would benefit from switching to a less-generous health plan, many would indeed benefit from switching. For instance, this $59 average loss in utility (when not incorporating the value of the tax exclusion) from switching from the 90% AV plan to the 80% AV plan shown in Table 2 (in its fifth column and seventh row) actually varies from a $529 gain in utility for the youngest males with no chronic conditions to a $1186 loss in utility for the oldest females with multiple chronic conditions (in Table 3’s second column). Similarly, the $367 average loss in utility when incorporating the value of the high-income tax exclusion from switching from the 90% to the 80% AV plan shown in Table 2 (in its fifth column and ninth row) actually varies from a $221 gain in utility for the youngest males with no chronic conditions to a $1494 loss in utility for the oldest females with multiple chronic conditions (in Table 3’s fourth column). Moreover, these gains in utility for these young healthy males are larger in magnitude from switching to the 70% AV plan (compared with switching to the 80% AV plan) and larger still from switching to the 60% AV plan, while these losses for these older sicker females are likewise increasingly larger in magnitude from switching to these less-generous plans.
Changes in Utility From Switching Across the 4 Plans, With and Without the Tax Exclusion.

Note. Data for N = 42 067 nonelderly adults with employment-based insurance from the 2007-2016 Medical Expenditure Panel Survey (MEPS) Household Component. Estimates incorporate the survey’s sample weights. For the age/gender/health categories, “few” vs “high” chronic conditions are defined by either below vs above 30% higher-than-average expected spending by age/gender, where expected spending comes from a 2-part regression model. Premiums include administrative loading set to 15% of premiums and are assumed to not vary across categories of age, gender, or chronic conditions due to risk-adjusted premiums being in effect. The low-income group of workers is assumed to have an effective marginal tax rate of 25.8%, and the high-income group of workers is assumed to have an effective marginal tax rate of 42.1%. See the text for more details. Without the tax exclusion, 29.0% of the population prefer the 60% AV plan, 6.5% prefer the 70% AV plan, 18.1% prefer the 80% AV plan, and 46.4% prefer the 90% AV plan. With the low-income exclusion, 17.8% prefer the 60% AV plan, 6.2% prefer the 70% AV plan, 5.0% prefer the 80% AV plan, and 71.0% prefer the 90% AV plan. With the high-income exclusion, 17.8% prefer the 60% AV plan, none prefer the 70% AV plan, 6.2% prefer the 80% AV plan, and 76.0% prefer the 90% AV plan. AV = actuarial value; ΔU = change in utility; LI = low income; HI = high income; Exc. = tax exclusion; CC = chronic conditions; PCT = %.
The final 3 columns of Table 3 show the preferred plan (if one were constrained to choosing just among these 4 benchmark plans) for each of the age/gender/health categories and for having either no tax exclusion available, a low-income tax exclusion available, or a high-income tax exclusion available. For instance, males aged 21 to 34 with no chronic health conditions prefer the 60% AV plan regardless of whether the tax exclusion is available, while females aged 55 to 64 with multiple chronic conditions prefer the 90% AV plan regardless of whether the tax exclusion is available. However, males aged 55 to 64 with no chronic health conditions, for instance, would prefer the 60% AV plan when receiving no tax exclusion, the 80% AV plan when receiving a low-income tax exclusion, and the 90% AV plan when receiving a high-income tax exclusion. In total, 8 of the 24 age/gender/health categories of people have a preferred plan that is dependent on whether the tax exclusion is available; these 8 categories represent 35.7% of the nonelderly adult population.
Without the tax exclusion in effect, 29.0% of the nonelderly population would prefer the 60% AV plan, 6.5% prefer the 70% AV plan, 18.1% prefer the 80% AV plan, and 46.4% prefer the 90% AV plan. With the low-income exclusion in effect, 17.8% prefer the 60% AV plan, 6.2% prefer the 70% AV plan, 5.0% prefer the 80% AV plan, and 71.0% prefer the 90% AV plan. With the high-income exclusion, 17.8% prefer the 60% AV plan, none prefer the 70% AV plan, 6.2% prefer the 80% AV plan, and 76.0% prefer the 90% AV plan. As shown in the final row of Table 3, the average AV (across the 4 types of available plans) preferred across the entire population would be 78% when receiving no tax exclusion, 83% when receiving a relatively smaller low-income tax exclusion, and 84% when receiving a relatively larger, high-income tax exclusion.
Among this subset of people who would benefit from switching from the 90% AV plan to a less-generous plan in the absence of the tax subsidy, there would be an average utility gain of $150 from the health plan alone (assuming that the policy change to rescind the tax exclusion was associated with a decrease in income taxes paid to the government to make that person’s tax burden remain the same and assuming that those who wish to remain in the 90% AV plan are permitted to do so). This $150 utility gain equals 7.6% of total spending among those 35.7% who would benefit from this policy change (not shown in Table 3); this $150 utility gain equals 2.7% of total spending across all 24 categories of people (also not shown).
In sensitivity analyses (with results not shown), the assumption made about the magnitude of the consumer surplus (which includes the value of the “access motive” postulated by John Nyman) has relatively modest (yet certainly nontrivial) effects on the net utility gain. For example, the $1037 average reduction in utility in switching from the 90% AV plan to the 70% AV plan when one receives the high-income tax exclusion would instead be $900 if the reduction in consumer surplus was assumed to be half as large as our primary assumption (ie, one quarter rather than one half of the difference in total spending) and would instead be $1174 if the reduction in consumer surplus was assumed to be 50% larger than our main assumption.
Conclusion
These results from our simplified model of expected utility illustrate the relatively intuitive notion that that the tax exclusion introduces a distortion into the choices of private health insurance plans. More importantly, these results indicate that this distortion in plan choice, in turn, introduces an increase in net health care spending (and associated consumer surplus) which can be in excess of the direct utility gain from risk reduction for some age/gender/health categories but can be smaller than the direct utility gain from risk reduction for other age/gender/health categories (holding all other characteristics of the person constant). These net effects from this comparison of changes in spending to changes in uncertainty risk vary substantially across the different categories.
If one considers a hypothetical setting with just one sole plan offered to a group of heterogeneous workers, older people with chronic health conditions have benefited from the tax exclusion, in that its impact has presumably been a shift from a less-generous plan to a more generous plan where their expected utility is higher; in contrast, younger people without chronic health conditions have been made worse off by the tax exclusion’s shift from a less-generous plan to a more generous plan (where their expected utility is lower) in a 1-plan setting. In this context, a hypothetical reform to limit the employment-based tax exclusion for health insurance (such as a cap on the amount above a certain threshold or a wholesale conversion to a price-linked tax credit pegged to, say, the second-cheapest silver plan), coupled with a mechanism to convert the government’s newfound tax revenue (through increases in taxable income) into budget-neutral reductions in tax rates, has the potential for increases in differences in utility across age/gender/health-related spending categories if the employment-based group is constrained to 1 plan. (As noted above, though, we do not consider other differences in utility across various subgroups which would arise from reforming the tax treatment of employment-based insurance.) These results should therefore have relevance to policymakers considering limits to the tax exclusion for employment-based insurance.
Footnotes
Declaration of Conflicting Interests
The author(s) declared no potential conflicts of interest with respect to the research, authorship, and/or publication of this article.
Funding
The author(s) disclosed receipt of the following financial support for the research, authorship, and/or publication of this article: Funding for this research was provided by the Mercatus Center.