
Abstract
This study is the first to offer a detailed look at the burden of medical out-of-pocket spending, defined as total family medical out-of-pocket spending as a proportion of income, for each state. It further investigates which states have greater shares of individuals with high burden levels and no Medicaid coverage but would be Medicaid eligible under the 2014 rules of the Affordable Care Act should their state choose to participate in the expansion. This work suggests which states have the largest populations likely to benefit, in terms of lowering medical spending burden, from participating in the 2014 adult Medicaid expansions.
Introduction
A central goal of expanding health insurance coverage in the Affordable Care Act (ACA) is reducing the financial impact of health care expenses on low-income American families. The 2014 provisions of the ACA are likely to have an uneven impact across states in reducing the share of income individuals devote to medical out-of-pocket spending, including premiums due to their being a multitude of factors that influence financial burden levels.
Geographic variations in income, the price of medical care, health service utilization, and safety-net generosity and other factors all contribute to how much income the population of a given state devotes to medical spending. In areas where there is less competition among medical providers, hospitals, and Health Maintenance Organizations, or where input costs are higher for example, we would expect that the price per unit of service to be higher, putting upward pressure on medical spending in a given state. States with a smaller share of low-income individuals have populations that, on average, devote a smaller portion of their income to medical spending, holding price constant. Yet states with higher-income populations will also have a higher willingness to pay for medical care, which may increase use or the price per unit of care. There may also be variation across states in the intensity of medical treatment, leading to variation in medical spending. Differences in population health across states may also influence medical service use, treatment intensity, and spending, as will differences in rates of insurance coverage. States with a greater proportion of insured individuals have populations more insulated from medical out-of-pocket spending on services and equipment, and will tend to use more services. Such states will also have a greater share of residents that pay for health insurance premiums out of pocket. Finally, states with more expansive Medicaid programs have low-income populations less exposed to medical out-of-pocket spending on medical services, equipment, and premiums.
Given the numerous channels influencing how much income individuals devote to medical spending, the ACA’s 2014 Medicaid expansion offers a clear and decisive channel to curb out-of-pocket spending risk for eligible individuals with low incomes. Newly Medicaid eligible individuals will have very limited or no copayments for medical services and equipment, and will generally not pay premiums (Kaiser Family Foundation, 2013a). 1 However, states have the option to participate in the expansions or not, which will lead to continued differences across participating and nonparticipating states in the risk of medical out-of-pocket spending among low-income Americans.
The extent of variation across states in individuals’ medical out-of-pocket spending, as a proportion of income, is not well documented. This is largely due to previous data limitations. Household surveys that collect information on medical out-of-pocket spending and income are mostly too small, in terms of sample size, to produce reliable state-level estimates. Cunningham (2010) is one exception that employs multiple years of Medical Expenditure Panel Survey (MEPS) data to study twenty-nine states. The author estimated the proportion of nonelderly insured individuals with medical spending greater than 10 percent of income and reveals some variation across the states included in the study. However, differences in the more general distribution of medical spending as a percentage of income across states has not been documented previously. Similarly, no prior analysis has shown which states are most likely to benefit from the Medicaid expansion due to having higher percentages of soon-to-be Medicaid eligible adults that currently devote a large share of income to medical out-of-pocket expenses.
This paper is the first to offer a detailed look at the burden of medical out-of-pocket spending, generally defined as total family medical out-of-pocket spending as a proportion of income, for all fifty states and the District of Columbia. It is, therefore, an important step toward understanding whether there are significant differences in medical spending burden across all states. We accomplish this with a familiar survey that recently began collecting information on medical out-of-pocket spending: the Current Population Survey, Annual Social and Economic Supplement (CPS ASEC). Using these data, we further investigate which states have greater shares of individuals who currently face high burden levels and do not have Medicaid coverage but would be Medicaid eligible under the 2014 rules if their states choose to participate in the expansion. This work is suggestive of which states have the largest populations likely to benefit, in terms of lowering medical spending burden, from participating in the 2014 adult Medicaid expansions.
Data and Method
Data
To produce reliable state-level estimates, this study combines two years of CPS ASEC data (2011 and 2012), which are representative of the civilian, noninstitutionalized U.S. population. These data are a supplement to the monthly CPS, where the reference period for many of the questions used in this study correspond to the entire 2010 and 2011 calendar years, respectively. The survey sample is based on approximately one hundred thousand addresses each year. It has a complex survey design, and all standard error estimates in this study account for this design using the survey’s replicate weights.
The individual is the unit of analysis in this study. However, our measure of “medical spending burden” (defined in the Method section) is defined at the level of the health insurance unit (HIU). A HIU is a group of individuals who would normally be eligible to enroll on a common health insurance plan and includes adult children ages eighteen to twenty-two who do not work the entire year, attend school, and live with their parents. This analysis uses a subsample of the CPS ASEC data restricted to (1) individuals less than age sixty-five, not in a HIU with anyone age sixty-five and older and (2) individuals in a HIU with at least one adult age eighteen to sixty-four.
As the focus of our analysis is on the population most likely affected by the 2014 provisions of the ACA, we exclude individuals sixty-five years and older. This age group is largely covered by Medicare, and their benefits and likelihood of coverage will not change in response to the ACA provisions beginning in 2014. We also exclude the small number of individuals under age sixty-five living with older respondents so that the remaining units are more comparable. This exclusion does not change our main results. Finally, there are some units where there are no adults eighteen years or older. This occurs because individuals age fifteen to seventeen are eligible for a complete interview if they are the oldest in the household. We exclude these HIUs because they are not comparable with others in terms of earnings potential, government program eligibility, and likely resources (income or in-kind items) from outside the household.
The pooled 2011 and 2012 CPS ASEC data contain records on 406,381 individuals, 44,453 of whom are sixty-five years old or older and 5,451 under age sixty-five but reside in an HIU with someone aged sixty-five or older (restriction 1); 4,946 individuals belong to an HIU without an adult aged eighteen or older (restriction 2). Our final subsample includes 351,531 individual respondents. We refer to this subsample as the “nonelderly” for simplicity.
Method
We define “medical spending burden” as the sum of total medical out-of-pocket spending, after any reimbursements, over all individuals in a given HIU expressed as a percentage of gross HIU income. 2 Total medical out-of-pocket spending includes spending on premiums, medical services, prescription drugs, equipment, and over-the-counter items. Gross income is the summation of sixteen distinct income categories, including public assistance (U.S. Census Bureau, 2012). All individuals in a given HIU share the unit’s level of medical spending burden. To calculate the medical spending burden of HIUs who report zero income (and in some cases negative or extremely low income), total gross HIU income is bottom coded at a minimum of $100. 3
Our first analysis establishes the extent of heterogeneity in medical spending burden across states. For each state and the District of Columbia, we estimate the 50th, 70th, and 90th percentiles of the medical spending burden distribution defined above. We present these data sorted by states’ 75th percentile within their geographic region to emphasize differences in “high” burden levels across states. In other words, it illustrates burden levels within each state’s top quarter and which states’ top quarter have higher/lower burden than others. Although the top quarter (75th percentile) is somewhat arbitrary, we believe that it reasonably reflects medical out-of-pocket spending levels, with respect to income, which are “high” compared with others in the population. 4
The second analysis sheds light on the difference in medical spending burden among low-income individuals, compared with the rest of the population, within and between states. We use the income threshold for the 2014 adult Medicaid expansions (less than 138 percent of the federal poverty level [FPL]) to define our “low income” group. 5 This illustrates whether low-income individuals devote a disproportionate share of their income to medical out-of-pocket spending compared with their higher-income counterparts and whether these relative burdens differ significantly across states. If there are noticeable distinctions across states, it is suggestive of which states have low-income populations that could benefit most from expanding the state’s Medicaid program. In this analysis, we estimate the 75th percentile of medical spending burden by income group within each state.
Our final analysis more closely investigates what proportion of each state’s nonelderly population could potentially benefit from the 2014 Medicaid expansions via decreases in medical out-of-pocket spending and burden levels. Here, we measure the proportion of a given state’s nonelderly population that has (1) income less than 138 percent of the FPL, (2) medical spending burden in the nation’s top quartile, and (3) a given type of health insurance. We use the following hierarchy of health insurance status: Medicaid/CHIP (at any point during the year, including those who have other types of coverage during the year as well), private (no Medicaid/CHIP), other government insurance, and uninsured. 6 In doing so, we restrict our attention to U.S. citizens. That is, we exclude noncitizens from the numerator and the denominator of our calculation in the last analysis. Although lawfully residing immigrants may be eligible for Medicaid or exchange-based subsidies, we cannot make the distinction between documented and undocumented immigrants in our data. Note, however, that many documented immigrants will be subject to the five-year waiting period and not immediately eligible for Medicaid in 2014 (Kaiser Family Foundation, 2012).
Limitations
One important limitation to this study is that the measure of medical spending burden, although commonly used in the literature, relies solely on observed medical out-of-pocket spending. That is, medical out-of-pocket spending neither necessarily equates with medical service utilization or need for medical care nor does it necessarily correspond with a more general concept such as welfare. There are at least two implications to this that are especially relevant to low-income individuals without Medicaid coverage.
The first is that low-income individuals without Medicaid may be likely to forego needed medical care due to cost. In this case, their medical out-of-pocket spending and burden levels would be lower than they would be if they had received and paid for needed medical care. Consequently, should such individuals obtain Medicaid coverage in 2014, their medical need may be satisfied; however, their burden level may not change. In other words, we would not observe a decrease in burden, although they would presumably be better off. A second implication is that some of this population may currently receive free or discounted charity care, or receive normal care and not pay their medical bills. In either case, individuals receive needed care in such a way that does not necessarily affect their burden level via out-of-pocket spending. Should these individuals obtain Medicaid coverage, their burden levels would not necessarily change.
A second important limitation to this study concerns the measurement of health insurance status in the CPS ASEC survey. Using these data, it is neither possible to discern the number of months a respondent was covered by a given type of health insurance nor is it possible to distinguish between part-year and full-year coverage. As a result our medical spending burden estimates for respondents covered by a given type of health insurance (Tables 3 and A3) could be different if we were able to make this distinction. Yet the direction of any potential bias is not certain. For example, we would anticipate that medical out-of-pocket spending on services, equipment, and drugs—or the risk of such spending—is higher for the part-year insured. However, those with part-year private coverage, who pay premiums, will pay less in premiums than those with full-year private coverage. It is unknown how this may vary by state.
A final limitation is that the CPS ASEC survey is known to produce an “undercount” of Medicaid enrollees, where a significant portion is explained by respondents’ response error (e.g., Davern et al., 2009). This suggests that our estimates of high-burden low-income individuals with a given type of health insurance coverage (Tables 3 and A3) may also suffer from measurement error. To the extent that there are generally more CPS ASEC respondents with Medicaid coverage than the survey measures, some may face high burden levels. Finally, although additional work investigated the Medicaid undercount in the CPS ASEC compared with select state-specific surveys (e.g., Call, Davern, and Blewett, 2007), it is unclear how it may systematically vary across states, and consequently, how it may affect the state-by-state results in this work.
Results
Medical Spending Burden by State
Table 1 shows the considerable variation in the distribution of medical spending burden across states. It reports the 50th, 75th, and 90th percentiles of the burden distribution among the nonelderly for each state and the District of Columbia as well as the entire United States and nine census regions. (Standard error estimates and sample sizes are presented in Appendix Table A1.) For example, the distribution for the entire U.S. population is reported at the top of Table 1. The national 50th percentile of medical out-of-pocket spending relative to income equals 3.1 percent, the 75th percentile equals 8.2 percent, and the 90th percentile equals 19.7 percent. The 75th percentile estimate means that a quarter of nonelderly individuals in the United States live in HIUs that allocate 8.2 percent or more of their total income to medical out-of-pocket spending, while the 90th percentile estimate means that 10 percent devote 19.7 percent or more of their income to health care.
Medical Out-of-Pocket Spending as a Percentage of Income among Nonelderly Individuals by State.

Source. Authors’ calculations using the (pooled) 2011 and 2012 CPS ASEC (2010 and 2011 reference years).
Note. States sorted by p75 within region.
p < .10, **p < .05, ***p < .01, from two-tailed significance tests of difference between the United States (first row) and an individual geography.
States in Table 1 are ordered by their 75th percentile, from highest to lowest, within each region to demonstrate which states’ populations devote a greater proportion of their income to medical out-of-pocket spending at the extreme (i.e., top quarter) and to highlight patterns across geographic regions. The ten states with the highest 75th percentile burden level are underlined; the bottom ten are in italics. Among the eight states in the Mountain region, five have 75th percentile burdens in the top ten (Idaho, Wyoming, Utah, Montana, and Nevada). In Idaho, one-quarter of the nonelderly population reside in HIUs that devote at least 10.9 percent of their income to medical out-of-pocket spending. Similarly, three of the four East South Central states have 75th percentiles that are among the highest in the country (Mississippi, Kentucky, and Tennessee). Indeed, the East South Central states have the highest 75th percentile as a group among all the regions (9.7 percent).
At the other extreme, all three of the Middle Atlantic states (New York, New Jersey, and Pennsylvania) have 75th percentile burdens that are among the lowest in the country and, as a group, is the lowest across all regions (6.9 percent). For example, a quarter of New York’s nonelderly population includes families that spend as little as 6.4 percent of their income to medical out-of-pocket spending. Only residents of the District of Columbia face a lower burden level (5.0 percent) than New York, which belongs to the South Atlantic. Although this differential could in part result from comparing the federal district, which arguably more closely resembles a city, with an entire state. 7
The 75th percentiles of the top five states—Idaho (10.9), Mississippi (10.7), Wyoming (10.6), Montana (10.5), and Arkansas (10.3)—are not statistically different from one another. 8 Nonetheless, they are different (meaningfully and statistically) from those states near the middle (e.g., Wisconsin, Minnesota, Iowa, Arizona, Texas, and Indiana, 8.5), and especially the bottom of the list (e.g., Hawaii to the District of Columbia, 6.8 to 5.0). Overall, Table 1 reveals significant variation across states and regions.
Medical Spending Burden by Income and State
Table 2 illustrates the inequality in medical spending burden across income levels, within and between states. The first column reports the 75th percentile financial burden of those with incomes below 138 percent of the FPL, and the second column reports the 75th percentile financial burden of those with incomes at or above 138 percent of the FPL. (See Appendix Table A2 for standard error estimates and sample sizes.) Recall there are many factors that influence burden levels across states, which may also disproportionately affect low-income populations. Important factors likely include Medicaid generosity or access to other safety-net programs in a given state, as well as health care prices and general economic conditions, to name a few.
Seventy-fifth Percentile Medical Spending Burden Levels among Individuals with Income Below and Above 138 percent of the FPL by State.

Source. Authors’ calculations using the (pooled) 2011 and 2012 CPS ASEC (2010 and 2011 reference years).
Note. FPL = Federal Poverty Level; CPS = Current Population Survey; ASEC = Annual Social and Economic Supplement.
p < .10, **p < .05, ***p < .01, from two-tailed significance tests of difference between the United States (first row) and an individual geography.
Table 2 makes clear that the low-income population of every state experiences higher burden levels compared with their higher-income counterparts at the 75th percentile. 9 Furthermore, there is much more variation among the lower-income populations across states (column 1) compared with the higher-income populations (column 2). The 75th percentiles among states’ low-income populations range from a low of 10.0 percent (District of Columbia) to a high of 28.8 percent (Alaska). For states’ higher-income populations, the range is from 4.6 percent (District of Columbia) to 10.5 percent (Idaho). Overall, there is a slight positive relationship between the income groups. The correlation coefficient between the high- and low-income groups is 0.25 (data not shown). At one extreme are states with high-income and low-income burden levels that differ by as much as 21 percentage points (Alaska and Virginia), while at the other extreme are states with burden levels that are much more comparable across the income groups—financial burdens in South Dakota, California, and New York differ by less than 5 percentage points between the income groups. (Note that the variation of these percentile estimates, because of the much smaller sample size of the low-income group, is much greater than that for the entire population or the higher-income group, as shown in Appendix Table A2.)
Given that the 2014 Medicaid expansions should decrease the risk of medical out-of-pocket spending and high burden levels of low-income individuals compared with everyone else, we would expect the differences observed in Table 2 to decrease among states that participate. The largest impacts can be expected for those states at the top of Table 2 if they adopt the expansion.
Potentially Medicaid Eligible with High Medical Spending Burden by State
Table 3 takes a closer look at the proportion of each state’s nonelderly U.S. citizen population that have low incomes (less than 138 percent of the FPL), high burden levels (in the nation’s top 25 percent), and a particular type of health insurance. 10 It is suggestive of which states have larger proportions of their population that would benefit most from the 2014 adult Medicaid expansions in terms of potentially reducing their medical spending burden levels via lower medical out-of-pocket spending. States are ordered by the share of the state nonelderly population that has high burden and could qualify for the 2014 Medicaid expansion and does not have Medicaid or CHIP coverage today.
Percentage of Each State’s Nonelderly, U.S. Citizen Population with High Medical Spending Burden (Top 25 percent of Spending Relative to Income) and Low Income (below 138 percent FPL) by Insurance Coverage.

Source. Authors’ calculations using the (pooled) 2011 and 2012 CPS ASEC (2010 and 2011 reference years).
Note. Estimates reflect the proportion of a given states’ nonelderly U.S. citizen population with a given type of health insurance, income below 138 percent of the FPL, and a burden level in the states’ top quartile. FPL = federal poverty level; CPS = Current Population Survey; ASEC = Annual Social and Economic Supplement.
May also include private and/or non-Medicaid public insurance.
Excludes Medicaid yet may include other non-Medicaid government insurance.
Non-Medicaid government insurance and no private insurance.
p < .10, **p < .05, ***p < .01, from two-tailed significance tests of difference between the United States (first row) and an individual geography.
Note that Table 3 may underestimate the number of people who could benefit from the Medicaid expansions for reasons discussed in the limitations section. In short, the definition of medial spending burden does not account for overall welfare. The uninsured may currently forgo needed medical care that they would otherwise receive if insured by Medicaid, and have low out-of-pocket burden. Those who transition from uninsurance to Medicaid may increase medical care utilization without increasing out-of-pocket spending or burden, yet would presumably be better off (i.e., an increase in welfare).
In Nevada, for example, 8.1 percent of the state’s nonelderly U.S. citizen population has low income, high medical spending burden, and no Medicaid/CHIP coverage (Table 3). There are approximately an equal percentage of low-income high-burden individuals who are uninsured or covered by private insurance. That is, 3.7 percent of this population is uninsured, 3.8 percent has private insurance, and 0.5 percent has non-Medicaid/CHIP government insurance. (2.2 percent have Medicaid or CHIP, which is a reminder that Medicaid may not necessarily eliminate high-burden levels and is discussed in more detail in the following subsection). In contrast, just 3.0 percent of Vermont’s nonelderly U.S. citizen population have low incomes, face high burden levels, and do not have Medicaid or CHIP. Slightly more than one-third of these individuals are uninsured (1.1 percent) and slightly more than half have private insurance (1.7 percent).
From Table 3, it is also apparent that the composition of insurance status among the low-income high-burden individuals vary considerably by state. For example, 3.8 percent of Louisiana’s population of interest is uninsured, while less than one percent of individuals in Hawaii or Massachusetts share these characteristics. This may be expected, given Hawaii’s employer mandate and the more recent comprehensive health reform in Massachusetts, although it does serve as a reminder that low-income individuals can still face high burdens due to cost-sharing requirements under private plans. Similarly, over 4 percent of the population of interest in Utah and Idaho have private insurance, while less than 2 percent of the respective population in Connecticut or Vermont have private insurance.
Overall, Table 3 shows significant variation across states in the health insurance coverage of their low-income high-burden populations and the share of the state’s population they comprise. This suggests that the impact of reducing burden levels via the ACA’s Medicaid expansions, due to comprehensive coverage with low or no premiums and cost-sharing responsibility, will be uneven across states that participate. Its effect on reducing high burdens would likely be greatest in states such as Nevada and smallest in states such as Vermont.
Medicaid and High Medical Spending Burden Levels
From Table 3, it is also clear that a portion of low-income high-burden individuals in each state have Medicaid coverage at some point during the year under current rules. Nationally, they represent approximately one-third of nonelderly U.S. citizens with income below 138 percent of the FPL and high burden levels (Table 4). This fact, however, does not invalidate the expectation that the Medicaid expansion may significantly decrease high medical spending burdens among low-income individuals.
Percentage of Low-income Nonelderly U.S. Citizens with Medicaid by Presence of Other Individuals with Private Insurance in the HIU.

Source. Authors’ calculations using the (pooled) 2011 and 2012 CPS ASEC (2010 and 2011 reference years).
Note. HIU = Health Insurance Unit.
Medicaid beneficiaries face limited cost-sharing. Indeed, this is generally true for the low-income high-burden individuals represented in Table 3. For example, median medical out-of-pocket spending per person on medical services, prescription drugs, and equipment (excluding premiums) among those with low income, high burden, and Medicaid is $0, compared with $100 for the uninsured and $200 for the privately insured (Table 5). (Average medical out-of-pocket spending on services, prescription drugs, and equipment per person for the respective Medicaid, private insurance, and the uninsured populations is $390, $842, and $1,013.) Moreover, Medicaid beneficiaries (and the uninsured) generally do not pay out-of-pocket premiums, unlike the privately insured. 11
Distribution of Out-of-Pocket Spending on Medical Services, Prescription Drugs, and Equipment (excluding premiums) among High-burden Low-income Nonelderly U.S. Citizens by Insurance Status.
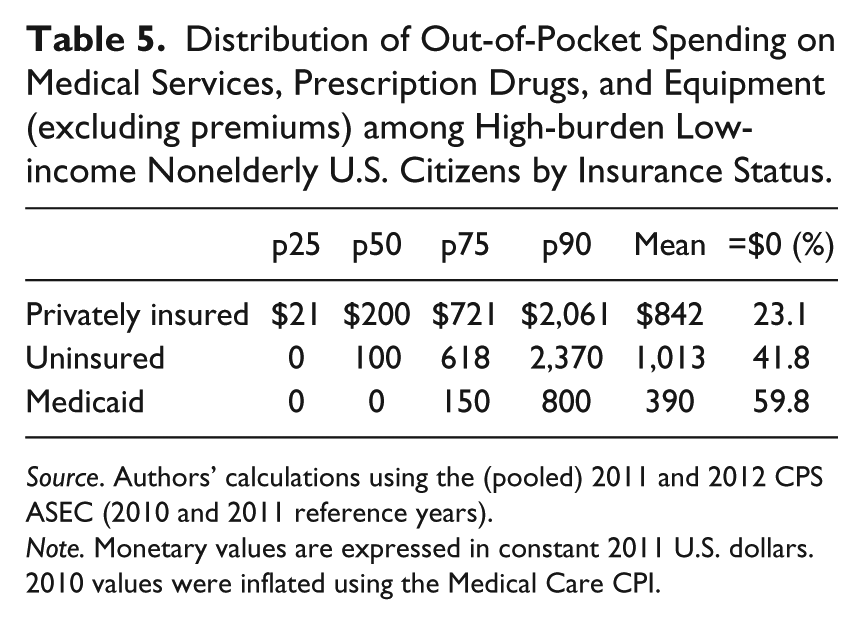
Source. Authors’ calculations using the (pooled) 2011 and 2012 CPS ASEC (2010 and 2011 reference years).
Note. Monetary values are expressed in constant 2011 U.S. dollars. 2010 values were inflated using the Medical Care CPI.
If Medicaid lowers risk of medical out-of-pocket spending, then why do we observe high-burden Medicaid beneficiaries? One reason is that medical spending burden is a group concept, defined for an entire HIU. Therefore, the medical spending associated with others in the unit affects the burden status of all members. Among those with low income, a high burden level, and Medicaid, approximately one-quarter reside in HIUs where at least one member has private insurance (Table 4). 12 As demonstrated above, these privately insured individuals have higher out-of-pocket spending on medical services and equipment compared with those with Medicaid, which increases their chances of having higher burden levels. Moreover, the privately insured also pay premiums, which for low-income individuals can easily put them at risk for high burden levels. Said differently, those with Medicaid reduce the burden levels of those with private insurance in a family. Under the expansion, all members of the family will be eligible for Medicaid if any one member is—the necessity of some family members buying private insurance or going uninsured due to nonuniform eligibility will be eliminated.
It is also important to note that there is heterogeneity in income by insurance status, even among those residing in families with income below 138 percent of the FPL. Specifically, income among high-burden low-income individuals with Medicaid is less than that of those with private insurance, although higher than the uninsured (Table 6). Consequently, lower levels of out-of-pocket spending among individuals with Medicaid result in higher burden levels, compared with the privately insured group.
Distribution of HIU Income per Person among High-burden Low-income HIUs by Insurance Status.

Source. Authors’ calculations using the (pooled) 2011 and 2012 CPS ASEC (2010 and 2011 reference years).
Note. One person with a given type of health insurance is randomly selected to represent the HIUs’ income per person. HIUs represented in the table may appear in more than one insurance category in cases where not all members have the same insurance (are not mutually exclusive). Monetary values are expressed in constant 2011 USD. 2010 values were inflated using the CPI-U series from the Bureau of Labor Statistics. CPS = Current Population Survey; ASEC = Annual Social and Economic Supplement; HIU = Health Insurance Unit.
Another reason for which we may observe high burden levels among Medicaid beneficiaries is that Medicaid may not cover all services, some of which may be costly, such as physical therapy, ambulatory services, dental treatment, durable equipment, and prescription drugs (Centers for Medicare and Medicaid Services, 2013). Furthermore, for low-income families, otherwise modest levels of out-of-pocket spending may put them at risk for high out-of-pocket burden levels. While this is important, Table 5 indicates that while some high-burden Medicaid enrollees have nontrivial out-of-pocket spending on medical services, prescription drugs, and equipment (excluding premiums), more than half (59.8 percent) report zero out-of-pocket spending. That is, while Medicaid may not eliminate high out-of-pocket burdens for low-income individuals, it should reduce the risk of facing high burden levels.
A final reason for which we may observe Medicaid beneficiaries with high burden levels could be due to noncontinuous Medicaid coverage during the year. For these individuals, Medicaid’s ability to reduce risk of medical out-of-pocket spending is uneven. Unfortunately, we cannot discern full- or part-year coverage for all the Medicaid beneficiaries in the CPS ASEC sample, which is a limitation (see Limitations section). However, Sommers (2008, Table 2), using the MEPS, estimates that among those with Medicaid at the beginning of a given year, approximately 79 percent of nonelderly adults, and 88 percent of children, are still covered twelve months later, implying that a significant number of Medicaid beneficiaries have that coverage for only part of the year.
Summary and Discussion
One important goal of expanding health insurance coverage via the ACA is to reduce the financial burden of medical out-of-pocket spending for low-income families. Large differences across state populations (e.g., income, age, health, insurance status, etc.) suggest that high spending burden, or the risk thereof, also differs across states. Such differences across states could, in turn, imply that the ability of the ACA to reduce spending burdens for low-income families may also vary by state.
This work reveals significant variation in the financial burden of medical out-of-pocket spending among the nonelderly across states and the District of Columbia. This is particularly true among individuals with medical spending burden levels in the top quarter of each state’s nonelderly population. This finding is a step toward understanding why burden levels differ across states and how the 2014 provisions of the ACA may dampen this variation. There are many factors likely responsible for the observed differences across states—the relative costs of medical care, income, health, and safety-net generosity, for example—which are important topics for future research.
Notwithstanding, there are components of the ACA that hold promise for reducing medical spending burden levels, which may affect some states more than others. For example, subsidies, more uniform benefits, and access to them, will all likely dampen burden levels across the nonelderly population. However, the Medicaid expansions offer one of the most unambiguous means to reduce high burden levels among those whose income is less than 138 percent of the FPL—for those residing in states that participate. This is because the newly Medicaid eligible will not pay premiums and will face very limited cost-sharing compared with those insured by private health insurance plans.
Given state policy makers will decide whether to expand their Medicaid programs, to the extent that Medicaid expansion may reduce medical spending burdens for low-income individuals, there will be continued variation in burden levels across states. Low-income families in states that do not expand their program will face higher risk of medical out-of-pocket burden, all else equal.
As this research demonstrates, high burdens for this low-income population vary much more across states than do burdens for their higher-income counterparts. Consequently, increased access to low or no-cost comprehensive health care for this low-income population has potential to substantially reduce this variation both across states and between income groups. Furthermore, this research identifies which states have a relatively larger proportion of non-Medicaid/CHIP, high-burden individuals with income below 138 percent of the FPL. The analysis thus indicates which states have populations most likely to benefit from the 2014 adult Medicaid expansions.
Among the top twenty-five states with the largest shares of their population attributable to low-income high-burden individuals without Medicaid/CHIP coverage, there is a divide in terms of the number that have committed to expand or not expand their Medicaid program. Among the top twenty-five states we identify, fifteen will not expand their Medicaid program at this time: Louisiana, Mississippi, Montana, Georgia, Alabama, Utah, Idaho, Florida, South Carolina, Missouri, Texas, Oklahoma, Tennessee, North Carolina, and Kansas(Kaiser Family Foundation, 2013b). An additional ten states will participate: Nevada, Arkansas (state-specific expansion), New Mexico, Arizona, Oregon, Kentucky, West Virginia, North Dakota, California, and Colorado.
In sum, the ACA’s Medicaid expansions can potentially play an important role in expanding access to comprehensive medical care at no or very limited cost to low-income individuals. Given that states have the choice to participate in these expansions and that some states have larger potentially Medicaid eligible populations experiencing high burden levels, the choice to participate will affect states differently. States that participate in the expansions have an opportunity to significantly decrease financial burdens of medical out-of-pocket spending for a financially vulnerable segment of their population.
Footnotes
Appendix
Declaration of Conflicting Interests
The author(s) declared no potential conflicts of interest with respect to the research, authorship, and/or publication of this article.
Funding
The author(s) disclosed receipt of the following financial support for the research, authorship, and/or publication of this article: The Robert Wood Johnson Foundation funded this research.