
Abstract
To evaluate surgeons’ performance, health care managers often use the revenues that surgeons make for the hospital. The purpose of this study is to determine the relationship between surgeons’ technical efficiency and their revenues by using multiple regression analysis on surgical data. The authors collected data from all the surgical procedures performed at University Hospital from April 1 through September 30 in 2013-2018. Output-oriented Charnes-Cooper-Rhodes model of data envelopment analysis was employed to calculate each surgeon’s technical efficiency. Seven independent variables were selected; revenue, experience, medical school, surgical volume, sex, academic rank, and surgical specialty. Multiple regression analysis using Tobit model was used for our data. The data from a total of 17 227 surgical cases were obtained in the 36-month study period. The authors performed multiple regression on 222 surgeons. Revenue had significantly positive association with mean efficiency score (P = .000). Surgical volume had significantly negative association with mean efficiency score (P = .000). The other coefficients were statistically insignificant. An increase in revenue by 1% was associated with 0.46% to 0.52% increases in efficiency score. We demonstrated that surgeons’ revenue can serve as a proxy variable for their technical efficiency.
Prediction of surgeons’ efficiency is difficult.
Hospital revenue can serve as a proxy for surgeons’ efficiency.
Health care managers can easily evaluate surgeons’ efficiency using hospital revenue.
Introduction
Operating room efficiency is an important concern in most hospitals. 1 The operating room efficiency is considered to be dependent on surgeons’ technical efficiency because they usually use the longest time portion of the operating room time. Precise evaluation of surgeons’ technical efficiency is the keys for the hospitals to survive in the increasingly fierce health care market competition. Data envelopment analysis (DEA) is a measure of technical efficiency that takes account of multiple inputs and multiple outputs. Data envelopment analysis has been widely used to measure technical efficiency of various health care entities.2,3 Individual surgeons’ technical efficiency can also be measured by efficiency scores calculated from DEA.4-6 However, the calculation of technical efficiency requires some mathematical knowledge and special software. It often takes time before reliable technical efficiency is calculated. Data envelopment analysis may not be practically useful for the health care managers to use for their daily managerial decision making.
To evaluate surgeons’ performance, the health care managers in Japan often use the revenues that surgeons make for the hospital. It is easy to calculate, and the data are collected every month for the purpose of claiming insurance reimbursements. The health care managers need not make any additional investment to obtain the data on the revenues that surgeons make for the hospital. However, there has never been any study that determined whether the hospital revenue can be a proxy variable for surgeons’ technical efficiency. The purpose of this study is to determine the relationship between surgeons’ technical efficiency and hospital revenues by using multiple regression analysis on actual surgical data.
Methods
The University Institutional Review Board approved our study. Anonymity of the data was strictly maintained by de-identification by the research team.
Data
Our University Hospital is located in the metropolitan Tokyo, Japan, serving a population of ~1 000 000. It has 1152 beds and has a surgical volume of approximately 9000 cases annually. It has 13 surgical specialty departments. We collected data from all the surgical procedures performed in the main operating rooms of University Hospital from April 1 through September 30 in 2013-2018. Because of our time and budget constraints, we collected data only for 6 months in each year. We extracted the necessary information from surgical records in the University Hospital electronic medical record system.
Exclusion criteria were as follows. First, surgical procedures performed under local anesthesia by surgeons were excluded. Second, oral and dermatologic surgical procedures were excluded because most of their cases were minor surgeries that are clinically different from other major surgeries. Third, the surgical procedures were excluded if the patients die within 1 month after surgery to maintain a constant quality outcome of surgery. Fourth, the surgical procedures which were not reimbursed under the surgical payment system were excluded. Fifth, the surgical procedures were excluded if their records were incomplete for any reason (Figure 1).

Flow chart of eligibility selection.
Efficiency Scores (Dependent Variable)
The method to calculate surgeons’ technical efficiency was similar to that described in our previous studies.4-6 We defined surgeons’ technical efficiency as follows: technically efficient surgeons maximize their output while minimizing their input utilization. We employed output-oriented Charnes-Cooper-Rhodes model of DEA under the constant returns-to-scale assumptions, which does not require an a priori specification of a function. 7 In this analysis, we focused on the surgeons’ activity and their clinical decision. A decision-making unit (DMU) is defined as the entity that is regarded as responsible for converting inputs into outputs in DEA. 8 We defined in this study the DMU as a surgeon with the highest academic rank that scrubbed in the surgery (a senior surgeon). All the inputs and outputs are under the control of a DMU. Inputs were defined as (1) the number of medical doctors who assisted surgery (assistants) and (2) the time of surgical operation from skin incision to skin closure (surgical time). The output was defined as the surgical fee for each surgery. Japan has maintained a universal health insurance system and most health care providers are reimbursed on a fee-for-service basis according to the fee schedule that sets prices uniformly at the national level. The same fee schedule is enforced for all plans and all the surgeons studied. 9 It is classified as K000-K915 in the Japanese surgical fee schedule and is called “K codes.” Each surgical procedure is assigned to 1 of the K codes which correspond with surgical fees.10-13 The fee is identical regardless of who (a senior surgeon or a surgical trainee) performs surgery as long as they have medical licensure, how many assistants they use, or how long it takes to complete surgery. The additional reimbursements for expensive surgical devices, such as auto suture devices or imaging navigation devices, were excluded. Other fees for blood transfusion, medications, special insurance medical materials, and anesthesia were also excluded.
We added all the inputs and outputs of the surgical procedures for each DMU in each year during the 6-month study period, and calculated his or her efficiency scores using DEA-Solver-Pro Software (Saitech, Inc., Tokyo, Japan). 14 The efficiency scores all lie between 0 and 1, and the most technically efficient surgeons are given the score of 1. All the surgeons in the sample are given an efficiency score for each in each year.2,3 We calculated the mean efficiency scores of the years when surgeons performed surgery as a senior surgeon at University Hospital. We used as the dependent variables the natural logarithms of mean efficiency scores because of their skewed distribution.
All the surgeons analyzed were employees of our University and were salaried according to their ranks and experiences without any monetary incentives to increase surgical volume or technical efficiency. They belong to 1 of the following 11 surgical specialty departments: thoracic surgery, cardiovascular surgery, neurosurgery, obstetrics & gynecology, ophthalmology, plastic surgery, orthopedics, general surgery, urology, emergency surgery, and otorhinolaryngology.
Independent Variable
The independent variable was defined as the revenues that each surgeon made for the hospital in each year. It was calculated as total revenue for 6 months in each year that a surgeon made by performing surgery as a senior surgeon at the University Hospital. It represents only the physician fees and does not include the hospital fees associated with the surgery although the current reimbursement system does not formally define which cost components are covered by the physician fees. 15 The data were also extracted from the University Hospital electronic medical record system. It was calculated as total surgical reimbursements under the surgical fee schedule. The hospital charges surgical reimbursements to Health Insurance Claims Review and Reimbursement Services, and they become the revenues of the hospital. 9 The monetary values of hospital revenues were originally expressed in the Japanese yen, and were converted to US dollars at $1 = 100 yen to facilitate understanding by international readers. The revenue estimates were not adjusted for inflation using medical component of the Consumer Price Index (CPI) in the United States 16 because all the calculations were done in the Japanese yen. Despite the monetary policy taken by the Bank of Japan, such as massive quantitative easing and negative nominal interest rates, the Japanese economy has had very low inflation rates for the study period. Its CPI annually inflated on average only by 0.62% in the Japanese yen from 2010 through 2018. 17 The results of efficiency scores and regression coefficients are not significantly affected if we do not adjust the hospital revenues for this low inflation rate. In addition, we transformed the independent variables into natural logarithms of revenues because of their skewed distribution, which further reduces the effects of inflation on computation of efficiency scores and multiple regression. Moreover, unlike wages and prices determined in competitive markets that are affected by inflation, the reimbursements for each surgery are nationwide controlled prices and are fixed for 2 years in Japan. 9 Therefore, the hospital revenues, which are the total of the reimbursements, are not suited to the adjustment for inflation.
Control Variables
We selected 6 control variables that were available to us and might influence surgeons’ technical efficiency.
Experience and medical school
Surgeons’ experience was defined as the number of years since medical school graduation on the last date of surgical procedure.18-21
We classified medical schools into 2 categories by whether or not they were former imperial universities. If they were former imperial universities, we assigned a dummy variable of 1; otherwise, we assigned a dummy variable of 0.
Average surgical volume per 6 months
Average surgical volume was defined as the mean of surgical cases that a surgeon performed during the 6-month study period in each year. We transformed this variable into a natural logarithm because of its skewed distribution.
Sex and academic ranks
We assigned a dummy variable of sex, with female = 1 and male = 0. 22
We assigned 2 dummy variables of academic ranks, with full professor = 1 and otherwise = 0 (Rank [Professor]), and with associate professor = 1 and otherwise = 0 (Rank [Associate Professor]).
Surgical specialty
We have already known from our previous studies that the Japanese surgical fee schedule favors surgeons at cardiovascular, thoracic, and neurosurgical departments.4-6 Therefore, we assigned a dummy variable of 1 if the surgeon belongs to 1 of these departments to control the difference in efficiency scores due to their surgical specialties; otherwise, we assigned a dummy variable of 0.
Statistical Analysis
We used Stata Data Analysis and Statistical Software (Stata 14, StataCorp LP, College Station, Texas, USA) for our statistical analysis. We performed multiple regression analysis using Tobit models for our data.23,24 The dependent variable was a natural logarithm of mean efficiency score. The independent variables were a natural logarithm of revenues and control variables. The efficiency score is a limited dependent variable that lies within the range of 0 to 1, and its distribution is best described by a censored normal distribution. The appropriate regression model to use when the dependent variable has a censored distribution is the Tobit model. As we used a natural logarithm for the dependent variable, the right-censoring limit was set at 0. 3 A P-value <.05 was considered statistically significant.
Results
We analyzed a total of 17 227 surgical cases performed by 313 surgeons in the 36-month study period from 2013 through 2018 (Figure 1). Efficiency scores were calculated for all the surgeons in each year, and the mean of the efficiency scores for each surgeon was used in dependent variables.
The characteristics of the dependent, independent, and control variables are shown in Table 1. The surgeon who made the highest revenue was a cardiovascular surgeon who performed more than 100 surgical cases per 6 months on average. We could obtain information on medical schools and experience only from 247 and 227 surgeons, respectively; other surgeons did not publish these data. We performed multiple regression analysis for 222 surgeons who published information on both medical schools and experience.
Characteristics of Dependent and Independent Variables.

Note. Data are presented as mean ± SD (range) or absolute values (%).
The results of Tobit model multiple regression analysis that included surgical specialty as a control variable are shown in Table 2. Revenue had a significantly positive association with mean efficiency score (P = .000). Surgical volume had a significantly negative association with mean efficiency score (P = .000). The coefficients of experience, medical schools, sex, academic ranks, and surgical specialty were statistically insignificant (P > .05).
Results of Multiple Regression Analysis Using a Tobit Model That Included Surgical Specialty as a Control Variable.
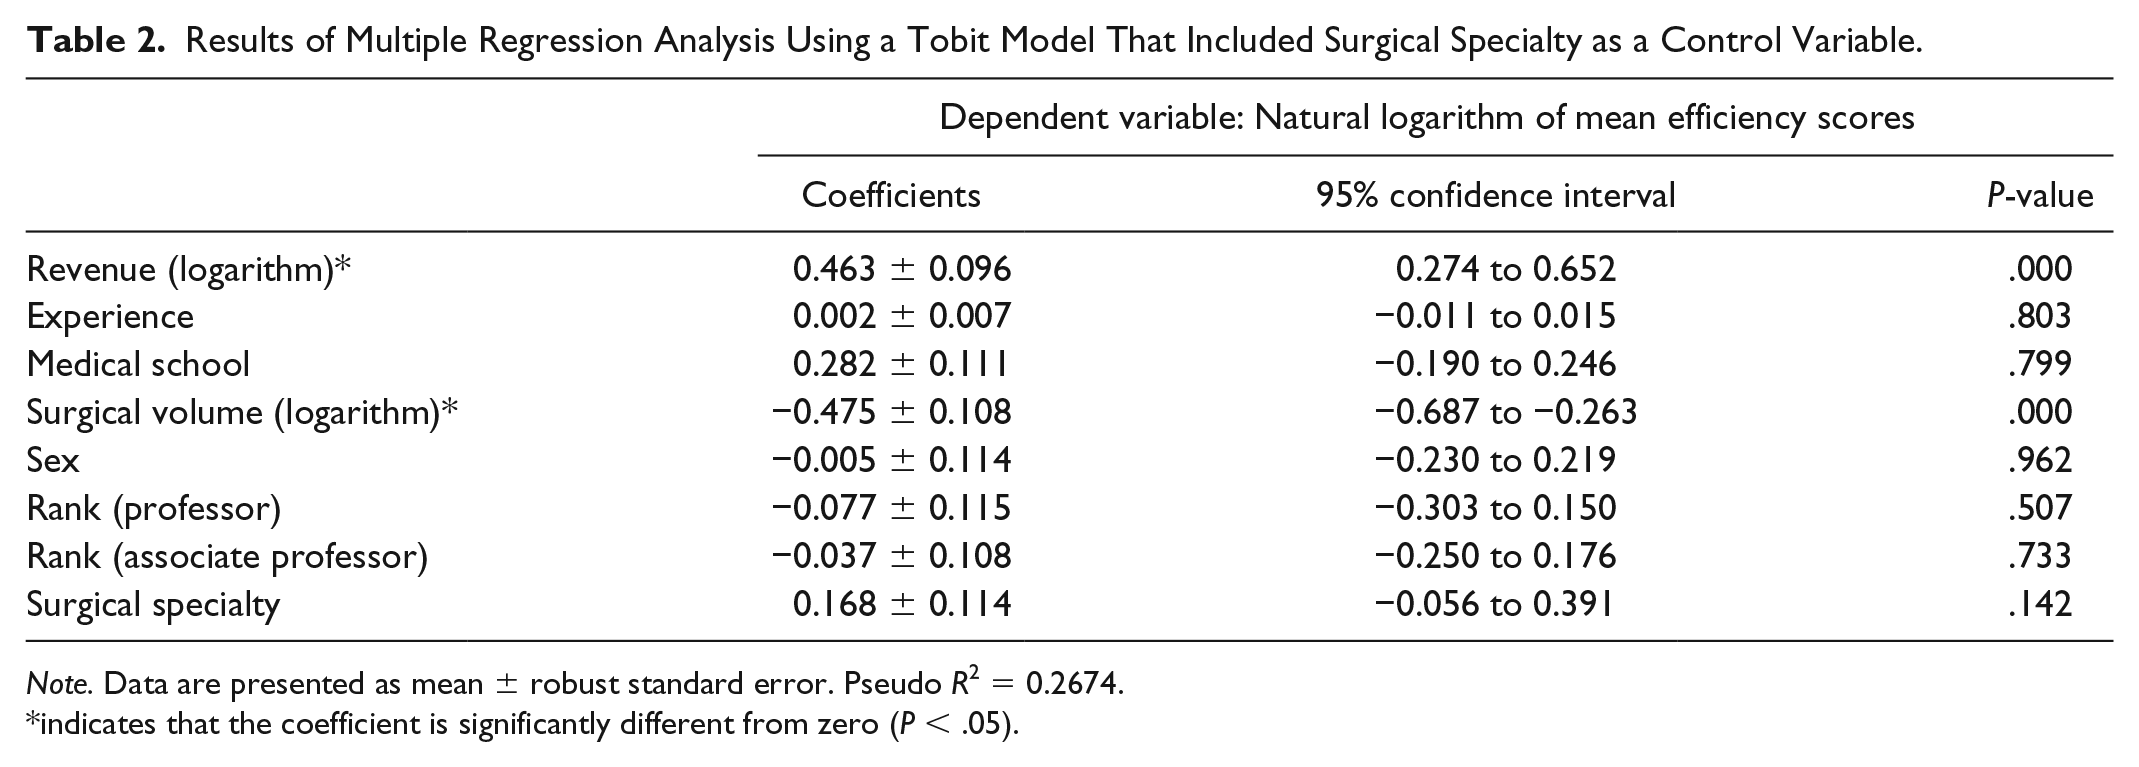
Note. Data are presented as mean ± robust standard error. Pseudo R2 = 0.2674.
indicates that the coefficient is significantly different from zero (P < .05).
The results of Tobit model multiple regression analysis that excluded surgical specialty as a control variable are shown in Table 3. Revenue had a significantly positive association with mean efficiency score (P = .000). Surgical volume had a significantly negative association with mean efficiency score (P = .000). The coefficients of experience, medical schools, sex, and academic ranks were statistically insignificant (P > .05).
Results of Multiple Regression Analysis Using a Tobit Model That Excluded Surgical Specialty as a Control Variable.
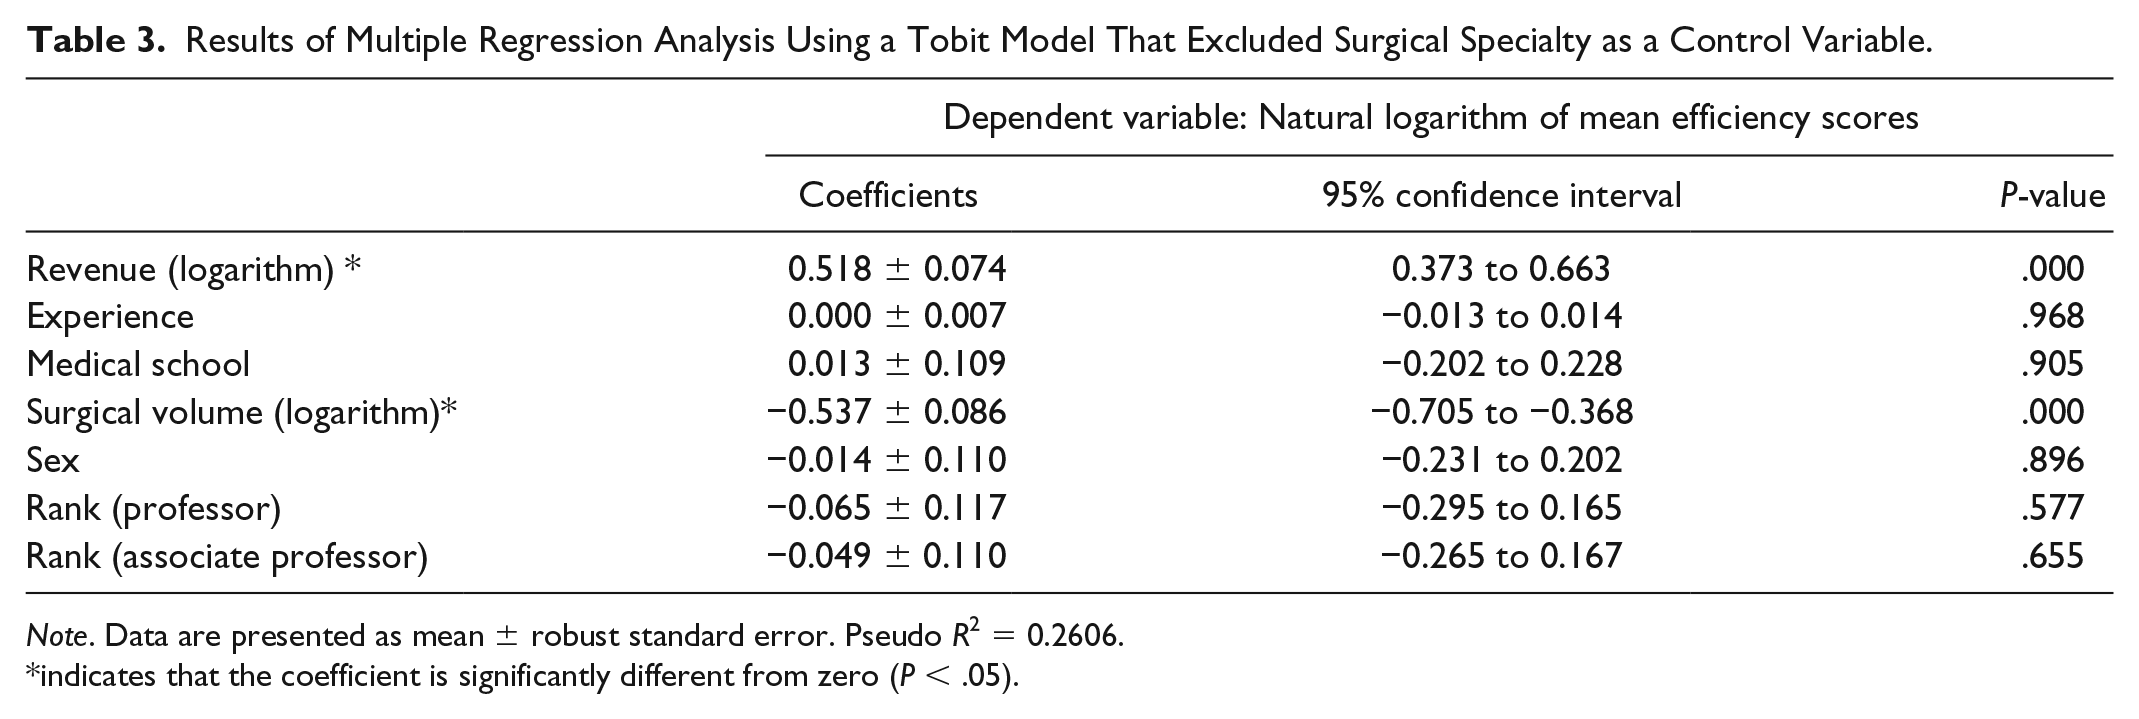
Note. Data are presented as mean ± robust standard error. Pseudo R2 = 0.2606.
indicates that the coefficient is significantly different from zero (P < .05).
Discussion
From our Tobit model multiple regression analysis, we demonstrated that the hospital revenue can be a proxy variable for surgeons’ technical efficiency because they had a significantly positive correlation. The larger their revenues were, the more technically efficient they are. Their experience, medical school, sex, academic ranks, or surgical specialty did not have any significant predictive values for their technical efficiency. We calculated the coefficients by using natural logarithms of surgeons’ efficiency scores and revenues, and the coefficients represented elasticity. Therefore, an increase in revenue by 1% was associated with a 0.46% increase in efficiency score in the first model (Table 2) and with a 0.52% increase in the second model (Table 3). Both statistical models reached the same results. These findings confirmed that Japanese health care managers’ practice of evaluating surgeons with their revenue is robust. This is the first study that demonstrated that surgeons’ technical efficiency had a positive relationship with their revenue.
Although the revenues did not take the inputs into account, the inputs played only a minor role in determining surgeons’ technical efficiency. For example, the number of assistants varies among different surgical procedures, but their variation is small compared with their revenues. The number of assistants varied from 1 to 3 in most surgical cases, but their revenue varied more than a hundred times depending on their technical difficulty.
Surgeons with high surgical volume were technically less efficient by statistical significance. We calculated the coefficients by using natural logarithms of surgeons’ efficiency scores and surgical volume, and the coefficients represented elasticity like the case in revenue. Therefore, an increase in surgical volume by 1% was associated with a 0.48% decrease in efficiency score in the first model (Table 2) and with a 0.54% decrease in the second model (Table 3). This may be because surgeons with high surgical volume are likely to perform more difficult surgery and their efficiency was reduced by these difficult cases. However, the exact reason for our finding was unknown from our data.
Unlike our previous results, 6 surgical specialty did not have any predictive value for surgeons’ technical efficiency. This may be due to the difference in statistical analysis. We used a cross-sectional model in the present study while we analyzed our panel data in the previous one. 6 Another possible explanation is multicollinearity between revenues and surgical specialty. We demonstrated in our previous studies that the surgeons at cardiovascular, thoracic, and neurosurgical departments made significantly larger revenues per case for the hospital.4,5 Surgical specialty and revenues contained redundant information. This positive correlation between the 2 regressors might have caused surgical specialty to be unpredictive for efficiency scores.
There are some limitations in our study. First, we simply considered the number of assistants without taking their experience into account. It is obvious that a full surgeon of lesser rank is not equivalent to junior surgical trainees in assisting surgery. An unequal distribution of residents with different experience is also likely. On services like cardiovascular, thoracic, and neurosurgery, more senior trainees need to be present, and it is unlikely that a junior trainee would get to do anything technically, or perhaps even scrub. However, the detailed data were unavailable. 25 Second, this is a study conducted in a single large teaching hospital in Tokyo, Japan. Our surgeons may not represent all the surgeons. However, there is an advantage to studying surgeons’ technical efficiency in a single hospital. As 1 of the significant resource inputs is ancillary services such as operating room nursing practices and availability of support personnel, all these factors are held constant in a single hospital. Comparing surgeons in different hospitals can be misleading if some ancillary services are more efficient than others. By comparing surgeons in the same institution, they all face the same systemic advantages and disadvantages of ancillary services. 26 Third, there remains some points that could not be explained in the present study. For example, we cannot fully know whether or not high volume surgeons do more difficult cases. We should perform specialty-specific subgroup analysis to answer these questions. However, our sample size (average 20 surgeons in each specialty) was too small to reach any meaningful conclusions.
In conclusion, we demonstrated that surgeons’ revenues can serve as a proxy variable for their technical efficiency.
Footnotes
Authors’ Note
The Teikyo University Institutional Review Board approved this study.
Declaration of Conflicting Interests
The author(s) declared no potential conflicts of interest with respect to the research, authorship, and/or publication of this article.
Funding
The author(s) disclosed receipt of the following financial support for the research, authorship, and/or publication of this article: This work was supported by Japan Society for the Promotion of Science (JSPS) KAKENHI Grant Number 17K09247 to Dr Yoshinori Nakata.