
Abstract
A validity test was conducted to determine how care level–based nurse-to-resident ratios compare with actual daily care times per resident in Germany. Stability across different long-term care facilities was tested. Care level–based nurse-to-resident ratios were compared with the standard minimum nurse-to-resident ratios. Levels of care are determined by classification authorities in long-term care insurance programs and are used to distribute resources. Care levels are a powerful tool for classifying authorities in long-term care insurance. We used observer-based measurement of assignable direct and indirect care time in 68 nursing units for 2028 residents across 2 working days. Organizational data were collected at the end of the quarter in which the observation was made. Data were collected from January to March, 2012. We used a null multilevel model with random intercepts and multilevel models with fixed and random slopes to analyze data at both the organization and resident levels. A total of 14% of the variance in total care time per day was explained by membership in nursing units. The impact of care levels on care time differed significantly between nursing units. Forty percent of residents at the lowest care level received less than the standard minimum registered nursing time per day. For facilities that have been significantly disadvantaged in the current staffing system, a higher minimum standard will function more effectively than a complex classification system without scientific controls.
Keywords
Introduction
Different insurance systems use classifications of care levels and nurse-to-resident ratios to distribute resources. These systems suggest equal distribution of resources, but it is uncertain whether the desired outcome is accomplished. German, Spanish, and Japanese long-term care insurance systems define levels of care, although the details of their systems differ. 1 In Germany, these care levels are used to improve nurse-to-resident ratios and define staffing standards. Safe staffing standards are needed to ensure nursing quality.
Nurse classification systems are known to be imperfect. This article addresses the consequences, for the available resources, which result from the binding and comprehensive use of an imperfect classification system.
Background
The International Council of Nurses (ICN) has postulated that safe systems of staffing are needed to preserve the quality of care. 2 The development of classification systems is an important research issue that can help ensuring safe systems of staffing. The ICN communiqué refers to the need for “safe staffing levels” in all settings and discusses the common problem of understaffing across health care settings in different countries. A safe staffing system should be built on transparent, independent, and empirically tested professional care criteria.
Isfort 3 compiled 85 different procedures from 600 publications in the field of care-relevant patient classification systems. In the field of long-term care, however, there are 2 systems that have been empirically tested: Resource Utilization Groups (RUGs) and PLAISIR (Planification Informatisée des Soins Infirmiers Requis). 3 The German care levels are a classification system, the development of which was not theory based and has not been empirically tested, which has consequences for further development 4 and more often is a question of politics, rather than nursing science. In a comparison of 6 countries, wide variation in both nursing home staffing standards and staffing levels was identified. 5 German care levels from 1995 to 2016 were defined based on the amount of care and support time a person needs per day, a duration of time determined by an expert of the medical service of nursing assurance. Changes to the German care levels were made at the beginning of 2017, again without a period of scientifically supported testing or implementation. 4
The RUGs6,7 are based on 7 major qualification categories for a resident. Examples of these categories are “Extensive Services,” “Rehabilitation,” and “Special Care.” These main groups are further subdivided into subgroups. PLAISIR 3 tries to calculate the necessary resources in nursing care by means of an assessment of the necessary services and the time and frequency recorded per service.
In contrast to the German care levels, the RUGs are a classification system with a long history of empirically supported development. Numerous studies have been conducted to test the validity of RUGs in different countries.8,9 In England, the RUG-III system explained 56% of “care time.” 10 Differences among the 4 long-term care facilities that were included in the study were not analyzed. The US nursing home compare system does show variability between different facilities as to whether they meet expected staffing levels according to the RUGs. The RUGs classification system was developed in the United States to guide Medicare payments to nursing homes. This system is based on a patient assessment form known as the Minimum Data Set (MDS), which has undergone extensive research and development. The United States currently uses the MDS version 3.0.
Another well-known classification system, PLAISIR, was tested in Canada by Tilquin et al 11 and in Germany by Ascher and Höhmann. 12 Tilquin et al reported an explanation of variance of 78% in the so-called PLAISIR hours. The differences between the 183 long-term facilities in Quebec and the impact of organizational variables were not tested. Ascher and Höhmann 12 reported that the empirical direct care time in one German long-term care facility was only half that of the PLAISIR time. PLAISIR is not used in Germany, and only a few long-term facilities use the RUGs.
RUGs and PLAISIR are 2 important classification systems in long-term care.
Various attempts8-10 have been made to determine the explanation of different working time indicators. Stability across different organizations, thus far, has not been included in the validation studies of PLAISIR and RUGs.
Organizational differences are discussed by McGregor et al. 13 “Not for profit facility ownership is associated with higher staffing levels.” 13 Differences in for-profit and nonprofit long-term care facilities are reported by Harrington et al. 14 For-profit and nonprofit facility ownership should be included in analyses.
In the United States, minimum nurse staffing levels according to resident acuity are identified. “CMS’s Medicare Nursing Home Compare Five-Star Rating System developed a method to determine the minimum nurse staffing levels needed for each US nursing home based on its resident acuity.” 15 The federal government has standards, but, in fact, each state may develop its own minimum staffing standards. Resident acuity is identified by RUGs. The expected nursing hours are based on staff time measurement studies by the Center of Medical Science. 16 In the so-called Medicare Skilled Nursing Facility (SNF) transparency data, 17 different RUGs are described.
The SNF public use file (PUF) also includes information on 2 categories of RUGs for patients who receive a significant amount of therapy. To qualify for an Ultra-High (RU) Rehabilitation RUG, a resident must receive at least 720 minutes of therapy each week, among other criteria. Similarly, in the case of the Very High (RV) Rehabilitation categories, the resident must receive at least 500 minutes of therapy each week. 17
Therapy Minutes, as RUG criteria for classification, are performance based. The services provided are used for classification purposes, and variance in provided services is not explained. Furthermore, the correlation between resident acuity and the reported nurse aid staffing is low. 18 But the RUGs are a transparent and empirically tested system. This distinguishes the RUGs from the German care levels.
In Germany, 4 levels of care were used between 1995 and 2016 according to the Social Code, Book XI. The validity of these 4 groups in terms of explaining staffing time was tested in 2013 19 and in 2015 by Rothgang and Hasseler. 20 The time needed for all activities performed by a staff person during 2 days was observed in the PiSaar study. 19 In Rothgang and Hasseler’s study, 20 self-reports of time for activity by the staff person were collected. In Brühl and Planer, 19 the care levels explained only 29% of daily care and support time. Rothgang and Hasseler 20 did not calculate an explanation of variance rate in their study. Nurse-to-resident ratios according to care levels are regulated in the 16 federal states of Germany, including the Saarland, where the study was conducted. The Saarland was the only federal state in the study.
A maximum of 0.49 nurses per resident is allowed for residents at a care level 3, and a minimum of 0.125 nurses per resident is permitted for those at a care level 0 (framework contract following Article 75, para. 1). Fifty percent must be registered nurses. The rule is applied in every long-term care facility in the Saarland. The staffing ratios at each of the 4 care levels are initially based on a consensus process without scientific evaluation. In this article, we compare the staffing guidelines for the german classification system with the actual staffing levels in nursing facilities.
The levels of care were defined by the amount of time that a patient needs help per day. A resident is assigned to a care level based on an individual assessment by an expert of the medical service. For example, residents at care level 1 need assistance at least once daily for personal care, nutrition, or mobility, including at least 2 tasks from 1 or more areas. In addition, over the course of a week, residents at this care level need assistance with domestic care. The residents’ need for basic care and housekeeping must be at least 90 minutes per day, of which more than 45 minutes are for basic care. At care level 2, the need for basic care must be at least 120 minutes, and at care level 3, the need for basic care must be more than 240 minutes per day. In addition, the time for housekeeping is added at every care level. Although the care levels were later used to define different nurse-to-resident ratios in long-term care, the assessed care needs were related to necessary nonprofessional care time in home care. The current study sought to assess the impact and validity of the care levels. Variance in care levels within and between long-term care facilities was used to explain variance in care time.
Study
Aims
We investigated whether direct and indirect care time (definition in the “Outcome Variables” section) vary between different long-term care facilities using identical nurse-to-resident ratios and care levels and, if so, to what extent this variation can be explained by variables on the organizational and resident levels.
Design
The data used for this analysis were taken from the “Pflegebedarf im Saarland” (PiSaar) study 19 on the need for care in the Saarland. We collected real-time measures for care individually for every resident across 48 working hours. A total of 61 long-term care facilities with 68 nursing units participated.
Every long-term care facility could opt for a full or partial examination. A full examination meant the entire facility; in a partial examination, only 1 nursing unit was integrated. In the case of a partial survey, the organizational unit was randomly selected on the morning of data collection.
Participants
As shown in Figure 1, a total of 61 of the 120 inpatient long-term care homes, with 68 nursing units and 2178 residents in the Saarland, participated in the time survey. The Saarland was the only federal state that was integrated. A minimum of 50 nursing units, with at least 10 residents, is needed to identify 2-level zero models with varying constants and a power of .80. This finding was the result of a power calculation in a simulation. 21
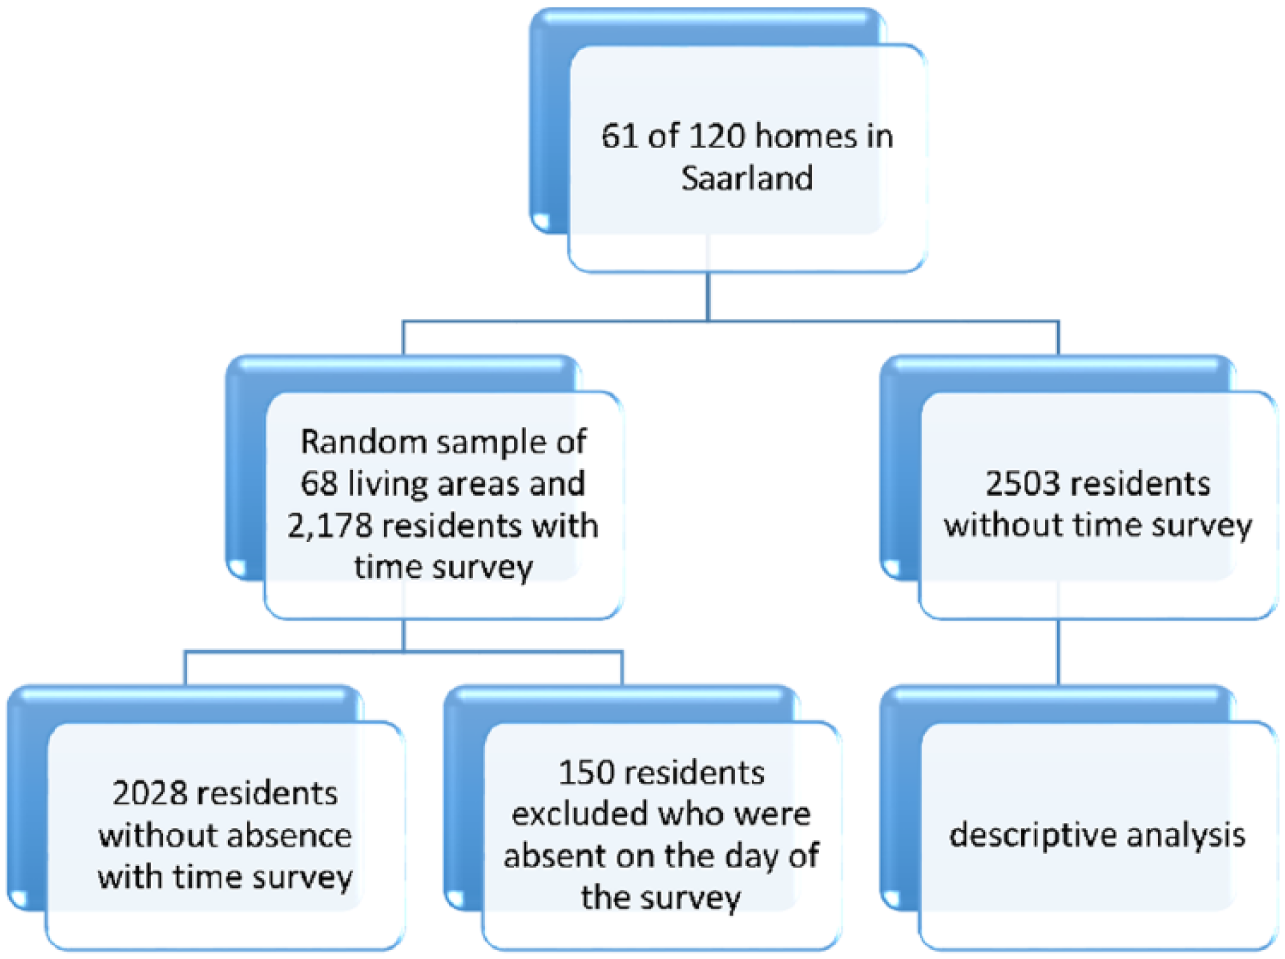
Flow chart of study population.
Data Collection
All participating inpatient nursing homes were under a supply contract covered by §72 of the German Social Code, Book XI. The staff and residents of the institutions were informed of the study in informational sessions and could decide whether to participate. The data were anonymized and were not collected if residents did not consent, including time records. Data were collected over 3 consecutive working days across 48 working hours, and reflected observation of all resident-orientated activities performed by staff during the 48 working hours. Each member of staff was observed by one observer. All direct care was measured generally, without specifically defining activity type. Staff time spent in nonwork activities (eg, breaks and meals) was excluded. Interobserver agreement was not measured, but more than 500 observers were trained following a detailed manual.
Less than 1% of the residents or their caregivers refused to participate.
Data were collected for the variables given below.
Outcome variable
“TotalCareTime.”
The outcome variable was the total care time “TotalCareTime” per 2 resident days. This variable included registered and nursing assistance care hours.
Taken together, direct and indirect care are patient assignable time,22,23 which differs from the time that might be involved in managing the nursing unit, educating nursing students, attending staff meetings, and other such tasks. 24
During the 3 consecutive working days, “TotalCareTime” was measured. Resident-assigned working time, “TotalCareTime,” represented 40% of the working time calculated based on the number of nursing staff present during data collection at all care levels. “TotalCareTime” was treated as a continuous interval–scaled variable that represented the time devoted to care and support for each resident per 48 hours. The minimum was 5 minutes, and the maximum was 661 minutes.
Explanatory variables
Hours of registered nursing time (HoursRNTime)
We created a variable to reflect the number of hours devoted by registered nurses to each resident across 2 working days, “HoursRNTime.” The calculations were made for each day. The minimum value of this variable was 0.74 hours, and its maximum value was 2.9 hours; the mean was 1.69 hours. In the multilevel analysis, the variable was centered to the grand mean. Although the percentage of registered specialists should not fall under 50%. Long-term care facilities are free to employ more than 50% specialists. The amount of time to which registered nurses were assigned to residents varied widely. A higher rate of registered nursing time assigned to residents could increase the impact of care levels on the “TotalCareTime.”
Care levels
In the Saarland, as in the other German federal states, up to 2016, nurse staffing levels were based on the 4 levels of care in the Social Code, Book XI (0-3). A care level is assigned to every resident, and staffing is contingent on that care level. Care levels had 4 possible values from levels 0 to 3; level 4 was reserved for cases with extreme care needs. A total of 298 of the 2028 residents were at level 0, 840 were at level 1, 670 were at level 2, 217 were at level 3, and 3 were at level 4.
Size of residential areas
We controlled for the size of the residential area, which was measured by the number of places for residents that are available. The number of nursing places ranged from 14 to 62.
Ownership
We distinguished between for-profit and nonprofit facility ownership. As already mentioned, differences in for-profit and nonprofit long-term care facilities are reported by Harrington et al. 14 For long-term care facilities, 16 nursing units belonged to for-profit facility owners, and 52 nursing units belonged to nonprofit facility owners.
Ethical Considerations
Compliance with the following ethical principles has been approved: the right to self-determination, informed consent and anonymity, the right to integrity and protection from impairments, and a detailed privacy policy. The study was explained to residents and staff. Residents and staff knew what activities we were observing and that we were not evaluating the adequacy of their performance.
Data Analysis
Hierarchical linear modeling (HLM, version 7; Scientific Software International, Lincolnwood, Illinois) was used to produce the deviance statistics. 25 The quality of 4 multilevel models was compared in terms of differences in deviance.
We used the full maximum likelihood estimation. An empty random intercept null model, a fixed slope and a random intercept, and a random slope and random intercept model were compared. In most applications of multilevel models in nursing science, only local model tests for single variables are published.26-29 We compared different models in overall model tests. An indicator for the quality of the compared models was the reduction of unexplained variance between the different long-term care facilities. Three single explanatory variables on the organizational level were tested: size, ownership, and hours of registered nursing time. In the comparison of the models, we took the empty so-called “null model” (model 1) with only a random intercept as a reference. In model 2, we used a random intercept and a fixed slope model with the care levels as fixed explanatory variables. Model 3 combines random intercepts with a random slope for the care levels, so that we can test whether the impact of the care levels varies significantly between the different long-term care facilities. In Model 4, we integrated organizational variables to examine whether they can explain the varying impact of the standardized care levels and nurse-to-resident ratios.
Detailed description of the 4 tested statistical multilevel models is given below.

On levels 1 and 2, the constant β0j is explained by a fixed effect γ00 and a random effect u0j. Thus, the mixed model results from

The first model contains no explanatory variables and is the basic model to test the influence of the long-term care facilities on care and support time.
“TotalCareTime” = β0j + β1j*(CareLevel ij ) + rij. On the organizational level, the constant β0j is divided into the constant γ00 and a random part u0j. The combined model with both levels is then

The second model tests the impact of the care levels, as a fixed variable across all nursing units.
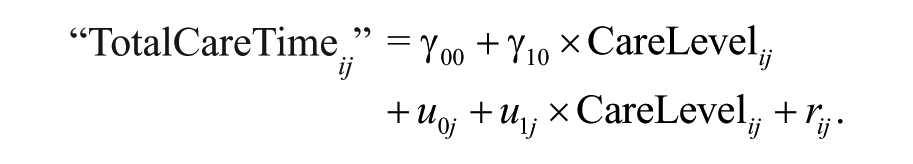
The third model tests whether the impact of care levels varies across different nursing units.
The combined model with both levels is then
Findings
The 2028 study participants consisted of 1549 women and 479 men. The participants’ ages ranged from 31 to 110 years with a mean of 89 years. Table 1 shows descriptive statistics. Figure 2 shows the care levels in 68 nursing units. There is a big range of “TotalCareTime” in every care level.
Descriptive Statistics.


Care levels of 2028 residents in 68 different nursing units.
Four models were tested. Table 2 shows the results for the 4 tested models.
Multilevel regression models of “TotalCareTime.”

Significant at .05.
Model 1 tested the relative proportion of variance explained by the residents being clustered in 68 nursing units in 61 long-term care facilities. Care time should not depend on the long-term care facility. The variance proportions of the variable “TotalCareTime” point to an intraclass correlation coefficient of 0.14 in model 1. A total of 14% of the variance is explained by the differences between 68 nursing units in model 1 (the relative amount of explained variance between the 68 nursing units with care levels is 0.14 = 1303 / 7910 + 1303). The assumption that the total care time that was given to a resident would be independent from residential area was thus violated.
Model 2 tested the relative amount of variance in “TotalCareTime,” as explained by the care levels when their slope is fixed. In model 2, the care levels deliver a significant improvement in the explanation of “TotalTime,” but the proportion of explained variance gained by the integration of care levels is only 5% (the relative amount of explained variance with care levels is 0.19 = 1145 / 5018 + 1145). The care levels with fixed slopes improve variance explanation less than the long-term care facilities do with random intercepts.
The explanation of “TotalCareTime” is again improved in model 3. The variance of the intercept between different nursing units remains significant. The impact of care levels differs significantly between the nursing units. The estimate for the impact of the care levels is 66.29 minutes, but the variance between the nursing units is large. If you take 2 standard deviations 30 of the slope variance of the care levels (2 × 17.42), 95% of the coefficients for the impact of care levels would lie between (64.28 – 2 × 17.42) 29.44 minutes and (2 × 17.42 + 66.29) 99.12 minutes. Therefore, very large differences are possible, and care levels cannot be fixed in their impact on “TotalCareTime” between different long-term care facilities.
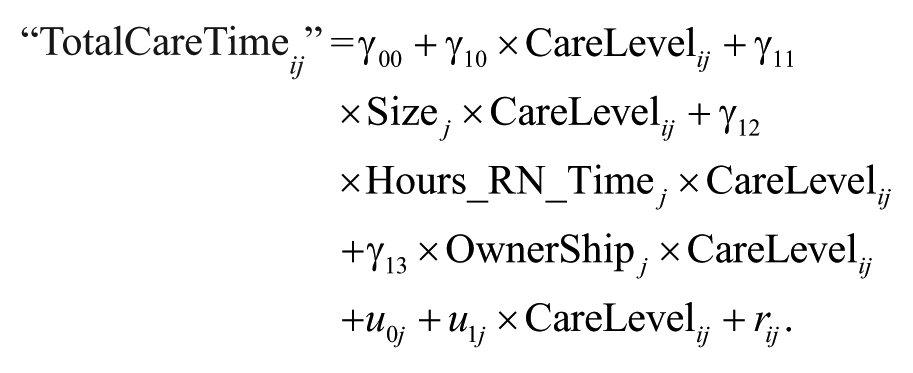
Model 4 is again a significant, but very poor improvement in the explanation of “TotalCareTime.” For for-profit ownership, increasing the size diminishes the impact of the CareLevels on “TotalCareTime,” and the hours of registered nursing time increases the impact of care levels on “TotalCareTime.”
The minimum nurse-to-resident ratio is 0.125 nurses per resident or 1 nurse per 8 residents at care level 0 with 50% registered nurses. The daily working time of nurses is 7.7 hours, so this minimum nurse-to-patient ratio would guarantee 58 minutes working time per day and resident. “TotalCareTime” was resident assignable time which represents only 40% of the total available working time. Forty percent of 58 minutes is 23.2 minutes. Four percent of the 2028 residents receive less than 23.2 minutes of “TotalCareTime” per day within the system of care level–based nurse-to-resident ratios.
Twenty-nine minutes of the 58 minutes (50%) of “TotalCareTime” must be with a registered nurse. By our calculations, only 40% of nursing staff time was assigned to residents.
Forty percent of 29 minutes would guarantee residents at care level 0 a minimum of 12 minutes of assigned registered nursing time per day; however, 40% of residents at this care level received less than this duration. At care level 1, the guaranteed minimum registered nursing time is 64 minutes; 40% of 64 minutes is 26 minutes, and 47% of residents at this care level received less than this duration. At care level 2, a minimum of 85 minutes of registered nursing time is guaranteed; 40% of 85 minutes is 34 minutes, and 20% of residents at this care level received less than this duration. At care level 3, a minimum of 113 minutes of registered nursing time is guaranteed; 40% of 113 minutes is 45 minutes, and 15% of residents at this care level received less than this duration. The percentage of residents who do not receive the minimum guaranteed registered nursing time increased from 15% at care level 3 to 40% at care level 1.
Discussion
Our major finding concerns the variance of “TotalCareTime” between nursing units, which cannot be explained by constant weights for care levels across different long-term care facilities. The impact of care levels on “TotalCareTime” should not be fixed between different long-term care facilities, as in model 2, but should be set at random, as in model 3. The slope variance component for care levels between the different long-term care facilities is significant in model 3.
In model 4, organizational variables are integrated. The model, as a whole, is not a great improvement in comparison with model 3. We do know that a large variance exists between different long-term care facilities in “TotalCareTime” and in the impact of care levels on “TotalCareTime,” but we cannot explain it with the tested organizational variables. Even the hours of registered nursing time have no influence on the impact of the care levels.
Care levels are a significant variable and improve the developed multilevel models, but the differences between different long-term care facilities actually increase when a parameter for random variation of the impact of care levels is integrated. The explanation of “TotalCareTime” is significantly improved from model 1 to model 3 when a chi-square-based significance test of the deviance differences is taken into account. However, the main result is the large differences between the nursing units, and these differences remain important in all models.
If varying care and support time between different long-term care facilities cannot be explained by care levels, such variance is reflective of the instability of the system’s state-regulated staffing system. The individual level of explaining the variance of direct and indirect care time would have to be extended to the organizational level, which is influenced by the classifying authority. The same nurse-to-resident ratios would indicate different, available indirect and direct care and support times in different long-term care facilities. If the differences between long-term care facilities in the use of care level–based nurse-to-resident ratios are so great that even minimum standards cannot be guaranteed, then minimum levels can be better defined by simple minimum nurse-to-resident ratios without care levels. Simple nurse-to-resident ratios are only a good solution if regulatory personnel have valid methods to evaluate what staffing is present. This study used observational procedures that would produce more accurate staffing data than self-reports by facilities which might inflate staffing numbers.
Further research is needed to explain the random variations in “TotalCareTime.” Such research could include a review of the medical services provided through long-term care insurance; of the high variance in care, which changes more frequently than an assessment of care levels is repeated; and of the management of nursing homes.
Limitations
The time measurement of 2 working days includes an unknown sampling error. The power with 68 nursing units is too low to test cross-level interaction models, which might be interesting, because the impact of organizational variables could be indirectly modeled by their influence on the impact of resident variables. Variance of the tested organization variables is very large, making parameter estimation difficult. The impact of other available organizational models (such as walking distances in square meters) could not be integrated into the current models; a parameter estimation was impossible due to the low number of long-term care facilities and the high variance across these variables. For complex models with more parameters or interactions or for cross-level models, more than 68 nursing units would be important.
Conclusions
Even minimum standards are not guaranteed by care level–based nurse-to-resident ratios. These assessment-based assignments are strongly dependent on medical service expertise. The classification system concept lacks theory-based development. The concept of independence is important but is not the only relevant issue in a classification system. Residents’ health literacy and different care concepts produce large variance in their needed care time.
There are federally organized advisory and audit authorities, but they use the care levels without testing them empirically.
Unless investigated empirically, the size of the resulting staffing differences between different long-term care facilities is unknown when nurse-to-resident ratios are based on a not functioning classification system, similar to care levels.
The worse the classification system performs, the higher the power of the classifying authority is when the system is not tested empirically.
Resident variables–focused research is extended to the organizational level because of its strong impact on nursing when the impact of care levels is different in every long-term care facility.
A simple minimum registered-nurse-to-patient ratio of 1 nurse to 8 residents would help 40% of the residents who receive less “TotalCareTime” than the lowest care level should guarantee. An unstable and complex classification system of care levels is more in the interest of the classifying authority than in the interest of the professional caregivers. If classification systems are used, they must be held open for empirical testing and further development. The process of classification must be transparent and empirically controlled. If minimum standards in staffing are not guaranteed in a complex and classifying-authority-related system, as they are in the care level–based nurse-to-resident ratios, then simple minimum standards would be a better alternative. Higher minimum standards are necessary to improve the quality of care in long-term care facilities. 14 Complex systems used by classification authorities can obscure this fact and thus prevent development in this field. Setting minimum nurse-to-resident ratios is one way to address the problem for residents in the lower level categories. Staffing must be adjusted to meet the acuity needs of their residents. Research on what the staffing levels should be to meet the needs of residents is needed. In Germany, a new classification system is established since the beginning of 2017. This new system is topic to our next study with more than 80 nursing units which started in 2016 and will be finished in 2018. This first data shows that it will be even worse than the old care levels. We recommend new and much higher minimum staffing ratio requirements for each care home, regardless of patient classification. For facilities that have been significantly disadvantaged in the current staffing system, a higher minimum standard will function more effectively than a new, complex classification system without scientific controls.
Given the flaws in the classification systems, one might be better off just having minimum staffing standards as policy and practice.
Footnotes
Declaration of Conflicting Interests
The author(s) declared no potential conflicts of interest with respect to the research, authorship, and/or publication of this article.
Funding
The author(s) disclosed receipt of the following financial support for the research, authorship, and/or publication of this article: This research was supported by the Care Society of the Saarland.