
Abstract
The objective of this study was to assess trends in health insurance coverage, health service utilization, and health care access among working-age adults with and without disabilities before and after full implementation of the Affordable Care Act (ACA), and to identify current disability-based disparities following full implementation of the ACA. The ACA was expected to have a disproportionate impact on working-age adults with disabilities, because of their high health care usage as well as their previously limited insurance options. However, most published research on this population does not systematically look at effects before and after full implementation of the ACA. As the US Congress considers new health policy reforms, current and accurate data on this vulnerable population are essential. Weighted estimates, trend analyses and analytic models were conducted using the 1998-2016 National Health Interview Surveys (NHIS) and the 2014 Medical Expenditure Panel Survey. Compared with working-age adults without disabilities, those with disabilities are less likely to work, more likely to earn below the federal poverty level, and more likely to use public insurance. Average health costs for this population are 3 to 7 times higher, and access problems are far more common. Repeal of key features of the ACA, like Medicaid expansion and marketplace subsidies, would likely diminish health care access for working-age adults with disabilities.
Keywords
Americans with disabilities consume far more health services than those without disabilities. 1 Average expenditures for health care among those with disabilities are 5 to 6 times higher,2,3 and they spend much more out-of-pocket. 4 People with disabilities are slightly more likely to have health insurance than those without disabilities, but they often report access problems even when insured.5-7 A broad variety of access problems have been observed among those with disabilities, from difficulty obtaining a usual source of care 8 or accessing basic needed medical care in a timely fashion 9 to lower rates of cancer screenings and treatment,10-12 as well as widespread difficulty in obtaining specialty services like rehabilitation, 13 medical equipment,14,15 or home care. 16 Consequently, affordable and comprehensive health insurance is a policy priority for this population.
Private health insurance coverage options for working-age adults with disabilities are relatively limited. 17 Due to low rates of workforce participation, most are not eligible for employer-based group coverage, and until recently, they were barred from the individual insurance marketplace due to preexisting condition exclusions, annual or lifetime limits, and extremely high costs. 18 Under these circumstances, many working-age adults with disabilities apply to the Social Security Disability Insurance (SSDI) or Supplemental Security Income (SSI) programs to become eligible for Medicare or Medicaid, a phenomenon we have described as Health Insurance–Motivated Disability Enrollment (HIMDE). 19
The Patient Protection and Affordable Care Act (ACA) of 2010 includes multiple provisions that were intended to improve access and affordability for working-age adults, including those with disabilities. 20 Specifically, the creation of state and federal health insurance marketplaces with guaranteed issue, 21 clearly enumerated essential health benefits, 22 and the expansion of Medicaid in participating states 23 were expected to improve coverage options for this population.
Preliminary studies confirm that insurance coverage for select subgroups of adults with chronic conditions improved following full implementation of the ACA in 2014.24-27 However, a more comprehensive assessment of changes in health insurance coverage of working-age adults with disabilities post ACA has not been published, and there is little public information on whether these coverage changes have coincided with improved access to care within this population.
Any modern health care system must engage with the question of how to appropriately cover citizens with high health care needs and limited financial resources. While the United States has increased coverage of its working-age disabled population over the years with their inclusion in Medicaid (1965), addition to Medicare (1972), and the ACA coverage expansions noted above (2014), gaps remain despite these policy changes. As the US Congress considers revision or repeal of the ACA, current, accurate, and readily accessible data on this vulnerable population will be required.
Methods
Data Sources
The National Health Interview Survey
The National Health Interview Survey (NHIS) is a cross-sectional household interview survey and is considered one of the most comprehensive and current sources of population data on health in the United States. 28 It is conducted by the National Center for Health Statistics (NCHS), one of the US Centers for Disease Control and Prevention. Survey staff conduct face-to-face interviews with an available respondent and ask questions about the health and disability status of all household members. More detailed questions are asked about a randomly selected adult and child in the household. Responses are entered into a handheld computer that codes conditional responses and performs real-time consistency checks.
Sampling and interviewing for the NHIS is done throughout the year. 29 The sampling strategy follows a multistage probability design: Households are selected from 428 (out of about 1900) primary sampling units (PSUs), which consist of metropolitan statistical units (MSUs) or of one or more contiguous counties. All major population centers are surveyed, along with a subset of PSUs stratified by state, region, and other key attributes. The surveys, codebooks, and data are available for download on the NCHS website at http://www.cdc.gov/nchs/nhis.htm.
We conducted a series of trend analyses using NHIS data from 1998 (when the survey was redesigned) to 2016, with an 18-year sample inclusive of 1 102 121 adults aged 18 to 64. We followed up these longitudinal analyses with a detailed snapshot of current coverage, health care use, cost, and access rates among working-age adults with and without disabilities, using data from the 2016 NHIS (sample n = 57 596 working-age adults).
The Medical Expenditure Panel Survey
To obtain additional information about health care utilization and associated costs, we also analyzed the 2014 Medical Expenditure Panel Survey (MEPS). The MEPS is sponsored by the Agency for Healthcare Research and Quality (AHRQ). 30 It is used extensively by the Congressional Budget Office to forecast national health insurance enrollment and associated program costs. 31
The MEPS household sampling frame is drawn from NHIS respondents, and participants are interviewed 5 times over a 2-year period. Health care events reported by household members (eg, hospital stays, outpatient services, emergency department visits, physician office visits) and associated costs are verified with backup surveys of medical providers and pharmacies.
The 2014 MEPS included 20 898 adults aged 18 to 64. The surveys, codebooks and data are available for download on the AHRQ website at https://meps.ahrq.gov/mepsweb/.
Defining Disability
We defined disability within the working-age population as self or proxy report of one or more of the following states:
Disability program participation: receipt of SSDI; receipt of SSI
Work disability: unable to work; limited in type or amount of work
Activity limitation: needs assistance with personal care (activities of daily living); needs assistance with household chores (instrumental activities of daily living)
Functional limitation: difficulty walking without special equipment; difficulty remembering or periods of confusion.
Using this approach, we identified 7466 working-age adults with disabilities in the 2015 NHIS and identified 2806 working-age adults with disabilities in the 2014 MEPS.
Analysis Strategy
NHIS and MEPS population weights, derived from the 2010 Decennial Census data, were used in all analyses. To adjust for the complex, multistage sampling in the NHIS and MEPS, we used Taylor Series linearization methods to compute standard errors (SEs) for all population estimates and group means. Wald chi-squares were used to test bivariate associations between groups.
To test how disability status and health system status are related to access problems, we developed a multiyear logistic regression model, controlling for other population factors previously associated with health care access in research literature.32,33
The dependent variable in the model was a created from 2 questions in the NHIS person file: “During the past 12 months, have you delayed seeking medical care because of worry about the cost?” and “During the past 12 months, was there any time when you needed medical care, but did not get it because you couldn’t afford it?” Respondents who answered yes to either or both questions were considered to have an access problem.
Our independent variables were disability status and health system change. We merged 2 years of preimplementation survey responses (2012 and 2013) and compared them with 2 years of postimplementation survey responses (2015 and 2016). Because 2014 was the first year of ACA implementation, and retroactive reports of insurance coverage might have been less accurate during this period, 2014 was omitted from our comparison. We then created a 4-level dummy variable (people with disabilities pre ACA, people with disabilities post ACA, people without disabilities pre ACA, and people without disabilities post ACA).
We tested this variable independently with access problem(s), and then simultaneously controlled for predisposing variables such as age (18-25, 26-39, 40-49, 50-64), gender (male, female), race (white, nonwhite), ethnicity (Hispanic, non-Hispanic), and enabling variables such as insurance coverage (private, public, none) and marital status (married, unmarried). We also ran separate confirmatory models assessing the marginal effect of ACA implementation on the disabled and nondisabled populations.
Results
Population Attributes of Working-Age Adults With and Without Disabilities
Based on analyses of the 2016 NHIS, we estimate that 23.6 million noninstitutionalized adults aged 18 to 64 currently have a disability. About 9.9 million adults in this subpopulation (42.0%) say they receive SSDI and/or SSI because of their disabilities.
Table 1 details the types and rates of limitation within this group. About 13.2 million (56.0%) are unable to work due to a physical or mental limitation, and another 5.7 million (24.2%) are limited in the type or amount of work they can do. Roughly 6.1 million (25.6%) report difficulty walking without equipment, and 4.9 million (20.8%) are limited by memory problems or periods of confusion. An estimated 5.2 million (22.1%) say they need assistance with household chores (instrumental activities of daily living), and 2.8 million (11.8%) need assistance with personal care (activities of daily living).
2016 Profile of Disability and Limitation Among Working-Age Adults (Aged 18-64) in the United States.
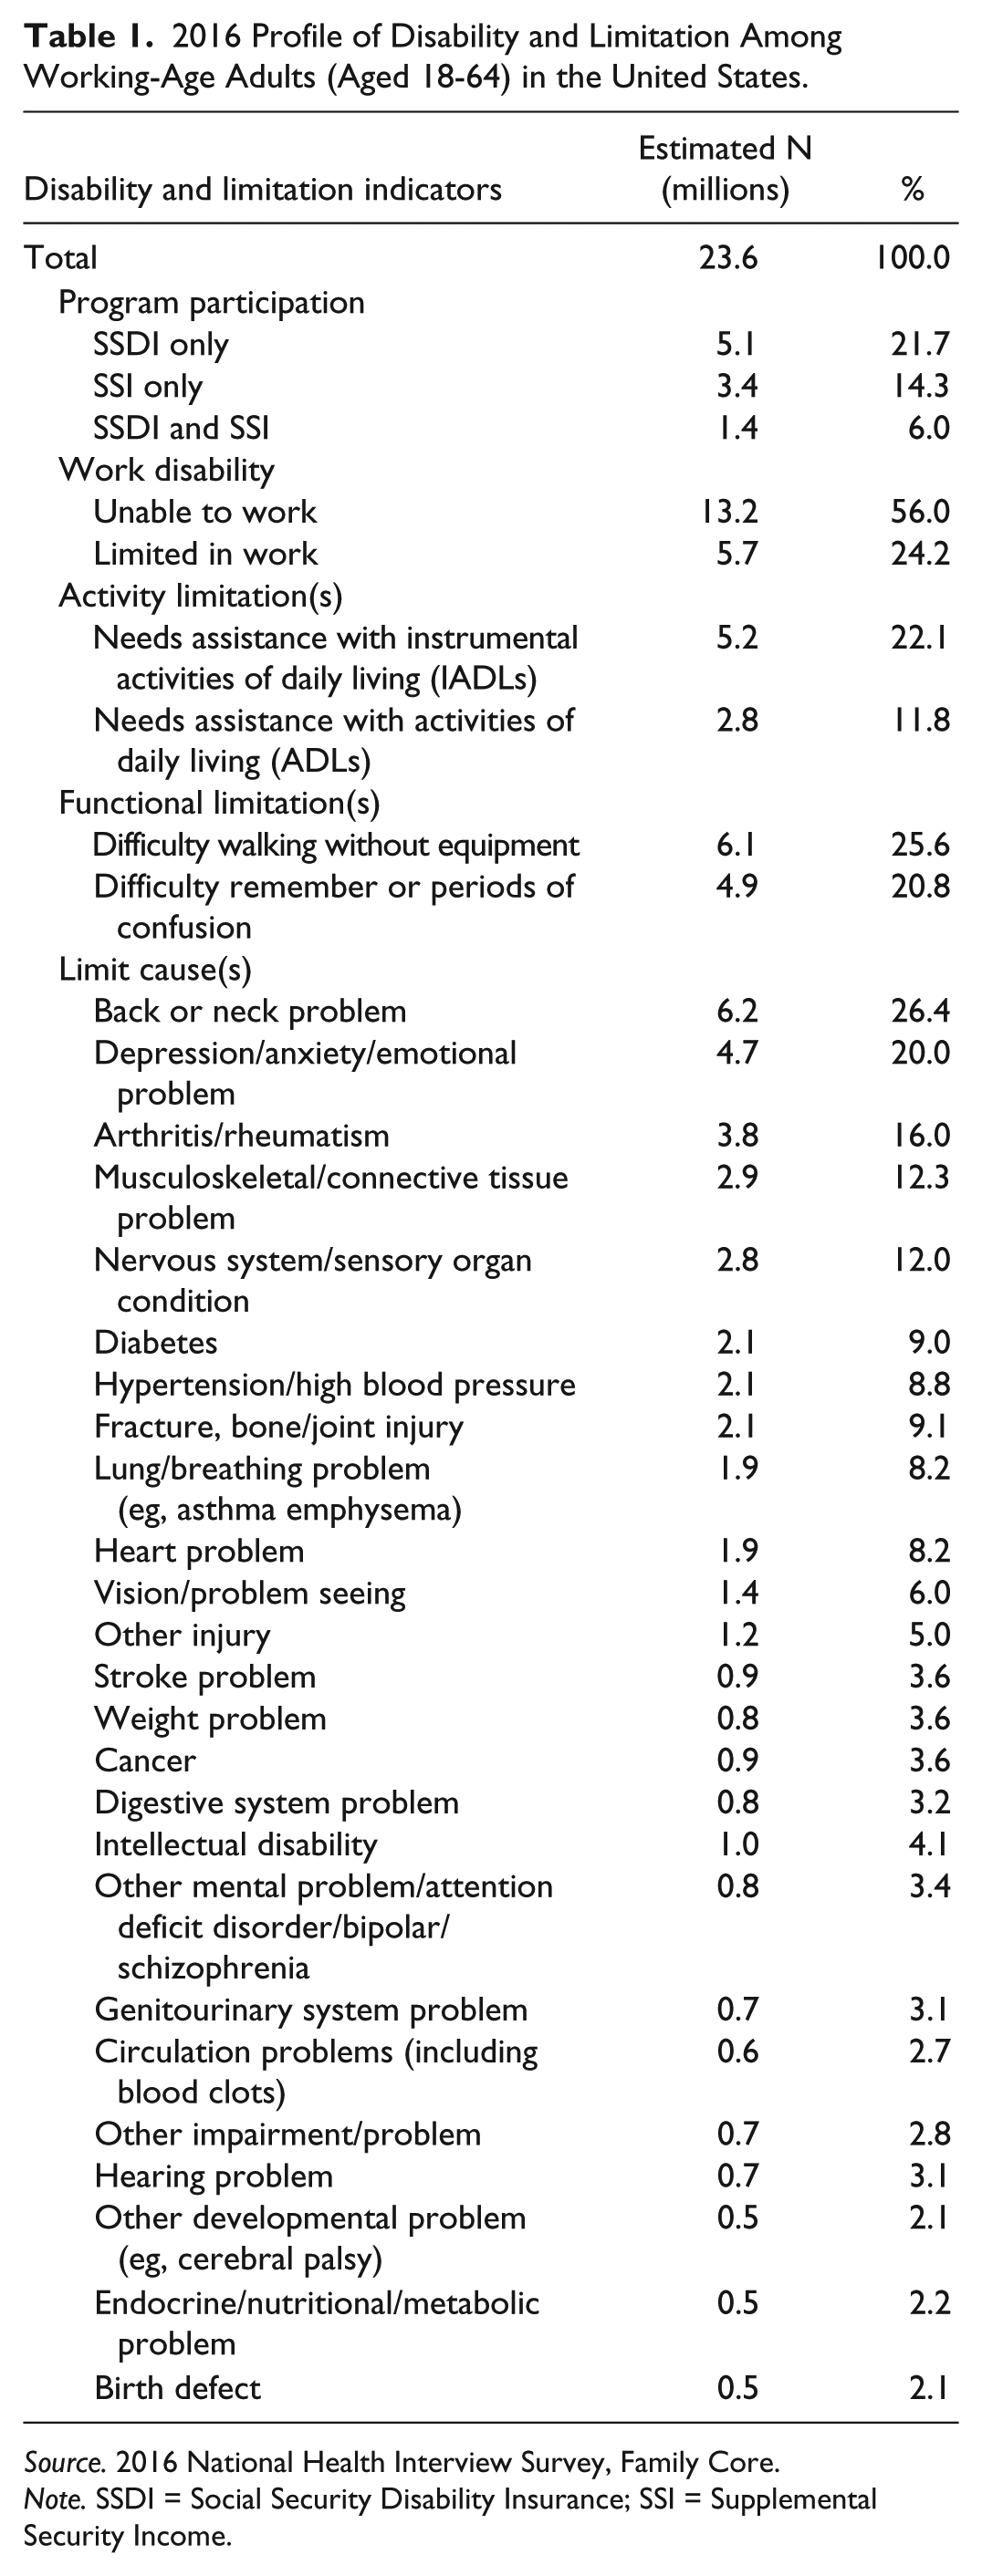
Source. 2016 National Health Interview Survey, Family Core.
Note. SSDI = Social Security Disability Insurance; SSI = Supplemental Security Income.
Respondents who reported 1 or more limitations were asked to identify the cause(s) of those limitations from a short list of conditions and problems. Most attribute their limit(s) to physical conditions like back or neck problems (26.4%), arthritis or rheumatism (16.0%), or musculoskeletal or connective tissue problems (12.3%). However, the second most commonly identified condition was psychiatric—about 20% say they are limited by depression, anxiety, or other emotional problems.
Working-age adults with disabilities are significantly older on average than those without disabilities—well over half (55.5%) were 50 or older, compared with 28.8% of nondisabled workers (see Table 2). Working-age adults with disabilities are more likely to be female than their nondisabled counterparts (53.4% vs 50.6%). They are also less likely to be married (39.4% vs 54.9%), more likely to be African American (17.2% vs 12.5%), and less likely to be Latino (12.7% vs 18.4%) or Asian (2.7% vs 6.9%). They are also much less likely to work (34.8% vs 83.0%) and more likely to have an income at or below the poverty line (26.2% vs 10.0%).
2016 Comparison of Sociodemographic Attributes and Socioeconomic Status Among Working-Age Adults (Aged 18-64) With and Without Disabilities.

Source. 2016 National Health Interview Survey, Family Core.
Note. P values for Wald chi-square tests. FPL = federal poverty level.
Health Insurance Coverage for Working-Age Adults With and Without Disabilities
Figures 1 and 2 show how health insurance coverage has changed for working-age adults with and without disabilities over the past 18 years. Insurance coverage for working-age adults with disabilities was slightly but consistently higher than for those without disabilities across this observation period, and both groups reported higher rates of coverage following full implementation of the ACA in 2014.
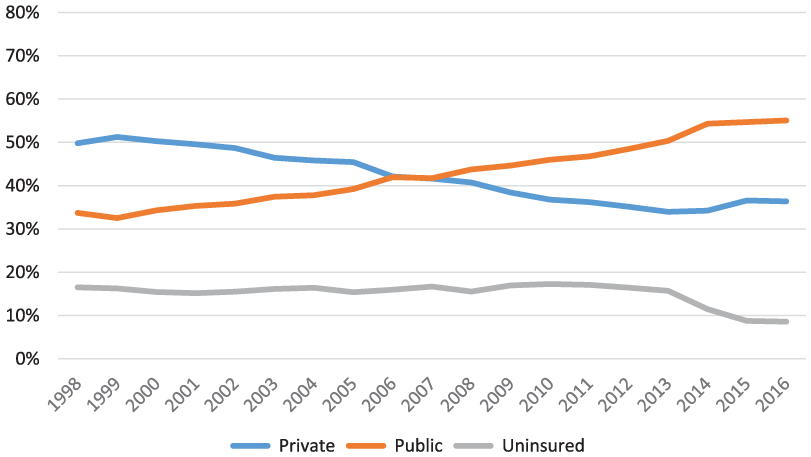
Insurance coverage trends for of adults with disabilities aged 18 to 64: United States, 1998-2016.

Insurance coverage trends for adults without disabilities aged 18 to 64: United States, 1998-2016.
The most striking difference between these groups is their use of private versus public insurance: Working-age adults with disabilities are far more likely to be covered by a public plan, whereas those without disabilities are more likely to be enrolled in a private plan. Indeed, the proportion of working-age adults with disabilities enrolled in private insurance peaked in 1999, and then dropped steadily until 2014. Concurrently, enrollment in public insurance programs grew, and by 2008, more working-age adults with disabilities were receiving public than private insurance.
Figure 3 shows coverage trends for working-age adults with disabilities in the 2 largest public insurance programs, Medicaid and Medicare (adults simultaneously enrolled in both programs, the so-called “dual eligibles,” are identified separately). The proportion of working-age adults with disabilities enrolled in Medicaid and Medicare grew steadily from 1998 to 2013, but Medicaid participation jumped following implementation of the Medicaid expansion in 2014 (from 22.9% in 2013 to 28.5% in 2016).
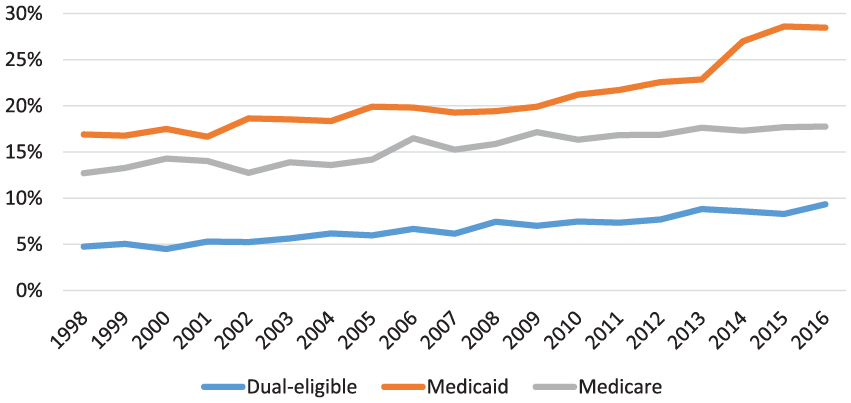
Medicare and/or Medicaid coverage trends for adults with disabilities aged 18 to 64: United States, 1998-2016.
Figure 4 shows more modest growth in Medicaid coverage among working-age adults without disabilities, and a smaller jump in coverage following the expansion. Because only a handful of nondisabled adults below age 65 receive Medicare (due to a deceased spouse or parent), this figure shows only Medicaid rates.
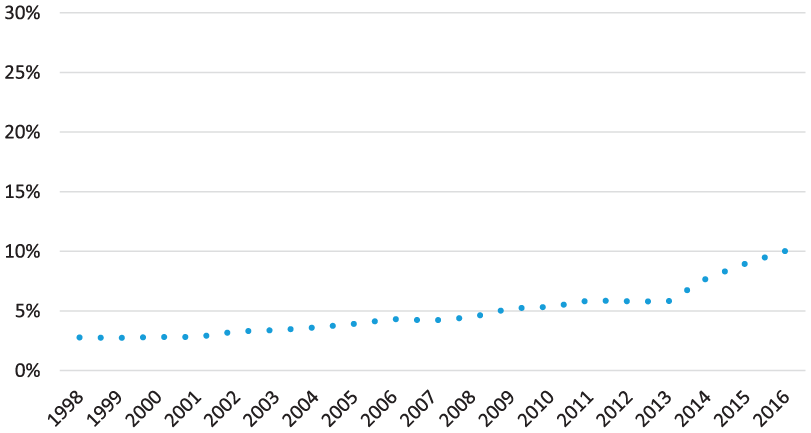
Medicaid coverage trends for adults without disabilities aged 18 to 64: United States, 1998-2016.
Table 3 offers a more detailed profile of current insurance coverage among working-age adults with and without disabilities. Those with disabilities are much more likely to rely on Medicaid (37.7% vs 10.0%), Medicare (27.1% vs 0.5%), or military benefits (6.0% vs 2.3%), and less likely to have private insurance coverage than their nondisabled counterparts (36.1% vs 73.1%). Notably, if working-age adults with disabilities were privately insured, they were more likely to report purchasing their coverage in a state marketplace (11.8% vs 6.6%). Adults with disabilities were less likely to be uninsured than those without disabilities (8.5% vs 12.6%).
2016 Comparison of Insurance Coverage Among Working-Age Adults (Aged 18-64) With and Without Disabilities.
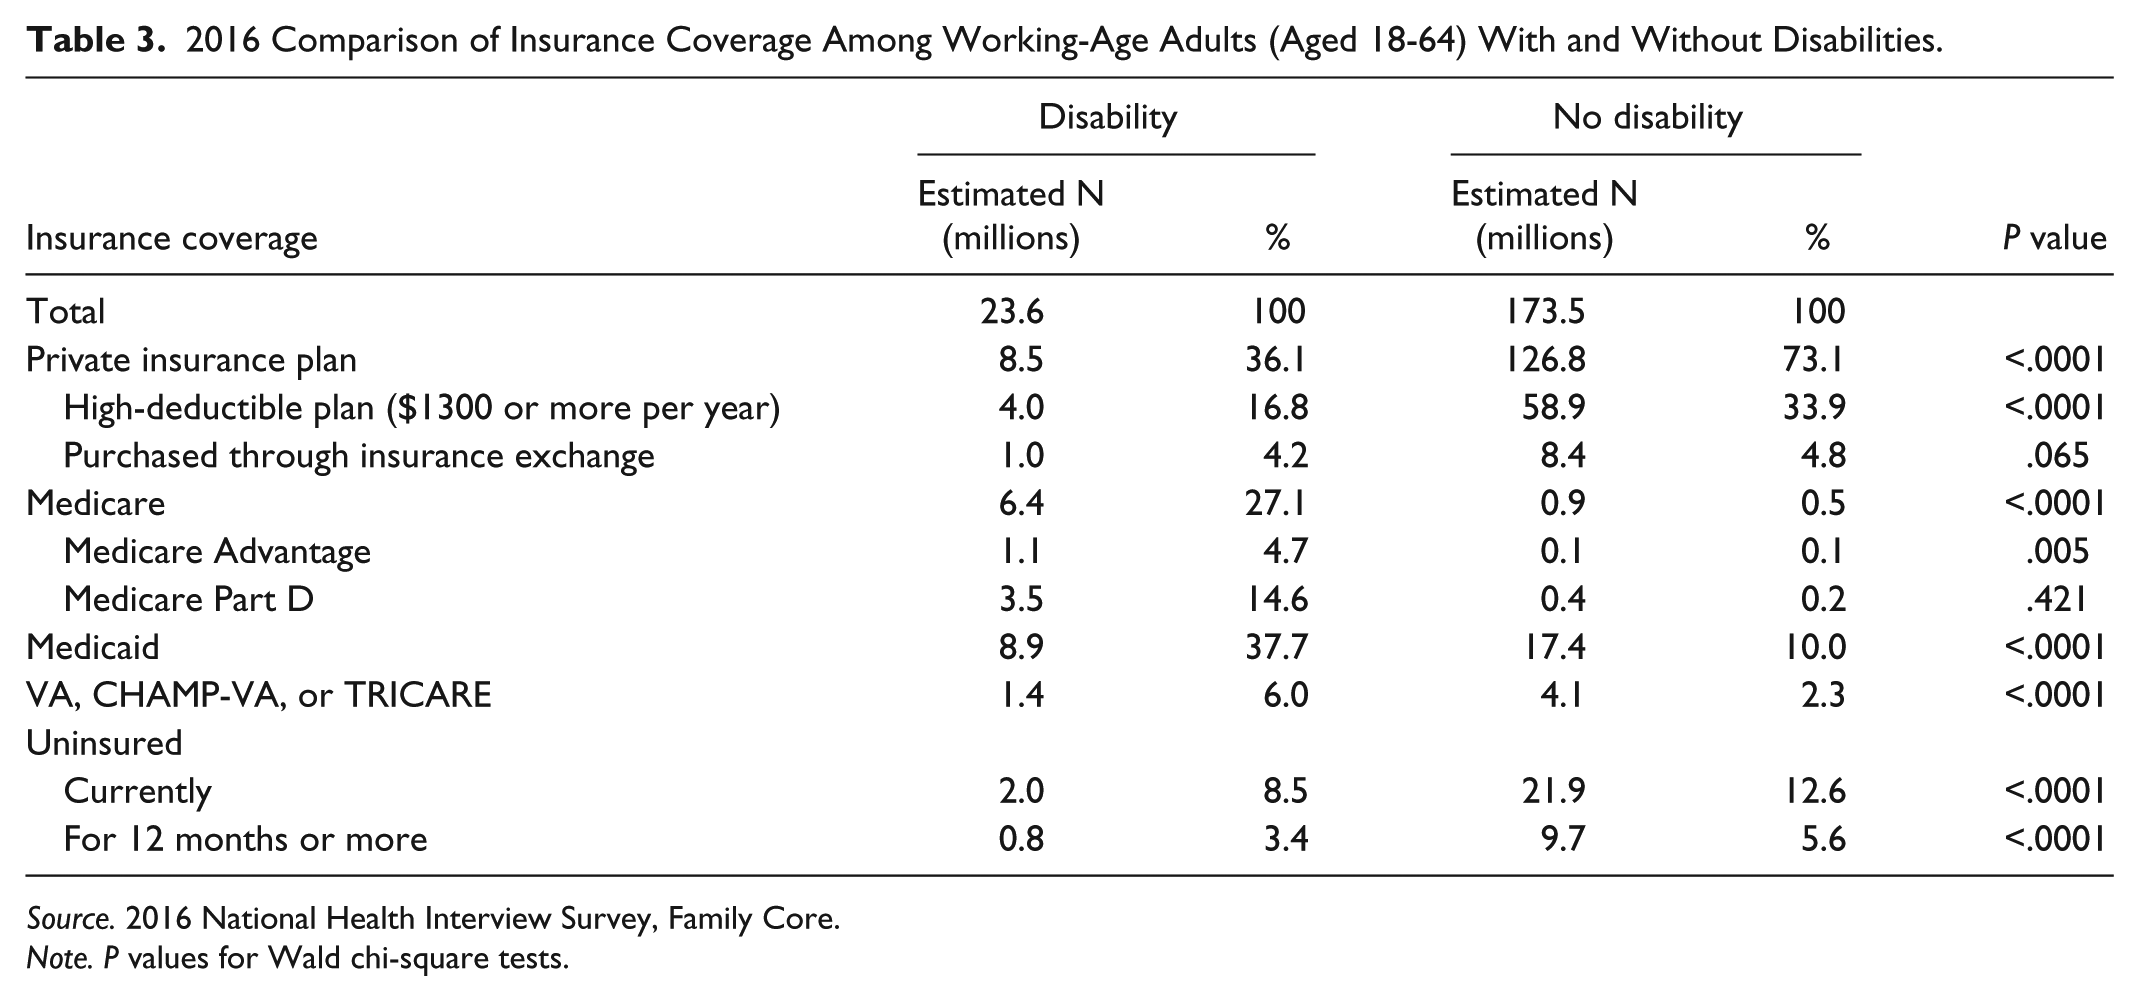
Source. 2016 National Health Interview Survey, Family Core.
Note. P values for Wald chi-square tests.
Health Care Utilization and Costs for Working-Age Adults With and Without Disabilities
Figures 5 and 6 show a slight decline in hospitalization rates and intensive use (10 or more visits) of outpatient physician services over the observation period among working-age adults with and without disabilities.

Utilization trends for adults with disabilities aged 18 to 64: United States, 1998-2016.
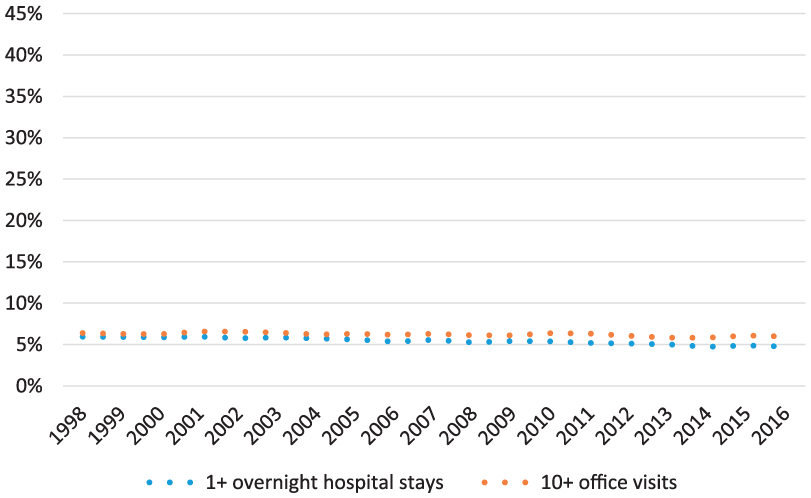
Utilization trends for adults without disabilities aged 18 to 64: United States, 1998-2016.
However, people with disabilities are far more likely to report intensive utilization. The current magnitude of these disparities is detailed in Table 4. Working-age adults with disabilities are nearly 6 times more likely to have seen a physician 10 or more times in the previous 12 months than those without disabilities (38.0% vs 6.0%), and more than 5 times as likely to have been admitted to the hospital (19.4% vs 4.7%).
2016 Comparison of Health Care Utilization Among Working-Age Adults (Aged 18-64) With and Without Disabilities.

Source. 2016 National Health Interview Survey, Family Core.
Note. P values for Wald chi-square tests.
To further assess these disparities in health care utilization and associated costs, we compared average annual costs among working-age adults with and without disabilities immediately following the ACA, using data from the 2014 MEPS (see Table 5).
2014 Comparison of Health Care Utilization and Associated Costs Among Working-Age Adults (Aged 18-64) With and Without Disabilities.

Source. 2014 Medical Expenditure Panel Survey.
Note. P values for Wald chi-square tests.
The differences between these groups were stark: Mean total health care costs for working-age adults with disabilities were nearly 5 times higher than for their nondisabled counterparts ($13 492 vs $2835). Much of this difference was due to higher rates of inpatient and outpatient hospital use among adults with disabilities. However, the largest difference was in the area of prescription costs—adults with disabilities filled more than 5 times as many prescriptions as those without disabilities (34.0 vs 6.4), but their mean prescription expenditures were nearly 7 times higher ($4006 vs $599).
Health Care Access Barriers for Working-Age Adults With and Without Disabilities
Figures 7 and 8 show that access problems for working-age adults with and without disabilities became more widespread through the late 1990s and 2000s, peaking in 2010 immediately following the Great Recession. Access improved for both groups as the economy improved and the ACA was implemented.
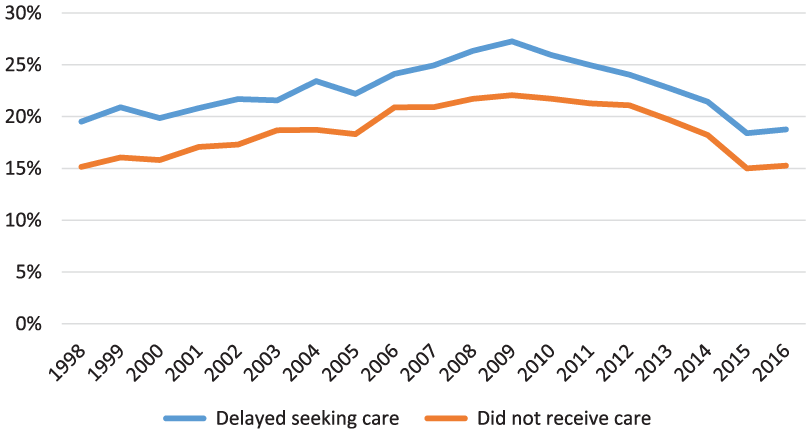
Access trends for adults with disabilities aged 18 to 64: United States, 1998-2016.

Access trends for adults without disabilities aged 18 to 64: United States, 1998-2016.
Working-age adults with disabilities are much more likely than those without disabilities to report access and affordability problems (see Table 6), including problems paying medical bills (32.0% vs 13.4%), inability to pay medical bills (20.0% vs 7.3%), delaying medical care due to cost concerns (18.8% vs 7.1%), as well as not receiving needed medical care due to cost (15.3% vs 4.9%).
2016 Comparison of Health Care Access Problems Among Working-Age Adults (Aged 18-64) With and Without Disabilities.

Source. 2016 National Health Interview Survey, Family Core.
Note. P values for Wald chi-square tests.
Because working-age adults without disabilities had relatively low rates of access problems, particularly after the implementation of the ACA, we compared the odds of access problems for this group with those with disabilities, pre and post implementation (see Table 7). People with disabilities had 3.7 times greater odds of reporting an access problem pre ACA than those without disabilities post ACA, controlling for other significant population factors (adjusted odds ratio [AOR] = 3.6, 95% confidence interval [CI] = 3.5-4.0).
Disability and Health System Factors Associated With Health Care Access Problems Among Working-Age Adults (Aged 18-64) With and Without Disabilities.

Source. 2012, 2013, 2015 and 2016 National Health Interview Survey, Family Core.
Note. OR = odds ratio; CI = confidence interval.
Model 2 controls for health insurance coverage, age, gender, race, ethnicity, US region, and marital status.
After ACA implementation, working-age adults with disabilities still had 3.1 times greater odds of reporting an access problem (AOR = 3.1, 95% CI = 2.9-3.4). In other words, both disability status and health system status were significantly associated with access problems. A confirmatory regression model shows that, controlling for other factors, the average marginal effect of the ACA on likelihood of reporting an access problem for people without disabilities was –.01 (a 1 percentage point reduction, P < .001). The equivalent effect of the ACA for people with disabilities was a 4.1 percentage point reduction in the likelihood of reporting an access problem (P < .001).
Discussion
This analysis shows that working-age adults with disabilities are now more likely to have insurance coverage and less likely to encounter access problems than before the full implementation of the ACA in 2014. However, compared with those without disabilities, this population continues to struggle with high health care costs that make it difficult to obtain the services they require. It is also clear that, despite important reforms in the private insurance market, most working-age adults with disabilities continue to rely on public insurance, particularly Medicaid and Medicare. Moreover, these gains may be threatened by policy changes like those proposed in H.R. 1628, the American Health Care Act (AHCA) of 2017. 34
A strength of this study is its inclusive and policy-relevant definition of the population. 1 In contrast to definitions reliant on medical diagnosis, like the US Department of Health and Human Services multiple chronic conditions (MCCs) 35 or the Commonwealth Fund’s high-need high-cost (HNHC) 36 definitions, our framing of disability uses well-established population survey questions and includes all SSI and SSDI program participants. There is a broad international research literature on this population, 37 inclusive of not only medical research but also public health, labor economics, and health policy. 38
The central limitation of this study is its descriptive methodology. The NHIS is rapidly available, and the MEPS is detailed, but neither public-use file identifies, for instance, whether a respondent’s Medicaid enrollment was facilitated by a state-level Medicaid expansion. In this study, while we showed that the number of working-age adults with disabilities enrolled in Medicaid grew from 7.2 million in 2013 to 8.4 million in 2015, we could not describe where these new beneficiaries resided and how obtained this coverage. As policymakers consider granting states additional latitude in Medicaid program design, such state-level comparisons will be critical. 39
The passage and implementation of the ACA were not the only important economic or political changes that occurred during the 18-year observation period. For example, reported access problems for adults with and without disabilities peaked during the Great Recession of 2007-2009, when unemployment rates reached 10% and the gross domestic product shrank by 5.1%. 40 Some of the improvement in health care access observed after implementation of the ACA might therefore simply be due to regression to the mean rather than a direct result of the legislation.
This type of multiyear trend analysis may also obscure changes in the composition of the population. For example, according to our NHIS estimates, the total population of adults aged 18 to 64 grew from 165 million in 1998 to 196 million in 2015, but the annual growth rate for those with disabilities (1.6%) was higher than for those without disabilities (1.0%). This difference could be attributed not only to the aging of the “baby boom” generation but also to diminished job opportunities or changes in SSI and SSDI program policies.
Our findings are broadly consistent with prior studies of cost, use, and access among working-age adults with disabilities, but they highlight the continuing and acute vulnerability of this population to changes in the health care system. This is a critical consideration in light of current Congressional efforts to reform or repeal the ACA, mainly through deregulation of the private insurance market, reduced coverage subsidies, and new caps on Medicaid funding.
The American Health Care Act of 2017 (AHCA), for instance, contains several provisions with direct and evident negative effects on the affordability and availability of health insurance for working-age adults with disabilities. 41 Under the AHCA, states could re-enable insurance providers to increase rates on those with preexisting conditions, which would price most people with disabilities out of coverage in the individual market. The pre-ACA problems with this market for people with disabilities and/or chronic conditions are well-documented, and eliminating the ACA’s changes to this market or making its changes optional would cause many people to lose coverage.42,43 There is little evidence that high-risk pools will counteract these losses, as they have already proven inadequate for people with disabilities and preexisting conditions and prohibitively expensive for the many states that tried them. 44 A recent analysis by the Congressional Budget Office on the AHCA 45 suggests that proposed cuts in insurance subsidies could cause premiums for individually purchased private insurance to jump by as much as 750% among older and poorer adults not yet eligible for Medicare—a significant portion of whom are disabled. Likewise, the proposed Medicaid block grants and more restrictive eligibility would shrink enrollment in this critical program by 17% over the next 8 years, forcing adults with disabilities back to categorical eligibility via SSI enrollment, and discouraging workforce participation. 46
This research provides a current insight into the positive trends in health insurance coverage and access for working-age adults with disabilities under the ACA. As future health reform proposals are developed or implemented, these trends should continue to be monitored and discussed, particularly if protections for people with disabilities are removed and these indicators start to move in the wrong direction.
Footnotes
Declaration of Conflicting Interests
The author(s) declared no potential conflicts of interest with respect to the research, authorship, and/or publication of this article.
Funding
The author(s) disclosed receipt of the following financial support for the research, authorship, and/or publication of this article: The contents of this article were developed under a grant from the National Institute on Disability, Independent Living, and Rehabilitation Research (NIDILRR grant number 90DP0075-01-00). NIDILRR is a Center within the Administration for Community Living (ACL), Department of Health and Human Services (HHS). The contents of this article do not necessarily represent the policy of NIDILRR, ACL, HHS, and you should not assume endorsement by the Federal Government. The authors thank the other members of the CHRIL for input on this article.