
Abstract
States increasingly use managed care for Medicaid enrollees, yet evidence of its impact on health care outcomes is mixed. This research studies county-level Medicaid managed care (MMC) penetration and health care outcomes among nonelderly disabled and nondisabled enrollees. Results for nondisabled adults show that increased penetration is associated with increased probability of an emergency department visit, difficulty seeing a specialist, and unmet need for prescription drugs, and is not associated with reduced expenditures. We find no association between penetration and health care outcomes for disabled adults. This suggests that the primary gains from MMC may be administrative simplicity and budget predictability for states rather than reduced expenditures or improved access for individuals.
Introduction
States have turned to managed care as a strategy to control health care expenditures and improve the quality of care in the Medicaid program, with the role of managed care expected to increase with the 2014 Medicaid expansion under the Affordable Care Act (ACA).1-3 By focusing on efficient and effective care delivery, Medicaid managed care (MMC) is expected to lower expenditures and provide greater administrative simplicity and budget predictability for states and, potentially, improve access to care and health outcomes for program enrollees. The risk, however, is that the incentives for reduced expenditures under managed care lead to restrictions on access and lower quality of care for Medicaid enrollees. By 2010, 35 states and the District of Columbia had implemented some level of fully capitated managed care in their Medicaid programs. 4 The scope of MMC penetration varied across states, as did the population groups affected. In general, MMC penetration is greater for children and parents, although states are increasingly turning to managed care for aged and disabled populations. 2
The growing use of managed care by states for their Medicaid populations has continued despite a lack of consistent evidence that managed care has reduced expenditures or improved access to care for enrollees. i Existing research finds little evidence that managed care substantially reduces health care expenditures, if at all, among nonelderly Medicaid enrollees overall,5-7 or among nonelderly adults with disabilities. 8 Recent work by Marton et al. is one exception, which focused on all children with Medicaid in 2 distinct managed care programs in Kentucky during the late 1990s. 9 That study found that managed care results in spending reductions, albeit the reductions vary with different types of managed care programs. Conversely, there is some evidence that overall expenditures may actually have increased with the expansion of MMC among welfare-eligible enrollees (adults and children) in California. 10
The evidence on the association between managed care and Medicaid enrollees’ access to care is also mixed. For example, Herring and Adams found that, among nonelderly Medicaid enrollees overall (including children), increased managed care penetration is associated with an increase in the number of emergency department (ED) and medical practitioner visits, and a decrease in the number of inpatient stays and surgeries. 5 They also find that higher MMC penetration increased reliance of the ED as a usual source of care. In contrast, work by Garrett and Zuckerman, who study an earlier time period, found that mandatory health maintenance organization (HMO) programs decreased the probability of an ED visit among nonelderly adult Medicaid enrollees. 11 The work by Marton et al. for children discussed above finds that MMC decreased outpatient utilization, while increasing child wellness visits. 9 The findings for professional provider utilization, which did not occur in a hospital outpatient or inpatient setting, were mixed—increasing under 1 MMC model and decreasing under the other. Among disabled adults, Burns found that mandatory MMC enrollees did not experience improvements in access to care, 12 whereas Coughlin et al. found that MMC led to some improvements in access to care. 13
This study builds on prior work to examine the impacts of increasing managed care penetration on health care access, use, and expenditures for nonelderly adults within the Medicaid program, taking advantage of the variation in fully capitated MMC enrollment within and across states. ii In its approach, this work is closest to that of Herring and Adams, 5 yet it is distinct along several dimensions. First, the main independent variable in this analysis, the proportion of Medicaid enrollees in fully capitated managed care (ie, MMC penetration), is defined at the county level rather than the Metropolitan Statistical Area (MSA) as in the work by Herring and Adams. 5 This difference is important as MMC is generally implemented at the county level when states expand their managed care delivery systems. Consequently, there can be variation in managed care across counties within a given MSA. Second, our work covers a more recent period of time (2006-2009) compared with 1996 through 2003. The more recent time period is important insofar as more time has passed since many counties implemented MMC and the impacts of MMC may take time to materialize, and health care markets change over time. Third, our work distinguishes between nonelderly Medicaid adults receiving Supplemental Security Income (SSI), who are, by definition, severely disabled, iii and the non-SSI Medicaid population, whereas the work by Herring and Adams combines the two populations and adults and children. The ability to identify SSI enrollees is important because they have different medical needs than the non-SSI population and face different managed care options under Medicaid. Finally, our work utilizes actual medical spending data, rather than imputed expenditures. In short, our study offers a more timely and stronger assessment of the impacts of expanding MMC than has previously been available.
Results show that a higher level of county MMC penetration was associated with an increase in non-SSI enrollees’ probability of an outpatient ED visit, reported difficulty seeing a specialist, and reported unmet need for prescription drugs. We also observe no evidence of reduced expenditures associated with higher MMC penetration for this population. Results specific to the SSI population reveal little association between MMC and health outcomes. We find no evidence that MMC is related to changes in access to care, use of medical services, or reduced expenditures for the SSI population; however, small sample sizes make those estimates imprecise. Overall, the results for the non-SSI population generally corroborate those from Herring and Adams of some evidence of poorer access and no evidence of reduced expenditures. This implies that policy makers considering expanding managed care for their current Medicaid population, or new enrollees in states that expand Medicaid under the ACA, should not necessarily expect reduced expenditures or improvements to access to health care. The primary gain from MMC for the states may be administrative simplicity and budget predictability rather than either reduced expenditures or improved access.
Methods
Data and Sample
Several sources of data are used in this study. First, household survey data are from the Medical Expenditure Panel Survey–Household Component (MEPS-HC), which is representative of the US civilian noninstitutionalized population. We pool 4 data files representing calendar years 2006 through 2009. From the MEPS-HC, we utilize detailed information on enrollees’ health care access, use, and expenditures, as well as health insurance, disability status, and demographic characteristics (discussed in detail below). The MEPS has a complex survey design and sampling weights, and all point estimates, standard errors, and significance tests reported in this study incorporate these features of the data.
The MEPS data are supplemented with county-level MMC penetration rates constructed from the Medicaid Statistical Information System (MSIS) person summary files for years 2006 through 2009. iv This is our main explanatory variable of interest. The MSIS is a source of administrative data, provided by each state and the District of Columbia to the Centers for Medicare and Medicaid Services (CMS). 14 From the MSIS data, we utilize information on monthly Medicaid enrollment status among all Medicaid enrollees by type of Medicaid (e.g., comprehensive managed care) and basis of enrollment (e.g., disability). These penetration rates are our key independent variable of interest (discussed in detail below). These data were merged with the MEPS data for individuals by county of residence and calendar year. v
In addition, we supplement the MEPS and MSIS data with county- and state-level information culled from multiple sources. These data, which are discussed in more detail below, were used to control for important characteristics correlated with both the outcomes of interest and county MMC penetration. These data are from the Behavioral Risk Factor Surveillance System, 15 Area Health Resources Files, 16 Federal Reserve Economic Data, 17 US Census Bureau State Government Finances, 18 Kaiser Family Foundation, 19 US Census Bureau Small Area Income and Poverty Estimates, 20 CMS, National Summary of State Medicaid Managed Care Programs, and Medicaid Managed Care Enrollment Report.21,22
We imposed several restrictions on the MEPS sample given the focus of this study. First, we limit the sample to nonelderly Medicaid enrollees aged 19 to 64 years. Second, we exclude dual Medicaid-Medicare enrollees given that they face very different managed care choices. Third, we exclude enrollees with less than full-year coverage given our focus on health care access and expenditures over the prior year. This insures that the access, use, and expenditure measures correspond to an equivalent period of Medicaid coverage. Finally, we distinguish between severely disabled enrollees, defined as those who received SSI at any point during the year, and nondisabled enrollees.
The pooled 2006-2009 MEPS data contain 135 030 individual records, 124 511 of which are out of the age range for this study or did not have Medicaid coverage at any point during the year (restriction 1). An additional 1274 enrollees were dual eligibles (restriction 2) and 4200 had less than full-year coverage (restriction 3). Finally, we exclude an additional 225 records due to missing data for the control variables included in the analysis (74) or a sampling weight equal to 0 (151). The final sample for the analysis includes 4820 Medicaid enrollees, of whom 1011 were disabled adults receiving SSI benefits.
Empirical Model
Managed care can have both direct and indirect effects on health care access and expenditures for Medicaid enrollees. For Medicaid enrollees in managed care plans, we would expect direct effects on health care use and expenditures due to changes in provider incentives. Changing incentives under managed care can affect both the price of care and the quantity of care provided to enrollees, 23 although given the low provider reimbursement rates under Medicaid there may be little room to lower prices to providers under managed care. 6 For Medicaid enrollees who remain in fee-for-service Medicaid, there is the potential for spillover effects from changes in the market and care delivery patterns as managed care expands. Examples include Medicaid delivery system consolidation, changes in provider practice style, and pressure from market competition. 24-26
In this study, we estimate reduced form models of the overall association between MMC penetration and enrollees’ health care access, use, and expenditures, controlling for characteristics of the enrollee and his or her county and state. In cases where an outcome is continuous—counts of medical use and expenditures—we estimate 2-part models where the first part estimates the probability of any medical use or expenditures, and the second part estimates the level of use or expenditures conditional on nonzero use or expenditures. Our general specification takes the following form:

where
To measure the association between MMC penetration and health care access, and any health care use or any expenditures—measured as any use of particular medical services and any medical expenditure—the function
Dependent Variables (
)
The dependent variables in this analysis cover 3 broad categories: health care access, use, and expenditures. Specifically, we study 5 access to care outcomes, where enrollees indicated whether in the past year they had (1) a usual source of care, excluding the ED; (2) any unmet need for medical care, tests, or treatments; (3) any unmet need for prescription drugs; (4) difficulty seeing a specialist; and (5) difficulty seeing a specialist, among those who reported the need to visit a specialist. vi
Similarly, we study 4 types of medical care use. For each, we study whether a respondent reported any use of a given type during the last year, and among those who reported use we study the quantity of use over the year. Types of medical care use include inpatient stays, outpatient ED visits, vii general doctor visits, and specialist visits. Doctor and specialist visits include those that take place in either an outpatient- or office-based setting.
Finally, we examine 3 different measures of medical expenditures: total medical expenditures (all payers combined, including out-of-pocket expenditures), total out-of-pocket expenditures, and total expenditures by the Medicaid program. As our data span several calendar years, we inflate pre-2009 calendar year expenditure data to real 2009 US dollars. Total expenditures and Medicaid expenditures were inflated using the National Income and Product Accounts, price index for gross domestic product (GDP). 27 Out-of-pocket expenditures were inflated using the all urban consumers, Consumer Price Index. 28 The results are not sensitive to the choice of deflator.
MMC Penetration
County MMC penetration, the main independent variable of interest, is defined as the share of a given county’s nondual Medicaid population aged 19 to 64 enrolled in fully capitated managed care in a given year. As noted above, the penetration rates were calculated from the MSIS data by enrollee type (SSI and non-SSI) and account for less than full-year enrollment status. viii In presenting the results, we focus on the average marginal effect (AME) of these penetration rates from the relevant logistic models, zero-truncated Poisson models or GLM models .
As discussed above, MMC penetration captures both direct and indirect effects of managed care on the outcomes of interest, compared with the direct effects of individual MMC enrollment. MMC penetration also has the advantage of moving away from the individual enrollment decision, which likely results in nonrandom take-up of managed care and, thus, the potential of biased estimates of the link between MMC enrollment and the outcomes of interest. ix Using the penetration rates, however, may also result in biased estimates if counties or states shifted from fee-for-service to MMC in reaction to factors that also affect the health care outcomes (such as limited provider availability). To address this latter concern, we include an array of relevant county- and state-level characteristics in the model (discussed below).
Other Independent Variables
We control for a rich array of individual characteristics associated with the outcomes of interest
To further isolate the link between county MMC penetration and the outcomes of interest, we include lagged county- and state-level variables to address the potential of MMC policy endogeneity and to control for important environmental factors that are likely to affect the outcomes, such as provider supply
The county and state measures come from multiple sources and were merged with the MEPS data by the individuals’ county/state of residence by year. To account for the state policy environment, we include 3 state-level variables. The first 2 are state expenditures as percent of revenues, 18 and state GDP per capita,16,17 which serve as proxies for budgetary pressures in the state. Increased pressure may influence the decision to shift from fee-for-service to managed care if it is perceived to result in savings. The third state policy environment variable is state Medicaid income eligibility as percent of FPL for a working-parent family of 3, 19 which is a proxy for the state’s Medicaid eligibility generosity. States with more generous programs will have more eligibles, all else equal, and are possibly more motivated to seek savings by shifting to managed care.
Local (county level) health care market characteristics will affect the Medicaid enrollees’ access to and use of care, and may also affect decisions on the implementation of MMC across geographic areas in a state. We include 4 county-level controls to capture the supply side of the local environment: the number of hospital beds per 1000 individuals, the number of primary care physicians per 1000 individuals, whether the county has 1 or more Federally Qualified Health Centers, and the number of hospitals with an ED per 1000 individuals. 16 A relatively low capacity to provide medical care may impact enrollees’ access to care, treatment setting, and expenditures, which in turn may influence decisions to shift to managed care. We also include the Medicare + Choice Hospital Insurance aged payment rate as a proxy for the price of medical services in the county. 16 Higher prices for services, holding quantity and other factors constant, influence expenditures on services, which is important to control for by itself. Nonetheless, higher prices could influence counties’ decisions to shift to managed care for perceived savings.
To capture health care needs in the local market, we include the share of adults diagnosed with diabetes 15 and median household income per capita at the county level. 20 These are rough proxies for population health that in turn influences the quantity of medical services demanded in the local market. And depending on the capacity of the local health care market, it may impact access and use of services, expenditures, and county decisions to shift to managed care. We also include county population per square mile, 16 as urban areas, with their larger population bases, are more conducive to managed care. Finally, we include a binary variable that indicates whether the county participates in Primary Care Case Management (PCCM) for its Medicaid enrollees, calculated from the MSIS administrative data. xiii This is important as PCCM is distinct from capitated managed care, and PCCM penetration is correlated with capitated managed care penetration as PCCM is often a first step toward capitated managed care. Likewise, though similar, PCCM health care delivery systems produce different incentives for providers than capitated programs that may influence the outcomes studied here.
Additional Specifications
Although the MMC penetration rate is our primary independent variable of interest, we supplement these findings with 5 alternative specifications to evaluate the robustness of our results. First we estimate models where the penetration rate is lagged 1 year, as lagged penetration is arguably more exogenous than contemporary penetration. xiv Second, we estimate models where the penetration rate corresponds only to counties with mandatory MMC, where the rate equals 0 in nonmandatory counties. Data on mandatory MMC come from CMS, National Summary of State Medicaid Managed Care Programs, and Medicaid Managed Care Enrollment Report.21,22 Third, models are estimated with a binary variable indicating whether the county has mandatory MMC program by subpopulation, xv and a fourth specification with a binary indicator for whether there is any MMC in the county for a given subpopulation. The final specification includes a binary indicator from the MEPS data, where respondents reported that they are enrolled in a MMC plan.
Limitations
Our estimates of the link between county MMC penetration and health care access, use, and expenditures do not necessarily identify causal effects. Although we estimate rich models, there may be important omitted variables that affect both county MMC penetration and the study outcomes that could bias our estimates of the effect of MMC. For example, although we attempt to control for MMC policy endogeneity, factors influencing state policy decisions do so with a lag that is likely to be longer than that which we are able to control for. Thus, it is likely that we reduce but do not eliminate such bias. Second, we focus on adults with full-year Medicaid to link access, use, and expenditures over the year to Medicaid coverage for the same time period. However, as a substantial share of non-SSI Medicaid enrollees cycle in and out of coverage, the results reported here may not be generalizable to the full Medicaid population. Third, we focus on national estimates, knowing that Medicaid and MMC vary considerably across the states. The results reported here provide the average effects across the nation and are not necessarily applicable to individual states or counties. That is, our sample is too small to control for state (or county) fixed effects, which is a limitation of the data. Finally, we focus on payments for health care services in this analysis and so do not capture the full expenditures of administering the Medicaid program under managed care and fee-for-service Medicaid.
Results
Summary Statistics
Table 1 reports on the distribution of county MMC penetration faced by non-SSI and SSI Medicaid enrollees in the MEPS, combined over years 2006 to 2009. MMC penetration was generally greater among non-SSI enrollees than SSI enrollees. For example, average MMC penetration among respondents in the MEPS subsample equals 33.4% for SSI enrollees and 64.1% among non-SSI enrollees (see Table 1). Likewise, one-half of non-SSI enrollees resided in counties with MMC penetration equal to 80.8% or higher, whereas half of SSI enrollees resided in counties with MMC penetration at 21.1% or higher. In addition to MMC penetration, three-quarters of non-SSI respondents reported they were enrolled in a managed care plan, as did approximately 63% of SSI enrollees (see Table A1 of the appendix). Finally, 82.4% of non-SSI enrollees resided in an area with mandatory MMC, whereas less than half (45.9%) of SSI respondents resided in mandatory MMC areas over the period (Table A1).
County Medicaid Managed Care Penetration Rates Corresponding to MEPS Respondents by SSI/non-SSI Status, 2006-2009.
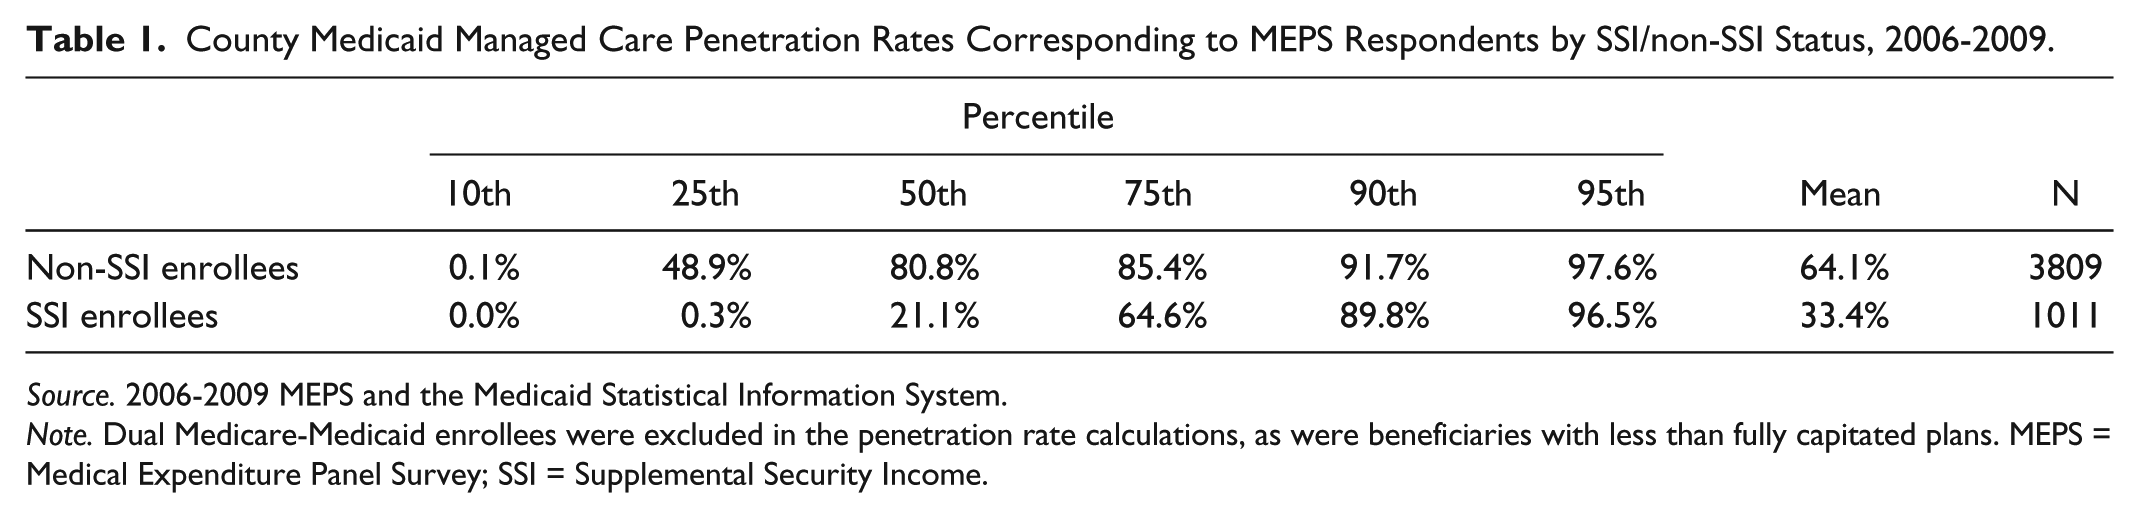
Source. 2006-2009 MEPS and the Medicaid Statistical Information System.
Note. Dual Medicare-Medicaid enrollees were excluded in the penetration rate calculations, as were beneficiaries with less than fully capitated plans. MEPS = Medical Expenditure Panel Survey; SSI = Supplemental Security Income.
Table 2 reports summary statistics on health care access, use, and expenditures—the dependent variables in this analysis—by SSI status. Nearly 90% of the SSI and 80% of the non-SSI enrollees reported that they had a usual source of care other than the ED during the year. Less than 8% of SSI enrollees and less than 4% of non-SSI enrollees reported unmet need for medical care or prescription drugs during the year. Reflecting their higher health care needs, health care use and expenditures were greater among SSI enrollees, although the majorities of both groups have some medical spending during the year. For example, nearly 95% of SSI enrollees, and 85% of non-SSI enrollees, reported nonzero medical spending during the year. Table A1 reports summary statistics for the control variables used in this analysis by SSI status.
Health Care Access, Use, and Expenditures for Nonelderly Adult Full-Year Medicaid Enrollees by SSI Status, 2006-2009.

Source. 2006-2009 Medical Expenditure Panel Survey.
Note. The subsample excludes dual Medicaid-Medicare enrollees, and respondents with less than full-year Medicaid status. Monetary values were inflated to constant 2009 US dollars. SSI = Supplemental Security Income. Pr[Y>0] = probability that a given event Y is greater than zero. SE = Standard Error. N = Sample size. E[Y|Y > 0] = expected value of Y conditional on Y greater than zero. “—” = not applicable.
Average Marginal Effects
Table 3 reports estimates of the Average Marginal Effect (AME) associated with changes in county MMC penetration from the health care access, use, and expenditures models. These are estimates of the change in the probability of a given event, unit of service, or change in medical spending, corresponding (approximately) to a 1 percentage point change in county MMC penetration. xvi Table A2 of the appendix provides an example of the complete estimation results for whether non-SSI enrollees reported an outpatient ED visit (logit model), and Tables A3 and A4 provide the full range of alternative modelspecifications.
AME of County Medicaid Managed Care Penetration on Health Care Access, Use, and Expenditures.

Source. 2006-2009 Medical Expenditure Panel Survey and the Medicaid Statistical Information System.
Note. Each AME is estimated from a separate multivariate model. See the “Methods” section for the list of covariates not reported here, or Table A2 for an example of the analytic model corresponding to results in bold. The subsample of full-year Medicaid enrollees excludes dual Medicaid-Medicare enrollees, and respondents with less than full-year Medicaid status. Monetary values were inflated to constant 2009 US dollars. AME = average marginal effect; MMC = Medicaid managed care; SSI = Supplemental Security Income; GLM = generalized linear model.
Results from logit models.
Results from truncated Poisson regression models.cResults from GLM log link models.
Among non-SSI enrollees (left, Panel A, Table 3), who are more likely to be enrolled in MMC, we find that an increase in county MMC penetration is associated with an increase in the probability of reporting unmet need for prescription drugs (P < .10) and difficulty seeing a specialist (P < .10 among all non-SSI enrollees, and P < .05 for those who reported need to see a specialist). Furthermore, increasing county MMC penetration increases the probability of reporting an ED visit (P < .01) among non-SSI enrollees. (Below we report results over the entire range of county MMC penetration to illustrate the magnitude of the main findings.) Results from the additional specifications, reported in Table A3, generally corroborate the results discussed here. xvii Despite the finding of increased difficulty seeing a specialist, we find no evidence that increased MMC penetration decreased the probability of visiting a specialist (Panel A), or the number of specialist visits among those who visited one (Panel B). We also find no evidence of a significant change in the probability of positive medical expenditures. Nor do we find any evidence that MMC penetration is associated with the quantity of medical use more generally among those who use services, or medical expenditures among those with positive expenditures (Panel B, Table 3).
Results for the SSI population are generally insignificant (right, Table 3). Although there appears to be some evidence of a positive association between MMC penetration and the number of inpatient visits, results appear sensitive alternative specifications reported in Table A4. As discussed further below, drawing statistical inferences from the SSI population is complicated due to the much smaller subsample compared with the non-SSI population (see Table 2), highlighting the need for stronger data to examine this population. xviii
Figure 1 reports the average predicted values for key outcomes among the non-SSI population over the entire range of MMC penetration, from no managed care to 100% managed care penetration. (Data corresponding to Figure 1 are reported in Table A5.) The steeper the slope is in a given graph, the greater the impact of increased MMC penetration on a given outcome. Investigating the change over a wide range in MMC penetration is important insofar as when states expand managed care, they generally shift additional groups of individuals into managed care so that MMC penetration increases by more than a small margin.
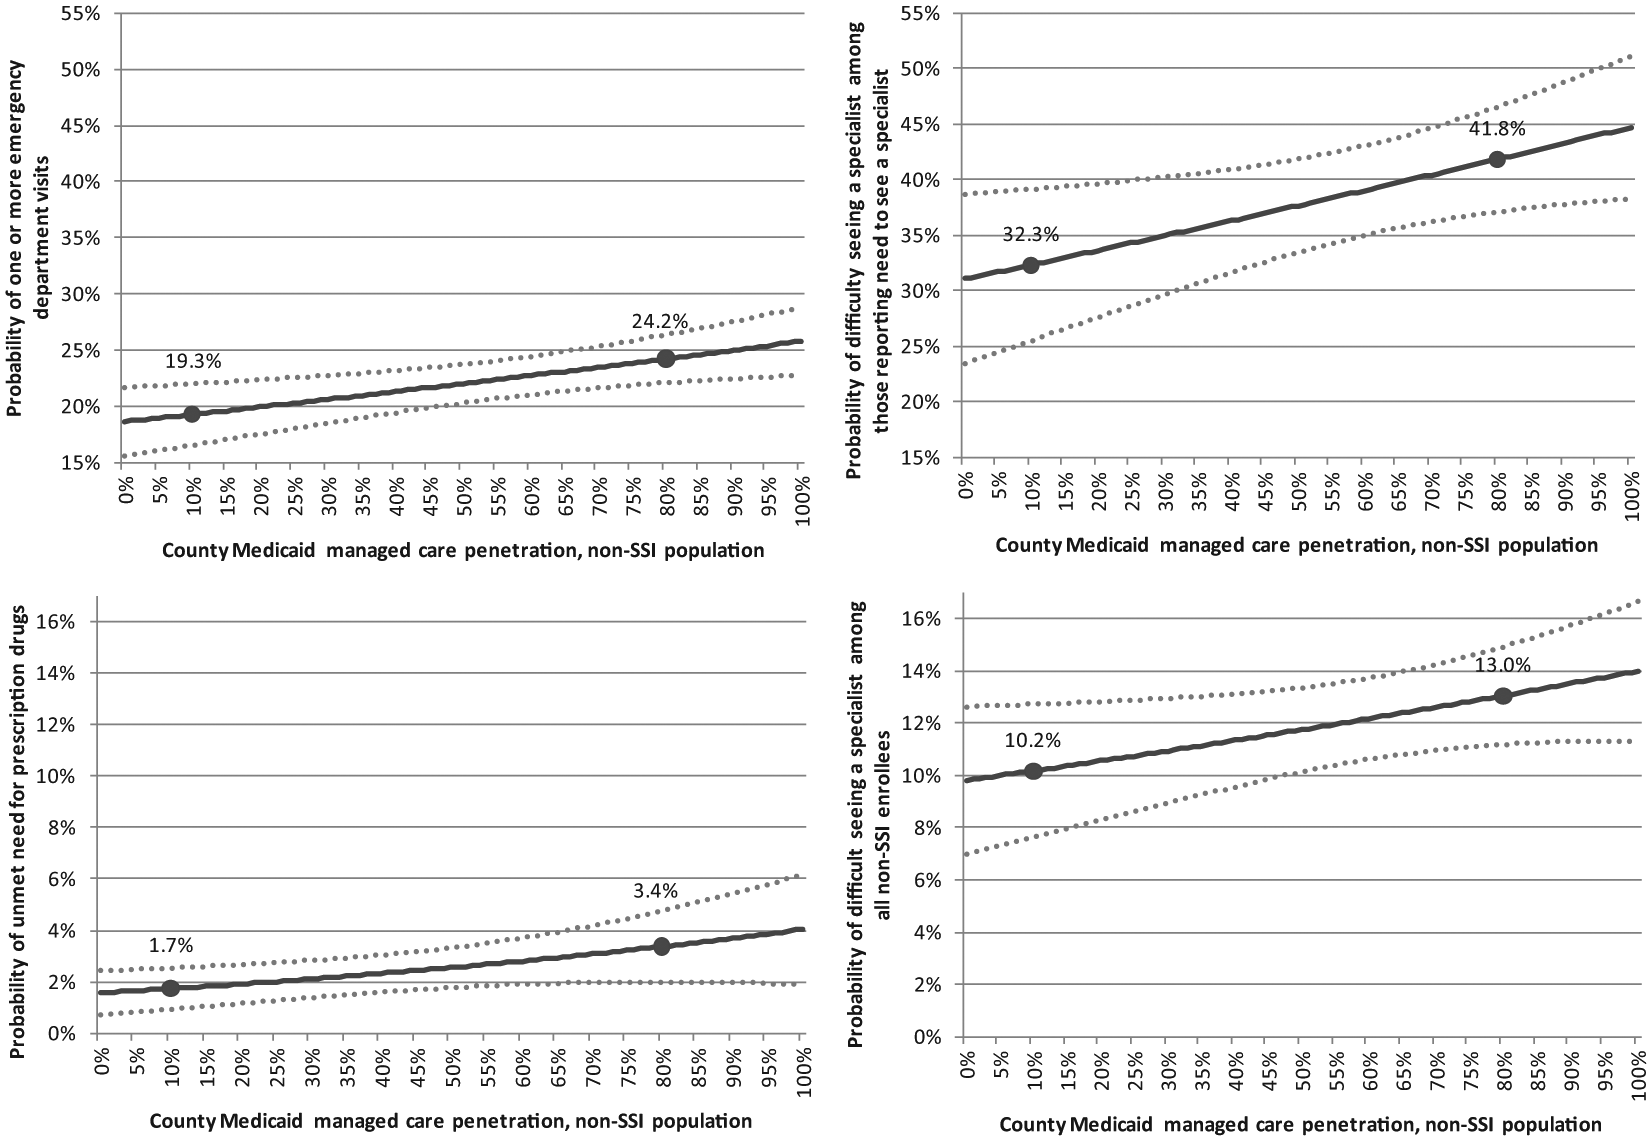
Estimated probability of medical use and access to care (with 95% confidence intervals) among non-SSI Medicaid enrollees by county Medicaid managed care penetration, with markers at 10% and 80% penetration.
Panel A of Figure 1 shows the predicted probability of any outpatient ED visit at different levels of county MMC penetration among nonelderly adult non-SSI enrollees. For example, at 10% MMC penetration, the probability of any outpatient ED visit (Panel A) is estimated to be 19.3%, whereas at a MMC penetration of 80%, the probability of ED visit increases to 24.2%. That is, an increase in MMC penetration from a relatively low level to MMC as the dominant care delivery system increases the probability of any outpatient ED visit by 4.9 percentage points for non-SSI enrollees, which is a 25.4% increase.
Figure 1 also plots the predicted probabilities for reported difficulty seeing a specialist among those who reported the need to see one (Panel B) and among all non-SSI enrollees (Panel D), and unmet need for prescription drugs (Panel C) at different levels of county MMC penetration. As shown, the estimated probability of reported difficulty seeing a specialist, among those who reported need to see one, increases 9.5 percentage points (from 32.3% to 41.8%, for an increase of 29.4%) as MMC penetration rises from 10% to 80%. The proportional increase for reported difficulty seeing a specialist is similar, from 10% to 80% penetration, among the entire non-SSI population (Panel D): 27.5% or 2.8 percentage points (from 10.2% to 13.0%). Finally, the probability of reported unmet need for prescription drugs (Panel C) increases by 100.0%, or 1.7 percentage points (from 1.7% to 3.4%) with the same shift in MMC penetration.
Discussion
This study finds that increased MMC penetration in a county is associated with an increase in the probability of an ED visit, and reported difficulty seeing a specialist and unmet need for prescription drugs among nonelderly non-SSI Medicaid adults. Furthermore, we find no evidence of reduced expenditures associated with increased MMC penetration for the non-SSI population. For nonelderly SSI Medicaid adults, we observe no consistent evidence that MMC penetration influences medical care access, use, or expenditures. We do not, however, interpret this as evidence that MMC has no impact on the outcomes examined. Our SSI sample is small, raising concerns about the precision of our estimates for this subpopulation, a limitation of the MEPS sample size.
Overall these results, especially among non-SSI Medicaid enrollees, seemingly contradict conventional theories on the expenditures and benefits of managed care. That is, managed care is generally intended to provide access to appropriate care in a timely, efficient, and cost-effective way by shifting the locus of care from higher cost settings to primary care. If successful, one would expect higher levels of primary care use, lower levels of specialist use that could be provided in primary care settings, lower levels of unmet need for care, and lower levels of inpatient stays and ED visits for ambulatory care sensitive conditions, and, as a result, reduced expenditures associated with those changes. Nonetheless, incentive structures created by managed care organizations may not always result in intended/desired outcomes.
There are characteristics of states’ Medicaid programs that may lead to outcomes that are inconsistent with conventional managed care theory. The largest factor, perhaps, is the programs’ low reimbursement rates. Low rates, combined with incentives to reduce expenditures within managed care organizations, could lead to reductions in appropriate access to care and/or quality of care should it limit the number and/or quality of providers available (e.g., narrow limits on number or type of prescription drugs or specialist care). Furthermore, reductions in appropriate care could eventually lead to more high-cost care (e.g., inpatient and/or ED care). Furthermore, the opportunities for both more cost-effective and lower cost care delivery will depend on a given state’s starting point. That is, states with low reimbursement rates and/or efficient care delivery systems will offer fewer opportunities for changes that generate reduced expenditures. Finally, specific incentives faced by providers and hospitals, defined by managed care organizations, are not the same across organizations and may impact populations in different ways as demonstrated in the work by Marton et al. 9
Results in this study for non-SSI adult enrollees are qualitatively consistent with those in the work by Herring and Adams. 5 If enrollees are more likely to utilize the outpatient ED, along with no perceptible decrease in general doctor and/or specialist visits as MMC penetration increases, enrollees may not necessarily experience less access to care. However, it is not clear that this would improve the welfare of enrollees. Herring and Adams, 5 who studied the SSI and non-SSI nonelderly populations together (including children), found that increased MMC penetration associates with medical care use patterns which the authors interpret as not welfare improving—such as increased reliance on the ED for a usual source of care, and increased number of ED visits. Finally, the lack of effect of MMC on Medicaid expenditures in our work is also consistent with these authors’ research, as well as more recent work by Duggan and Hayford. 6
Taken together, these results raise concerns about the feasibility of states achieving their goals of controlling health care expenditures and improving care by expanding use of MMC. The greatest gains for states may be administrative gains and budget predictability rather than either reduced expenditures or improved access.
The implication of these findings are of particular concern for the SSI population, given their greater health care needs and higher health care expenditures; however, more research with larger sample sizes is needed to more fully address the implications of MMC for this subpopulation. Given the limitations of national data sources for the SSI population, this work highlights the need for state-specific studies that could provide the sample size needed to better assess the implications of MMC for these vulnerable adults. Recent work by Marton et al., 9 who study children in 2 managed care plans in Kentucky, is a step in this direction. However, further work that focuses on the disabled, adults, and additional states is needed. In addition, future work would benefit from going beyond the general measures available in MEPS to consider additional dimensions of care. For example, quality of care and patient experiences based on the Healthcare Effectiveness Data and Information Set (HEDIS), or the Consumer Assessment of Healthcare Providers and Systems (CAHPS), could be insightful.
Our findings for the non-SSI population will help to inform the trend toward medical homes and accountable care organizations (ACOs). That is, to the extent that medical homes and ACOs in Medicaid are based on the MMC model, the benefits generated from these alternatives may also be limited. Silow-Carroll et al., 3 however, highlight that the ACO model with its focus on greater integration and coordination of care, and greater emphasis on high-risk individuals, could offer greater improvements in care than have been generated by the traditional MMC model to date. These authors also note that many managed care organizations, including MMC organizations, are shifting toward the ACO model. Consequently, if the ACO model is more successful in achieving its intended benefits than the current MMC model, such a move could improve MMC. Going forward, it will be important to study whether ACOs and medical homes, whether stand-alone models or models developed as part of MMC plans, can produce the improvements over fee-for-service Medicaid that to date have largely proven elusive with MMC.
Footnotes
Appendix
Estimated Probability of Medical Use and Access to Care Over the Range of Medicaid Managed Care Penetration Among Non-SSI Enrollees.

| County Medicaid managed care penetration | Any unmet need for prescription drugs |
Any difficulty seeing a specialist |
Any difficulty seeing a specialist, conditional on need to see one |
Any outpatient emergency department visit |
||||
|---|---|---|---|---|---|---|---|---|
| P | SE | P | SE | P | SE | P | SE | |
| 0.000 | .016 | 0.004 | .098 | 0.014 | .311 | 0.039 | .186 | 0.016 |
| 0.010 | .016 | 0.004 | .098 | 0.014 | .312 | 0.038 | .187 | 0.015 |
| 0.020 | .016 | 0.004 | .099 | 0.014 | .313 | 0.038 | .188 | 0.015 |
| 0.030 | .016 | 0.004 | .099 | 0.014 | .314 | 0.038 | .188 | 0.015 |
| 0.040 | .016 | 0.004 | .100 | 0.014 | .316 | 0.037 | .189 | 0.015 |
| 0.050 | .017 | 0.004 | .100 | 0.014 | .317 | 0.037 | .190 | 0.015 |
| 0.060 | .017 | 0.004 | .100 | 0.014 | .318 | 0.036 | .190 | 0.015 |
| 0.070 | .017 | 0.004 | .101 | 0.013 | .319 | 0.036 | .191 | 0.014 |
| 0.080 | .017 | 0.004 | .101 | 0.013 | .321 | 0.036 | .191 | 0.014 |
| 0.090 | .017 | 0.004 | .101 | 0.013 | .322 | 0.035 | .192 | 0.014 |
|
|
|
|
|
|
|
|
|
|
| 0.110 | .018 | 0.004 | .102 | 0.013 | .325 | 0.034 | .193 | 0.014 |
| 0.120 | .018 | 0.004 | .102 | 0.013 | .326 | 0.034 | .194 | 0.014 |
| 0.130 | .018 | 0.004 | .103 | 0.013 | .327 | 0.033 | .195 | 0.013 |
| 0.140 | .018 | 0.004 | .103 | 0.012 | .328 | 0.033 | .195 | 0.013 |
| 0.150 | .018 | 0.004 | .104 | 0.012 | .330 | 0.033 | .196 | 0.013 |
| 0.160 | .018 | 0.004 | .104 | 0.012 | .331 | 0.032 | .197 | 0.013 |
| 0.170 | .019 | 0.004 | .104 | 0.012 | .332 | 0.032 | .197 | 0.013 |
| 0.180 | .019 | 0.004 | .105 | 0.012 | .334 | 0.031 | .198 | 0.013 |
| 0.190 | .019 | 0.004 | .105 | 0.012 | .335 | 0.031 | .199 | 0.012 |
| 0.200 | .019 | 0.004 | .105 | 0.012 | .336 | 0.031 | .199 | 0.012 |
| 0.210 | .019 | 0.004 | .106 | 0.011 | .338 | 0.030 | .200 | 0.012 |
| 0.220 | .020 | 0.004 | .106 | 0.011 | .339 | 0.030 | .201 | 0.012 |
| 0.230 | .020 | 0.004 | .107 | 0.011 | .340 | 0.030 | .201 | 0.012 |
| 0.240 | .020 | 0.004 | .107 | 0.011 | .341 | 0.029 | .202 | 0.012 |
| 0.250 | .020 | 0.004 | .107 | 0.011 | .343 | 0.029 | .203 | 0.012 |
| 0.260 | .020 | 0.004 | .108 | 0.011 | .344 | 0.028 | .203 | 0.011 |
| 0.270 | .020 | 0.004 | .108 | 0.011 | .345 | 0.028 | .204 | 0.011 |
| 0.280 | .021 | 0.004 | .109 | 0.010 | .347 | 0.028 | .205 | 0.011 |
| 0.290 | .021 | 0.004 | .109 | 0.010 | .348 | 0.027 | .205 | 0.011 |
| 0.300 | .021 | 0.004 | .109 | 0.010 | .349 | 0.027 | .206 | 0.011 |
| 0.310 | .021 | 0.004 | .110 | 0.010 | .351 | 0.027 | .207 | 0.011 |
| 0.320 | .021 | 0.004 | .110 | 0.010 | .352 | 0.026 | .208 | 0.011 |
| 0.330 | .022 | 0.004 | .111 | 0.010 | .353 | 0.026 | .208 | 0.010 |
| 0.340 | .022 | 0.004 | .111 | 0.010 | .355 | 0.025 | .209 | 0.010 |
| 0.350 | .022 | 0.004 | .111 | 0.010 | .356 | 0.025 | .210 | 0.010 |
| 0.360 | .022 | 0.004 | .112 | 0.009 | .357 | 0.025 | .210 | 0.010 |
| 0.370 | .023 | 0.004 | .112 | 0.009 | .359 | 0.025 | .211 | 0.010 |
| 0.380 | .023 | 0.004 | .113 | 0.009 | .360 | 0.024 | .212 | 0.010 |
| 0.390 | .023 | 0.004 | .113 | 0.009 | .361 | 0.024 | .212 | 0.010 |
| 0.400 | .023 | 0.004 | .113 | 0.009 | .363 | 0.024 | .213 | 0.010 |
| 0.410 | .023 | 0.004 | .114 | 0.009 | .364 | 0.023 | .214 | 0.009 |
| 0.420 | .024 | 0.004 | .114 | 0.009 | .366 | 0.023 | .214 | 0.009 |
| 0.430 | .024 | 0.004 | .115 | 0.009 | .367 | 0.023 | .215 | 0.009 |
| 0.440 | .024 | 0.004 | .115 | 0.009 | .368 | 0.023 | .216 | 0.009 |
| 0.450 | .024 | 0.004 | .115 | 0.009 | .370 | 0.022 | .217 | 0.009 |
| 0.460 | .025 | 0.004 | .116 | 0.008 | .371 | 0.022 | .217 | 0.009 |
| 0.470 | .025 | 0.004 | .116 | 0.008 | .372 | 0.022 | .218 | 0.009 |
| 0.480 | .025 | 0.004 | .117 | 0.008 | .374 | 0.022 | .219 | 0.009 |
| 0.490 | .025 | 0.004 | .117 | 0.008 | .375 | 0.021 | .219 | 0.009 |
| 0.500 | .026 | 0.004 | .117 | 0.008 | .376 | 0.021 | .220 | 0.009 |
| 0.510 | .026 | 0.004 | .118 | 0.008 | .378 | 0.021 | .221 | 0.009 |
| 0.520 | .026 | 0.004 | .118 | 0.008 | .379 | 0.021 | .222 | 0.009 |
| 0.530 | .026 | 0.004 | .119 | 0.008 | .381 | 0.021 | .222 | 0.009 |
| 0.540 | .027 | 0.004 | .119 | 0.008 | .382 | 0.021 | .223 | 0.009 |
| 0.550 | .027 | 0.004 | .120 | 0.008 | .383 | 0.021 | .224 | 0.009 |
| 0.560 | .027 | 0.004 | .120 | 0.008 | .385 | 0.021 | .224 | 0.009 |
| 0.570 | .027 | 0.004 | .120 | 0.008 | .386 | 0.021 | .225 | 0.009 |
| 0.580 | .028 | 0.004 | .121 | 0.008 | .387 | 0.021 | .226 | 0.009 |
| 0.590 | .028 | 0.005 | .121 | 0.008 | .389 | 0.020 | .227 | 0.009 |
| 0.600 | .028 | 0.005 | .122 | 0.008 | .390 | 0.020 | .227 | 0.009 |
| 0.610 | .028 | 0.005 | .122 | 0.008 | .392 | 0.020 | .228 | 0.009 |
| 0.620 | .029 | 0.005 | .123 | 0.008 | .393 | 0.021 | .229 | 0.009 |
| 0.630 | .029 | 0.005 | .123 | 0.008 | .394 | 0.021 | .230 | 0.009 |
| 0.640 | .029 | 0.005 | .123 | 0.008 | .396 | 0.021 | .230 | 0.009 |
| 0.650 | .029 | 0.005 | .124 | 0.008 | .397 | 0.021 | .231 | 0.009 |
| 0.660 | .030 | 0.005 | .124 | 0.008 | .399 | 0.021 | .232 | 0.009 |
| 0.670 | .030 | 0.005 | .125 | 0.008 | .400 | 0.021 | .233 | 0.009 |
| 0.680 | .030 | 0.005 | .125 | 0.008 | .401 | 0.021 | .233 | 0.009 |
| 0.690 | .030 | 0.006 | .126 | 0.008 | .403 | 0.021 | .234 | 0.009 |
| 0.700 | .031 | 0.006 | .126 | 0.008 | .404 | 0.021 | .235 | 0.009 |
| 0.710 | .031 | 0.006 | .126 | 0.008 | .406 | 0.022 | .235 | 0.010 |
| 0.720 | .031 | 0.006 | .127 | 0.009 | .407 | 0.022 | .236 | 0.010 |
| 0.730 | .032 | 0.006 | .127 | 0.009 | .408 | 0.022 | .237 | 0.010 |
| 0.740 | .032 | 0.006 | .128 | 0.009 | .410 | 0.022 | .238 | 0.010 |
| 0.750 | .032 | 0.006 | .128 | 0.009 | .411 | 0.023 | .238 | 0.010 |
| 0.760 | .033 | 0.006 | .129 | 0.009 | .413 | 0.023 | .239 | 0.010 |
| 0.770 | .033 | 0.007 | .129 | 0.009 | .414 | 0.023 | .240 | 0.010 |
| 0.780 | .033 | 0.007 | .130 | 0.009 | .416 | 0.023 | .241 | 0.011 |
| 0.790 | .033 | 0.007 | .130 | 0.009 | .417 | 0.024 | .242 | 0.011 |
|
|
|
|
|
|
|
|
|
|
| 0.810 | .034 | 0.007 | .131 | 0.010 | .420 | 0.024 | .243 | 0.011 |
| 0.820 | .034 | 0.007 | .131 | 0.010 | .421 | 0.025 | .244 | 0.011 |
| 0.830 | .035 | 0.008 | .132 | 0.010 | .423 | 0.025 | .245 | 0.011 |
| 0.840 | .035 | 0.008 | .132 | 0.010 | .424 | 0.025 | .245 | 0.012 |
| 0.850 | .035 | 0.008 | .133 | 0.010 | .425 | 0.026 | .246 | 0.012 |
| 0.860 | .036 | 0.008 | .133 | 0.011 | .427 | 0.026 | .247 | 0.012 |
| 0.870 | .036 | 0.008 | .134 | 0.011 | .428 | 0.027 | .248 | 0.012 |
| 0.880 | .036 | 0.008 | .134 | 0.011 | .430 | 0.027 | .248 | 0.013 |
| 0.890 | .037 | 0.009 | .135 | 0.011 | .431 | 0.027 | .249 | 0.013 |
| 0.900 | .037 | 0.009 | .135 | 0.011 | .433 | 0.028 | .250 | 0.013 |
| 0.910 | .037 | 0.009 | .136 | 0.012 | .434 | 0.028 | .251 | 0.013 |
| 0.920 | .038 | 0.009 | .136 | 0.012 | .436 | 0.029 | .252 | 0.013 |
| 0.930 | .038 | 0.009 | .137 | 0.012 | .437 | 0.029 | .252 | 0.014 |
| 0.940 | .038 | 0.010 | .137 | 0.012 | .438 | 0.030 | .253 | 0.014 |
| 0.950 | .039 | 0.010 | .137 | 0.012 | .440 | 0.030 | .254 | 0.014 |
| 0.960 | .039 | 0.010 | .138 | 0.013 | .441 | 0.031 | .255 | 0.014 |
| 0.970 | .039 | 0.010 | .138 | 0.013 | .443 | 0.031 | .255 | 0.015 |
| 0.980 | .040 | 0.010 | .139 | 0.013 | .444 | 0.032 | .256 | 0.015 |
| 0.990 | .040 | 0.011 | .139 | 0.013 | .446 | 0.032 | .257 | 0.015 |
| 1.000 | .040 | 0.011 | .140 | 0.014 | .447 | 0.033 | .258 | 0.015 |
Source. 2006-2009 Medical Expenditure Panel Survey and the Medicaid Statistical Information System.
Note. Results are estimates of average predicted probabilities for medical use over the range of Medicaid managed care penetration from logistic models. See the “Methods” section for details on model specification. Results in bold correspond to 10% and 80% MMC penetration, respectively, and which are the levels emphasized in Figure 1 and in the text.
Acknowledgements
We gratefully acknowledge research assistance by Emily Lawton, and the helpful comments of Alan Monheit, John Holahan, Teresa Coughlin, and an anonymous referee.
Authors’ Note
All opinions are those of the authors and do not reflect the views of the Kaiser Family Foundation, the Urban Institute, or the Urban Institute’s trustees.
Declaration of Conflicting Interests
The author(s) declared no potential conflicts of interest with respect to the research, authorship, and/or publication of this article.
Funding
The author(s) disclosed receipt of the following financial support for the research, authorship, and/or publication of this article: This research was completed as a part of a project for the Kaiser Family Foundation.