
Abstract
The recent passage of the Affordable Care Act has heightened the importance of workplace wellness programs. This paper used administrative data from 2002 to 2007 for PepsiCo’s self-insured plan members to evaluate the effect of its wellness program on medical costs and utilization. We used propensity score matching to identify a comparison group who were eligible for the program but did not participate. No significant changes were observed in inpatient admissions, emergency room visits, or per-member per-month (PMPM) costs. The discrepancy between our findings and those of prior studies may be due to the difference in intervention intensity or program implementation.
Workplace wellness programs have become increasingly popular in the United States in recent years, with the expectation that these programs can promote employee health, reduce medical costs, and improve productivity. According to the annual survey of employer health benefits by the Kaiser Family Foundation, 51 percent and 39 percent of employers offered a wellness program in 2009 and 2010, respectively (Kaiser Family Foundation 2010, 2011). Among employers with two hundred or more workers, about 90 percent offered a program in both 2009 and 2010. Although wellness programs are widely available to employees, participation is relatively limited. A recent survey by the National Business Group on Health showed that only 38 percent of surveyed employers offering a health risk assessment (HRA) achieved a participation rate of greater than 50 percent for the HRA, a questionnaire on employee health behavior, health risk factors, and health status (Nyce 2010). Among eligible employees, two-thirds of the employers reported a participation rate of less than 20 percent for smoking cessation programs, and more than half of the employers had a rate of less than 20 percent for weight management.
A consensus on the definition of a wellness program has not been reached in the literature. The Patient Protection and Affordable Care Act (Public Law 111–148, Sec. 2705) defines a wellness program as “a program offered by an employer that is designed to promote health or prevent disease.” Typical examples of wellness program components include HRAs, fitness or weight control, healthy diet, smoking cessation, biometric screenings, immunization, and stress management (Baicker et al. 2010; Goetzel and Ozminkowski 2008). Disease management, although popular among employers, is generally not considered to be part of a wellness program since it is designed to manage patients who already have medical conditions such as diabetes or asthma (Baicker et al. 2010). Throughout this study, we define a wellness program to be composed of workplace health promotion activities designed to reduce health risk and improve health, excluding activities for managing medical conditions such as disease management or case management.
Most prior literature reviews suggest that worksite wellness programs generally have significant impacts on health behaviors and medical costs (Aldana 2001; Baicker et al. 2010; Chapman 2005; Goetzel and Ozminkowski 2008; Osilla et al. 2010; Pelletier 2009), but a recent detailed review of the eleven studies considered to have the strongest research design concluded that few of the studies demonstrated clear evidence on medical cost savings (Nyman et al. 2010). The conflicting conclusions may result for two reasons. First, many studies are plagued with methodological issues such as selection bias and regression to the mean (Linden et al. 2006). However, even among the studies that adequately addressed selection bias and regression to the mean and showed significant savings, cost reductions were found for a specific sub-portion of the intervention, for instance, in the later years of a program or only for inpatient costs (Nyman et al. 2010). Therefore, further rigorous studies are needed to evaluate the effectiveness of workplace wellness programs. The second possible reason for the discrepancy in findings is that employers may not adhere to wellness program design and implementation best practices, and this variation could contribute to the inconsistent findings in the literature (Serxner et al. 2009).
Our study examined the impact of PepsiCo Inc.’s (PepsiCo) comprehensive wellness program on medical costs and utilization during the period 2004–2007. We applied analytic approaches that enabled us to overcome typical methodological issues present in most prior studies. To address potential selection bias, we used propensity scores to match program participants to comparable members who were eligible for but did not participate in the program. In addition, we made use of two years of cost and utilization data prior to program implementation, and thus addressed possible regression to the mean effects. We further controlled for other nonwellness programs that were implemented during the time period, including disease management, case management, and a nurse advice line. We hypothesized that wellness program participation is associated with fewer inpatient admissions and emergency room visits, as well as lower medical costs.
Method
The Wellness Program
PepsiCo began implementation of a comprehensive wellness program in 2004, sourcing its program from multiple vendors. All members of PepsiCo’s self-insured health plan were eligible for the wellness program, which included a health information web portal, a HRA, and a variety of lifestyle management programs. The HRA was a confidential health questionnaire that could be completed either online, by phone, or on paper. The program offered members a personalized report on their health status and made recommendations regarding available programs and other ways to improve health. The web portal provided information on common medical conditions as well as health education materials. Lifestyle management included programs on weight control, fitness, nutrition, stress, and smoking cessation. HRA and health plan data were used to determine member eligibility for each lifestyle management program. Eligible members were invited to participate; if they consented to participation, they received health education materials and were contacted by a health coach to conduct personal health coaching regarding health risks. Several other nonwellness programs were implemented during the study period, including disease management, case management, and a twenty-four-hour nurse advice line. PepsiCo’s disease management program focused on diabetes, coronary artery disease, asthma, chronic obstructive pulmonary disease, and low back pain. Case management offered members support for conditions or complex surgeries that were not part of disease management. PepsiCo offered members an incentive of seventy-five dollars for completing the HRA, with an additional seventy-five dollars offered for participating in a program for which the member was determined eligible.
Data Sources and Study Sample
We used the company’s 2004–2007 program eligibility and participation data, as well as medical and prescription claims data. These data were readily available for PepsiCo’s self-insured plan members, including employees and their dependents. Since the study focused on a working population, we excluded members below age eighteen or over age sixty-four. Also, medical claims data were not necessarily complete for those age sixty-five or older because of Medicare. All members included had at least one intervention year and two baseline years of data that enabled us to better control for regression to the mean. More baseline data helped ensure the balance in cost and utilization trajectories between participants and nonparticipants prior to program implementation. Members participating in disease management or case management at baseline (2002–2003) were also excluded because participation in either program could potentially affect baseline costs and utilization; however, those who participated in these two programs during the intervention years (2004–2007) were included. There were 15,587 unique members who met the aforementioned criteria and were eligible for PepsiCo’s wellness program in at least one of the intervention years.
Statistical Analysis
Based on the propensity score, program participants were matched to members who were eligible for but did not participate in the program. Participation was defined as actual engagement with the wellness program, including interventions via mail, phone, or in person. The propensity scores were generated using a logistic regression, where the dependent variable indicated whether an eligible member ever participated in the program in any of the three intervention years. The independent variables included age, gender, DxCGrisk score, indicators for chronic conditions, and baseline costs and utilization. DxCG risk score is an index for predicting a member’s medical cost based on demographics and clinical diagnoses. Interactions between age, gender, and DxCG risk score were also included, as were power functions of baseline costs and DxCG risk score. We used the nearest one-to-one matching without replacement because the number of participants and nonparticipants were similar. To ensure covariates were balanced between the two groups after matching, we used a caliper of .005 and required matching to be within the region of common support, meaning the matched participants’ propensity scores could not exceed the maximum or minimum propensity score of nonparticipants. After matching, paired t-tests were conducted to test difference-in-differences by comparing the differences in costs and utilizations between each intervention year and the average of the two baseline years.
Our main analyses focused on members who had at least one full year of data during the intervention period (2004–2007) and did not participate in case management or use the nurse advice line. Because only a small number of members used the nurse advice line (209) or participated in case management (83) and few potential control members existed for participants in these programs, we included them only in the sensitivity analyses. All matching was stratified by disease management participation status. Including additional members who participated in case management or used the nurse advice line did not change the main conclusions. In addition, as part of the sensitivity analyses, we conducted two regression models using propensity scores as weights. First, we used all the five years of data (including two baseline years) and a generalized estimating equations (GEE) approach (Pan 2001; Zeger and Liang 1986), which was employed to account for the correlation within members and the skewed distribution of the dependent variables. For medical costs, we used a log link and a Gaussian family distribution, and for inpatient admissions and emergency room visits, we used a log link and a Poisson family distribution. Second, we ran a model using individual-level fixed effects to control for unobserved time-invariant characteristics based on the three years of intervention data, with the dependent variable being the differences in costs and utilization between those of each intervention year and the average of the two baseline years. These additional analyses further confirmed the robustness of our main analysis results.
We adjusted all costs to 2010 U.S. dollars using the Consumer Price Index (Bureau of Labor Statistics 2011). Medical costs were expressed as PMPM costs. In the analysis, utilization was measured as the number of admissions and the number of emergency room visits per member per year. For presentation purposes, we have described final results as utilization per one thousand member years.
Results
Among the 15,587 unique members meeting the inclusion criteria, 3,032 participated in the wellness program for only one or two intervention years, 818 participated in disease management, 83 in case management for at least one intervention year, and 209 used the nurse advice line between 2004 and 2007. Our main analysis excluded nurse advice line users and case management participants, who were included in the sensitivity analyses. The final sample consisted of 7,200 wellness program participants and 8,101 nonparticipants who were eligible for the program. As illustrated in Table 1, compared with nonparticipants, wellness program participants were slightly older, more likely to be female, and less likely to be a dependent. Participants were also more likely to have chronic conditions such as asthma, congestive heart failure, and depression at baseline. The average DxCG risk score was higher among participants than nonparticipants in both baseline years. In the second baseline year, the inpatient admission rate for participants was 38 percent higher than that for nonparticipants. The PMPM costs of participants were significantly higher compared to nonparticipants in both baseline years.
Member Characteristics before Propensity Score Matching.

Note: All costs are in 2010 U.S. dollars. SD = standard deviation; COPD = chronic obstructive pulmonary disease; ER = emergency room; IP = inpatient.
Age, gender, and whether a member was an employee were shown as of baseline year 2.
About 92 percent (6,623) of participants were matched to nonparticipants, whereas the rest (577) were not on common support. The unmatched participants were older, more likely to be female, and more likely to have chronic conditions such as asthma, coronary artery disease, congestive heart failure, chronic obstructive pulmonary disease, diabetes, and depression. In addition, the unmatched participants had higher total medical costs, more inpatient admissions and emergency room visits, and higher DxCG risk scores.
Among those who were matched successfully, the two groups were balanced across all covariates (Table 2). Although participants in general had slightly lower costs and utilization as measured by inpatient admissions, emergency room visits, and PMPM costs, the differences were no longer statistically significant.
Member Characteristics after Propensity Score Matching.

Note: All costs are in 2010 U.S. dollars. SD = standard deviation; COPD = chronic obstructive pulmonary disease; ER = emergency room; IP = inpatient.
Age, gender, and whether a member was an employee were shown as of baseline year 2.
When examining unadjusted difference-in-differences results prior to matching, we did not find significant differences in costs and utilization between the two groups except that PMPM costs increased slightly more in the intervention group, although it was not statistically significant at the 5 percent level (Table 3). After the propensity score matching, no significant difference-in-differences estimates of cost and utilization were observed across the two groups at the 5 percent level. Additional analyses that used propensity score weighted regressions or included members enrolled in case management or using the nurse advice line did not result in significant findings.
Difference-in-Differences in Costs and Utilization by Program Participation.
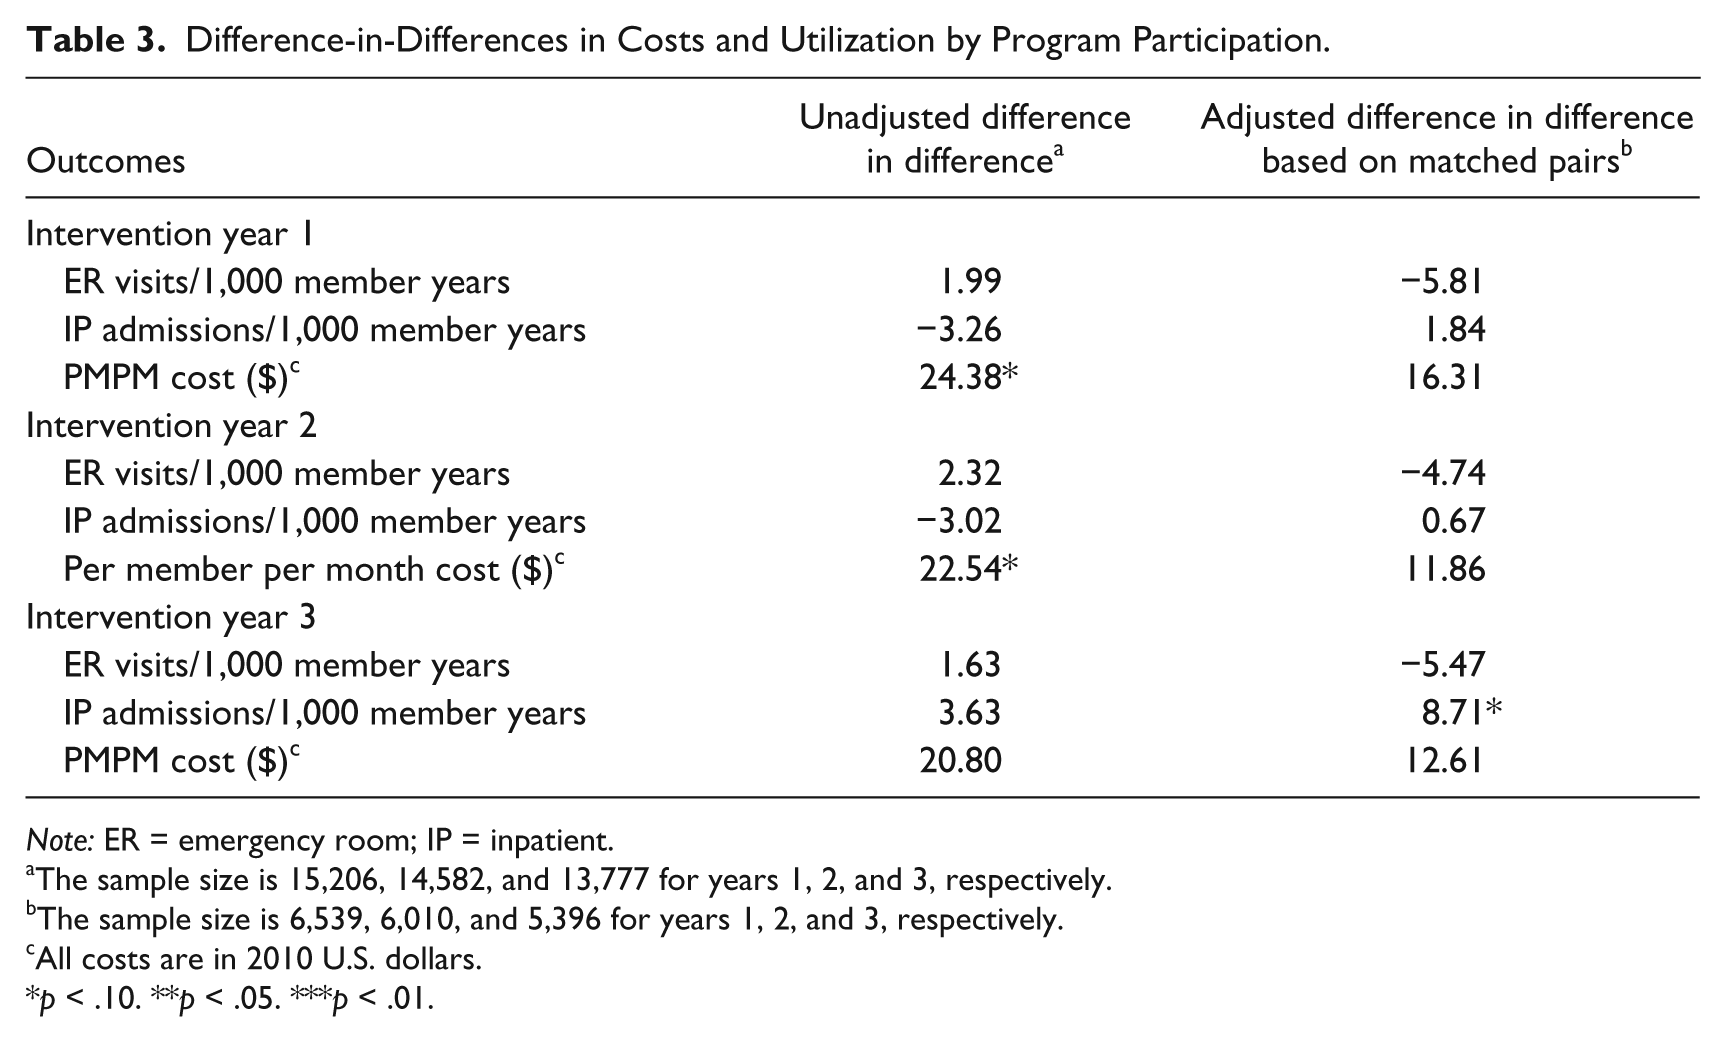
Note: ER = emergency room; IP = inpatient.
The sample size is 15,206, 14,582, and 13,777 for years 1, 2, and 3, respectively.
The sample size is 6,539, 6,010, and 5,396 for years 1, 2, and 3, respectively.
All costs are in 2010 U.S. dollars.
p < .10. **p < .05. ***p < .01.
Conclusion
Our study did not demonstrate a significant impact of PepsiCo’s wellness program on medical care utilization and costs, and sensitivity analyses failed to change the main conclusion. It should be noted that the wellness program defined in our study did not include disease management. In a separate study using the same data, we have shown that disease management was effective in reducing medical costs and utilizations (Liu et al. 2012). Our study findings are similar to those of the University of Minnesota where the authors found that it was disease management that saved medical costs, not the wellness program (Nyman et al. 2010).
Prior studies of the workplace wellness programs of major U.S. employers suggest that they can save medical costs and generate a return on investment (Baicker et al. 2010). However, some studies, such as the evaluations of wellness programs at Highmark (Naydeck et al. 2008) and at Johnson & Johnson (Henke et al. 2011), have included disease management as part of the intervention being evaluated; thus, our findings may not be directly comparable to such studies. Another possible explanation for our findings is that it takes more than three years for a wellness program to realize its benefits on reductions in costs and utilization, meaning our analysis period may not be sufficient to detect significant changes in these outcomes. However, according to a recent meta-analysis by Baicker et al. (2010), ten out of fourteen studies that showed cost savings were based on three or fewer years of data. Further research is warranted to identify the minimum number of years required to determine the effectiveness of a wellness program on outcomes, including costs and utilization.
The discrepancy between our findings and those of other studies may be due to the variation in the design features, implementation, intervention intensity, and/or incentives offered to encourage program participation (Goetzel and Ozminkowski 2008; Nyman et al. 2010). There is wide variation across wellness programs regarding the type of programs offered to employees, and sometimes to spouses and dependents. Variation also exists in how programs are administered. Typical approaches for implementing interventions include health education materials either electronically or in print, group classes, online tools, and individual or group counseling (online, via telephone, or in person). The types of programs and interventions also depend on the vendors selected by employers. From a policy perspective, the standardization of wellness programs may improve the overall program effects in the working population because these standards are likely to incorporate best practices. In particular, implementation methods likely have a large impact on ultimate program effectiveness. To that end, the Health Enhancement Research Organization (HERO) developed the HERO Best Practice Scorecard, which provides an inventory of best practices to help employers design and implement a wellness program (HERO 2009). The scorecard includes six key dimensions: strategic planning, leadership engagement, program-level management, programs, engagement methods, and measurement and evaluation. In addition, the National Committee for Quality Assurance is spearheading an accreditation program for wellness and health promotion (National Committee for Quality Assurance 2012). It emphasizes how programs are implemented, how interventions are provided, and how health information is protected. Furthermore, it has constructed measures to compare wellness programs across vendors. The emergence and wide use of accreditation programs are likely to increase competition in the wellness program market and, as a result, improve program offerings. This, in turn, will increase program impacts on health outcomes and medical costs.
Our methodology has two advantages. First, we limited the analysis to members with at least two baseline years of data to better control for possible regression to the mean effects. Individuals with high medical costs at baseline will often have lower medical costs in the years that follow even in the absence of program participation. The opposite is true for members with low or no costs at baseline. Thus, the regression to the mean effect is likely to confound the effect of program participation. More baseline data will enable propensity score matching to better balance the cost trajectories between participants and nonparticipants at the baseline, and therefore will better control for regression to the mean effects. In addition, we used propensity score matching to identify a comparison group with similar characteristics to program participants. All covariates were balanced after propensity score matching. Nonetheless, our study was subject to a potential bias in that we only controlled for observables. Unobserved characteristics of members could drive participation decisions and, thus, could potentially bias our results, although our sensitivity analysis using an individual-level fixed-effect regression generated similar conclusions.
Future research may focus on methods that could better address selection bias. One possibility is to use employers that do not implement a program for comparison as done by Henke et al. (2011). However, given that wellness programs are popular among employers, it has become increasingly difficult to find a comparison employer without a wellness program. Another possibility is to find a valid instrumental variable that is correlated with the decision to participate in the program but not with health outcomes or medical costs. This is also challenging since weak instruments may still result in bias and underestimated standard errors (Murray 2006).
The importance of workplace wellness programs was heightened by the passage of the Affordable Care Act. According to the law, small firms are allowed to apply for grants to establish a wellness program, and a ten-state demonstration will be implemented by 2014 to provide a wellness program to enrollees in the individual insurance market. Further, employers will be allowed to offer incentives up to 30 percent of the cost of insurance coverage in 2014, and the proportion could be increased to 50 percent at the discretion of the secretaries of labor, health and human services, and the treasury. Nevertheless, to further inform policymaking, rigorous research remains needed to reach a robust conclusion that workplace wellness programs do improve health and reduce medical costs, especially among medium- or small-sized employers. Additional research to identify program design or implementation features that are key to program success will be extremely informative for policymakers.
Footnotes
Declaration of Conflicting Interests
The author(s) declared no potential conflicts of interest with respect to the research, authorship, and/or publication of this article.
Funding
The author(s) disclosed receipt of the following financial support for the research, authorship, and/or publication of this article: This research was funded by PepsiCo Inc.