
Abstract
The lived experiences of those who work at night have been subject to increased attention from both scholars and policy makers; however, there remains limited geospatial and quantitative evidence on the challenges they face and how these unfold across space and time. This gap is most evident in the continued dependence on “daytime” data and assumptions, that presume the traditional “9–5” working day, at the expense of the specific needs of night workers. In this context, lack of access to food has emerged as a critical yet underexplored issue. While recent accessibility models increasingly account for the temporal dynamics of their supply-side components (e.g., service operating hours), they either overlook population dynamics or treat nighttime populations as homogenous, thus masking the distinct service needs of active night workers. This study addresses these limitations by developing the first dynamic food accessibility model that explicitly accounts for the shifting spatial distribution of night workers in Greater London. Leveraging novel mobile phone location data, we provide deeper insights into the spatial and temporal realities of working at night in London. Beyond demonstrating that access to food retail outlets for night workers is markedly poorer than for daytime workers, our proposed (in)sufficient accessibility framework identifies where and when this issue is most acute. Through its empirical insights and methodological innovations, this article therefore contributes to ongoing debates on spatial justice and nighttime urban strategies.
Introduction
The dark hours of the day have, until recently, been largely overlooked in policy, public discourse, and academic research (Acuto et al., 2022). Yet, the nighttime city, like its daytime counterpart, is a complex and vital system shaping social, economic, environmental, and cultural life. Using the case of food retail accessibility for nighttime workers in Greater London, we demonstrate the importance of tailored research approaches to better understand and support cities at night.
As exemplified in the Urban Studies special collection on the nighttime city (Van Liempt et al., 2015; see also Shaw, 2022), recent scholarship has moved beyond its early focus on the commercialization of the “Night-Time Economy” (NTE) to explore the broader geographies and actors of the urban night. Policy has also evolved, with an increasing number of cities adopting “24-hour city” strategies and appointing “night mayors” or equivalent roles (Seijas and Gelders, 2021). Within this expanding field, the realities and challenges of nighttime labor—previously overlooked—have become a prominent topic of inquiry. Drawing from different disciplines and perspectives, a growing body of work reveals multiple forms of injustice that nighttime workers experience relative to their daytime counterparts, including higher precarity, inadequate public transport (PT), safety concerns, and adverse health outcomes (Kolioulis et al., 2021; McArthur et al., 2019; Shaw, 2022). More recent ethnographic studies have further illuminated the largely hidden lived realities of migrant night workers on whom the economies of global cities depend (see MacQuarie, 2023).
While this scholarship has significantly advanced understandings of the challenges of nighttime labor, there remains limited geospatial and quantitative evidence showing how these injustices unfold across space and time. This gap is particularly striking given that nighttime workers—commonly defined in the UK as those “usually” working between 6 p.m. and 6 a.m.—make up nearly a quarter of the national workforce, including 1.32 million in Greater London (GLA, 2024). Despite their numbers, many planning strategies continue to rely on daytime assumptions and data, overlooking the distinct realities of nighttime communities (Acuto et al., 2022). Among the various challenges of night work that require more granular spatio-temporal research, access to food stands out as one of the most critical. A recent survey indicates that more than half of London’s night workers struggle to find healthy food during or after their shifts, and over a third believe that 24-hour access would improve their working conditions (Cottell, 2024).
To meaningfully address such gaps in provision, analytical approaches must move beyond static daytime models. Recent advances in geospatial analysis and open datasets have enabled time-sensitive models of food access (Stępniak et al., 2019), making it more common to examine how the temporality of transport networks and shop opening hours shapes the supply side of accessibility across day and night (Abdelfattah et al., 2025; Tenkanen et al., 2016). However, most studies still overlook temporal changes in demand. Järv et al. (2018) addressed this by proposing a dynamic location-based accessibility framework that, using mobile phone location data, accounts for temporality of all its layers: people, transportation and amenities. Although the conceptual framework is well suited for the analysis of food accessibility at night, the original study treated the temporal population as homogeneous, failing to distinguish between active workers, sleeping residents, and other groups. In the specific context of access for nighttime workers, this limitation risks obscuring underserved areas and hindering effective policy targeting.
This study addresses these limitations by using novel mobile phone location data, which provide separate counts of workers, residents, and visitors at fine spatial and temporal scales. Building on Järv et al.’s (2018) framework, we integrate worker footfall, shop opening hours, and PT schedule data to develop a food retail accessibility model that explicitly accounts for the changing distribution of night workers in Greater London.
This article makes three key contributions. First, it provides novel empirical insights into 24-hour food retail accessibility for London’s workforce, revealing spatial and temporal disparities and contributing to debates on spatial equity at night. Second, it introduces a heuristic framework informed by the principle of sufficientarianism (Martens, 2016), which holds that all individuals should be entitled to a minimum, adequate level of accessibility to key amenities. The framework identifies all areas that fall below the predefined threshold and quantifies the number of workers affected, thereby highlighting which locations may require policy attention the most. Third, it reflects critically on the methodological challenges of applying accessibility models to the nighttime city. We argue that such models must move beyond daytime assumptions and instead prioritize demonstrably active groups, such as night workers, to accurately capture the demands of the nighttime city. Our findings offer valuable insights for planners and policymakers aiming to build more equitable, accessible, and sustainable cities.
Literature review
We begin by outlining the multiple challenges faced by people working at night. Although past research has documented various injustices within nighttime labor, much of this work remains siloed within disciplinary boundaries, limiting a fuller understanding of how these issues intersect (Shaw, 2022). In line with recent calls for more interdisciplinary research on the night (Acuto, 2019), we present these challenges as distinct yet interconnected aspects of the lived experiences of night workers.
Within this landscape, disparities in access to food emerge as a critical yet underexplored issue that cuts across several dimensions of the right to the (night) city, from health and well-being to inadequate public transport and the limited operating hours of essential services. A review of location-based accessibility models follows, which is focused on their relevance to food and nighttime workers since broader conceptual debates are addressed elsewhere (e.g., Geurs and Van Wee, 2004). While centered on Greater London, reflecting the study’s geographic and policy focus, the insights offer broader applicability to urban nighttime environments. Consistent with definitions used by the Office for National Statistics (ONS) and the Greater London Authority (GLA), nighttime workers are defined here as those who “usually” work between 6 p.m. and 6 a.m. (GLA, 2024).
Challenges of nighttime working
Home to approximately 8.9 million people (around 13% of the UK population), Greater London is a major employment hub with a 2023 workforce of 5.3 million (ONS, 2024). Of these, 1.32 million were classified as nighttime workers, constituting 16% of the UK’s night workforce (GLA, 2024). Though London is famed for its nightlife, most people working at night are employed in sectors such as Professional services (231,000), Health (181,000), and Transport and Storage (147,000).
Night work often entails greater precarity than daytime work. In London, night workers are more likely to be paid below the London Living Wage (17% vs 12%) and are twice as likely to be in insecure employment (18% vs 9%; GLA, 2024). These inequalities are unevenly distributed across society, with people from ethnic minority and migrant backgrounds more likely to be employed at night (Cottell, 2024). Whilst past research (see Shaw, 2015) reminds us that some nighttime workers appreciate the flexibility and atmosphere of their roles, a 2024 survey found that most in London (69%) would prefer to work during the day if they could retain the same hours and pay (Cottell, 2024).
A wide body of literature has also documented the negative impacts of shift and night work on health. These include acute effects—such as sleep disruption, digestive issues, and social isolation—and long-term risks including metabolic disorders, cardiovascular disease, and diabetes (Kantermann et al., 2010; Rajaratnam and Arendt, 2001). Additionally, shift work has been linked to poorer dietary habits, including increased meal frequency, lower diet quality, and irregular energy intake across the day (Fitzhugh and Gibson, 2024; Nea et al., 2015).
Furthermore, night workers are systematically denied equitable access to infrastructure and amenities available to daytime workers—an injustice central to this paper. Prior research on nighttime cities highlights issues such as inadequate and costlier public transport (Smeds et al., 2020), safety concerns (Brands et al., 2015; Chandra et al., 2017), and the resulting social exclusion experienced along lines of gender, race, and income (McArthur et al., 2019; Plyushteva and Boussauw, 2020; Schwanen et al., 2012). Analyzing London’s nighttime policy, Smeds et al. (2020) also argue that planning strategies often privilege imagined consumers of the NTE, overlooking the distinct needs of nocturnal workers.
Beyond transportation and safety, limited access to food has emerged as a significant yet under-researched challenge for night workers. A 2024 survey by the Living Wage Foundation (n = 2142) found that 52% of London night workers struggle to access healthy food during their shifts. When asked what would improve their working conditions, 35% of respondents indicated that 24-hour access to healthy and affordable food would do so, with an equal share calling for more retail options open at night (Cottell, 2024). Moreover, twice as many respondents reported that purchasing food or beverages at night is more expensive than during the day (32% compared to 14%), a disparity likely driven by the closure of lower-cost supermarkets after dark. This finding is particularly relevant for non-public sector and informal workers, who lack institutional food support, such as workplace canteens.
The issue extends beyond the mere availability of food during work shifts; it also concerns the broader challenge of accessing food retail outlets for home use outside of conventional retail hours. Existing literature on nighttime retail behavior highlights that extended store opening hours are highly valued by shift and night workers, who, without such flexibility, would be forced to wake earlier to shop during standard hours or rely on others to shop on their behalf (Geiger, 2007; Richbell and Kite, 2007).
The limited availability of food retail outlets at night often results in an over-reliance on fast-food outlets and vending machines (Fitzhugh & Gibson, 2024). As in the broader food desert discourse, several studies link this constrained food environment to poor dietary habits and adverse health outcomes among night workers (Nea et al., 2015; Rubner et al., 2023). However, the direct relationship between limited nighttime food access and diet-related health outcomes for this group remains insufficiently explored.
Accessibility, food, and night workers
Much of the literature on food access centers on the concept of “food deserts,” defined as areas with limited spatial and socio-economic access to healthy, affordable food (see Smith and Thompson, 2023). Although these areas are often associated with poor diets and adverse health outcomes, the causal relationship between food deserts and health remains contested. Contradictory findings are partly due to differing conceptual frameworks and a predominant focus on residential areas during a single daytime snapshot (Widener and Shannon, 2014).
To understand whether limited access to food retail contributes to negative dietary behaviors for night workers, it is essential to model both supply and demand across space and time. Additionally, even in the absence of a clearly established causal link, spatial and temporal injustice remains a critical concern for individuals lacking reliable access to food retail outlets (Smith and Thompson, 2023). It relates to broader “right to the city” concerns, which stress that everyone, regardless of income, job location, or working hours, should be able to make healthy dietary choices (Soja, 2010).
In recent years dynamic models of food accessibility have been developed, which incorporate novel time-sensitive data (for an overview, see Järv et al., 2018). For example, Tenkanen et al. (2016), responding to Widener and Shannon’s (2014) call to consider not only where but also when food deserts occur, developed a multimodal model incorporating store opening hours, PT schedule data, and different transport modes. In Helsinki, they showed that 90% of residents could reach a grocery store using PT in 15 minutes at 5 p.m., but only 15% at 1 a.m., underscoring the significance of time in accessibility research.
Järv et al. (2018) extended this framework and replaced static, register-based population with temporal estimates, reflecting that people access services from more than just their home locations. For this purpose, they leveraged mobile phone location data, which, passively generated and commercially available, offer high-resolution estimates of population distribution across time and space (Panczak et al., 2020). The framework proved to be highly effective in capturing changes in demand and supply for access to grocery stores across 24 hours, making it ideal for the purposes of our study.
However, the model treated the temporal population as a homogeneous group, failing to differentiate between residents, workers, and tourists. While this may suffice for daytime models, it presents problems for research on nighttime access: most people are inactive, and those who are active are not necessarily working.
As such, we argue that using the entire ambient population as a proxy for demand can misrepresent actual service needs at night. While residents and tourists also seek food services, studies and policy strategies that focus on night workers should reflect that. In this article, we therefore use worker-specific counts to identify service gaps more accurately. This approach is also relevant for broader accessibility research, where demand populations are often not clearly justified (La Rosa et al., 2018).
Mobile phone location data help meet this need since methods for inferring home and work locations, from frequency counts to time-of-day heuristics (Verma et al., 2024; Yang et al., 2021), now allow researchers to identify groups such as workers within anonymized footfall datasets. This provides an important alternative to traditional sources such as the Labour Force Survey (LFS), which is used for official estimates of night workers in the UK. For instance, GLA (2024) estimates that there are 1.32 million night workers in London, but the survey offers little information about where and when this labor occurs.
Mobile phone data offer fine-grained insights into the spatio-temporal patterns of night work, including informal or unregistered labor often missed by surveys (Acuto et al., 2025). Integrating this information into a night-based accessibility model enables more accurate assessments of the relationship between worker demand and service availability.
Data and methodology
This study builds on the dynamic accessibility framework by Järv et al. (2018) to examine how temporal changes in worker distribution, public transport, and shop opening hours affect access to food retail outlets for workers in Greater London (see Figure 1). While accessibility can be assessed through various methods, travel-time remains one of the most used and intuitive indicators, capturing the relative ease with which individuals can reach essential destinations (Frank et al., 2008). In this analysis, we calculate travel-times, by walking or via PT, between the location of workers (origins) and the nearest open food retail outlet (destinations) for each hour across a 24-hour period.
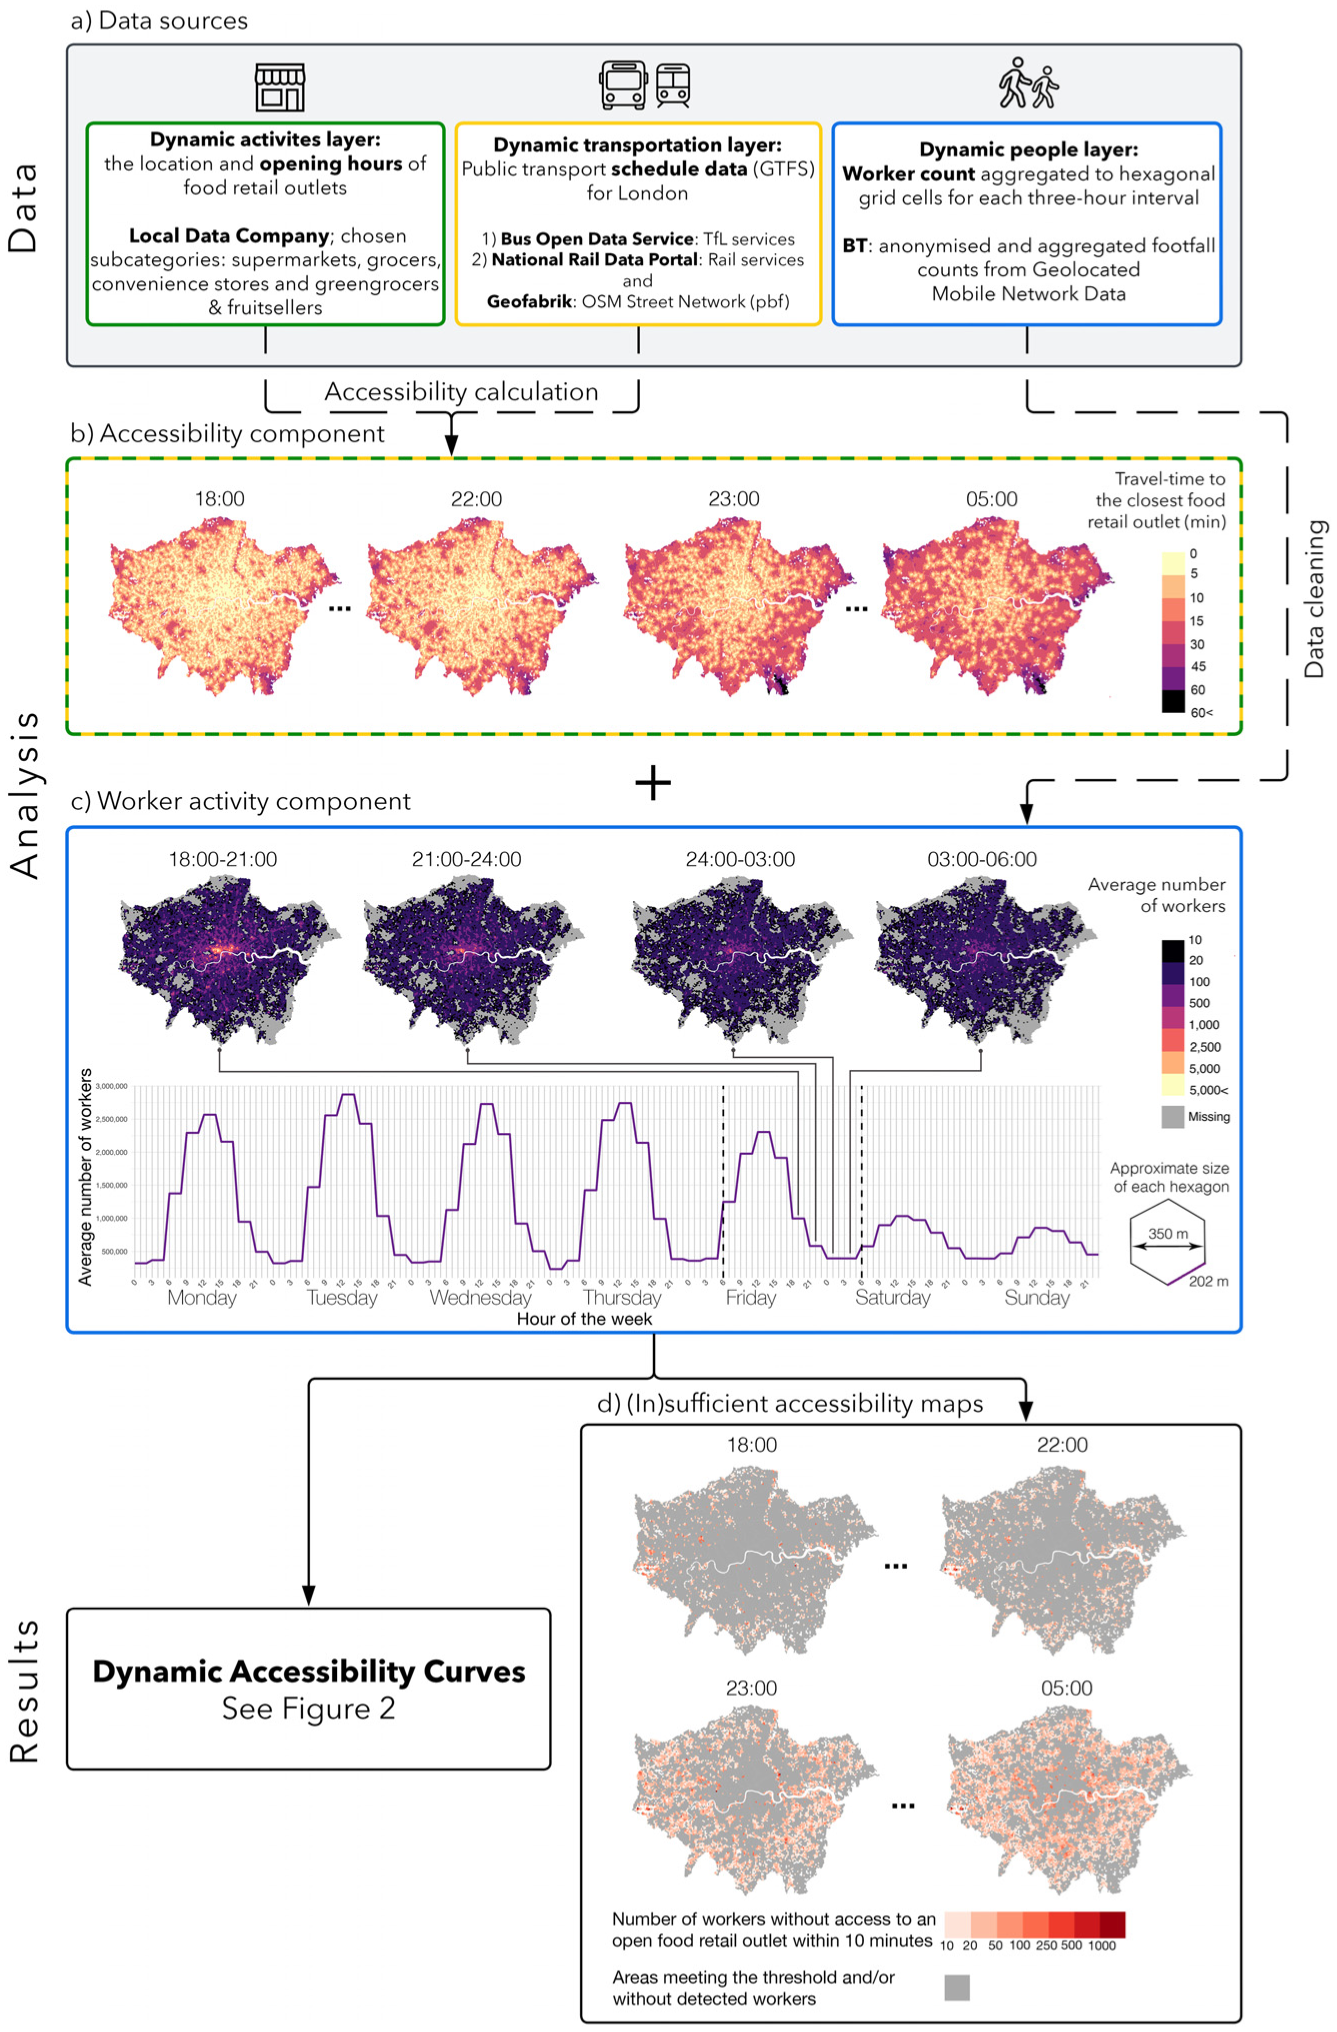
Study design for the spatio-temporal analysis of food retail access among night workers in London. Panel (a) displays all data inputs used in the model. Panel (b) presents accessibility maps showing travel-time to the nearest open food retail outlet at four selected hours: 6, 10, and 11 p.m. on Friday, and 5 a.m. on Saturday. Panel (c) includes a graph of average worker counts per 3-hour window across the week (January 2024), and maps of worker distribution for Friday/Saturday night. The dashed lines on the graph indicate the 24-hour analysis window (Friday 6 a.m. to Saturday 6 a.m.). Panel (d) shows (in)sufficient accessibility maps, using a 10-minute threshold example. The count of workers is presented only for areas that do not have a food retail outlet within this travel-time threshold.
The analysis uses a fine-grained hexagonal grid (350 m edge-to-edge), for which hourly worker counts were provided. Recognizing that temporal patterns vary across days and seasons, the analysis focuses on a monthly average of 1 weekday to ensure consistency. Based on sensitivity checks, Friday (using January 2024 data) was selected because it features a diverse night workforce, including sectors active across both weekdays and weekends, and thus offers a good generalization of overall patterns. While a multi-season analysis is necessary for future policy work, this article focuses on demonstrating the methodology and general trends using this representative day. Accessibility is calculated hourly from 6 a.m. Friday to 6 a.m. Saturday, capturing a full 24-hour period that includes one continuous night.
Worker component
To capture night worker activity, we use anonymized, aggregated footfall data provided by BT Group through the GLA High Streets Data Service. The dataset is based on mobile phone location data from EE, the UK’s largest network (owned by BT), which held a 30% market share in 2022 (Statista, 2022). BT’s system continuously records devices using real-time signaling and network topology to triangulate anonymized handset locations into 50 m × 50 m grid squares. To correct for demographic and regional market share biases and to estimate true footfall, BT scales the data using inferred home locations and corresponding demographic distributions from census data. For validation, BT compared its footfall counts to official match-day attendance figures at two London football stadiums—Craven Cottage and Emirates Stadium—finding only a 0.3% and 4.6% difference, respectively.
Home and work anchor points—and thus resident, worker and visitor counts—are inferred using the first and second most visited locations of each person in the last eight weeks. In personal communication, BT representatives outlined that points are clustered using DBSCAN if they fall within a spatial proximity of 150 m, indicating they belong to the same location. The device needs to appear at a location for at least 10 minutes and be present for two-thirds of the month to be recorded. To protect individual privacy, the dataset is aggregated to a 350-m hexagonal grid and three-hour time intervals.
In this study, we use only the worker footfall data, averaging values for each three-hour time-window of the week across January 2024 (see Figure 1(c)). The study assumes footfall is static within each three-hour interval and use this as a proxy for the temporal distribution of workers. This form of aggregation also reduces the likelihood of data suppression, since worker footfall counts below 10 per hexagon per time-window are omitted to protect privacy. Although BT applies established heuristics to identify workplaces, some uncertainty remains due to the focus on night workers (who do not follow typical mobility patterns), the lack of survey benchmarks, and data suppression. Nevertheless, several checks indicate that the dataset credibly represents nighttime work activity. Spatial and temporal patterns align with expectations: reduced activity during holidays, higher concentrations around airports, hospitals, and high streets, evening-only activity in office districts, and minimal counts in residential areas and parks. The dataset was also used in a Mayor of London endorsed report (GLA, 2024) and reviewed by stakeholders familiar with London’s nighttime economy. Substituting suppressed values with a midpoint estimate (e.g., 5) had also negligible impact on observed city-wide accessibility trends.
Transport component
Most night workers in London commute via PT or active travel modes, which is why our model focuses on these forms of mobility (see GLA, 2024). While we acknowledge that some night workers also rely on private cars or ridesharing, our results still reflect relative accessibility for these users. To capture the routes and schedules of all Transport for London and rail services, we utilize two open-access General Transit Feed Specification (GTFS) datasets (see Figure 1(a)), selecting Friday, March 1, 2024, and the following Saturday as the nearest dates to January for which both datasets were complete.
Store component
The location and opening hours of food retail outlets were provided by Green Street (formerly Local Data Company) via the SDRUK Geographic Data Service and this study uses March 2024 snapshot of the dataset. 1 Four retail subcategories were included to provide a broad and realistic representation of food retail availability in London: “Supermarkets,”“Grocers,”“Greengrocers & Fruitsellers,” and “Convenience Stores.” In this study, we use the term “access to food retail outlets” rather than “access to healthy food,” as some previous studies with similar POI selections have done, acknowledging that not all outlets within these categories will necessarily offer healthy products. To address boundary effect, stores within 2000 m of Greater London’s boundary were also included. The final dataset comprises 8337 outlets: 967 supermarkets, 1888 grocers, 5208 convenience stores, and 274 greengrocers and fruitsellers, making this, to our knowledge, the most comprehensive analysis of food accessibility in London to date.
Dynamic accessibility calculation
The first step in the methodology involves calculating a travel-time matrix between the centroids of all hexagons in the study area for each departure time. Since the spatial units are granular, on average such a method does not significantly decrease the precision compared to travel-time straight to the destination, but it drastically reduces computational time (Pereira and Herszenhut, 2023). This is done using r5r, an R package for rapid realistic routing on multimodal transport networks, which incorporates GTFS and street networks data. Door-to-door travel-times account for all components of the journey, including walking, waiting, and transfer times, determining the quickest route for each origin-destination pair. If walking alone is faster than PT route, which is often the case at night, the walking time is used.
In the accessibility matrix, origins are defined as the centroids of hexagons located within the Greater London area, while destinations include centroids of hexagons situated up to 2000 m beyond the city boundaries to account for potential boundary effect. Hexagons that do not contain a detectable street segment are considered inaccessible and excluded from the analysis. The matrix is computed for each hour between 6 a.m. on Friday and 6 a.m. on Saturday, March 1–2, 2024.
For each departure time, travel-times are calculated for every minute within a 30-minute window, with the median value reported to balance representativeness and computational efficiency. The time-window approach addresses the aggregation issue within the modifiable temporal unit problem (Pereira, 2019). The interpretation of the median travel-time is that a user can reach the closest store within that time at least 50% of the time during the window, appropriate for flexible trips like grocery shopping (Conway et al., 2018). Walking speed is set at 5 km/h.
The second step links the travel-time matrices with the pool of available shops for each hour. Using the r5r outputs and the R accessibility package, travel-times (in minutes) are calculated to the nearest hexagon containing at least one open food retail outlet for each departure time. This process generates one travel-time result per hexagon for each hour (see Figure 1(b)). If, for example, a store closes at 9 p.m., it is considered within the pool for an 8 p.m. departure but excluded for a 9 p.m. departure.
Finally, the share of workers within a given time-window is calculated for each hexagon and linked to accessibility results. This combined dataset enables analysis of the proportion of workers with access to an open food retail outlet within specified travel-time thresholds across the night, the final dynamic model.
Due to the inclusion of sensitive and securely held datasets, part of the analysis was conducted within a secure data environment. All outputs were reviewed by a data science team to ensure compliance with statistical disclosure controls.
(In)sufficient accessibility framework
While the dynamic location-based accessibility model provides valuable city-wide figures on how access to retail outlets changes throughout the day and night, it does not explicitly identify which areas require the most urgent policy attention. To address this gap, we develop a simple policy-oriented framework for pinpointing areas of concern, informed by the principle of “sufficientarianism” (Martens, 2016), called (in)sufficient accessibility (IA) metric. While both academic and policy literature increasingly emphasize the need to define what constitutes “(in)sufficient” access to essential services (Van Der Veen et al., 2020), no standardized threshold currently exists for food accessibility within the GLA.
In this study, we demonstrate how our IA metric operates using a 10-minute travel-time threshold. This value was selected as a practical example, consistent with recommendations in the planning literature (Barton et al., 2021), and can be adjusted by individual boroughs to reflect local priorities. Using this threshold, we identify spatial units where (night) workers are present but cannot access a food retail outlet within the defined time frame. Each identified area is accompanied by the number of affected workers, enabling policymakers to prioritize interventions based on both spatial and demographic relevance. In practice, the travel-time threshold simply determines which cells are classified as inaccessible and displayed on a map. Increasing the threshold to 15 minutes, for instance, reduces the number of hexagons identified as underserved but does not alter the underlying worker counts within each cell. 2 The IA metric is formally defined as;

where Ast denotes the travel-time in minutes to the closest open amenity (here food retail outlet) and Wst represents the number of detected people (here workers) in grid cell s and time-period t (equation (1)). This formulation ensures that only areas with lack of accessibility (further than x) and enough workers (above the suppression limit y) are highlighted. In our example, both x and y equal 10, reflecting the 10-minute threshold and the suppression of worker counts below 10 for privacy reasons.
The framework is intentionally simple, scalable, and, to our knowledge, represents the first application of this kind using mobile phone-derived activity data. Given that nighttime economy policies are typically implemented at the local level, in the analysis we use the Royal Borough of Greenwich as a representative example of an Inner London borough.
Results
Spatio-temporal variation of the model’s components
The components of the dynamic accessibility model reveal important insights on their own. The accessibility component demonstrates pronounced spatial and temporal variation in travel-time to the nearest open food retail outlet across the night. Figure 1(b) presents results for four representative departure times: 6 p.m., 10 p.m., 11 p.m., and 5 a.m.
Before 10 p.m., accessibility levels across London remain high: over 65% of hexagons within Greater London have access to an open food retail outlet within a 10-minute walk or PT journey. By 11 p.m., however, this drops to 43%, coinciding with the closure of many small-format supermarkets, and falls below 34% by midnight, remaining low until shops reopen around 6 a.m. While central London retains relatively high levels of food retail accessibility throughout the night, outer boroughs experience significant increases in travel-time, highlighting the disproportionate challenges faced by nighttime workers (and residents) in these areas.
The worker activity component also shows clear spatio-temporal variation, illustrated in Figure 1(c) as the average number of detected night workers across three-hour windows in January 2024. On Fridays, daytime worker numbers are lower than on other weekdays, likely due to increased post-pandemic remote work (Gibbs et al., 2024). In contrast, activity on the night between Friday and Saturday, the focus of our analysis, is relatively consistent with other nights. Overall, worker numbers decline steadily through the evening and night—from 997,000 during the 6–9 p.m. window to 395,000 by 3–6 a.m.—highlighting how single aggregate figures, such as the 1.32 million estimate for London, mask important temporal variations.
Spatial differences are equally pronounced. Between 6 and 9 p.m., work activity spans the entire city, with pronounced concentrations in central boroughs and smaller hotspots in outer areas. These include major office hubs (e.g., the City, Canary Wharf, Stratford), entertainment districts (e.g., the West End, Mayfair), hospitals, transport nodes, town centers, and London Heathrow Airport. As the night progresses, activity declines citywide, first in office areas (9 p.m.–midnight) and later in entertainment zones, yet many locations remain active. Hospitals, town centers, and Heathrow airport, in particular, sustain high worker presence both before midnight and after 3 a.m.
Modelling dynamic accessibility for (night) workers
The travel-time results (Figure 1(b)) illustrate the spatial dimensions of (in)accessibility to food retail outlets; however, they do not reflect the number of individuals affected. Figure 2 addresses this by presenting the outcomes of the dynamic accessibility model, which links the accessibility component with the spatio-temporal distribution of workers. A selection of daytime hours (6 a.m., 9 a.m., 12 p.m., and 3 p.m.) is included for comparative purposes and is depicted using dashed lines. All nighttime hours are represented on an hourly basis using solid lines.
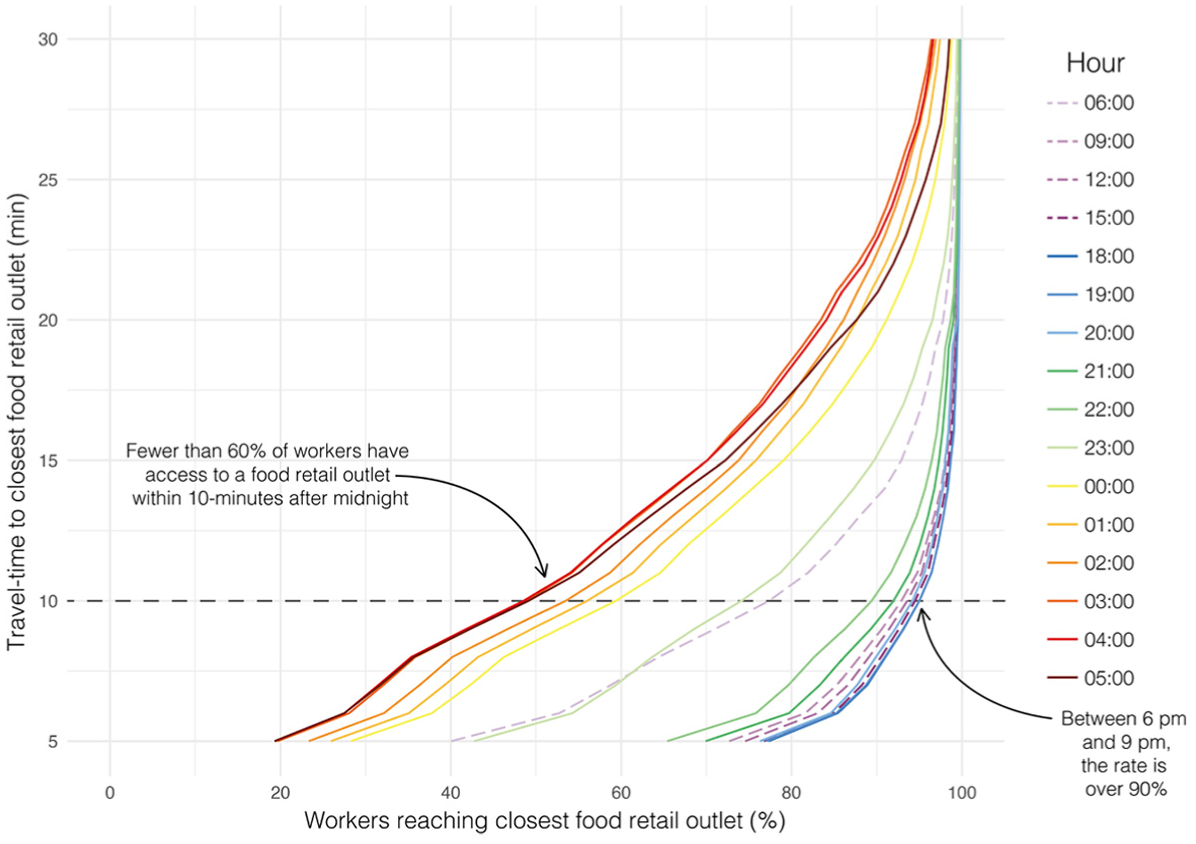
Dynamic accessibility model results. Lines indicate the share of workers that can access the closest food retail outlet within a given travel-time, broken down by hour of the day. The horizontal dashed line marks the 10-minute threshold.
Except for 6 a.m., over 92% of detected workers can access the nearest food retail outlet within a 10-minute walk or PT journey at all surveyed daytime hours. A similar pattern persists between 6 p.m. and 9 p.m., reflecting continuity in accessibility during early evening hours. However, accessibility declines markedly between 10 p.m. and 5 a.m. At 10 p.m., the share of workers within a 10-minute reach drops to 89%, falling further to 74% at 11 p.m. and to 59% by midnight: highlighting the significant impact of widespread store closures during hours when many workers remain active. After midnight, over 40% of detected workers (more than 150,000 individuals) lack access to a food retail outlet within 10 minutes.
During evening and night hours, many workers must undertake extended walks or rely on PT to reach an open store. Although fewer people work at night, our results present clear disparity between daytime and nighttime access to food for London workers. Nonetheless, even at 4 a.m., when only a limited number of shops (<700) remain open, 9 out of 10 workers can still access a store within a 23-minute walk/PT journey.
Greenwich case study
While the dynamic accessibility graph provides valuable city-wide insights, it does not pinpoint underserved areas. To address this, we apply the proposed (in)sufficient accessibility framework to identify all locations falling below the defined accessibility threshold. Results are discussed here for the Royal Borough of Greenwich, with city-wide maps shown in Figure 1(d).
The average total number of detected workers in the borough varies from 23,134 for 6–9 p.m. time-window to 11,764 for 3–6 a.m. window. Although the absolute number of night workers declines significantly after 9 p.m., the count of above 11,000 underscores the prevalence of night work in the borough.
Figure 3(a) presents the proportion of workers in Greenwich who can access a food retail outlet within a given travel-time across each hour of the evening and night. These findings slightly diverge from the citywide averages, highlighting the significance of conducting accessibility analyses at the local level.
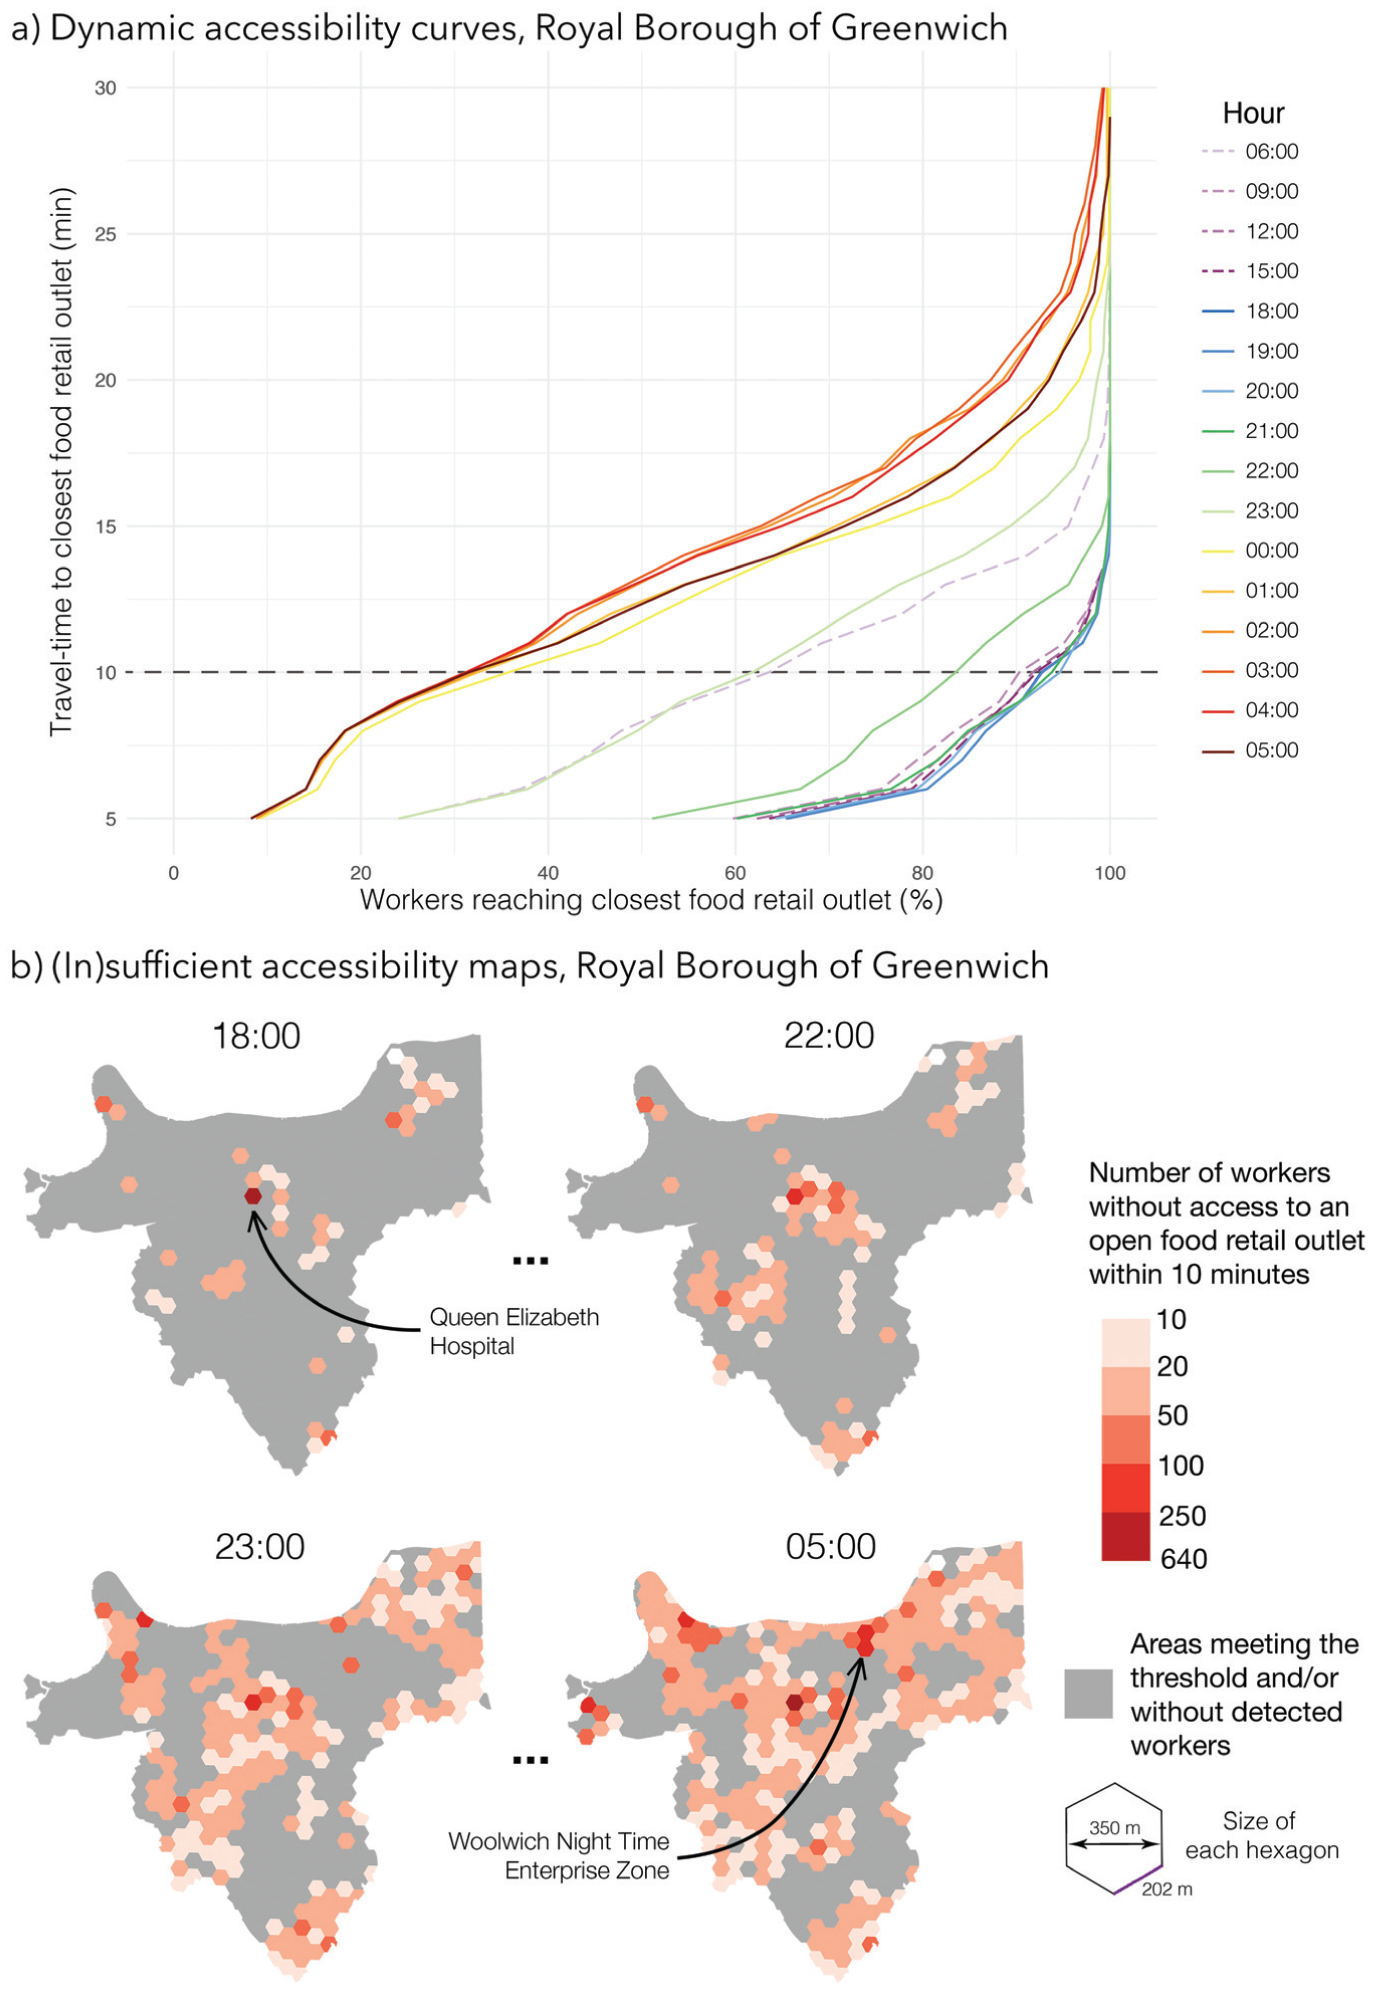
Dynamic accessibility model results for the Royal Borough of Greenwich. The graph (a) indicates the share of workers that can access the closest food retail outlet store within a given travel-time, broken down by hour of the day. The maps (b) present the results of (in)sufficient accessibility framework for four representative hours. The count of workers is presented only for areas that do not meet the accessibility threshold (here using a 10-minute example).
Figure 3(b) illustrates spatial disparities by mapping locations where (1) nighttime workers are present but (2) no food retail outlet is accessible within a 10-minute journey, at four selected hours. As the night progresses, more areas become underserved due to the gradual closure of stores. Unlike typical accessibility maps that may highlight low-access areas with no actual demand (e.g., parks), (in)sufficient accessibility maps prioritize areas where unmet need exists, putting people, not just infrastructure, at the center of analysis. Accessibility is thus contextualized through a worker-focused lens, helping to identify priority areas for intervention.
For example, Woolwich, the borough’s main commercial and retail center, exhibits consistently high night worker density but according to the Green Street dataset lacks food retail access after midnight. Fast-food outlets, some open until 2 a.m., remain the only food options. While Woolwich has been designated as one of London’s three Night Time Enterprise Zones, with efforts to extend operating hours via initiatives such as “Woolwich Lates,” these interventions are event-based and do not constitute a structural solution to the accessibility gap.
It is important to stress that these (in)sufficient accessibility maps are not definitive judgments but serve as decision-support tools. Their interpretation and the choice of the travel-time threshold should be informed by local knowledge and context, which borough authorities are uniquely positioned to provide. For example, the area surrounding Queen Elizabeth Hospital appears underserved in the data, yet hospital staff reportedly have access to a canteen until 2 a.m., a facility not captured in this research.
Discussion and conclusion
Study limitations
Mobile phone data raises important limitations and ethical concerns, including issues of surveillance, consent, and the commercialization of location data, which can reveal sensitive behavioral patterns (Sieg et al., 2024). Nighttime urban areas are populated by various historically marginalized groups whose visibility in mobility data can inform policy but also pose potential risks for them (Reia, 2025). This duality underscores the need for proper aggregation, anonymization, and strict disclosure controls. Furthermore, the proprietary nature of commercial datasets limits transparency and long-term research usability, and demographic biases may underrepresent those without smartphones or with limited connectivity (Wesolowski et al., 2013).
A key limitation of our model is its inability to capture mobile gig workers, such as delivery drivers, who play central role in the nighttime economy but lack a fixed place of work and therefore are not captured by BT data (Acuto et al., 2025). This reflects a wider challenge of representing mobile and informal forms of labor and capturing their behavior and needs.
The study’s temporal scope also presents constraints. Our analysis is based on an average Friday in January 2024, meaning variability in night work, transport provision, or store opening hours across other days or seasons is not fully captured. However, sensitivity checks using data from a Wednesday and Sunday of the same month, as well as from other seasons, indicate that the results reliably reflect general patterns, even though some temporal differences naturally occur and future work should investigate them. The BT data’s aggregation into three-hour intervals also limits our ability to detect finer dynamics, such as the exact times when workers finish their shifts.
Finally, the study does not account for the growing number of people who regularly order ready-to-consume food and groceries. Given this study’s focus on people regularly working at night, the continued dominance of in-store grocery shopping and the fact that ordering food is not affordable and digitally accessible to all, we have deliberately limited the scope to food retail outlets. While this enables a more consistent and policy-relevant assessment of access, it inevitably excludes other elements of the nighttime food environment, such as restaurants, delivery platforms and informal food infrastructures (e.g., shelters).
Further research and final thoughts
We offer two suggestions for future research. First, accessibility studies should make greater use of novel datasets that allow temporal populations to be disaggregated into meaningful groups. By focusing explicitly on night workers rather than the general ambient population, our model aligns demand with the group most relevant to policy interventions. This demonstrates broader potential: similar approaches could be developed for residents, commuters, visitors, or tourists. Defining demand groups precisely is essential, as using aggregated populations risks masking inequalities within specific subgroups.
Second, building on and extending earlier time-sensitive accessibility studies (e.g., Tenkanen et al., 2016), our findings highlight the fundamental importance of temporality. Beyond the expected day–night contrast, we show that nighttime hours vary far more sharply from one another than daytime hours. As shown in Figure 2, daytime accessibility remains relatively stable across hours, whereas nighttime accessibility fluctuates dramatically—conditions at 9 p.m. and 4 a.m. bear little resemblance to one another. This means that while a single representative value may approximate daytime accessibility reasonably well, nighttime accessibility cannot be meaningfully captured without fully accounting for temporal variation. This has implications for both research on nighttime cities and for policymakers, cautioning against reliance on single metrics, such as headline counts of night workers, that obscure temporal realities.
A further methodological and policy contribution is the (in)sufficient accessibility measure, developed as a practical complement to the dynamic accessibility framework, which otherwise reports only city-wide values. By integrating accessibility levels with the temporal distribution of workers, the framework identifies where and when underserved areas coincide with concentrations of night workers. Although we illustrate this using a 10-minute threshold and food retail outlets, it is fully adaptable to local priorities and planning standards.
Beyond the tool itself, the results raise broader policy considerations. While almost a decade has passed since the GLA introduced its 24-hour vision and appointed a Night Czar, the challenges of night work, let alone solutions, are still relatively rarely mentioned in official guidelines and strategies, especially when contrasted with efforts to protect the “nightlife” (e.g., Nightlife Taskforce). Our research highlights the need for greater engagement with the issue and offers initial steps toward examining unequal access to essential services after dark. For instance, the IA framework, used alongside complementary datasets and qualitative evidence, can help local authorities identify areas and groups of night workers most vulnerable to poor diet and develop measures to improve access to healthy, affordable food. Potential interventions include targeted incentives for food providers to extend opening hours, rest hubs for workers, improved workplace facilities, and clearer guidance on nutrition and night work (Fitzhugh and Gibson, 2024; Kolioulis et al., 2021). This study forms part of a wider collaboration with the Greater London Authority, and further policy recommendations could be seen in our report (see dataafterdark.org).
In conclusion, this study presents the first explicit application of a dynamic location-based accessibility model to the nighttime work context, producing the first granular geography of retail food (in)accessibility for night workers in London. Beyond its empirical insights into the challenges of working at night, we hope the methodological tools it introduces and the implications it offers for policy and future geospatial research will be of wider value to cities beyond London which host large populations of night workers.
Footnotes
Acknowledgements
We thank the Greater London authority for providing access to BT footfall data via the High Streets Data Service.
Ethical considerations
Ethical approval for the use of anonymized and aggregated mobile phone location data was granted through University College London (UCL) Research Ethics Committee.
Author contributions
Michał Iliev: Writing – original draft, Writing – Review & Editing, Methodology, Conceptualization, Formal analysis, Visualization. James Cheshire: Writing – review & editing, Conceptualization, Supervision, Funding acquisition, Project Administration. Stephen Law: Writing – review & editing, Methodology, Conceptualization, Supervision.
Funding
The authors disclosed receipt of the following financial support for the research, authorship, and/or publication of this article: This research is co-funded by: the Economic and Social Research Council (ESRC) via UBEL DTP and GHD; The Geographic Data Service, a Smart Data Research UK Investment, under project ID GeoDS 1752, ES/Z504464/1. The data for this research have been provided by The Geographic Data Service, a Smart Data Research UK Investment, under project ID GeoDS 1752, ES/Z504464/1 and Greater London Authority High Streets Data Service.
Declaration of conflicting interests
The authors declared no potential conflicts of interest with respect to the research, authorship, and/or publication of this article.
Data availability statement
The derived accessibility dataset, shown in ![]() , is available for research purposes via the Smart Data Research UK-funded Geographic Data Service (geods.ac.uk). The analyzed BT mobile phone location data were provided by the Greater London Authority High Streets Data Service and are not publicly available due to their sensitive and commercial nature.
, is available for research purposes via the Smart Data Research UK-funded Geographic Data Service (geods.ac.uk). The analyzed BT mobile phone location data were provided by the Greater London Authority High Streets Data Service and are not publicly available due to their sensitive and commercial nature.