
Abstract
Gun violence is one of the leading causes of premature death in the United States. While research examining the impact of gun violence has focused on direct victimisation, exposure within residential communities experiencing gun violence is consequential. However, exposure is not a spatially bounded process, as residents spend significant time outside of their neighbourhoods and travel to neighbourhoods both near and far. As such, a more complete portrait of gun violence exposure must consider this higher-order, neighbourhood network. Using 2018–2019 mobile phone data from SafeGraph, I construct neighbourhood networks based on daily mobility flows for the 100 largest US metropolitan areas. I compare neighbourhood gun violence exposure in the residential neighbourhood, the neighbourhoods bordering the residential neighbourhood, and the non-residential and non-adjacent neighbourhoods visited by residents. I find that gun violence exposure is greater in visited neighbourhoods compared to home and adjacent neighbourhoods, most metro areas exhibit either greater or equal exposure in visited neighbourhoods relative to home neighbourhoods, Black neighbourhoods exhibit greater gun violence exposure across all scales, and segregation increases gun violence exposure in neighbourhood networks for Black, Hispanic and mixed racial/ethnic neighbourhoods.
This paper is for the Special Issue:
Guest edited by
Introduction
In 2023, more than 46,000 people in the United States died as a result of a gun injury, with nearly 20,000 of these deaths due to gun violence (CDCWONDER, 2024). A rate of this magnitude has not been seen since the mid 1990s, near the late-20th century peak in firearm violence (Papachristos et al., 2018). Gun violence declined after this peak, but then rose in the mid-to-late 2010s, surpassing motor vehicle crashes as the leading cause of death for children in 2017 (Lanfear et al., 2023). Although rates of firearm violence and homicide victimisation are increasing across multiple ecological scales, they have grown the largest in urban settings (Hemenway and Nelson, 2020). There is growing recognition that gun violence extends beyond the victim of harm to individuals living or spending time in places impacted by elevated rates of violence, regardless of whether the violence is witnessed or experienced directly (Kravitz-Wirtz et al., 2022). Negative consequences include worse mental health, higher risks for chronic physical conditions and functional disability, reduced attention and impulse control, and poorer performance in school and work (Semenza et al., 2024; Sharkey et al., 2014; Smith et al., 2020). Violent events also impact neighbourhood-level outcomes, including reduced social cohesion, trust, and social ties, and increased levels of disorder and crime (Gard et al., 2022; Sharkey, 2018).
The geographic burden of neighbourhood gun violence is not distributed evenly; rather, gun violence is concentrated in neighbourhoods characterised by concentrated socio-economic disadvantage, particularly in areas with higher proportions of non-white residents (Cheon et al., 2020; Johnson et al., 2021). This observation follows a long line of urban research demonstrating that certain neighbourhood conditions shape the spatial distribution of violence across cities (Sampson, 2012). The neighbourhood effects framework was broadened by the perspective that ecological features shaping violence are spatially clustered (Morenoff et al., 2001). Geographic clustering indicates that the burden experienced in high violence neighbourhoods extends to their extra-local environments, which follows evidence showing that greater city and metropolitan area segregation levels heighten exposure to violence in historically marginalised communities (Krivo et al., 2009; Light and Thomas, 2019). The perspective also advances spatial diffusion – violence in a neighbourhood influences violence in nearby neighbourhoods – as an explanatory mechanism for high rates of community violence (Anselin et al., 2000).
The neighbourhood effects and spatial diffusion perspectives have dominated the research on neighbourhood gun violence and crime in general. However, they restrict processes of neighbourhood inequality and exposure to operate only within and between geographically contiguous neighbours. This assumption is limiting as exposure also occurs in the network of neighbourhoods that residents travel to for daily routines. Prior work has shown that residents spend large proportions of time outside of their neighbourhoods, this time is often spent in distal areas of the city, and residents of poor and minority neighbourhoods travel about as widely across their cities as those of other groups (Jones and Pebley, 2014; Wang et al., 2018). Much of this evidence comes from the rich literature on activity spaces, which shows that people spend a great deal of their day in activities occurring in places outside their home areas, forming an ‘eco-network’ of places which can affect their outcomes, including exposure to gun violence (Cagney et al., 2020). Aggregating these individual trips up to the population level reveals a higher-order, urban network formed by large and consistent flows connecting neighbourhoods both near and far. A city can then be further defined by the extent to which its neighbourhoods are structurally tied together (Sampson and Candipan, 2023). Understanding the geographic burden of exposure to gun violence must consider this higher-order, neighbourhood network, because if residents spend significant time outside of their neighbourhoods and travel to neighbourhoods beyond those that are geographically adjacent, we are potentially misestimating exposure, and its inequality across racial/ethnic lines.
Using 2018–2019 anonymised mobile phone data from SafeGraph, I construct neighbourhood networks based on daily mobility flows for the 100 largest US metropolitan areas. I examine differences in neighbourhood exposure to gun violence and its association with ecological conditions across three neighbourhood scales: (1) the residential neighbourhood; (2) the neighbourhoods bordering the residential neighbourhood; and (3) the non-residential and non-adjacent neighbourhoods visited by residents. I then examine ethnoracial inequalities in exposure by comparing differences by neighbourhood ethnoracial composition. Finally, I examine the degree to which metropolitan statistical area (MSA) segregation levels modify neighbourhood ethnoracial inequalities in gun violence exposure.
From neighbourhood effects and diffusion to neighbourhood networks
A long line of research in urban studies details neighbourhood effects on crime and safety. Early work established the importance of several neighbourhood structural factors in shaping spatial crime patterns, including residential instability, racial/ethnic heterogeneity, and concentrated socio-economic disadvantage (Peterson and Krivo, 2010; Sampson, 2012). Studies built on these insights by connecting disadvantage to crime through its influence on social processes, emphasising that disadvantaged neighbourhoods had lower levels of formal and informal social control and therefore higher levels of property and violent crime (Kirk and Papachristos, 2011; Sampson, 2012). While neighbourhood effects research established the importance of residential environments in shaping local crime patterns, the spatial diffusion literature demonstrated that a neighbourhoods-as-islands perspective is incomplete as the larger spatial environment surrounding the neighbourhood may also affect outcomes (Anselin et al., 2000; Morenoff et al., 2001). Empirical studies of crime were at the vanguard of this perspective, as the structural factors associated with crime were demonstrated to be spatially concentrated. Peterson and Krivo (2010) find that independent of a neighbourhood’s socio-economic disadvantage level, its adjacent neighbourhoods’ disadvantage levels are a predictor of its violent crime. Furthermore, mechanisms explaining the diffusion of crime across neighbourhood boundaries were theoretically straightforward, with some evidence suggesting that such patterns might be spatially contagious (Zeoli et al., 2015).
While the neighbourhood effects and spatial diffusion frameworks established foundational understandings of whether and how neighbourhood conditions influence crime and safety, scholars have long noted their limitation in conceptualising exposure as a spatially bounded process (Bastomski et al., 2017). A third framework – activity space theory – emerged in response (Cagney et al., 2020). The activity space framework recognises that obligations, tasks and social engagements may draw people out of, and potentially far from, their residential context (Jones and Pebley, 2014). In the case of understanding crime patterns, this framework is closely associated with routine activities theory, which posits that a motivated offender and a suitable target must converge in space and time in the absence of a capable guardian, with a shift in routine activities away from home-based activities as a source for increased crime (Cohen and Felson, 1979). Routine interactions can help promote access to different resources and social networks beyond the residential neighbourhood, which may include social and physical environments that promote or deter crime and delinquency (Browning and Soller, 2014; Browning et al., 2017). Activity-space studies have found positive associations between disadvantage in individuals’ home neighbourhoods and their nonhome activity locations, with this association holding for residents of neighbourhoods at all disadvantage levels and for all race-ethnic groups (Jones and Pebley, 2014; Krivo et al., 2013), and that connected networks of activity spaces between households are associated with lower levels of crime (Browning et al., 2017).
Mobility does not simply connect people to different places within a city – it also connects places to one another. While the activity space framework focuses on individual-level exposure based on movement across a city, the neighbourhood network perspective emphasises population-level flows connecting socially relevant ecological units (Candipan et al., 2021; Sampson, 2012). According to this perspective, the individual behaviours of city residents aggregated up to the population level form an interlocking system of neighbourhoods that uniquely define the city (Levy et al., 2020). Here, a neighbourhood’s exposure is based on the average conditions of its network-linked neighbourhoods. A higher-order ecological scale emerges that is not spatially constrained, as neighbourhoods can be highly connected while geographically far apart (Sampson and Candipan, 2023). The neighbourhood networks framework layers a network logic over a spatial logic by acknowledging that spatially distant communities can be socially connected depending on the patterning of ties between them. The novel theoretical insight advanced by this perspective is that it is not just the residential neighbourhood, its surrounding, extra-local environment, or the set of neighbourhoods that an individual resident travels to that matters, but also the neighbourhood’s position within the mobility-network itself. Prior work has demonstrated the unique contribution of neighbourhood networks above and beyond the characteristics of residential settings in shaping spatial inequality across several neighbourhood outcomes, including environmental hazards (Brazil, 2022), crime and violence (Kelling et al., 2021; Levy et al., 2020), and racial and income segregation (Wang et al., 2018).
Gun violence exposure in neighbourhood networks
The purpose of this study is to estimate average gun violence exposure in the network of neighbourhoods linked via daily mobility flows. Gun violence exposure has direct and indirect pathways (Semenza and Kravitz-Wirtz, 2024). Direct gun violence exposure is defined as being threatened, injured, or killed with a firearm. Indirect gun violence exposure comes in two forms: secondary exposure refers to knowing someone who has been shot, and community-level exposure is defined as witnessing a shooting or hearing gunshots in public places, or being aware of gun violence in one’s community (Semenza and Kravitz-Wirtz, 2024). While the impact of indirect exposure to gun violence carries detrimental outcomes on individuals, it also exacts broad damages to a neighbourhood’s collective well-being, which can occur through several pathways. Gun violence exacerbates community rates of poor mental health, poor health behaviours, low rates of health care utilisation, high rates of juvenile delinquency, and risks for chronic physical conditions (Bancalari et al., 2022; Bruns et al., 2024; Semenza et al., 2023; Turner et al., 2019). In turn, poor community health and health behaviours may degrade a wide range of neighbourhood social outcomes, including levels of civic engagement, social cohesion and collective efficacy, because residents engage in behaviours detrimental to these outcomes (Rong et al., 2023; Ziminski et al., 2024). Gun violence exposure impacts social outcomes by also reducing perceptions and feelings of safety, as residents may become wary of neighbours and congregating in public spaces (Paruk and Semenza, 2024). Relatedly, neighbourhood gun violence is often used to justify increased and more aggressive policing tactics, which increases risk for police-involved violence (Sewell and Jefferson, 2016). Exposure to invasive and harmful policing is both detrimental to community well-being and increases opportunities for violence more broadly (Semenza and Kravitz-Wirtz, 2024). Prior research also highlights how gun violence reduces local investment, partly because it shapes neighbourhood reputation in ways that repel investment in the area, such as attracting businesses to set up in the neighbourhood (Ziminski et al., 2024). Poor community health, disinvestment and reduced social capital generate further concentrated disadvantage, perpetuating cycles of violence and socio-economic disadvantage that endure in highly distressed communities.
Given the place-based consequences of indirect gun violence exposure, urban mobility networks will exacerbate the geographic burden of disadvantage in cities if they connect violent neighbourhoods to one another. Similarity between mobility-based origin and destination neighbourhoods in the environmental conditions that predict crime may help explain their similarity in gun violence exposure. Studies using cell phone pings, job commuting flows, and georeferenced social media posts to capture resident travel have found that neighbourhoods are connected to other neighbourhoods with similar levels of socio-economic disadvantage, regardless of distance (Brazil et al., 2024; Wang et al., 2018). The implication is that because socio-economic disadvantage predicts crime levels, neighbourhoods embedded in networks of disadvantage are also embedded in networks of crime. Guns are more prevalent in socio-economically disadvantaged neighbourhoods, and gun-shot victimisation has a strong social patterning and is often embedded in tight networks (Baumer et al., 2003; Papachristos et al., 2015). Consistent mobility flows between neighbourhoods with high gun violence rates may contribute to the stability and transmission of delinquent values and opportunities, and may ease the creation of illegal gun markets (Graif et al., 2017; Papachristos et al., 2024). Furthermore, theories of social public control (Bursik and Grasmick, 1999; Hunter, 1995; Velez, 2001) suggest that community level ties to external resources and influential political actors and organisations may lead to investments or disinvestments in the community. A relative dearth of public social control in neighbourhoods embedded in disadvantaged mobility networks might be especially problematic for their ability to regulate illegal gun availability and violence. These explanations rely on social contagion as the explanatory mechanism, which refers to a process by which crime spreads across neighbourhoods based on increased levels of conditions that might lead to extra-local crime (Morenoff et al., 2001).
Although not directly examining gun violence rates, prior work has found support for the diffusion of violence and deviance across neighbourhood network ties. Studies of Chicago have found positive associations between connected neighbourhoods in their sexual and domestic violence rates based on work commuting ties, violent crime rates based on daily mobility flows, and homicide rates based on co-offending ties (Kelling et al., 2021; Sampson and Levy, 2022). Papachristos and Bastomski (2018) found that neighbourhood networks based on co-arrest ties in Chicago explain more variation in violent crime rates compared with spatial proximity alone. In another study of co-offending networks in New York City, Papachristos et al. (2024) found that neighbourhoods with greater ties have higher gun violence rates, and neighbourhoods that share ties have similar rates of violence. Whether origin–destination similarities in violence also extend to daily mobility ties for cities beyond Chicago and New York has largely not been tested.
In contrast to similar exposure levels, gun violence rates between residential and network settings may differ. Kwan (2018) introduces the neighbourhood effect averaging problem to explain differences in average exposure levels between residential and network neighbourhoods: taking people’s daily mobility into account will lead to an overall tendency toward the mean exposure because exposure levels for people whose residence-based exposures are lower or higher than the mean exposure will tend toward the mean exposure. Browning et al. (2022) advanced a similar perspective, compelled mobility, which acknowledges spatial inequality in the availability of resources and the impact of these deficits on the exposure patterns of disadvantaged neighbourhood residents. Absent employment, grocery stores, parks, and other amenities within disadvantaged neighbourhoods, residents will be constrained to seek these resources elsewhere. Given the concentration of resources in more advantaged neighbourhoods, residents of disadvantaged neighbourhoods are likely to experience nontrivial levels of exposure to areas that vary substantially from their home neighbourhood environments. Examining Black youth activity space mobility in Columbus, OH, they find evidence supporting compelled mobility, for Black youth residing in Black-segregated neighbourhoods, accessing resources is associated with nontrivial levels of exposure to racially dissimilar neighbourhoods where such resources are disproportionately located (Browning et al., 2022).
Ethnoracial inequalities and segregation
Inherent to neighbourhood inequalities, neighbourhood effects, and geographic clustering, disparities in network exposure to gun violence may exist by race and ethnicity. Black and Hispanic neighbourhoods experience higher rates of gun violence than do white neighbourhoods (Cheon et al., 2020; Kravitz-Wirtz et al., 2022). Prior work has also demonstrated that Black and Hispanic neighbourhoods, even if they are advantaged, are more likely to be connected to more disadvantaged neighbourhoods than their white neighbourhood counterparts (Brazil, 2022; Brazil et al., 2024; Krivo et al., 2013; Levy et al., 2020). In an examination of violent crime exposure in Chicago, Vachuska (2024) finds that individuals residing in Black neighbourhoods continue to experience significantly higher levels of violence in the neighbourhoods they visit compared to those living in white neighbourhoods. These results suggest that Black and Hispanic neighbourhoods not only experience higher rates of gun violence than do white neighbourhoods, but also in the neighbourhoods they are linked to via resident daily mobility flows.
A potential mechanism explaining why racialised minority neighbourhoods experience higher rates of violence in their neighbourhood networks is residential segregation. Racial segregation is a linchpin in maintaining systemic racial inequality (Clark, 1986), with evidence implicating it as a key driver of negative outcomes, specifically for Black communities, including the substantial Black-white homicide gap (Light and Thomas, 2019). Neighbourhoods embedded in high-segregation cities where institutional racism is more salient and the geographic distribution of resources is more unequal may exacerbate differences in gun violence exposure between Black neighbourhoods and their non-Black counterparts (Krivo et al., 2021). That is, by concentrating criminogenic structural factors in Black neighbourhoods, including lower access to jobs, lower quality schools, reduced public investment, and decreased social control and collective efficacy, segregation plays a key role in explaining the comparatively high rates of violence within these communities (Kirk and Papachristos, 2011; Massey and Denton, 1993; Peterson and Krivo, 2010). Segregation also undermines the ability of neighbourhoods to organise effectively around safety issues by reducing the incentives to form partnerships to solve problems and limiting common interests across racial groups (Krivo et al., 2009).
Segregation may also shape ethnoracial gun violence exposure patterns by impacting where people travel to within a city. That is, segregation extends beyond residential neighbourhoods and their geographically adjacent communities to shape the types of neighbourhoods that residents travel to for daily routines. Candipan et al. (2021) examine the association between residential segregation and mobility-based segregation for the 50 largest cities in the US, finding that cities with more segregation by residence are also those in which the movements of people between white, Black, Hispanic and mixed neighbourhoods are most proportionally unequal. Because segregation concentrates disadvantage in racialised minority neighbourhoods, and mobility in highly segregated settings largely connects these same neighbourhoods to one another through such mechanisms as limited transportation options to more advantaged, typically white neighbourhoods and decreased political, economic and social collaborations and partnerships across neighbourhoods of differing ethnoracial composition (Anderson and Galaskiewicz, 2021), we would expect greater gun violence exposure for Black and Hispanic neighbourhood networks in more segregated cities. Sampson and Levy (2020) find that equitable and concentrated mobility and residential segregation are independently positively associated with city-level homicide rates. They find no evidence that patterns of everyday mobility mediate the influence of residential racial segregation. However, their measures of mobility-based connectedness are general and not race-specific, and they do not examine neighbourhood-level crime rates. This study examines the degree to which racial segregation moderates ethnoracial inequalities in neighbourhood gun violence exposure.
More broadly, this study sets out to answer the following research questions. First, do gun violence rates differ between residential neighbourhoods, their bordering neighbourhoods, and the neighbourhoods they are connected to via resident daily travel? Second, are there racial disparities in mobility-based neighbourhood gun violence exposure, and how do these disparities compare to those at the residential neighbourhood and the neighbourhoods surrounding the residential neighbourhood? Third, does racial segregation moderate racial/ethnic disparities in gun violence exposure? To my knowledge, these questions have not been explicitly answered. A long line of work examines the implications of activity spaces on crime, which is individual based, but few studies model the implications of mobility flows that structure neighbourhood networks (Cagney et al., 2020). Prior work adopting the neighbourhood networks perspective to study crime do so typically for a single city (Graif et al., 2017, 2021; Sampson and Levy, 2022; Vachuska, 2024). Studies drawing on larger sample sizes utilize large geographic units such as counties or cities (Sampson and Levy, 2020; Vachuska, 2022). Furthermore, to my knowledge, no neighbourhood networks study has examined gun violence, focusing instead on general crime, violent crime or homicides. In this study, I use neighbourhoods located in the 100 largest metropolitan areas as the unit of analysis, cell phone data to capture daily mobility flows, and examine the implications of mobility patterns for gun violence exposure.
Data
Data were collected at the census tract level in the 100 largest metropolitan statistical areas (MSA) in the United States based on 2018 US Office of Management and Budget MSA definitions and total population estimates. The 100 largest MSAs were chosen due to their greater availability of cell phone data. Census tract was used because it is the most common scale for measuring neighbourhoods in social science research and provides lower uncertainty of mobility and socio-economic characteristics relative to lower scales such as the block group (Sampson, 2012).
Mobility flows
Mobility of residents between neighbourhoods is based on the location pings of smart phone devices. A flow between neighbourhoods i and j represents the number of trips originating from home neighbourhood i visiting destination neighbourhood j. Cell phone location data rely on numerous smart phone apps and were aggregated by SafeGraph (2024). SafeGraph provides visit patterns for more than 40 million devices from multiple cell phone companies to more than 6 million points of interests. Here, a trip is represented as a cell phone device being pinged when an application is in use in a location other than its home neighbourhood, where ‘home’ is the location where the mobile device is detected most at night (from 18:00 to 07:00) over a six-week period. The data do not uniquely identify individuals but rather provide an anonymised overview of their aggregated movement to protect individual privacy while still providing insights into broader patterns of human mobility. The dataset contains information on the daily number of pings in a destination block group and the residence block group locations of the pings. The data is not publicly available but is purchased through a paid subscription. The analysis includes pings aggregated up to the tract level from November 2018 to November 2019, before the major impact of COVID-19 on travel. SafeGraph did not collect weekly patterns data before 2018. Prior work has shown that SafeGraph-based mobility patterns are broadly consistent before and after the peak of the COVID-19 pandemic, and with patterns for multiple years of other forms of mobility data (e.g. geolocated tweets), demonstrating consistency in mobility patterns observed with a single year of SafeGraph data (Levy et al., 2020; Marlow et al., 2023).
I used SafeGraph data because it provides extensive spatial coverage, with almost all counties represented (Li et al., 2024). Furthermore, SafeGraph data are a widely used standard in large-scale studies of human mobility across many different areas including air pollution, crime and COVID-19 modelling (Brazil, 2022; Vachuska, 2024). The SafeGraph sample is not a perfect representative subset of the population (Li et al., 2024). Not everyone owns a cell phone, or carries one with them, some people use alternative forms of communication when travelling, such as burner phones, some people carry multiple devices, some devices are shared across multiple individuals, and some people carry a smart device only some of the time. Nevertheless, the empirical sampling rates in the sample panel are quantitatively close to the expected sampling rates from a large-N random sample (Noi et al., 2022; Squire, 2019).
Gun violence
The main dependent variable is the number of gun violence incidents occurring within a neighbourhood per 1000 residents between 2018 and 2019. These data were obtained from the Gun Violence Archive (GVA), a nonprofit organisation that draws from law enforcement, media, government, and commercial sources to provide a daily account of fatal and non-fatal firearm violence throughout the United States. GVA utilises automated queries, and manual research through over 7500 sources from local and state police, media, data aggregates, government and other sources daily. Each event is verified by both researchers and a secondary validation process. I used GVA data because it has higher validity compared to official databases, it has not been found to systematically over or underreport incidents, and it has been widely used in prior studies. Furthermore, it is the only national dataset that provides gun violence data at a spatially granular level for recent years, over a long period of time and for a large number of cities. In an evaluation of the validity of GVA data over a six-year period using police department data, Gobaud et al. (2023) find strong correspondence between police-reported and GVA-reported gun violence incidents, supporting the use of GVA for research that requires its unique advantages (i.e. spatial resolution, timeliness, and geographic coverage). Studies have used GVA data for a wide range of applications, such as examining the impact of New Jersey’s bail reform policy on gun violence rates (Jahn et al., 2024), the association between gun ownership rates and police-related gun violence (Jain and Hemenway, 2024), and the association between historical redlining policies and present-day non-suicide firearm fatalities (Dholakia et al., 2024).
I construct three variables capturing gun violence exposure across the following scales: (1) The number of gun violence incidents in neighbourhood i per 1000 residents (residential):

(2) The average number of gun violence incidents per 1000 residents in neighbourhood i’s spatially adjacent neighbours (adjacent):

where

where
Sociodemographic characteristics
Data on census tract level demographic and socio-economic characteristics were drawn from the American Community Survey, five-year 2015–2019 estimates. Ethnoracial data capture resident percentage composition based on the following categories: Non-Hispanic white, non-Hispanic Black, non-Hispanic Asian, Hispanic. Consistent with prior research, I conduct a principal components analysis of the following neighbourhood variables to measure neighbourhood disadvantage: percentages of poverty, unemployment, single-headed households, public assistance receipt, adults without a high school diploma, adults with a bachelor’s degree or higher, and workers who are managers or professionals (Levy et al., 2020). I include the following additional variables that prior work has shown to be predictive of neighbourhood violence (Peterson and Krivo, 2010): log population size, percentage of owner-occupied housing units, log median age, share of the population made up of young males (age 15–34), and residential stability (percentage of homes occupied by the same householder in the past year). Descriptive statistics of sociodemographic characteristics and all other variables used in the analyses for the total sample and stratified by racial/ethnic neighbourhood type are shown in Table 1.
Descriptive statistics (N = 46,702).
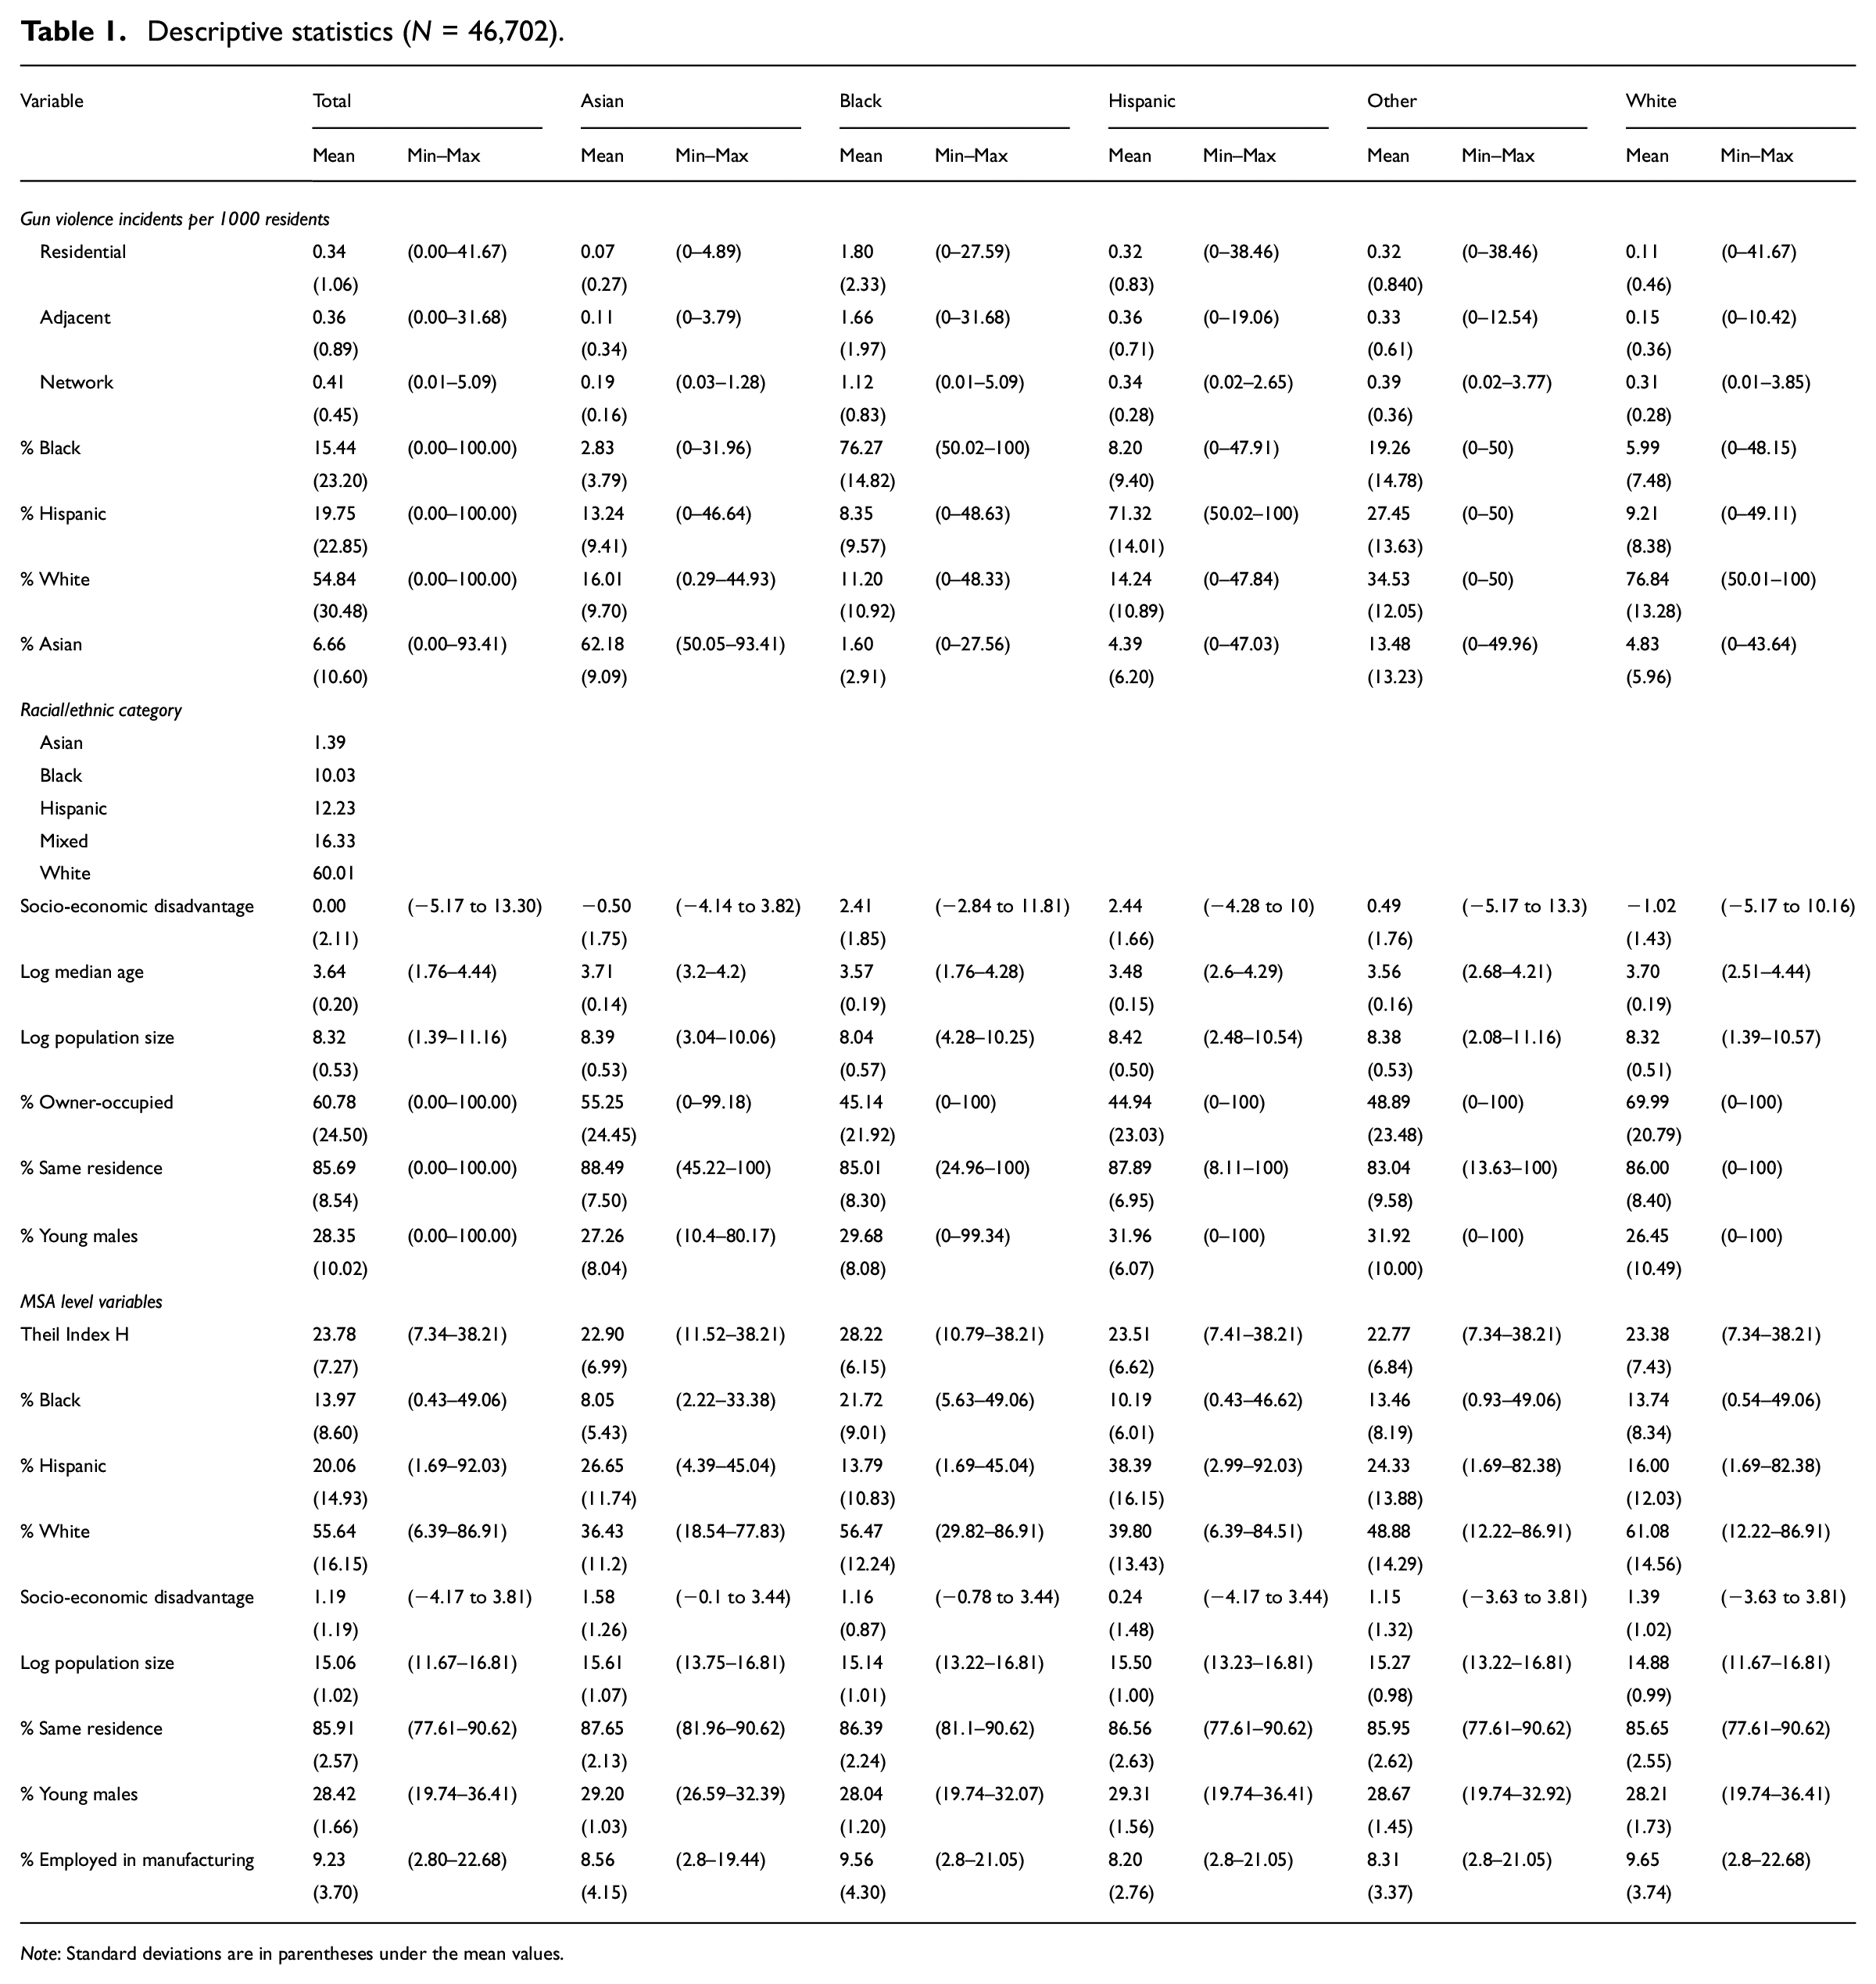
Note: Standard deviations are in parentheses under the mean values.
Methods
I estimate exposure to gun violence across residential, adjacent and network scales using linear regression models of the following form:
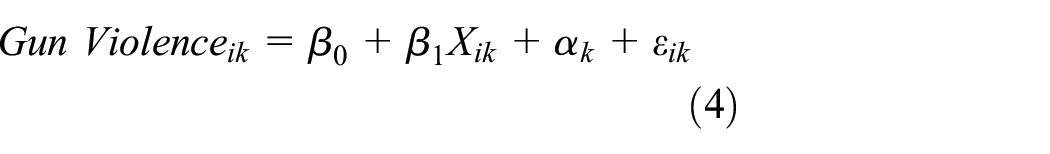
where
I next examine ethnoracial differences in exposure to gun violence across residential, adjacent and network scales. Rather than using a continuous measure of racial composition, I follow prior work by classifying tracts as Asian, Black, Hispanic or white using a threshold of 50% (Brazil, 2022; Wang et al., 2018). A categorical measure of ethnoracial composition allows for representation of the four major ethnoracial groups in a single model, as only percentage Black and percentage Hispanic were included in equation (4) because percentage white and percentage Asian introduced high multicollinearity. Neighbourhoods not included in the four major ethnoracial groups were categorized as mixed (no majority).
The final set of analyses examines the degree to which MSA-level segregation levels modify ethnoracial exposure to gun violence. I calculate segregation in terms of evenness using Theil’s entropy index H (Massey and Denton, 1993; Theil, 1972), a measure that can be estimated for multiple groups and which compares the level of racial diversity of each tract within the broader MSA. H is a structural measure of segregation that captures how evenly racial/ethnic groups are distributed among neighbourhoods within MSAs. When scaled from 0 to 100, a value of 0 would indicate no segregation while a value of 100 would describe a metropolitan area without any racial diversity in which each tract comprises only one ethnoracial group. I use H over other measures of segregation, such as the Dissimilarity Index, because of its attractive statistical properties (Massey and Denton, 1993) and its ability to measure multi-group segregation (here, the groups are white, Black, Asian, Hispanic and mixed). Because H is an MSA level variable, it is not possible to include MSA fixed effects as in equation (4). In order to account for MSA-level heterogeneity while including a cross-level interaction between an MSA- and neighbourhood-level variable, I run multilevel regression models, where the first level contains neighbourhood-level variables including the interaction between H and the categorical measure of ethnoracial composition, and the second level contains random intercepts at the MSA level and MSA-level controls that have been previously associated with crime at the neighbourhood level. MSA characteristics include socio-economic disadvantage, percentage young males, and residential instability as measured in the same manner as for tracts, log population size, percent age Black, percentage Hispanic, percent age white, and percentage of adult workers employed in manufacturing industries (Krivo and Peterson, 2009; Krivo et al., 2015).
Results
The three measures of gun violence exposure are correlated in neighbourhoods across the 100 largest metropolitan areas. The Pearson correlation between residential and adjacent gun violence exposure are 0.65. The correlations between residential and network, and adjacent and network, are 0.57 and 0.66, respectively. This pattern implies that neighbourhoods experiencing higher levels of gun violence exposure are likely to be embedded within concentrated geographic- and mobility-based gun violence. However, these correlations are not overwhelmingly strong, suggesting that although overlapping, residential, adjacent and network exposure are not deterministic.
I now compare exposure levels across all neighbourhoods in the 100 largest MSAs within a multivariate context. Figure 1 presents regression-adjusted estimates and their 95% confidence intervals of the average number of gun violence incidents occurring in a neighbourhood (residential), its bordering neighbourhoods (adjacent), and the nonresidential and nonadjacent neighbourhoods that residents visit (network) based on equation (4). I discuss differences based on non-overlapping confidence intervals. On average, neighbourhoods were exposed to 0.37 firearm violence incidents per 1000 residents between 2018 and 2019. The average number of incidents per 1000 residents is similar at 0.39 in bordering neighbourhoods, but is higher in the neighbourhoods that residents visit at 0.47.
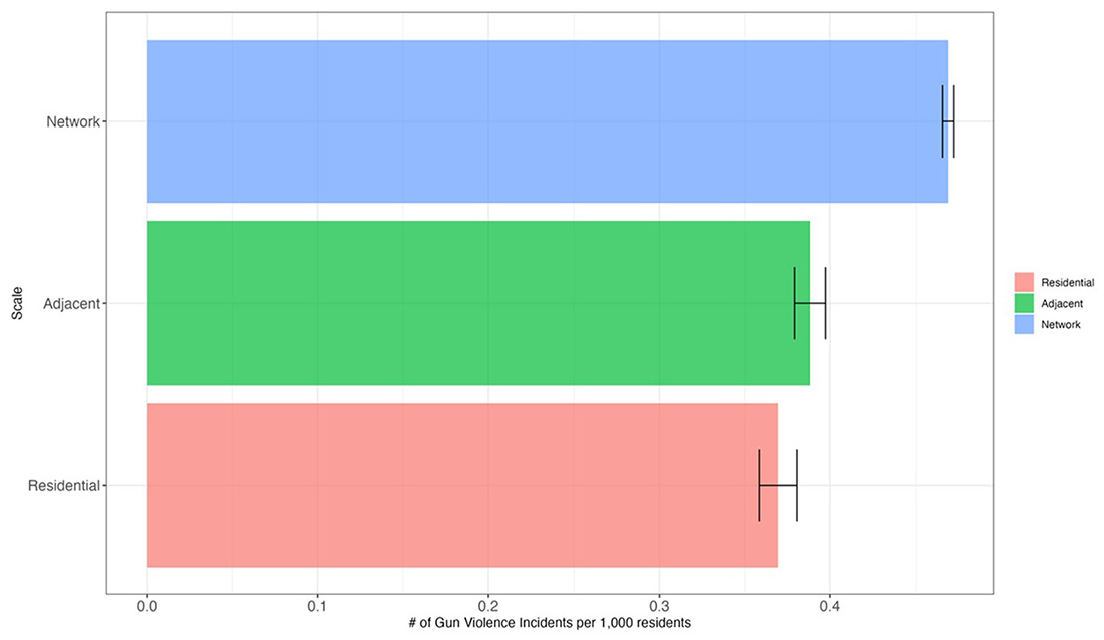
Estimated mean gun violence exposure with 95% confidence intervals in residential neighbourhoods (residential), adjacent neighbourhoods (adjacent), and the nonadjacent neighbourhoods that residents visit (network).
Results from regression models predicting residential, adjacent and network gun violence exposure are shown in Table 2. In addition to the models specified in equation (4), I run residential and adjacent models that include controls for network dependency in the outcome, and network models that account for residential and adjacent gun violence exposure. 1 Coefficients from models predicting gun violence exposure at the residential and adjacent scales follow classic criminological explanations of neighbourhood crime and deviance. Higher socio-economic disadvantage and a greater presence of Black residents are associated with higher rates of gun violence. In contrast, higher median age and larger percentages of Hispanic residents, homeowners and households living in the same residence are associated with lower gun violence rates. Contrary to expectations, a greater presence of young males is associated with lower gun violence rates. These patterns persist after controlling for network dependency. While a greater presence of Black residents, higher socio-economic disadvantage and a lower presence of homeowners are also associated with higher gun violence exposure in a neighbourhood’s network, the other variables show no or contrasting associations.
Results from models regressing gun violence incidents per 1000 residents in residential neighbourhoods (residential), adjacent neighbourhoods (adjacent), and the nonadjacent neighbourhoods that residents visit (network) on sociodemographic characteristics.
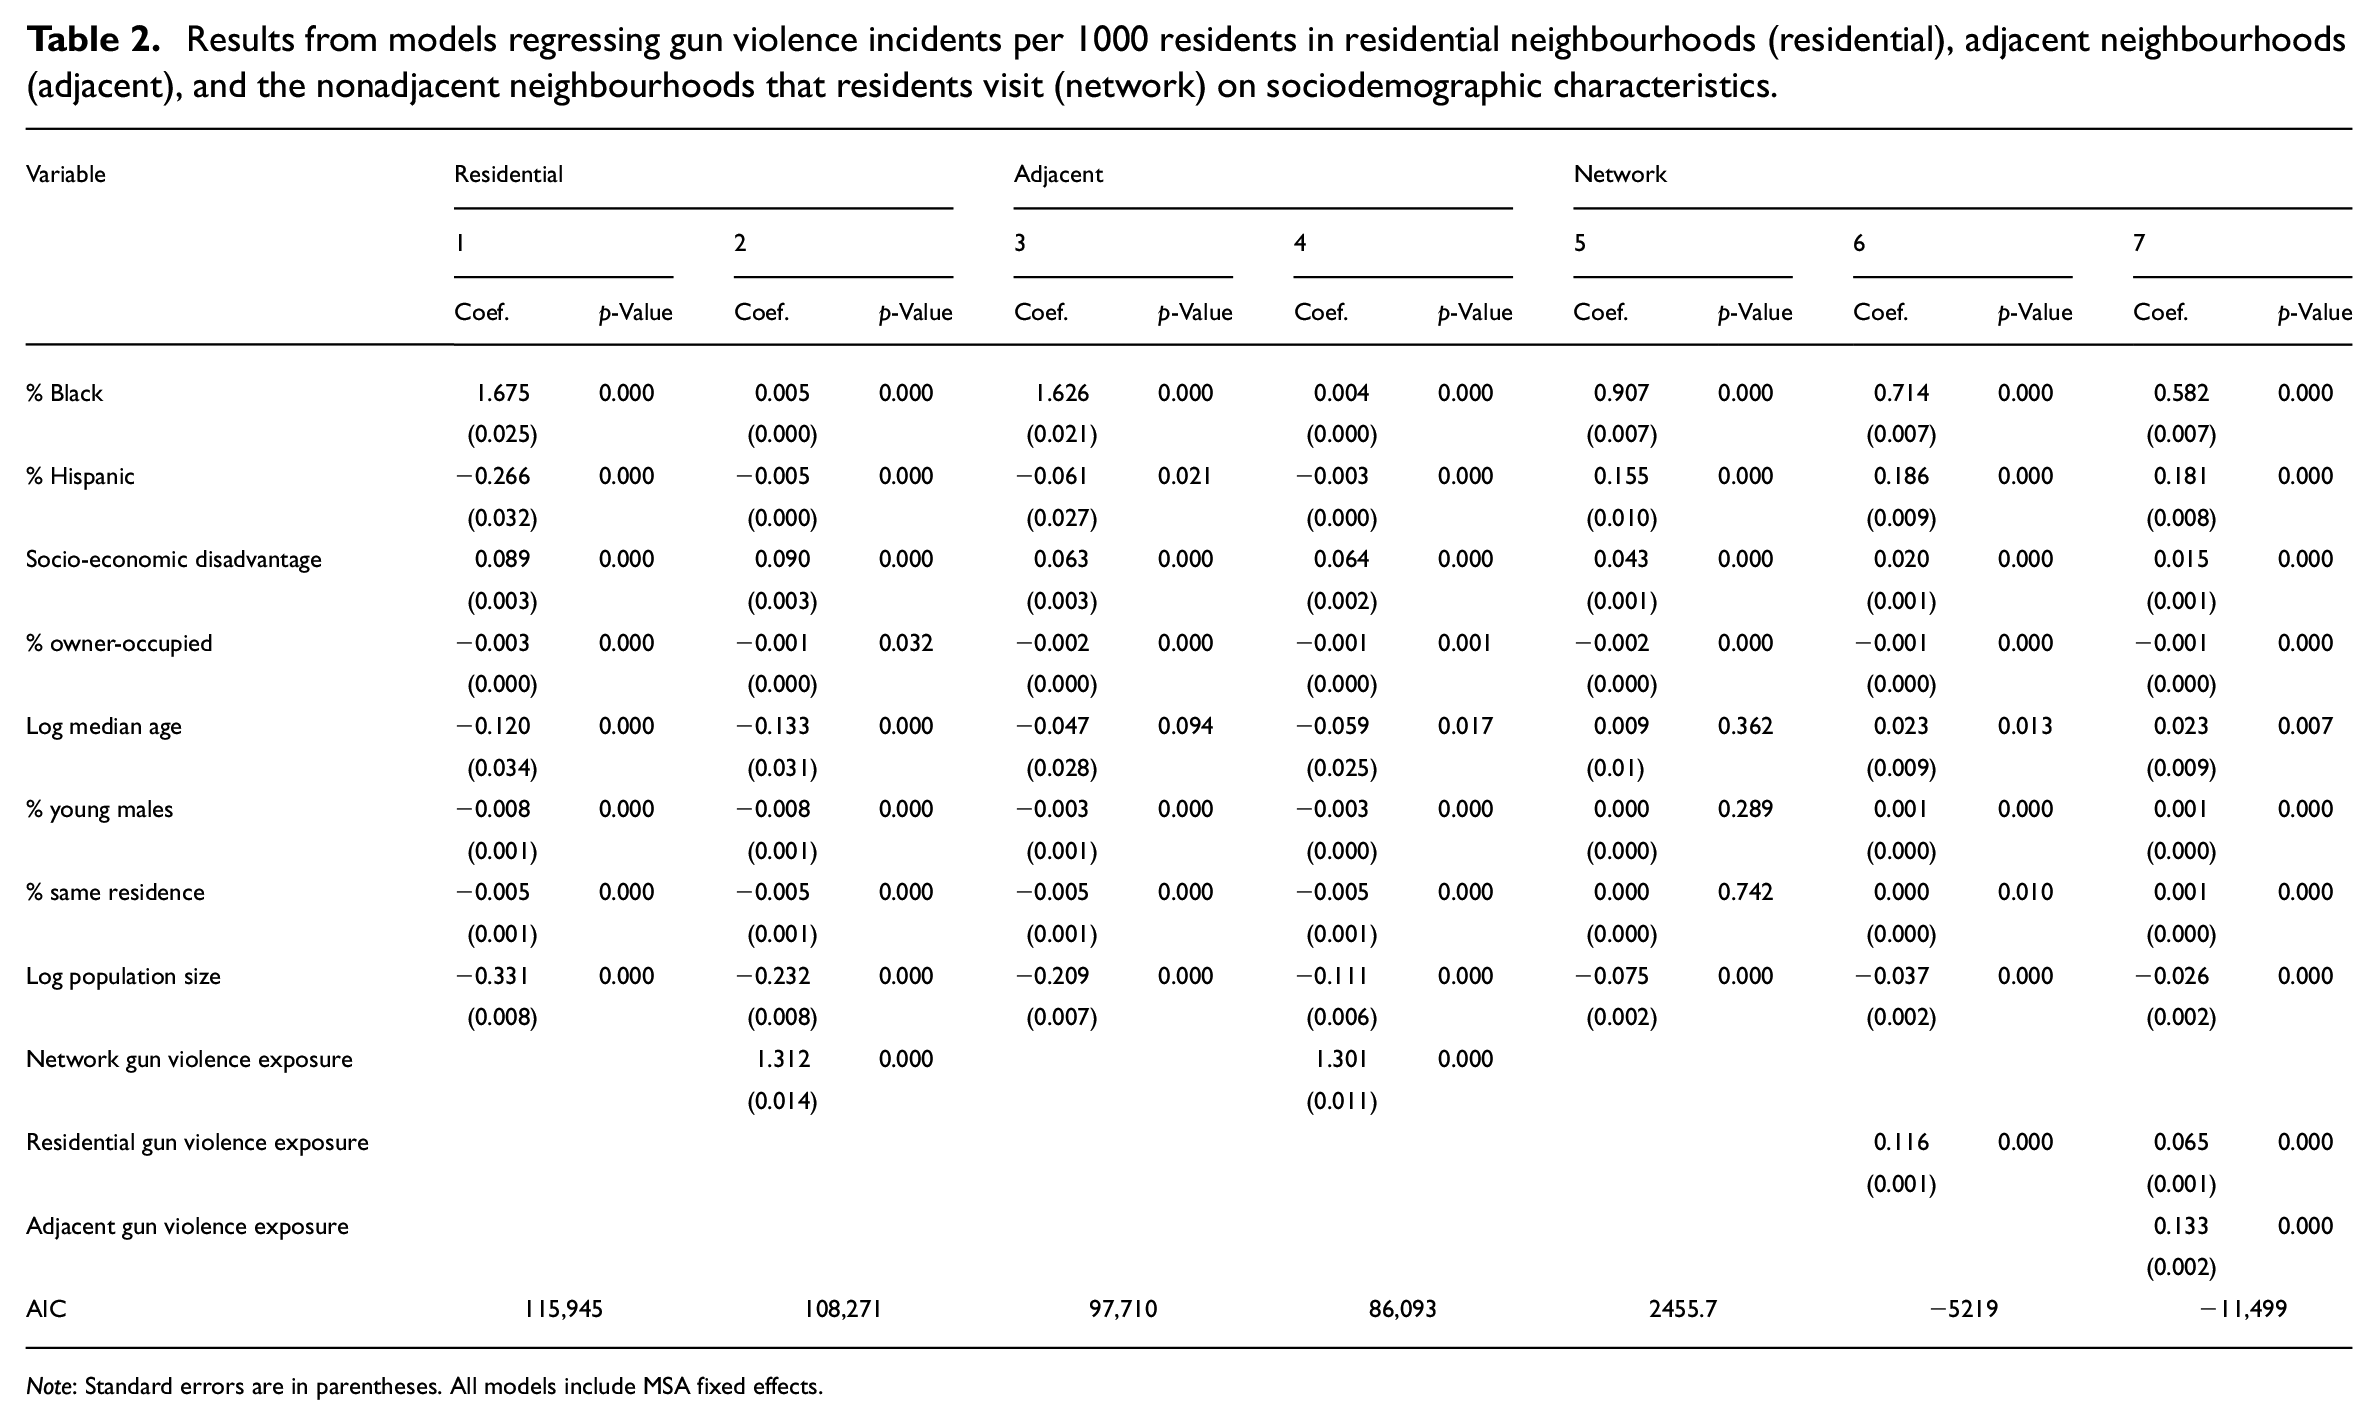
Note: Standard errors are in parentheses. All models include MSA fixed effects.
Figure 1 reveals that a neighbourhood’s exposure to gun violence is greatest in its mobility network adjusting for its socio-economic and demographic conditions. The final two columns of results in Table 2 reveal that neighbourhoods experiencing higher levels of gun violence in their residential and adjacent settings also experience higher levels of exposure in their neighbourhood networks. Model 6 regresses average exposure to gun violence in a neighbourhood’s mobility network on the variables specified in equation (4) and the number of gun violence incidents per 1000 residents in the residential neighbourhood. The results indicate that an increase of one gun violence incident per 1000 residents in the neighbourhood is associated with an average increase of 0.115 gun violence incidents per 1000 residents in the neighbourhoods their residents visit. Model 7 includes average gun violence exposure in adjacent neighbourhoods. I find that residential and adjacent gun violence exposure are positively associated with network gun violence exposure. That is, neighbourhoods experiencing higher exposure to gun violence within and surrounding their boundaries are also connected to neighbourhoods that have higher exposure to gun violence.
Figure 2 displays estimates and 95% confidence intervals of the difference in gun violence incidents per 1000 residents between network and residential scales by MSA. Positive values indicate greater exposure at the network scale. The red vertical line at zero represents no difference in gun violence exposure between residential and network settings. Models used to obtain estimates are similar to those specified in equation (4), but the outcome is the difference between gun violence incidents per 1000 residents between network and residential scales. The data reveal that neighbourhoods in 38 of the 100 largest MSAs experience greater gun violence exposure at the network level than the residential level. Memphis exhibits the greatest difference, with neighbourhoods exposed to 1.43 more gun violence incidents per 1000 residents in the neighbourhoods their residents travel to for daily routines. This is followed by mostly southern MSAs, including New Orleans (0.87), Jackson (0.86), Chattanooga (0.65), Little Rock (0.53), and Birmingham (0.42), but also includes Las Vegas (0.48) and Baltimore (0.45). Neighbourhoods in 46 MSAs exhibit no differences in gun violence exposure between visited tracts and home tracts, suggesting that, on average, the gun violence at one’s visited neighbourhood often mirrored that of the home neighbourhood. Only 16 of the 100 MSAs exhibited lower exposure at the network scale.
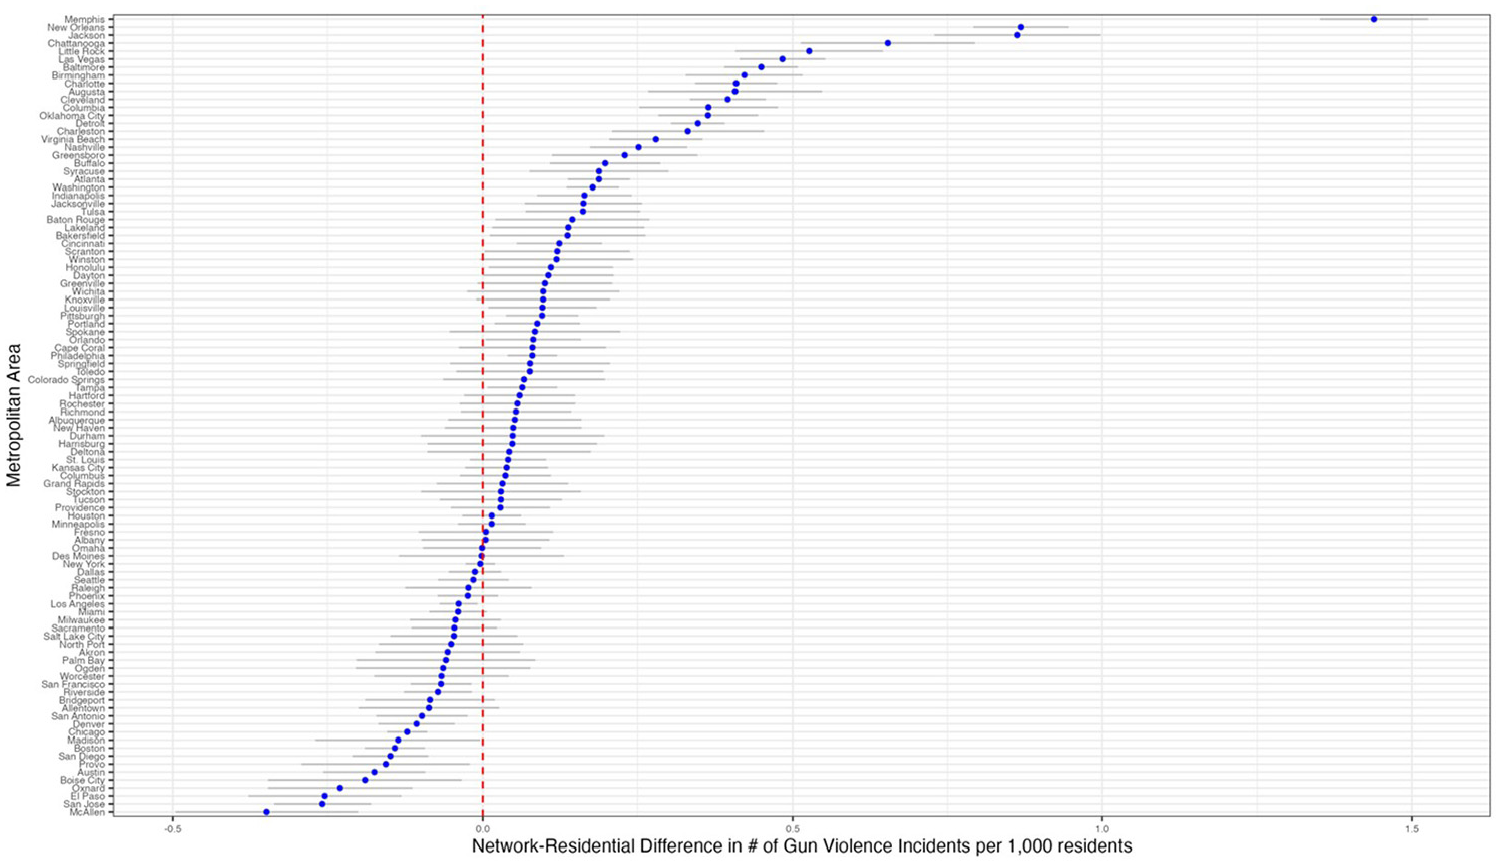
Estimated difference in mean gun violence exposure between network and residential scales with 95% confidence intervals by MSA.
Ethnoracial differences in gun violence exposure
The next set of results illustrates differences in ethnoracial inequalities in gun violence exposure across residential, adjacent and network levels. The full set of coefficient results is provided in Appendix Table A1. Figure 3 shows estimates of the average number of gun violence incidents per 1000 residents with 95% confidence intervals separated by neighbourhood scale and race/ethnic group. The figure demonstrates that findings for the total sample apply to all neighbourhood types except Black neighbourhoods: average gun violence exposure is highest in the neighbourhoods that residents travel to for Asian, Hispanic, white and mixed neighbourhoods. For Black neighbourhoods, gun violence exposure is lower at the network scale compared to the residential and adjacent scales. The average number of gun violence incidents per 1000 residents is 0.93 in Black neighbourhood networks compared to 1.37 in Black residential and adjacent neighbourhoods. The lower network rates may be partly explained by the substantially high levels of gun violence exposure already experienced by Black residential neighbourhoods and their adjacent environments.
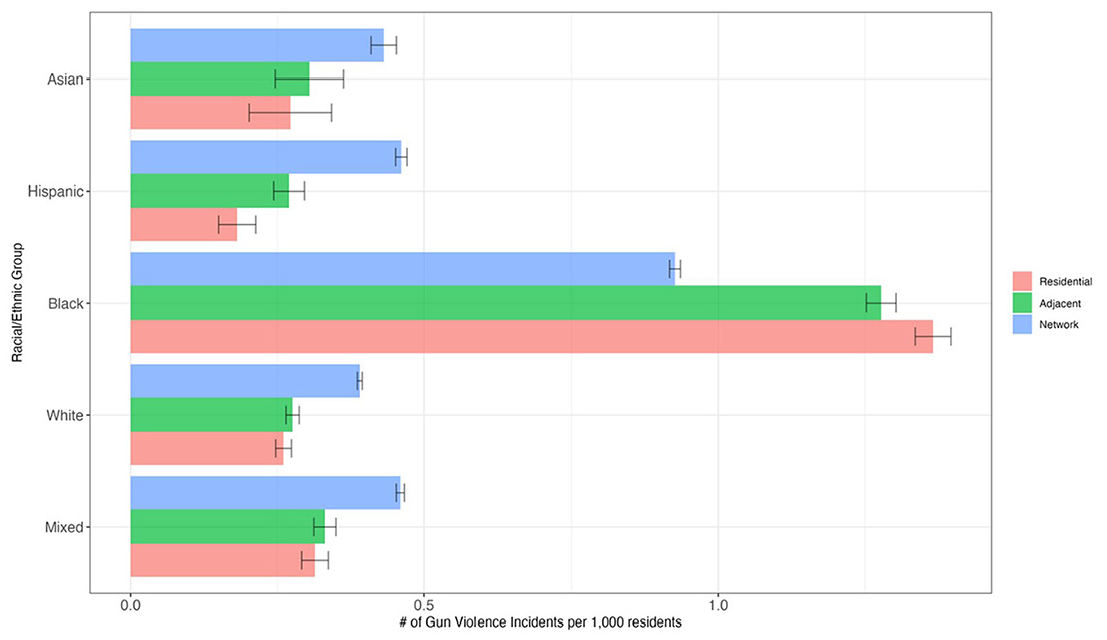
Estimated mean gun violence exposure with 95% confidence intervals in residential neighbourhoods (residential), adjacent neighbourhoods (adjacent), and the nonadjacent neighbourhoods that residents visit (network) by majority neighbourhood race/ethnicity.
Comparing across ethnoracial neighbourhood types, Black neighbourhoods are on average exposed to a greater number of gun violence incidents per 1000 residents across all scales controlling for structural factors associated with violence. Black residential neighbourhoods are exposed to gun violence rates (1.37) that are more than five times the rates in Asian (0.27), Hispanic (0.18) white (0.26) and mixed (0.31) residential neighbourhoods. Gun violence exposure at the adjacent scale does not change for white (0.27), Asian (0.30), Black (1.28) and mixed (0.33) neighbourhoods, but increases for Hispanic neighbourhoods (0.27). At the network level, although differences are lower, Black neighbourhoods (0.93) continue to experience much higher gun violence exposure rates compared to Asian (0.43), Hispanic (0.46), white (0.39) and mixed (0.46) neighbourhoods.
Gun violence, race and segregation
The final set of models examines how residential segregation modifies gun violence exposure across race/ethnicity and scale. Table 3 provides slope estimates from multilevel models of the segregation trend for each ethnoracial neighbourhood type. The full set of results is shown in Appendix Table A2. The results show that although the direction of the slopes indicates a positive relationship between segregation and residential gun violence exposure for Asian and white neighbourhoods, the estimates are not statistically significant at conventional levels. In contrast, segregation is positively associated with gun violence exposure for Black, Hispanic and mixed residential neighbourhoods. The estimated slope indicates that a one-unit increase in segregation is associated with 0.051, 0.009 and an 0.008 increases in gun violence incidents per 1000 residents in Black, Hispanic and mixed neighbourhoods, respectively. Note the much stronger relationship between segregation and gun violence exposure for Black neighbourhoods, with the association more than five times larger in Black neighbourhoods compared to Hispanic and mixed neighbourhoods. These results persist at the adjacent scale.
Estimated marginal associations between MSA Theil’s H and gun violence exposure in residential neighbourhoods (residential), adjacent neighbourhoods (adjacent), and the nonadjacent neighbourhoods that residents visit (network) by majority neighbourhood race/ethnicity.
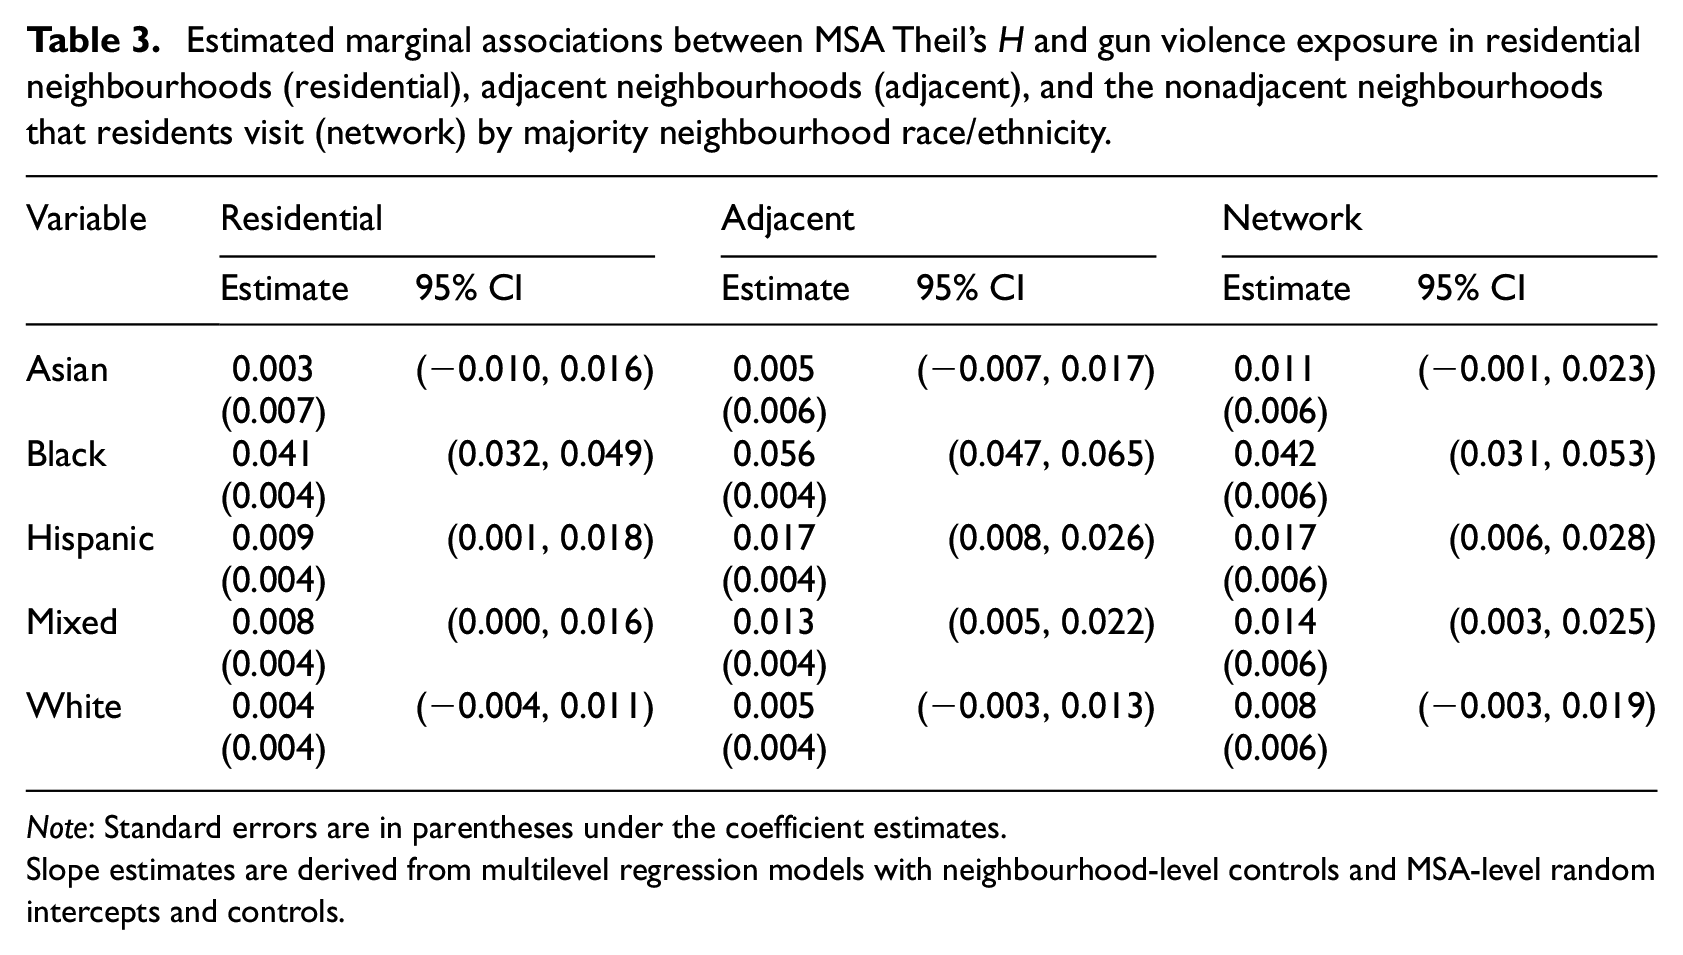
Note: Standard errors are in parentheses under the coefficient estimates.
Slope estimates are derived from multilevel regression models with neighbourhood-level controls and MSA-level random intercepts and controls.
At the network level, segregation continues to show no association with gun violence exposure for Asian and white neighbourhoods and a positive association for Black (0.42), Hispanic (0.017) and mixed (0.014) neighbourhoods, with the magnitude of the Black association considerably stronger. Put another way, an increase from the 25th to 75th percentile on the sample Theil’s H (17.97 to 30.06) increases gun violence exposure in the neighbourhoods that residents visit for Black neighbourhoods (0.50) by more than twice the amount for Hispanic (0.21) and mixed (0.17) neighbourhoods. The combined results suggest an ethnoracial hierarchy in how segregation exposes neighbourhoods to gun violence: segregation exerts no influence on Asian and white neighbourhoods across all scales, while exposing Black, Hispanic and mixed neighbourhoods to greater gun violence within their borders, in surrounding neighbourhoods, and the network of neighbourhoods their residents travel to for daily routines, with Black neighbourhoods experiencing the greatest impact across all scales.
Discussion
For decades, urban research on neighbourhood effects has established the importance of neighbourhoods in shaping spatial inequalities within cities. The concepts of geographic clustering and spatial diffusion extended the neighbourhood effects framework by advancing the extra-local spatial environment surrounding the residential setting as an important ecological scale in shaping spatial inequalities. Building on the foundational concept of activity spaces, recent work has introduced yet another urban ecological scale that acknowledges the connections between neighbourhoods both near and far formed by the daily mobility flows of city residents. This study contributes to this growing literature by comparing gun violence exposure at the residential, adjacent and network scales for neighbourhoods in the 100 largest MSAs in the US.
I find that gun violence exposure is on average greater in visited neighbourhoods compared to home and adjacent neighbourhoods controlling for a large set of residential sociodemographic conditions. Furthermore, most of the 100 largest MSAs exhibit either greater or equal exposure in visited neighbourhoods relative to home neighbourhoods, and gun violence exposure is highest at the network level for Asian, Hispanic, mixed and white neighbourhoods. Considering the nearly exclusive focus of gun violence research on exposure in the residential neighbourhood, and the demonstrated negative ecological spillover effects of gun violence exposure, greater network exposure suggests that the geographic burden of gun violence has been underestimated. The study’s findings indicate that this burden is carried by disadvantaged and resource-deprived neighbourhoods. Many of the structural factors generally associated with violent crime in residential neighbourhoods, such as socio-economic disadvantage, are associated with network exposure to gun violence. Furthermore, the burden of network gun violence exposure is carried by neighbourhoods already experiencing higher rates of gun violence within and around their borders. These findings add to the growing evidence suggesting that inter-city mobility patterns reinforce neighbourhood inequalities at a higher-order ecological scale previously unseen, specifically the network of neighbourhoods embedded via resident flows.
Mobility patterns also carry implications for neighbourhood ethnoracial inequalities. Corroborating prior work, I find that levels of gun violence exposure are considerably highest in Black residential and spatially adjacent neighbourhoods (Cheon et al., 2020; Johnson et al., 2021). The study highlights an additional scale of disadvantage for Black neighbourhoods: network gun violence exposure rates that are nearly twice as large as those for all other ethnoracial neighbourhood groups. Here, the geographic burden of gun violence for Black neighbourhoods spans multiple urban scales, embedding them in residential, spatial and network structures that expose them to levels that far exceed those for all other neighbourhoods. This result extends prior work showing similar network disparities in other environmental conditions including socio-economic disadvantage and air pollution to also include gun violence (Brazil, 2022; Levy et al., 2020). Given the documented effects of indirect gun violence exposure on a wide range of well-being outcomes, we are likely underestimating not only the role of gun violence exposure in explaining well-being outcomes, but also inequalities in these outcomes across neighbourhood race/ethnicity (Semenza and Kravitz-Wirtz, 2024).
The study points to segregation as a potential mechanism shaping ethnoracial inequalities in gun violence exposure. Research has demonstrated the harmful consequences of segregation for minority communities, including increased crime and violence, largely as a result of destabilising effects on socio-economic conditions, which lower access to resources that help reduce violence and promote safety (Feldmeyer, 2010; Krivo et al., 2009; Massey, 2020). Although some evidence suggests that segregation impacts all neighbourhoods (Krivo and Peterson, 2009), research has consistently demonstrated the stronger detrimental effects on Black communities (Light and Thomas, 2019; Massey, 2020). I find that the segregation’s reach in affecting Black and Hispanic communities extends to their neighbourhood networks. These results may be explained by segregation’s impact on mobility patterns. Prior work has shown that cities with more segregation by residence are also those in which the movements of people between white, Black, Hispanic, and mixed neighbourhoods are most proportionally unequal (Candipan et al., 2021; de la Prada and Small, 2024). That is, segregation observed across residential neighbourhoods extends to places beyond the home, producing a larger ecology of segregated neighbourhood networks within cities. Potentially working through similar mechanisms that explain segregation’s positive association with exposure to violence in Black and Hispanic residential settings, including the concentration of disadvantage in minority neighbourhoods and the greater salience of institutional racism in more segregated cities, this broader web of segregated neighbourhoods exposes Black and Hispanic neighbourhoods to greater levels of community gun violence, while limiting exposure for Asian and white neighbourhoods.
It must be noted that the positive association between segregation and gun violence exposure is much greater for Black neighbourhoods across all scales. This finding extends prior work that demonstrates higher levels of violence within Black residential settings in highly segregated cities by showing that segregation also exposes Black neighbourhoods to greater violence through the neighbourhoods they are connected to based on how their residents move around the city (Krivo et al., 2015; Light and Thomas, 2019). Tying these findings to the broader segregation literature, the paper underscores the theoretical claims that segregation is one mechanism by which the racial structure of US cities is maintained and functions (Massey, 2020). This study highlights yet another pathway through which segregation deepens Black neighbourhood disadvantage – daily mobility flows connecting Black neighbourhoods to violent places across the city.
Limitations of the study and future avenues of research should be noted. Caution is needed in interpreting the results as causal. While there are implications for future causal work, the aims in this paper were descriptive and designed for broad application. Future work should test for other mechanisms besides segregation that may explain the association between mobility patterns and gun violence exposure. This may include mechanisms measured at the MSA or city level, such as the access to and quality of public transit, and neighbourhood level, including features of the social environment such as collective efficacy. Another important direction for future research is to differentiate between different types of flows. Prior work has examined flows based on work commuting, as well as travel based on points of interest, such as parks, restaurants and schools (de la Prada and Small, 2024). Furthermore, because of data limitations, the analyses did not disaggregate mobility by time of day and day of the week, thereby assuming that travel is patterned similarly across time and day. The study’s findings pertain to ecological data at the neighbourhood level, and thus cannot make claims about individuals’ travel patterns, their exposure to gun violence in visited neighbourhoods, and how their exposure varies by individual race and class. I also do not account for the duration of time residents are in the neighbourhood they are visiting. I acknowledge the limitations associated with the use of GVA data. While GVA data has been confirmed against other media-based data repositories of fatal gun incidents (Conner et al., 2019), the use of media reports to identify nonfatal gun incidents has not, and reporting of violence remains inherently biased.
Despite these limitations, the study’s findings contribute to the extant literature on gun violence by demonstrating that community gun violence exposure extends to places beyond the residential environment. Rising rates of gun violence coupled with growing evidence demonstrating the implications of exposure on a wide range of health, economic and social outcomes have been used to frame gun violence as a public health crisis (Cohen, 2021). However, the primary approach in gun violence studies is to examine community gun violence exposure through the lens of the residential environment. While the activity space perspective already recognises the importance of routine activity destinations, this study elevates the unseen network that binds not just individuals to the neighbourhoods they visit, but also their neighbourhoods. Importantly, urban network patterns of gun violence exposure are not structured by the efforts of criminal enterprises, but rather by the daily routine travel of city residents. In this case, this study advances the way we conceive of and measure community gun violence exposure by demonstrating the connected nature of cities, and the role social networks play in the distribution of violence.
An implication of these findings for practice and policy is the need to incorporate mobility in place-based policies and public health intervention strategies. Not only do daily mobility networks expose neighbourhoods to greater gun violence, but they also offer a pathway for gun violence diffusion that is not spatially constrained. The study points to the importance of partnerships between communities embedded within disadvantage mobility-based networks. Practitioners serving these network-connected communities can collaborate to share and deploy gun violence prevention resources across their respective communities, thus increasing efficiency in the allocation of scarce resources. Rather than viewing gun violence afflicted neighbourhoods as single, independent entities, researchers, practitioners and policymakers can obtain a fuller, more accurate accounting of the burden of gun violence exposure, and a potentially stronger grasp of how to alleviate this burden, by situating these neighbourhoods within their durable neighbourhood networks formed by the daily routines of city residents.
Footnotes
Appendix
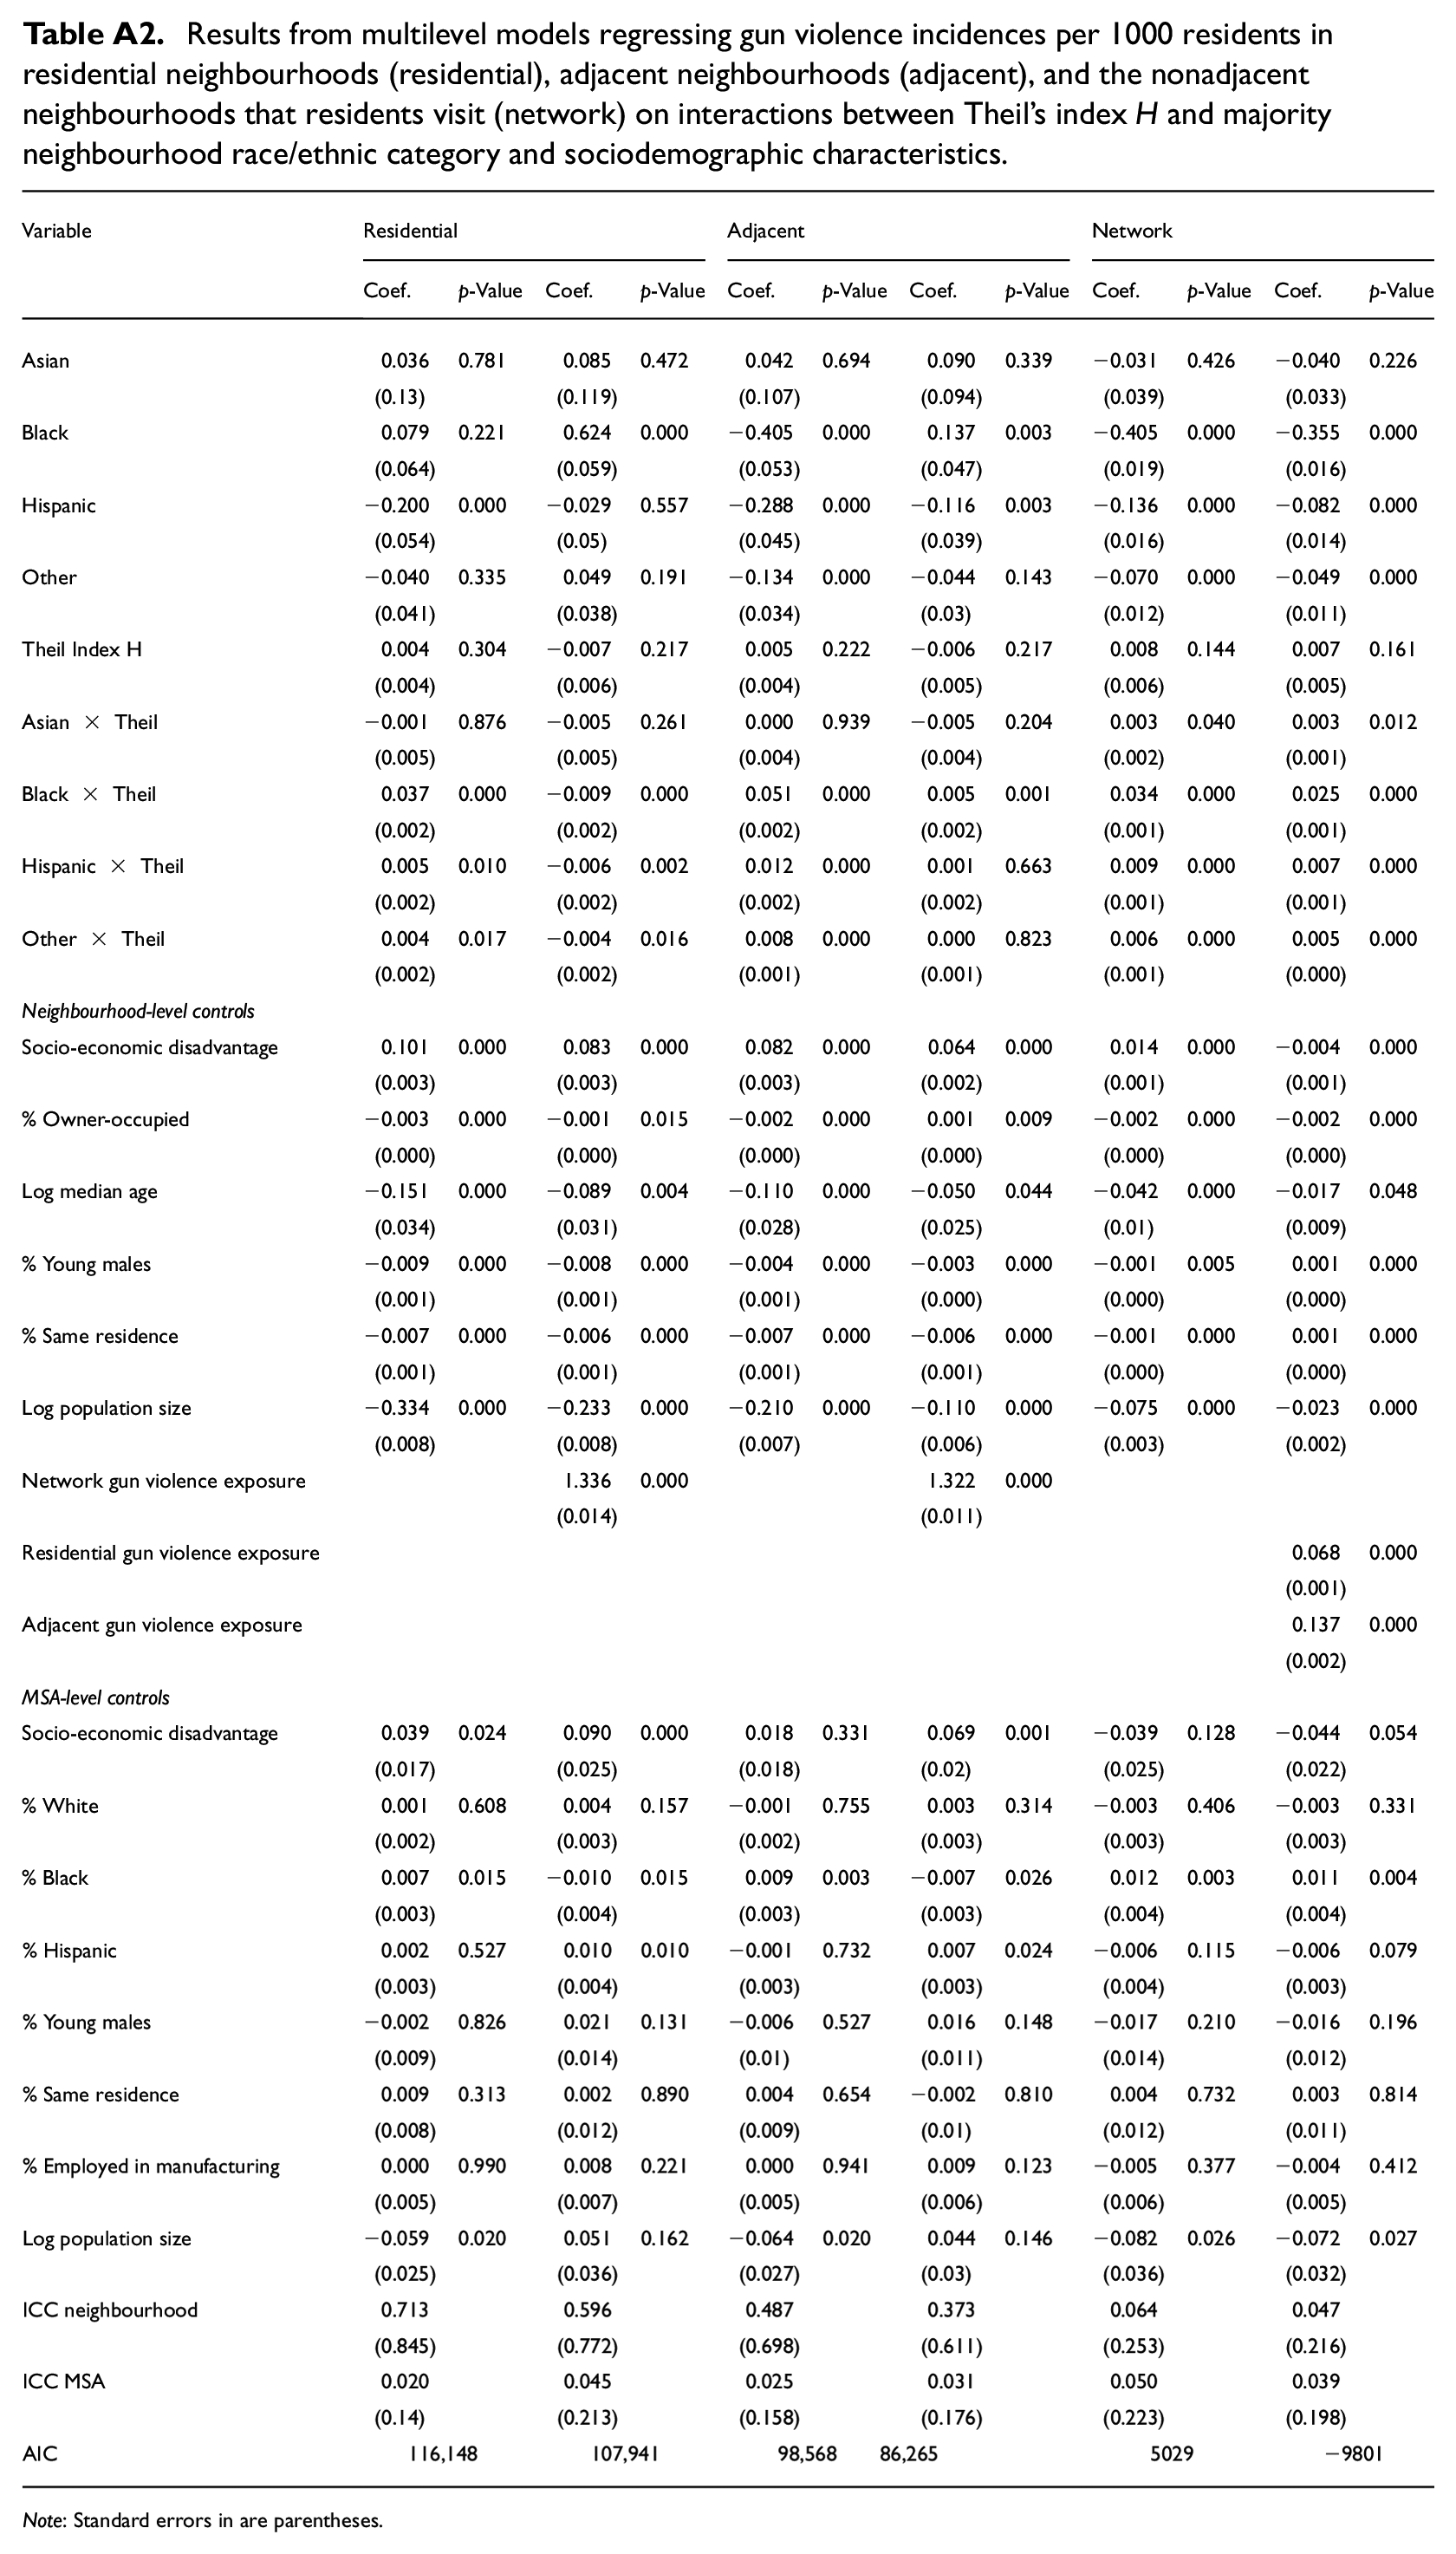
Results from multilevel models regressing gun violence incidences per 1000 residents in residential neighbourhoods (residential), adjacent neighbourhoods (adjacent), and the nonadjacent neighbourhoods that residents visit (network) on interactions between Theil’s index H and majority neighbourhood race/ethnic category and sociodemographic characteristics.
| Variable | Residential | Adjacent | Network | |||||||||
|---|---|---|---|---|---|---|---|---|---|---|---|---|
| Coef. | p-Value | Coef. | p-Value | Coef. | p-Value | Coef. | p-Value | Coef. | p-Value | Coef. | p-Value | |
| Asian | 0.036 | 0.781 | 0.085 | 0.472 | 0.042 | 0.694 | 0.090 | 0.339 | −0.031 | 0.426 | −0.040 | 0.226 |
| (0.13) | (0.119) | (0.107) | (0.094) | (0.039) | (0.033) | |||||||
| Black | 0.079 | 0.221 | 0.624 | 0.000 | −0.405 | 0.000 | 0.137 | 0.003 | −0.405 | 0.000 | −0.355 | 0.000 |
| (0.064) | (0.059) | (0.053) | (0.047) | (0.019) | (0.016) | |||||||
| Hispanic | −0.200 | 0.000 | −0.029 | 0.557 | −0.288 | 0.000 | −0.116 | 0.003 | −0.136 | 0.000 | −0.082 | 0.000 |
| (0.054) | (0.05) | (0.045) | (0.039) | (0.016) | (0.014) | |||||||
| Other | −0.040 | 0.335 | 0.049 | 0.191 | −0.134 | 0.000 | −0.044 | 0.143 | −0.070 | 0.000 | −0.049 | 0.000 |
| (0.041) | (0.038) | (0.034) | (0.03) | (0.012) | (0.011) | |||||||
| Theil Index H | 0.004 | 0.304 | −0.007 | 0.217 | 0.005 | 0.222 | −0.006 | 0.217 | 0.008 | 0.144 | 0.007 | 0.161 |
| (0.004) | (0.006) | (0.004) | (0.005) | (0.006) | (0.005) | |||||||
| Asian × Theil | −0.001 | 0.876 | −0.005 | 0.261 | 0.000 | 0.939 | −0.005 | 0.204 | 0.003 | 0.040 | 0.003 | 0.012 |
| (0.005) | (0.005) | (0.004) | (0.004) | (0.002) | (0.001) | |||||||
| Black × Theil | 0.037 | 0.000 | −0.009 | 0.000 | 0.051 | 0.000 | 0.005 | 0.001 | 0.034 | 0.000 | 0.025 | 0.000 |
| (0.002) | (0.002) | (0.002) | (0.002) | (0.001) | (0.001) | |||||||
| Hispanic × Theil | 0.005 | 0.010 | −0.006 | 0.002 | 0.012 | 0.000 | 0.001 | 0.663 | 0.009 | 0.000 | 0.007 | 0.000 |
| (0.002) | (0.002) | (0.002) | (0.002) | (0.001) | (0.001) | |||||||
| Other × Theil | 0.004 | 0.017 | −0.004 | 0.016 | 0.008 | 0.000 | 0.000 | 0.823 | 0.006 | 0.000 | 0.005 | 0.000 |
| (0.002) | (0.002) | (0.001) | (0.001) | (0.001) | (0.000) | |||||||
| Neighbourhood-level controls | ||||||||||||
| Socio-economic disadvantage | 0.101 | 0.000 | 0.083 | 0.000 | 0.082 | 0.000 | 0.064 | 0.000 | 0.014 | 0.000 | −0.004 | 0.000 |
| (0.003) | (0.003) | (0.003) | (0.002) | (0.001) | (0.001) | |||||||
| % Owner-occupied | −0.003 | 0.000 | −0.001 | 0.015 | −0.002 | 0.000 | 0.001 | 0.009 | −0.002 | 0.000 | −0.002 | 0.000 |
| (0.000) | (0.000) | (0.000) | (0.000) | (0.000) | (0.000) | |||||||
| Log median age | −0.151 | 0.000 | −0.089 | 0.004 | −0.110 | 0.000 | −0.050 | 0.044 | −0.042 | 0.000 | −0.017 | 0.048 |
| (0.034) | (0.031) | (0.028) | (0.025) | (0.01) | (0.009) | |||||||
| % Young males | −0.009 | 0.000 | −0.008 | 0.000 | −0.004 | 0.000 | −0.003 | 0.000 | −0.001 | 0.005 | 0.001 | 0.000 |
| (0.001) | (0.001) | (0.001) | (0.000) | (0.000) | (0.000) | |||||||
| % Same residence | −0.007 | 0.000 | −0.006 | 0.000 | −0.007 | 0.000 | −0.006 | 0.000 | −0.001 | 0.000 | 0.001 | 0.000 |
| (0.001) | (0.001) | (0.001) | (0.001) | (0.000) | (0.000) | |||||||
| Log population size | −0.334 | 0.000 | −0.233 | 0.000 | −0.210 | 0.000 | −0.110 | 0.000 | −0.075 | 0.000 | −0.023 | 0.000 |
| (0.008) | (0.008) | (0.007) | (0.006) | (0.003) | (0.002) | |||||||
| Network gun violence exposure | 1.336 | 0.000 | 1.322 | 0.000 | ||||||||
| (0.014) | (0.011) | |||||||||||
| Residential gun violence exposure | 0.068 | 0.000 | ||||||||||
| (0.001) | ||||||||||||
| Adjacent gun violence exposure | 0.137 | 0.000 | ||||||||||
| (0.002) | ||||||||||||
| MSA-level controls | ||||||||||||
| Socio-economic disadvantage | 0.039 | 0.024 | 0.090 | 0.000 | 0.018 | 0.331 | 0.069 | 0.001 | −0.039 | 0.128 | −0.044 | 0.054 |
| (0.017) | (0.025) | (0.018) | (0.02) | (0.025) | (0.022) | |||||||
| % White | 0.001 | 0.608 | 0.004 | 0.157 | −0.001 | 0.755 | 0.003 | 0.314 | −0.003 | 0.406 | −0.003 | 0.331 |
| (0.002) | (0.003) | (0.002) | (0.003) | (0.003) | (0.003) | |||||||
| % Black | 0.007 | 0.015 | −0.010 | 0.015 | 0.009 | 0.003 | −0.007 | 0.026 | 0.012 | 0.003 | 0.011 | 0.004 |
| (0.003) | (0.004) | (0.003) | (0.003) | (0.004) | (0.004) | |||||||
| % Hispanic | 0.002 | 0.527 | 0.010 | 0.010 | −0.001 | 0.732 | 0.007 | 0.024 | −0.006 | 0.115 | −0.006 | 0.079 |
| (0.003) | (0.004) | (0.003) | (0.003) | (0.004) | (0.003) | |||||||
| % Young males | −0.002 | 0.826 | 0.021 | 0.131 | −0.006 | 0.527 | 0.016 | 0.148 | −0.017 | 0.210 | −0.016 | 0.196 |
| (0.009) | (0.014) | (0.01) | (0.011) | (0.014) | (0.012) | |||||||
| % Same residence | 0.009 | 0.313 | 0.002 | 0.890 | 0.004 | 0.654 | −0.002 | 0.810 | 0.004 | 0.732 | 0.003 | 0.814 |
| (0.008) | (0.012) | (0.009) | (0.01) | (0.012) | (0.011) | |||||||
| % Employed in manufacturing | 0.000 | 0.990 | 0.008 | 0.221 | 0.000 | 0.941 | 0.009 | 0.123 | −0.005 | 0.377 | −0.004 | 0.412 |
| (0.005) | (0.007) | (0.005) | (0.006) | (0.006) | (0.005) | |||||||
| Log population size | −0.059 | 0.020 | 0.051 | 0.162 | −0.064 | 0.020 | 0.044 | 0.146 | −0.082 | 0.026 | −0.072 | 0.027 |
| (0.025) | (0.036) | (0.027) | (0.03) | (0.036) | (0.032) | |||||||
| ICC neighbourhood | 0.713 | 0.596 | 0.487 | 0.373 | 0.064 | 0.047 | ||||||
| (0.845) | (0.772) | (0.698) | (0.611) | (0.253) | (0.216) | |||||||
| ICC MSA | 0.020 | 0.045 | 0.025 | 0.031 | 0.050 | 0.039 | ||||||
| (0.14) | (0.213) | (0.158) | (0.176) | (0.223) | (0.198) | |||||||
| AIC | 116,148 | 107,941 | 98,568 | 86,265 | 5029 | −9801 | ||||||
Note: Standard errors in are parentheses.
Acknowledgements
I would like to thank attendees of the Department of Digital and Computational Demography Seminar at the Max Planck Institute for Demographic Research for their valuable feedback.
Declaration of conflicting interests
The author declared no potential conflicts of interest with respect to the research, authorship, and/or publication of this article.
Funding
The author disclosed receipt of the following financial support for the research, authorship, and/or publication of this article: Russell Sage Foundation, Grant No. 2207-39618.