
Abstract
North American downtowns are struggling to recover from the global COVID-19 pandemic. This study aims to investigate the varying rates of recovery experienced by downtown areas in the 66 largest cities of the United States and Canada. Leveraging Location-Based Services data extracted from mobile phone location trajectories, we assess the recovery rates in the 2023 post-pandemic period, juxtaposed against pre-pandemic 2019 levels. We find significant disparities in downtown recovery rates. Economic factors emerge as crucial determinants, where downtowns hosting a concentration of sectors with remote/hybrid work options – such as information, finance, professional services and management – displayed sluggish recovery. Conversely, downtowns with a focus on industries like accommodation, manufacturing, education, retail, construction, entertainment and healthcare exhibited greater resilience post pandemic. Furthermore, higher density, crime rates and education levels were correlated with slower recovery rates, as were harsher weather conditions and longer commuting times. Lower-density and auto-orientated downtowns demonstrated a swift rebound, even surpassing pre-pandemic activity levels. These findings underscore the necessity for tailored policies to bolster the revival of North American downtown areas.
Introduction
The COVID-19 pandemic deeply affected cities worldwide, impacting all sectors, but particularly devastating downtowns functioning as employment centres and retail hubs. Over a year after the official end of the pandemic, many North American downtowns are struggling, while many of their international counterparts, such as European cities, are thriving (Chapple et al., 2023; Williams, 2023). As the pandemic struck cities in early 2020, it worsened existing challenges in these US and Canadian urban centres. These downtown areas heavily depend on commercial and business activities, while also grappling with both longstanding issues like economic stagnation, wide gaps in wealth, housing affordability problems, a lack of lively residential communities and inadequate infrastructure for pedestrians and public transportation, and more recent structural changes like the rise of working from home (WFH) and e-commerce (Aksoy et al., 2023; Chang et al., 2022; Sands et al., 2022; Shemer et al., 2022; Zhang et al., 2020). The pandemic further destabilised this already fragile environment by forcing many businesses to close temporarily or permanently, reducing the footfall, decreasing consumer spending and leading to a shift to remote work (Florida et al., 2023; Hutson and Orlando, 2023). This disrupted traditional employment patterns and made North American downtowns less appealing for both workers and visitors alike (Ramani and Bloom, 2021; Schmahmann et al., 2022). However, many downtowns are now in the process of recovery, while others lag behind, differences that have sparked interest and debate among scholars and policymakers. Understanding the factors that contribute to these different recovery rates is critical for designing effective policies and strategies to promote a more equitable and resilient recovery for the future – and for future pandemics.
Thus, the purpose of this study is to examine and explain downtown recovery rates in the 66 largest cities in the United States and Canada. This study measures the recovery rates in the 2023 post-pandemic period in relation to 2019 levels using location-based services (LBS) data, and then correlates the results against 51 explanatory variables from six categories: employment by industry, housing and socio-economic factors, commuting variables, COVID-19 policies, crime rates and weather conditions.
Downtown recovery in context: A literature review
The shock of the COVID-19 pandemic impacted how cities functioned, but some of this transformation was already underway decades before. This section reviews three of these short-term impacts and long-term shifts: population migration; WFH and office occupancy; and retail.
The first 20 years of the 21st century saw a remarkable transformation of downtowns in North America, dubbed the ‘back-to-the-city’ movement (Birch, 2002). But early in the pandemic, Ramani and Bloom (2021) noted a new trend: many households, businesses and real estate interests were shifting away from crowded downtown areas and towards more spread-out suburban neighbourhoods within major US cities, that is, the ‘donut effect’. Those who were relocating often belong to a demographic characterised by being affluent, young and without children, which Patino et al. (2021) refer to as the untethered class. Schmahmann et al. (2022) showed that in the New York City metropolitan area, activity decreased in Manhattan but increased in suburbs and secondary cities. These shifts have sparked discussions about transforming downtown areas into what Florida (2022) calls ‘Central Connectivity Districts’, or about repurposing offices into mixed-use and recreational spaces, as suggested by Loh and Kim (2021).
There is thus increasing evidence that high-income professionals have opted to leave downtown areas for suburban neighbourhoods (Ding and Hwang, 2022; Ferreira and Wong, 2022; Ramani and Bloom, 2021). Relatedly, studies examining the shift in firm locations reveal that many companies are not only relocating from downtown areas but also significantly downsizing their commercial office spaces (Dalton and Groen, 2022; Rosenthal et al., 2022).
The pandemic also triggered significant shifts in the essence of downtown life. The onset of the first observed COVID-19 cases prompted mitigation measures such as limitations on gathering sizes, school and workplace closings and stay-at-home orders (Lasry et al., 2020). This forced key institutions to pivot to entirely remote operations, replacing most face-to-face activities with video-conferencing calls for the duration of public health restrictions (Rock et al., 2020).
WFH patterns are not new; studies noted the steady growth of telecommuting over 30 years ago (Mokhtarian, 1991). But as some 40% of the workforce shifted to at-home work overnight at the onset of the pandemic, based on the Canadian experience, the pace of WFH adoption has accelerated (Statistics Canada, 2024). Nearly four years after its onset, WFH technologies and their effects are one of the most important and enduring economic legacies of the COVID-19 pandemic. Based on the latest data, it appears that remote work holds promise for the future, indicating an ongoing but gradual trend towards remote-work setups. According to WFH research, as of January 2024, around 12.4% of full-time employees were WFH. This shows how quickly remote work has become the norm, especially in sectors like tech, finance and professional and business services (Barrero et al., 2024). Simultaneously, a significant 28.2% of employees have adapted to a hybrid work model. Moreover, the prevalence of WFH is much higher in the United States and Canada (as well as the UK and Australia) than in other countries around the world, likely impacting their downtowns (Aksoy et al., 2023).
The accelerated demand for hybrid working patterns has led to potentially permanent changes in the use and configuration of offices (Fiorentino et al., 2022). Grant (2022) and Kastle Systems (n.d.) indicate that while activity levels in 2022 are nearing 2019 levels for leisure purposes, the return to office remains stubbornly low at between 30% and 60%. According to CBRE (2023), the office spaces across Canada saw a significant increase in vacancies, reaching 18.1% in the second quarter of 2023. This is the highest vacancy rate recorded since 1994. But Canadian cities are still faring better than comparable major US downtowns; for instance, San Francisco experienced a vacancy rate of 29.4% and Dallas/Ft. Worth 31.3% in Q1 2023. Thus, it has become clear that while some downtowns were on an upward trajectory to recovery, others were stagnating (Leong et al., 2023).
Technology has not only transformed work and commuting but also accelerated changes in how we purchase goods and services. Traditional retail has long been in decline due to changes in consumption patterns and the rise of e-commerce (Chava et al., 2024). But the pandemic accelerated the closure of businesses: for example, in the first six months of the pandemic, a total of 163,735 US businesses on Yelp closed, with 60% of these closures permanent, and in Canada 40% of retailers ceased in-store operations (Statistics Canada, 2021; Yelp, 2020).
Downtown businesses have been disproportionately affected by the pandemic, experiencing a higher rate of store closures compared to non-downtown areas (JPMorgan Chase & Co., 2023; Motoyama, 2022). Research by Lund et al. (2021) shows a pandemic-induced permanent shift in consumer behaviour towards online shopping and remote work. This trend poses challenges for traditional brick-and-mortar stores and office spaces, demanding innovative approaches to remain relevant (Brookings, 2020). However, research by the Urban Land Institute and PwC (2022) suggests that small businesses, minority-owned businesses and service-orientated industries in downtowns have been hit the hardest.
Research has also shed light on how the pandemic has exacerbated pre-existing inequalities and given rise to new disparities among various social dimensions, such as income, age, sex, class, ethnicity, race, ability and sexuality (Buffel et al., 2023; Manzano Gómez, 2023; Shatkin et al., 2023; Trasberg and Cheshire, 2023). Mouratidis (2021) argues that key factors like access to healthcare, local amenities, safe transportation, green spaces, adequate housing and technology have played a crucial role in determining how people have experienced the pandemic’s impact on their quality of life. Thus, vulnerable and marginalised groups, including low-income individuals and people of colour living in downtown areas, have been disproportionately affected by these changes.
While recent studies have utilised a variety of methodologies to assess the impact of COVID-19 on urban areas, the empirical analysis of downtown recovery tends to focus only on broad economic indicators such as unemployment rates, business closures and consumer spending (Bartik et al., 2020; Chetty et al., 2020), or employs spatial modelling to examine the relationship between COVID-19 cases and urban characteristics such as population density and land use (Hamidi et al., 2020). Additionally, qualitative methods like surveys and interviews have explored policy responses and governance frameworks (Sands et al., 2022; Sharifi and Khavarian-Garmsir, 2020). Despite these efforts, data granularity remains limited, often limited to the metropolitan level, thus impeding detailed city- or community-level analysis. Recent advancements have seen the adoption of mobile phone-based digital-tracking technologies to measure movement and social activity, analyse movement control policies and study travel preferences and migration patterns (Couture et al., 2022; Leong et al., 2023; Schmahmann et al., 2022; Sevtsuk et al., 2021), which presents an opportunity for the more granular analysis we undertake here.
Several factors – economic, behavioural and policy related – are expected to influence downtown recovery differently across various North American cities. While theoretical discussions on downtown recovery determinants exist (Berube and Byerly-Duke, 2022; Florida et al., 2023; Khan et al., 2021; Loh and Kim, 2021), empirical studies remain scarce. One notable study (Leong et al., 2023) focuses on downtown recovery but is limited in scope, as it analyses recovery trajectories rather than outcomes and concludes in spring 2022 when some pandemic restrictions were still in place. This leaves a gap in understanding the full recovery trajectory post 2022. Thus, this research aims to fill this gap by empirically measuring changes in economic and social activity patterns within downtown cores from 2019 to 2023, using LBS data. It will link the relative recovery rates to various explanatory variables hypothesised to affect recovery, providing a more granular and comprehensive understanding of downtown recovery dynamics.
Data and methods
The article employs two datasets for its analysis, combining found data with survey and administrative data. The first dataset is LBS data from mobile phones linked to geospatial boundaries of downtown areas to estimate the recovery rates. The second dataset is a collection of explanatory variables used to identify the reasons behind different recovery rates.
Selection and definition of downtowns
This study encompasses cities in the United States and Canada that had a population of more than 350,000 or were the primary city of a metropolitan area with a population over 2 million as at the 2019 American Community Survey (ACS) or the 2016 Canadian Census, totalling 75 cities. Of these, we excluded eight cities where the employment density of downtown zip codes was less than 500 jobs per square mile, a threshold for an economically significant downtown area (Loh and Love, 2023). This left our study with 66 cities that we grouped into six regions, as illustrated in Figure 1a.
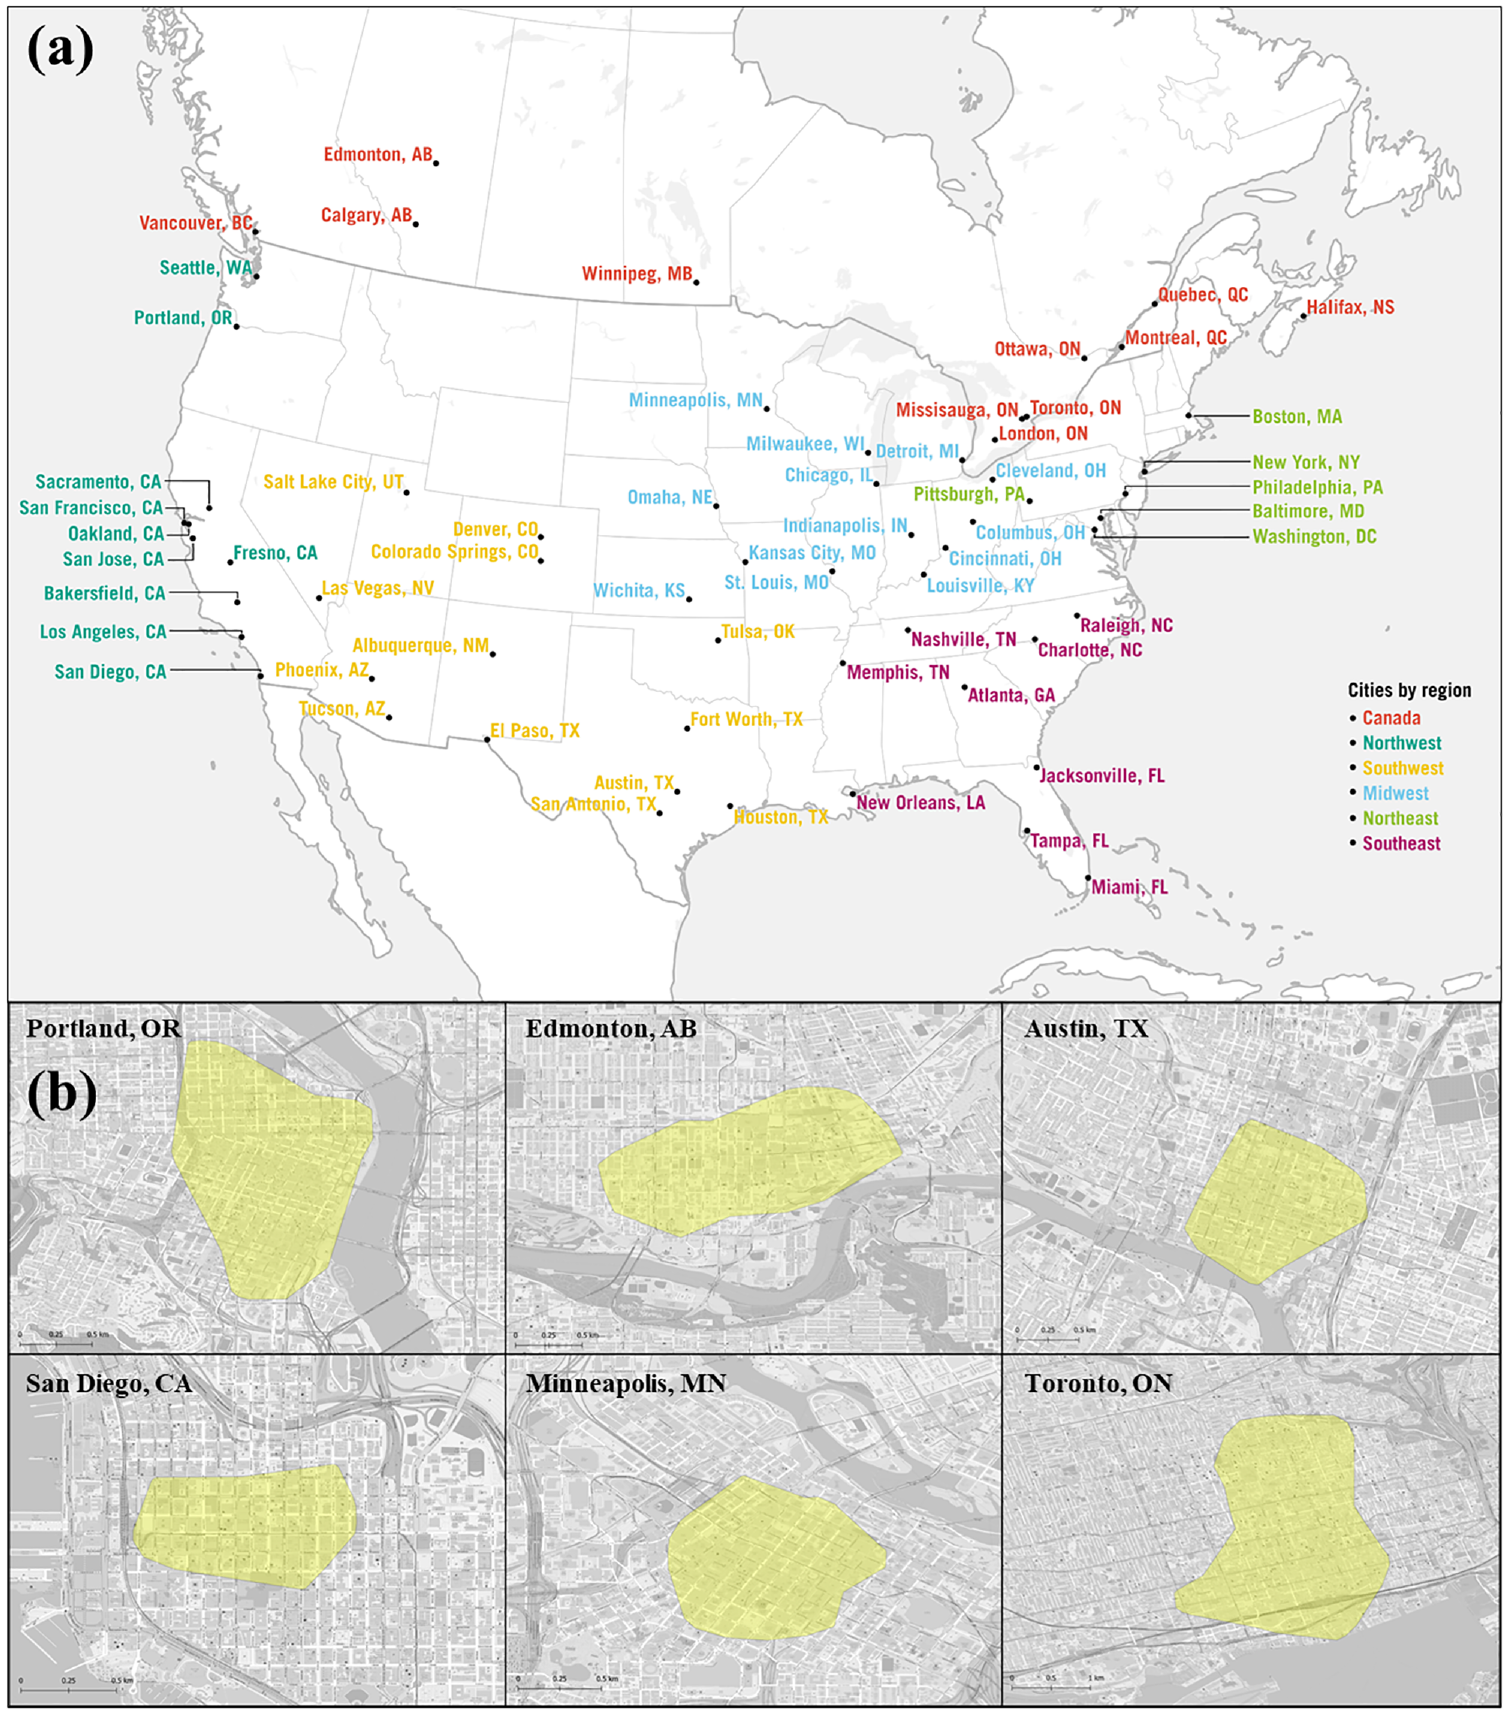
(a) Cities within the scope of the study. (b) Example downtown boundary definitions as delineated using the Hierarchical Density-Based Spatial Clustering of Applications with Noise (HDBSCAN) algorithm.
Downtown areas are typically defined based on administrative or census boundaries, which frequently fail to accurately capture the true geographical extent of downtown employment centres. To tackle this issue, we developed a new definition of downtowns employing the Hierarchical Density-Based Spatial Clustering of Applications with Noise (HDBSCAN) algorithm. We used job data from 2019 (in the United States) and 2016 (in Canada) to pinpoint where the highest concentrations of jobs are within individual city blocks. We generated one randomly scattered point for every 100 jobs in each block (in the United States) or dissemination area (in Canada). We then applied the HDBSCAN algorithm to each city individually to create clusters of points within the city, discarding the points designated as ‘noise’ and tuning the parameters to select a cluster representing each city’s downtown. For this step, we validated these geographies using Google Maps, cities’ own definitions of their downtowns, our personal knowledge of certain cities and Brookings’ 2023 definitions of downtowns across the United States. The validation process involved visually comparing our identified downtown boundaries with existing definitions, noting any major discrepancies. The validation results revealed that our boundaries generally aligned well, though some discrepancies arose due to differences in granularity and the specific datasets used. We deemed these discrepancies acceptable due to the need for a consistent measure of density across major employment centres. Next, we created a buffer around each point in the cluster and created a polygon from the spatial union of these buffers. Lastly, we formed a concave hull around this polygon to create the final downtown area. Figure 1b illustrates six representative downtown areas located in the United States and Canada.
Measuring the economic and social activity of downtowns
Indicators utilised to measure the vibrancy of downtowns often include retail spending, tax revenue, public transit ridership, parking occupancy, pedestrian counts, occupancy rates of offices, residences and hotels, as well as rental rates, new construction, net business openings, employment numbers and unemployment rates (Alliance for Downtown New York, 2022; Chicago Loop Alliance, 2022; Emmons, 1965; Forouhar, 2022; International Downtown Association, 2019; Smith and Doe, 2022). However, these can be difficult to aggregate into a complete picture of downtown activity, since each proxy only accounts for a subset of the demand, derived demand or supply of activity downtown.
Throughout the COVID-19 pandemic, researchers utilised mobile phone data to quantify the impacts of the pandemic on movement and social activity (Couture et al., 2022; Leong et al., 2023; Sevtsuk et al., 2021), to understand the efficacy of movement control policies (Vinceti et al., 2020; Wu and Shimizu, 2022), to analyse travel preferences during the pandemic (Heiler et al., 2020) and to track the migration patterns of remote workers (Schmahmann et al., 2022). Couture et al. (2022) emphasises the suitability of smartphone data for tracking human activity in real time and at a fine spatial scale during episodes such as the COVID-19 pandemic, offering valuable insights for economic analysis and policymaking. Suimon (2021) further examines the accuracy of using foot traffic from mobile phone GPS data to monitor changes in consumer behaviour, particularly in urban areas, and their correlation with macroeconomic variables. The study found a notable correlation between the number of visitors to city areas and GDP consumer spending and spending-related statistics, as well as an inverse correlation between online spending and people’s movements, especially during the spread of COVID-19. Thus, a surge in visitation not only indicates the return of people to these spaces but also suggests a revitalisation of the urban environment.
In this study, we employed LBS data derived from mobile phones by Spectus. Spectus provides aggregated mobility data via a location intelligence platform. Data is collected from 15 million anonymised daily active users who have opted in, through a CCPA- and GDPR-compliant framework, with an average accuracy of roughly 16 m and a minimum of 1 m. The Spectus data is collected from smartphone devices with installed partner applications that have location at the heart of the application’s functionality. The GPS pings received from partners are directly reported from the devices’ onboard GPS receiver. The Spectus responsible data-sharing framework enables research partners to query data via a cleanroom environment.
The Spectus database identifies a stop as a single stay of a user in a precise location, that is, a point in space (and time) where the user spent some time. This identification is achieved through a stop-detection algorithm that determines the sequence of points constituting a single stay of a user, and then aggregates them into a single entity with latitude, longitude and duration. This data enables us to compute the number of unique devices (unique stoppers) stopping in each downtown polygon in a custom period of time. Nonetheless, fluctuations in unique device counts over time might not necessarily indicate real changes in activity, but rather variations in sample sizes from data providers. To address this issue, we normalised downtown counts by incorporating data from broader geographical areas, specifically utilising Core-Based Statistical Areas (CBSAs) in the United States and Census Metropolitan Areas in Canada.
To gauge the extent of downtown recovery over the study period, we developed a metric termed the ‘recovery rate’. This metric was calculated by comparing the normalised number of unique devices (unique stoppers) during the post-pandemic period to those in the pre-pandemic period. Specifically, we analysed the average recovery rate from March to June 2023 and compared it to the corresponding timeframe of March to June 2019:

The average recovery rate values below 1 suggest reduced foot traffic between March and June 2023 compared to the corresponding period in 2019, while values greater than 1 indicate that there is more activity during the analysis time period.
Explanatory variables
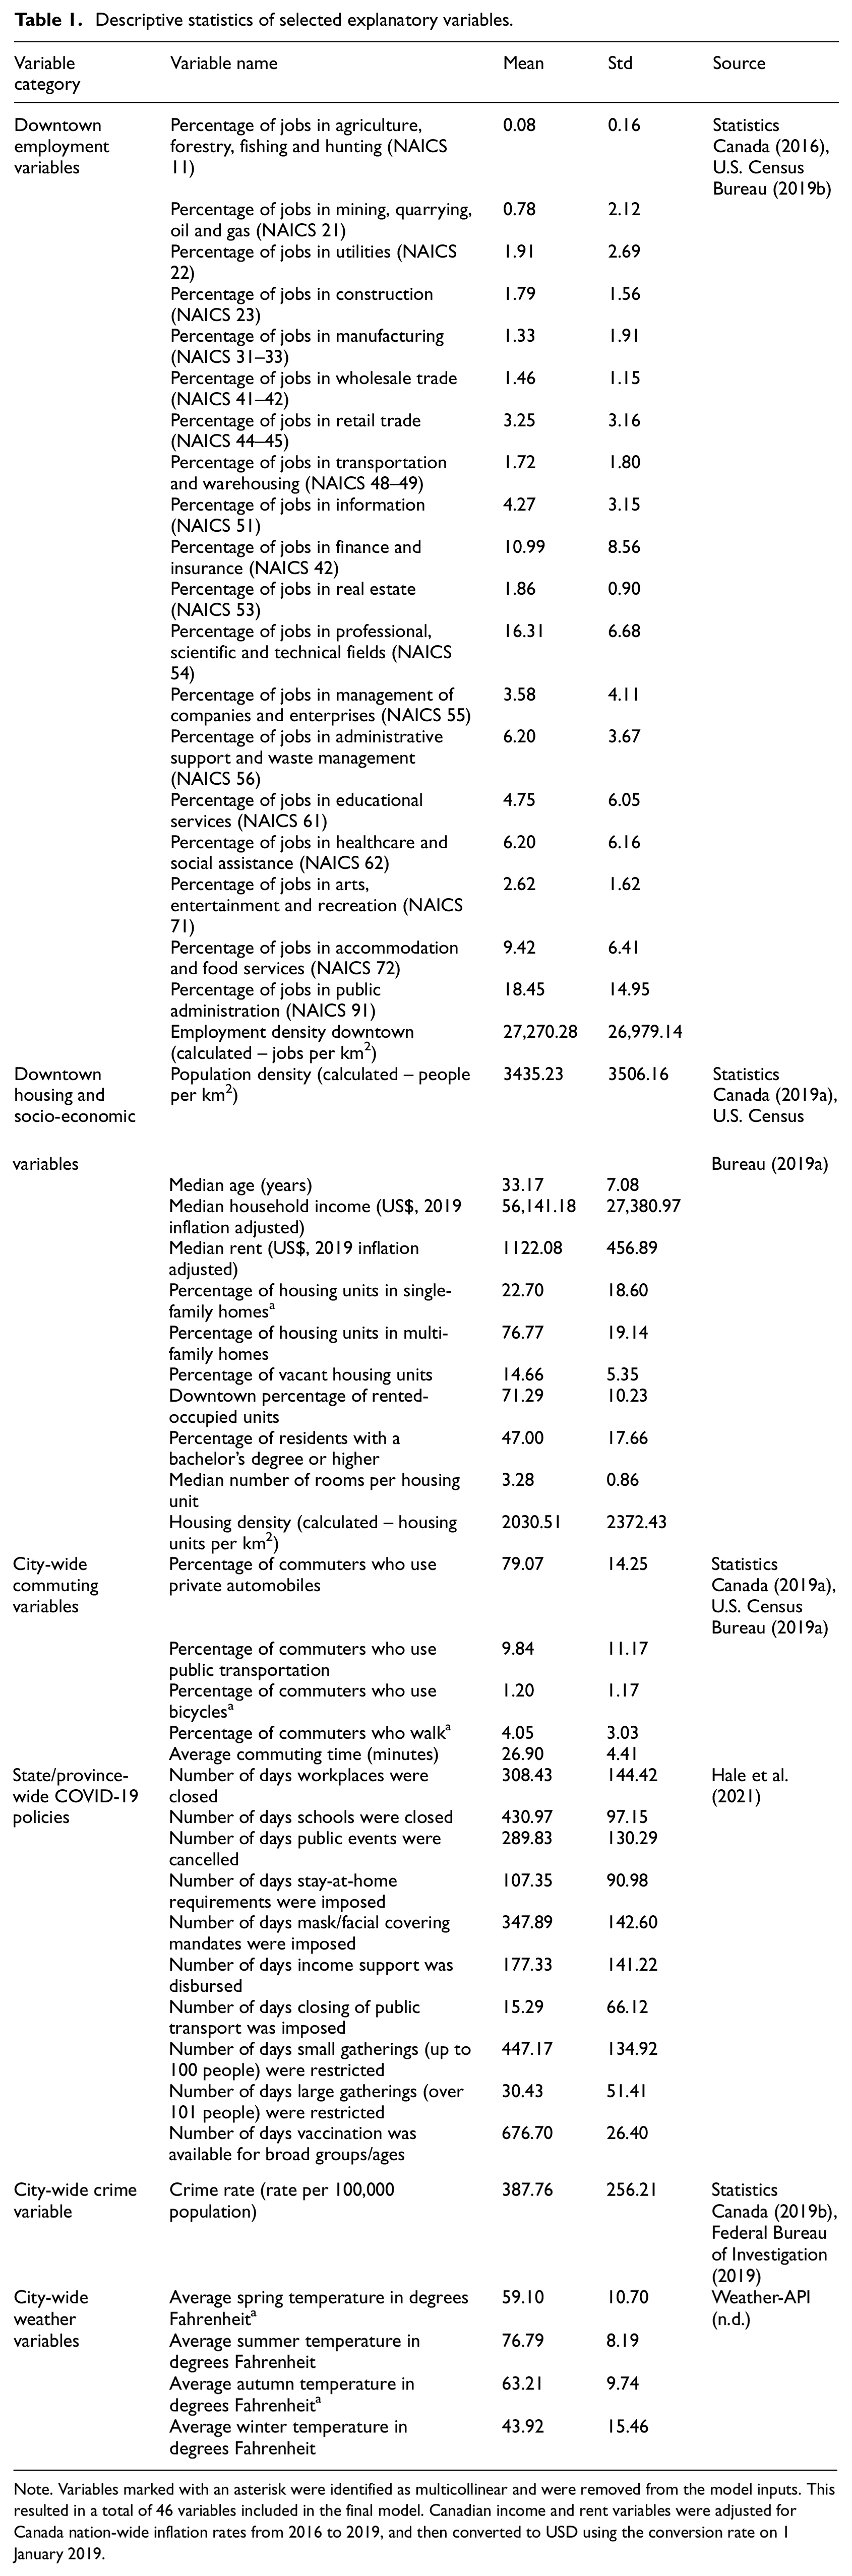
To assess the factors associated with downtown recovery, we analysed six categories of characteristics: downtown employment by industry, housing and socio-economic factors, commuting factors, COVID-19 policies, crime rates and weather variables (Table 1).
Descriptive statistics of selected explanatory variables.
Note. Variables marked with an asterisk were identified as multicollinear and were removed from the model inputs. This resulted in a total of 46 variables included in the final model. Canadian income and rent variables were adjusted for Canada nation-wide inflation rates from 2016 to 2019, and then converted to USD using the conversion rate on 1 January 2019.
We gathered data on downtown employment from two sources: the LEHD Origin-Destination Employment Statistics (LODES) Workforce Area Characteristic tables (U.S. Census Bureau, 2019b) and the Employment by Industry, annual table (Statistics Canada, 2016). We looked at the number of jobs in each industry, categorised by the North American Industry Classification System (NAICS), and added them up for the downtown area. Then, we calculated the percentage of jobs in each industry to see which ones were most prevalent. To measure employment density, we divided the total number of jobs by the land area of our defined downtown. These variables not only help us understand which industries were better equipped for remote work during and after the COVID-19 pandemic but also give an insight into whether downtowns focus more on office work or services.
We collected socio-economic data from the ACS 5-Year Estimates Detailed Tables (U.S. Census Bureau, 2019a) and the Canadian Census of Population (Statistics Canada, 2019a). For our research question, we combined or averaged these variables across our downtowns. Factors like education levels, rent prices, income and age help us understand how adaptable the population is to pandemic conditions. To measure population and housing density, we divided the total population or housing stock by the land area of our downtowns.
We gathered information about COVID-19 policies and restrictions from the Oxford University COVID-19 Government Response Tracker (OxCGRT), developed by Hale et al. (2021). This tracker monitors and evaluates policy responses at a state or provincial level in 180 countries, with updates on a daily basis up to the end of 2022. We looked at important factors like vaccination availability, closures and restrictions, all of which could have either direct or indirect effects on economic activity patterns. The severity of restrictions was defined as the sum of the number of days that a particular restriction or policy was in place over the study period. For the purpose of this study, given that the majority of a state/province’s population lives in cities, we assume that the most stringent policy from states/provinces is applied to cities. This means that cities in the same state or province will have identical variables for restrictions.
We obtained the crime rate at the city level from Incident-based Crime Statistics (Statistics Canada, 2019b) and the FBI’s Uniform Crime Reporting Program (Federal Bureau of Investigation, 2019). To calculate the crime rate, we divided the total number of violent crime incidents by the total population of each city. Since crime data was not available for the specific downtown geographies, we applied the crime rate at the city level to the downtown areas.
Lastly, we sourced data on average seasonal weather conditions from the World Weather Online API (n.d.). Weather played a role in activity levels throughout the pandemic. For instance, public health measures like outdoor dining and events were easier to implement in warmer climates. As the pandemic progressed, extreme weather conditions likely influenced the preference for WFH and for utilising on-demand delivery services.
Since this study is to inform policymaking, it is crucial not only to quantify the relationships between various explanatory variables and recovery rates but also to identify the most influential variables. Among the various methods available to achieve this objective, random forest is frequently regarded as a robust choice, particularly in research involving a large number of independent variables (Robnik-Šikonja, 2004). Random forest provides a built-in mechanism for ranking the importance of features. It calculates the contribution of each variable to reducing impurity within tree nodes, assigning importance scores to aid in identifying the most influential features. Beyond its capacity to capture nonlinear relationships, random forest also demonstrates greater resilience to overfitting compared to traditional regression methods by constructing multiple trees and aggregating their predictions. It can, thus, effectively handle datasets with a large number of independent variables without overfitting (Rigatti, 2017; Speiser et al., 2019). Specifically, we employed the random forest regressor (RFR) to predict the recovery rates of each downtown and rank the importance of features. To find the optimal combination of hyperparameters of the random forest that yield the best performance for the model, we used a randomised search cross-validation (Randomized Search CV) (Pedregosa et al., 2011). Randomized Search CV is employed with carefully chosen hyperparameter ranges, tailored to the dataset size, to prevent underfitting or overfitting while maintaining computational efficiency. Bootstrapping, utilising 80% of the data for training and 20% for testing, is integrated into the random forest algorithm. This technique involves randomly selecting subsets of the original data with replacement to construct multiple bootstrap samples, which are then utilised for training individual decision trees in the random forest. While the feature importance in the random forest does not include the direction of the variables’ influence, this is uncovered by employing SHAP (SHapley Additive exPlanations) values. SHAP values indicate how much each feature pushes the model’s prediction away from a baseline or reference point by considering all possible combinations of features and their contributions (Marcílio and Eler, 2020).
Results: Downtown recovery rates and the most important explanatory variables
Figure 2a displays the ranking of downtown recovery rates based on the average recovery rate during March–June 2023, categorised by city size. The x-axis indicates the recovery rates, which represents the percentage of activity that has returned. The results indicate a mean recovery rate of around 76% and only half of the cities in the dataset have achieved a recovery rate equal to or above 75%, suggesting that most downtown areas in North America are still grappling with restoring their pre-pandemic levels of foot traffic. However, there is significant variability in the recovery rates; for instance, St. Louis experiences a minimum recovery rate of 53%, whereas Las Vegas surpasses its pre-pandemic activity levels with a recovery rate of 102%, illustrating the variation in the pace of recovery among the cities examined. Further exploration of the results reveals that downtown cores in the southern United States and in medium-sized cities have experienced the most significant recovery, while those in the north, as well as larger cities, have faced more challenges in maintaining the same proportion of visits in their downtown areas. Notably, Figure 2b compares the recovery rates of several American downtowns alongside the broader trends observed within their corresponding CBSAs except the downtown areas, painting a vivid picture of the distinct challenges faced by downtown areas in their journey towards post-pandemic resurgence.
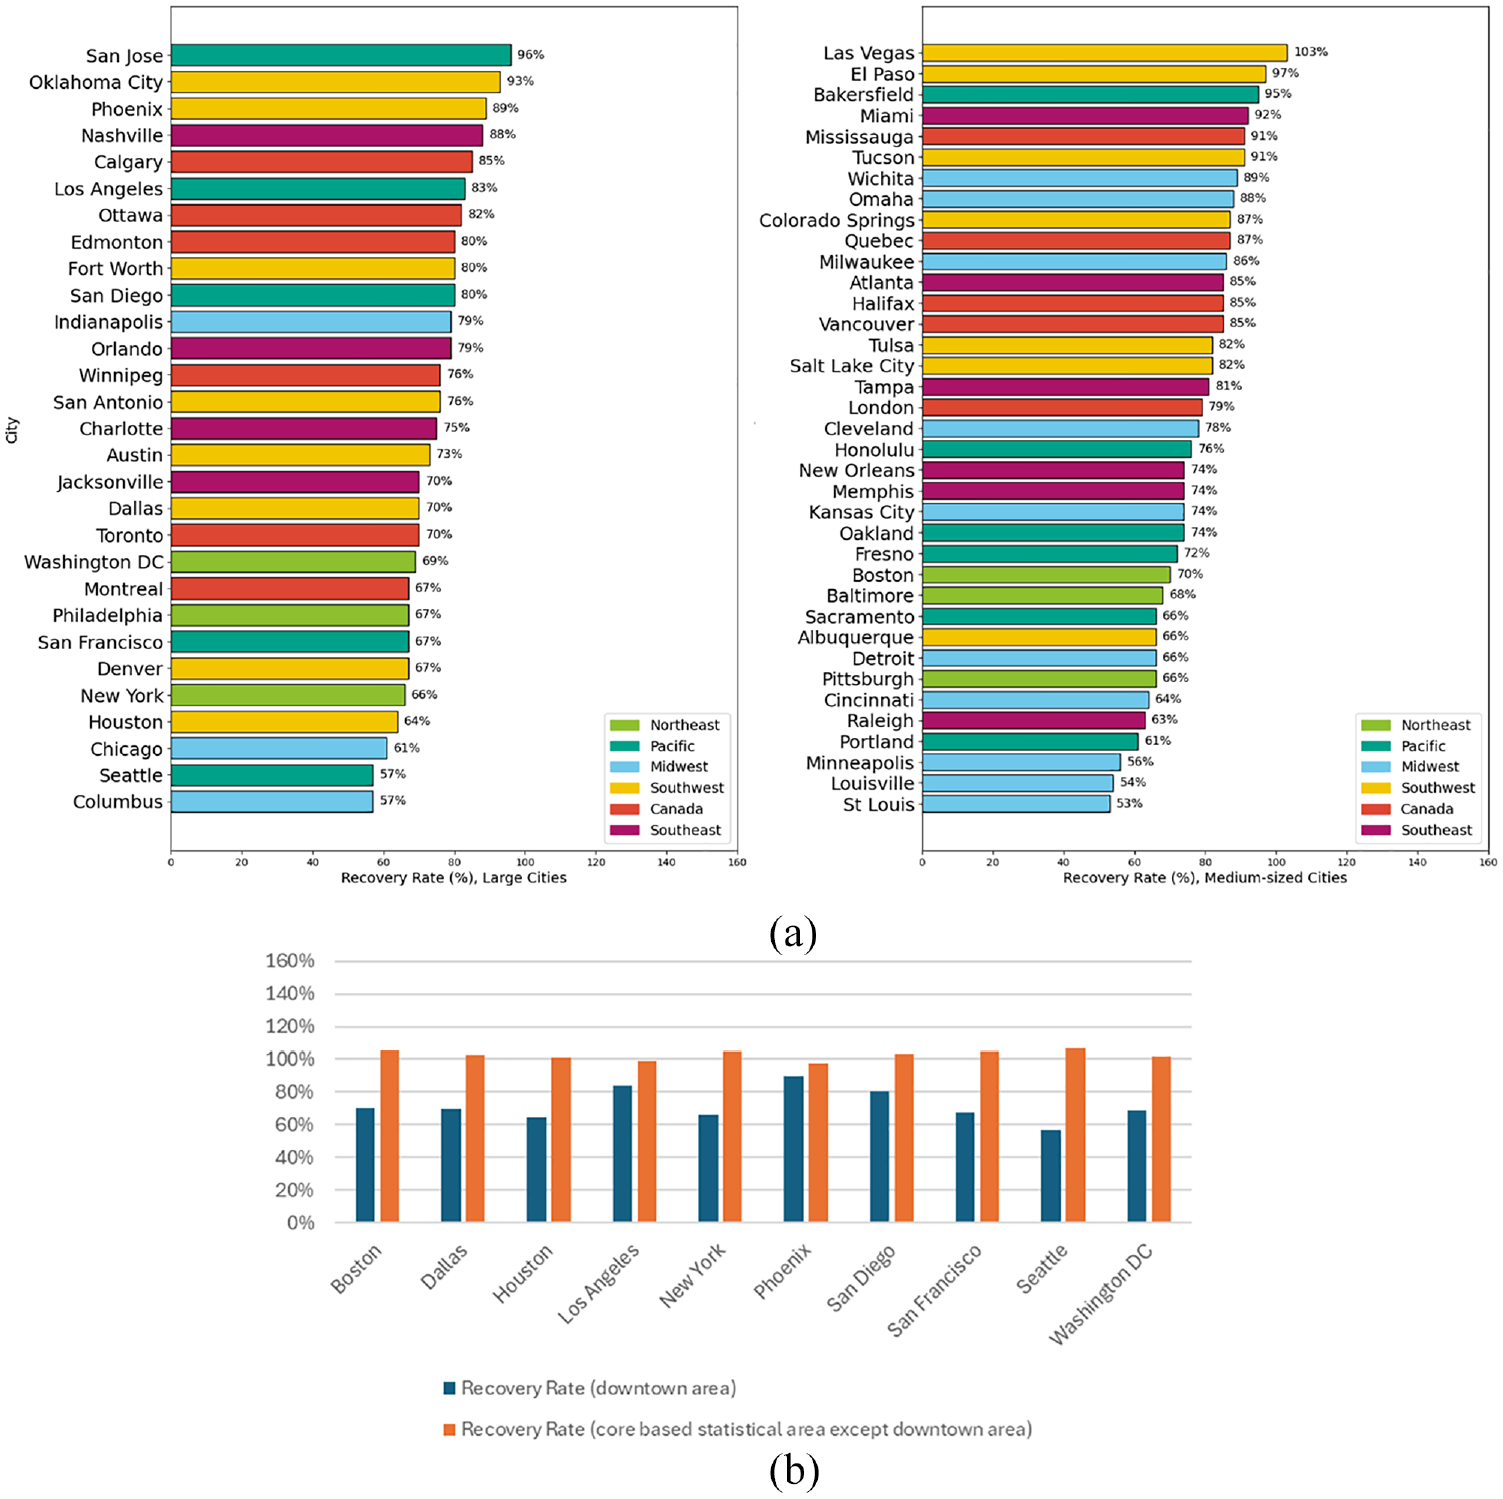
(a) Ranking of downtown recovery rates in large and medium-sized cities. (b) Comparing the recovery rates of American downtowns with the recovery rates of their corresponding CBSAs outside of the downtown area.
The random forest feature importances based on the average recovery rates during the period March–June 2023 are displayed in Figure 3. It is worth mentioning that normalised feature importance represents the relative contribution of each feature to the model’s predictions, expressed as a percentage. Features with higher normalised importances have a greater impact on the model’s predictive performance. Furthermore, we found the direction of effects using SHAP values.
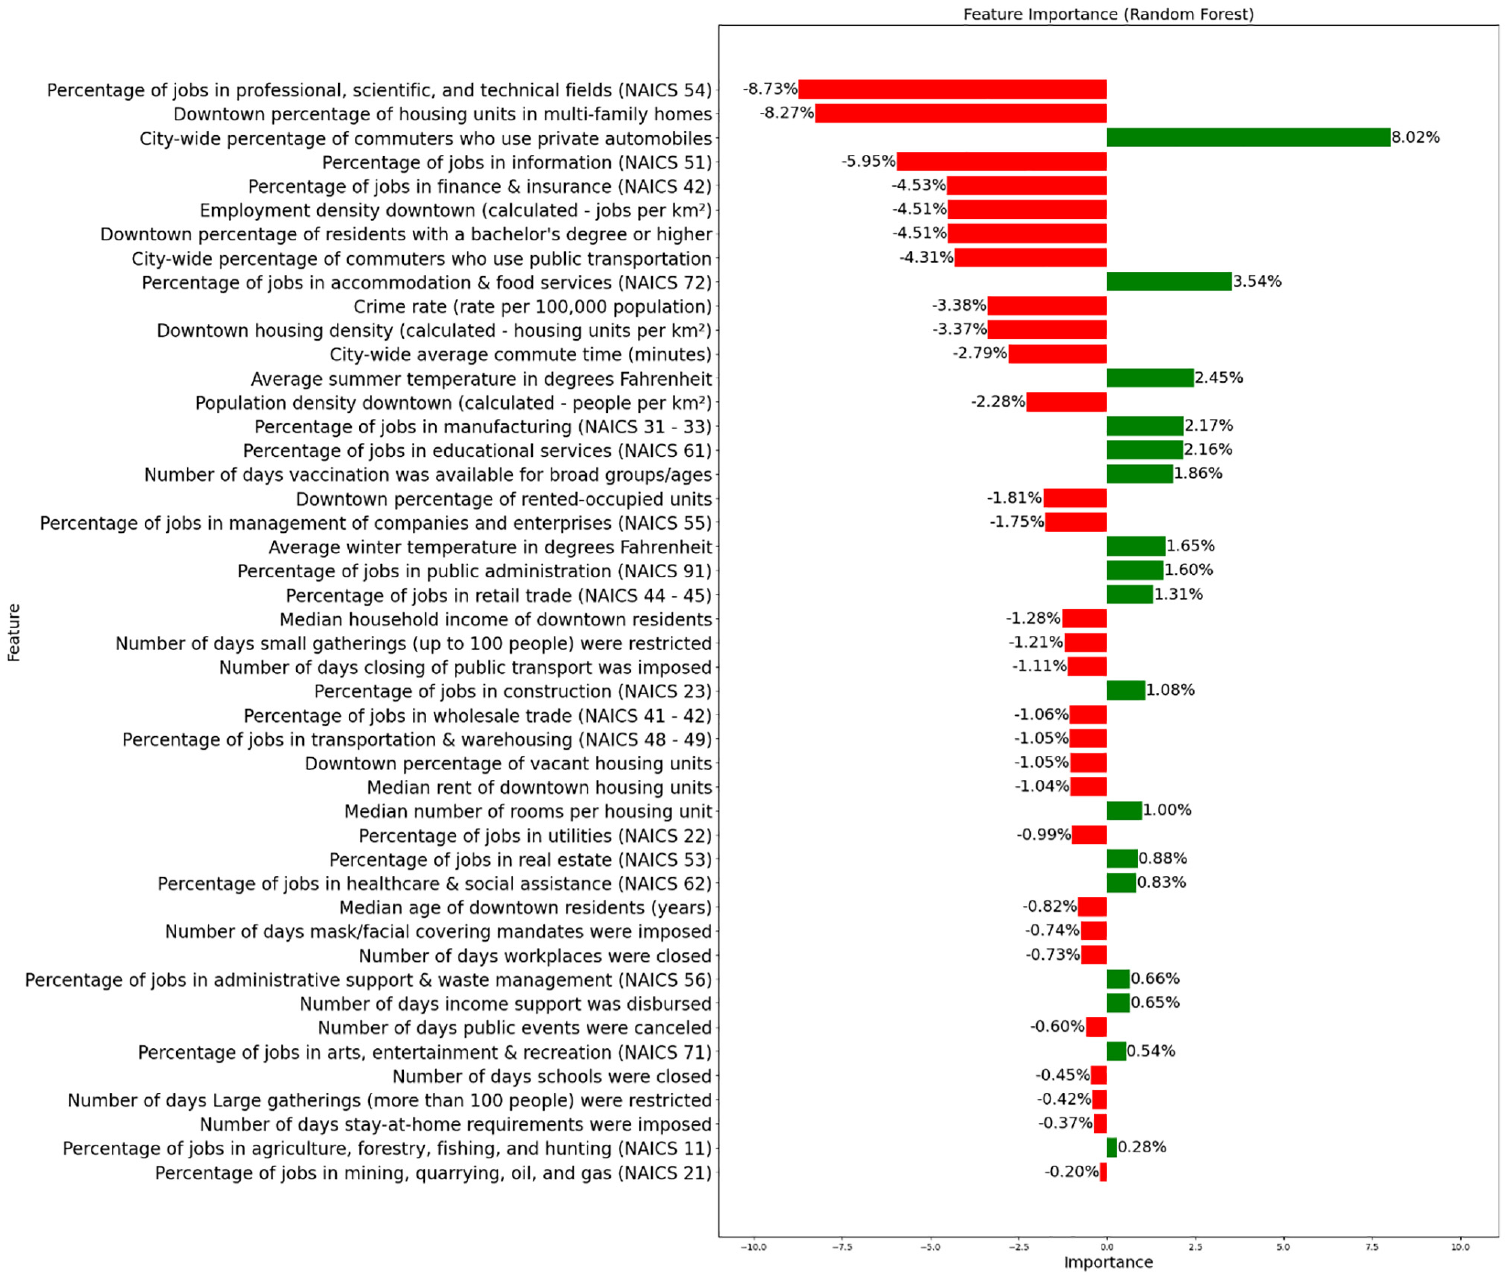
Most important explanatory variables and their direction of effect.
In general, the random forest analysis indicates that certain socio-economic, employment and environmental variables play pivotal roles in shaping the recovery process. Notably, the concentration of specific industries, multi-family housing, commuting variables, density and crime emerge as the most significant explanatory variables in explaining the recovery rates of downtown areas.
The random forest model reveals that a more robust downtown recovery is linked to a lower share of employment in professional, scientific and technical fields, information, finance and insurance, and management of companies and enterprises, as well as a lower percentage of downtown residents with a bachelor’s degree or higher. However, recovery rates are higher when there is a high share of employment in accommodation and food services, manufacturing, educational services, construction, retail and healthcare and social assistance.
Furthermore, environmental factors such as average summer temperatures exert a notable influence, suggesting the impact of climatic conditions on downtown recovery rates. Interestingly, while certain policy interventions like mask mandates, workplace closures and restrictions on public gatherings seem to have relatively lower impacts compared to structural and socio-economic determinants, the availability of COVID-19 vaccinations appears to be aiding downtown areas in bouncing back more rapidly. The following sections of the article explore the relationship between recovery and explanatory variables further.
Recovery association with employment by industry
The random forest feature importance analysis reveals that specific industries have a strong association with sustained or depressed visitation levels since the pandemic. The industry concentration of professional, scientific and technical fields (−8.73%), information including tech (−5.95%), finance and insurance (−4.53%) and management of companies and enterprises (−1.75%) negatively impacted downtown recovery rates. The downtowns with the highest concentrations of these four industries experienced the most significant depression in activity (around 53–70%). Not surprisingly, then, looking at the ranking of downtown recovery rates, Minneapolis, Seattle and San Francisco, with a disproportionate share of jobs in tech and management, are at the bottom (56%, 57% and 67% respectively). In contrast, downtowns with low concentrations in the aforementioned industries sustained levels of downtown visits around or above 80% of pre-pandemic levels throughout the pandemic. These industries, in fact, had the highest potential to implement remote work models, resulting in a decrease in employee foot traffic and a reduction in related activities such as business meetings or ancillary retail and services.
Alternatively, downtowns that nearly maintained their pre-pandemic levels of visits in 2023 typically exhibit a significant presence of industries such as accommodation and food services, manufacturing and educational services. These sectors accounted for almost 8% of the total predictive capability of the model. Other employment sectors such as public administration, retail trade and construction also exhibited positive impacts on downtown recovery, albeit to a moderate or lesser extent. Accordingly, Las Vegas, known for its entertainment, accommodation and food services, and Bakersfield, with a concentration of healthcare and administrative support, are ranked among the top downtowns, with recovery rates of 103% and 95%, respectively. Although there is no simple economic recipe behind recovery, these findings suggest that attracting these industries could help downtowns to recover. These industries typically involve interactive or manual work and rely on fixed equipment, making remote work or telework impractical for their employees. However, this positive association is not as strong as the negative association observed with information, finance and professional services. Understanding the employment dynamics within different industries can provide valuable insights for urban planners and policymakers to formulate targeted strategies to expedite downtown recovery post pandemic.
Recovery association with socio-economic and housing factors
Socio-economic and housing factors significantly influence downtown recovery, as indicated by the random forest analysis. Downtowns with a higher population and employment density tended to have slower recovery rates than those with low densities. In addition, the downtown percentage of housing units in multi-family homes and downtown housing density both negatively impact recovery (−8.27% and −3.37%, respectively), suggesting that areas with higher population and employment densities might experience slower recovery rates. For instance, New York and Chicago, with the highest population and employment densities, have only recovered by 66% and 61%, respectively. Moreover, the results showed that the median household income of downtown residents has a negative relationship (−1.28%) with the recovery rates. These trends could result from several possible causes – behavioural change induced by pandemic-era public health advisories against the visitation of crowded areas; outmigration by affluent downtown residents, that is, the ‘donut effect’; and/or new or reinforced preference for auto-orientated cities.
In addition, the results indicated a negative relationship between the median age of residents in downtown areas and recovery. Older populations generally face a higher risk of severe illness and complications from the virus. In contrast, downtowns with a younger median age have experienced a faster recovery, perhaps by reducing the strain on healthcare systems and allowing for a quicker return to normality. Furthermore, factors like the downtown percentage of residents with a bachelor’s degree or higher negatively impact recovery (−4.51%), which suggests that remote work by higher-skilled workers is likely taking place in residences outside of downtowns. Interestingly, downtowns with the lowest or average recovery rates were characterised by high median rents for housing units. Higher median rents in downtown areas can make housing less affordable for many individuals and families, leading to higher outmigration rates to find more affordable housing options. Understanding the interplay between socio-economic and housing factors is crucial for implementing targeted policies aimed at revitalising downtown areas and ensuring inclusive growth post COVID-19.
Recovery association with commuting factors, weather, crime and COVID-19 restrictions
Factors such as commuting patterns, weather conditions, crime rates and COVID-19 variables all play a role in downtown recovery dynamics, albeit with differing degrees of influence. The city-wide percentage of commuters who use private automobiles emerged as the most influential factor positively impacting recovery (8.02%), suggesting that workers were quicker to resume automobile commutes compared to public transit commutes. This pattern can be attributed to the perception of higher COVID-19 risk associated with public transportation and the reduction in public transit service levels during the pandemic (Gkiotsalitis and Cats, 2021; Sadik-Khan and Solomonow, 2020); of note, we find that the commuting mode shares of automobiles and public transportation exhibited an inverse relationship in recovery. This has raised concerns about the future of public transportation and the sustainability of travel and development patterns (Richter, 2022).
Additionally, downtowns characterised by harsher winter temperatures and longer commuting times exhibited weaker recovery than clusters with stronger recovery. These classifications align with studies indicating higher rates of snowbirding among the working population during the pandemic (Yale, 2021). Accordingly, most downtowns in the warmer regions of the United States (Southwest, Pacific or Southeast), such as Las Vegas, El Paso and Tucson, have recovered better than those in other regions with harsher winter temperatures, suggesting that pleasant weather helps attract visitors and shoppers downtown.
Pre-pandemic crime rate also has a considerable negative impact (−3.38%) on downtown recovery. High crime rates can create a perception of downtown areas being unsafe, deterring residents, visitors and businesses and resulting in reduced foot traffic, lower consumer spending and a decline in economic activity (Forouhar and Hasankhani, 2018).
Surprisingly, there is only a modest correlation between downtown recovery and most COVID-19 restrictions. The duration of restrictions on small gatherings (up to 100 people) exhibited the most significant negative correlation with recovery rates. Temporary constraints on gatherings, social events, cultural activities and tourism may have long-term impacts on the viability of downtown areas that heavily depend on these elements in both the business and entertainment sectors, as businesses have closed and customers have substituted other activities. The findings also reveal negative coefficients (albeit slight) linked to variables such as the duration of mask mandates (−0.74%) and workplace closures (−0.73%), indicating that prolonged periods of closures and restrictions correlate with slower downtown recovery, albeit with less pronounced impact. Nonetheless, a notable positive correlation emerges between the duration of broad group/age vaccination availability and recovery rates (1.86%), emphasising the crucial impact of vaccination campaigns in driving economic resurgence.
Discussion
This analysis reveals wide variation in downtown recovery rates across North America’s larger metropolitan areas, from 53% to 102%. In the absence of the pandemic, we would expect to see activity increase over the baseline, at least in growing cities. As the pandemic wanes and related restrictions cease, this wide variation in recovery rates suggests not only that North American downtowns are quite diverse but also that some are more resilient than others.
Why? Our analysis measures the recovery rates in the 2023 post-pandemic period in relation to 2019 levels, and then explores the factors that differentiate them. The downtowns that resumed levels of downtown visits around or above 80% of pre-pandemic levels share certain characteristics that are driving their recovery, and understanding these may help poor-performing downtowns to reattract activity. The majority of these factors are economic, and some structural changes, such as WFH and e-commerce, were well under way before the pandemic. When downtowns host a concentration of sectors where remote or hybrid work options are readily available, such as information, finance, professional services and management, they fare poorly. If instead they are characterised by industries such as accommodation and food services, manufacturing, educational services, construction, retail and healthcare and social assistance, the downtowns are more likely to thrive post pandemic.
Characteristics associated with urban form and demography matter as well, but not as much. Among these, density matters most: the higher the population, housing and/or employment density, the slower the recovery. During the pandemic, some planners argued that density per se does not matter but rather that overcrowding, or particularly high densities at a moment in time (Hamidi et al., 2020; Li et al., 2022), does; however, this finding suggests that, at least by revealed preference, people are reluctant to visit dense places. Related to density are two other deterrents: the presence of multi-family buildings and high commuting times, which also seem to hinder the comeback of downtowns. In general, lower-density, automobile-orientated downtowns have bounced back quickly, even surpassing pre-pandemic activity. With transit substantially below pre-pandemic levels, transit planners are adapting systems to new ridership patterns. Transit ridership recovery rates vary widely (with Canada outpacing the United States), suggesting that system viability may differ over the long term (APTA, 2023).
Finally, three demographic variables are significantly associated with less recovery activity, controlling for all else: high levels of education, older age and renter tenure. The first is likely related to the economic composition of downtown, that is, the concentration of sectors with high shares of remote work, and the resultant outmigration of high-skilled workers to more affordable residences in distant areas. The association of slow recovery with older adults and renters likely reflects the exodus of more vulnerable and/or mobile residents during the early pandemic.
Other than economic, urban form and demographic factors, three other variables are significantly associated with slowing recovery: high violent crime levels (measured before the pandemic), cooler weather in summer and winter and the number of days small gatherings were restricted during the pandemic. The first two factors reflect quality-of-life concerns with downtown environments, and the limitations on gatherings which were a temporary government response that may have had long-term repercussions. On the flip side, the length of time that COVID-19 vaccines were accessible to broad groups/ages has a considerable link with faster recovery rates. This underscores just how important vaccination efforts are in fuelling economic revival.
Recent studies view the COVID-19 crisis not just as a chance to ‘build back better’ but as an opportunity to move forward by constructing a more progressive, socially fair, regionally and locally balanced, sustainable and resilient future. Martin (2021: 144) calls for the discipline of regional studies to take advantage of a ‘transformative opportunity’ by ‘developing a credible view of resolving regional socio-economic inequalities’. Revitalising downtown areas post COVID-19 will demand change, supportive policies and digital advancement (Liu et al., 2022; Wahba, 2022). The success of this recovery will depend on the economic structure and environment of the downtown, with non-traditional industries potentially playing a key role (Leong et al., 2023). However, it is important to find a balance between bringing back the familiar ‘old normal’ and embracing the possibilities of a fresh ‘new normal’ in these areas (Sands et al., 2022). Hutson and Orlando (2023) believe that this will require balancing the ‘four Rs’– redevelopment, rezoning, reuse and resilience – and these strategies, in turn, will require policies and planning that overcome economic, legal and structural constraints.
Our data and analysis suffer from lack of data availability for certain key variables, including local land use and zoning, residential rents and homelessness, among others. Despite these challenges, given the robustness of our findings, we suspect that future research will identify similar overall patterns: divergent recovery rates driven by the composition of the downtown economy relative to the rise of remote and hybrid work.
Conclusion
This analysis presents the first attempt to measure how downtowns are faring after the pandemic, and what accounts for the variation in recovery rates. We find that economic variables matter most; when downtowns host concentrations of sectors with essential workers, they fare better than those dominated by industries that encourage hybrid or remote work. Other variables that matter are primarily related to housing, in particular high densities and the presence of multi-family housing, as well as historically high violent crime rates.
Although this analysis identifies multiple economic, demographic and other factors that make downtowns more resilient, these cannot be turned into a simple prescription to spur recovery downtown. Each downtown’s context is unique, and its recovery depends on local history and the core’s role in the region. Attracting more resilient sectors (accommodation and food services, manufacturing, educational services, retail, construction, arts, health and entertainment and recreation) downtown will not necessarily address decline if these are already successfully concentrated in other areas of the region, or if the workforce cannot easily commute downtown.
Shifting away from specialisation in information technology or financial services may negatively impact related businesses or services, or even the housing market. Addressing crime is important, but it is only one of the many quality-of-life factors that affect people’s willingness to go downtown.
It is unclear whether the aversion to dense, transit-orientated cities is a long-term shift or a temporary pandemic-induced pattern. History suggests the latter; in the long run, cities with extensive transit systems like New York or London have repeatedly rebounded from decline. But in the short term, cities face the daunting challenge of reattracting transit ridership and even stable residential populations.
The retail sector presents a similar challenge. Retail is undergoing a long-term transformation due to the rise of e-commerce and shifts in consumption from goods to services. With the exodus of many high-wage workers from downtown, the market is shifting. But it is not entirely clear yet what types of retail will be viable in the future.
While the transition to a mixed-use downtown seems to be the next phase of post-COVID-19 urban development, this transition is not set in stone. One key lesson from the pandemic is the wisdom of designing buildings and communities with adaptability in mind, ensuring they are not restricted to a single purpose.
The failure of many North American downtowns to recover quickly from the pandemic has serious implications for the financial viability of commercial real estate, the productivity of innovation sectors and ultimately the fiscal stability of cities as well. Even as we identify strategies to help our downtowns survive the next few years, we need to be prepared for future pandemic shocks. Future research should thus not only dive more deeply to identify the local contextual factors that drive recovery but also model different approaches to lockdowns and hybrid work that can make our downtowns more resilient next time.
Footnotes
Acknowledgements
The authors would like to acknowledge the data support from Spectus. Any opinions, findings, conclusions or recommendations expressed in this material are those of the authors and do not necessarily reflect the views of Spectus. We are also grateful to Michael Leong, Daniel Huang, Laura Schmahmann, Joy Wang and Neil Allavarpu for early research assistance on this project.
Declaration of conflicting interests
The author(s) declared no potential conflicts of interest with respect to the research, authorship, and/or publication of this article.
Funding
The author(s) received no financial support for the research, authorship, and/or publication of this article.