
Abstract
Previous research based on 2001 and 2011 census data indicated rising levels of residential segregation between socio-economic groups in many large city-regions in Europe as well as globally. Rising segregation is an important societal concern, as place of residence plays a crucial role in shaping access to urban opportunities. Residential isolation can be especially harmful for the most vulnerable groups. Income inequality was identified as the primary driver of this segregation. The current paper extends comparative research on residential segregation in Europe by incorporating the latest 2021 census and register-based data to determine whether segregation levels have continued to rise or have peaked, or whether there are signs of desegregation. It also examines how changes in segregation align with shifts in income inequality and occupational structures. A comparative analysis of 16 European capital city-regions shows a slowdown in the rise of segregation, with some city-regions transitioning from segregation to desegregation. These changes coincide with both a slowdown in the growth of income inequality and increased professionalisation of the workforce. The study suggests that future research should focus on the mechanisms driving residential desegregation in different urban contexts, with particular attention to the diversification of residential patterns among the expanding professional class.
Introduction
Residential segregation between higher and lower socio-economic groups rose in many large city-regions around the world during the decade between the 2001 and 2011 census rounds (Sarkar et al., 2024; Tammaru et al., 2016; van Ham et al., 2021). The key driving force behind this rise in segregation is the growth of income inequality (Isaacson and Rubinton, 2023; Musterd and Ostendorf, 1998; Reardon et al., 2018). However, there is no simple one-to-one relationship between inequality and segregation. According to the segregation paradox, levels of residential segregation may even decrease at times of growing income inequality as neighbourhoods gentrify, and lower-income neighbourhoods become (temporarily) more diverse in terms of their socio-economic composition (Sýkora, 2009). Also, as the adjustment of housing and neighbourhood situations of different socio-economic groups takes time, there is a time lag between changes in income inequality and changes in residential segregation (Tammaru et al., 2020; Wessel, 2022).
Characteristics of both housing and labour markets affect how inequality and segregation relate to each other (Haandrikman et al., 2023). Moreover, residential mobility patterns are also influenced by a broader set of opportunities available to people living in different urban neighbourhoods, including workplaces, schools, and leisure activity sites (Tammaru et al., 2021). These interconnected factors shaping residential mobility can, therefore, generate complex patterns of spatial inequality, with the location of homes playing a central role in shaping access to urban opportunities such as employment, education and other daily activities. As the housing affordability crisis looms in many large cities in Europe, lower-income people are increasingly priced out of more attractive neighbourhoods (Hochstenbach, 2024; Wetzstein, 2017) and vulnerable groups living in disadvantaged neighbourhoods tend to be spatially more isolated both from other groups and urban opportunities (Müürisepp et al., 2025). At the same time, cities around the world are inspired by the 15-minute city concept (Moreno et al., 2021). While the idea promotes equal access to services and jobs within a short distance, in cities with high residential segregation, it risks reinforcing spatial inequalities if access to quality amenities remains uneven across neighbourhoods – extending segregation beyond housing to schools, workplaces and leisure spaces.
High levels of residential segregation remain a pressing concern for cities, making it essential to understand recent changes in both the levels and spatial patterns of segregation using up-to-date data. The release of 2021 census data in many countries, combined with annually updated register-based data elsewhere, opens the opportunity to study whether the previously identified trend of increasing residential segregation between socio-economic groups in the 2001–2011 period has persisted in the next decade. Notably, recent evidence from the US suggests that levels of segregation have stabilised or even slightly decreased following the rise in the 2000s (see Hwang and McDaniel, 2022; Logan et al., 2020). Logan et al. (2020: 1952) emphasise the importance of this shift by stating that ‘[i]nstead of explaining how increasing inequality translates into greater residential separation, researchers now need to understand why it may not’; this underscores the need to examine whether a similar reversal of earlier trends can be observed in Europe. The trend towards desegregation may be temporary, as suggested by the segregation paradox which states that rising levels of inequality may initially lead to lower levels of segregation due to gentrification (Tammaru et al., 2016). Research from some European cities, such as Amsterdam, has shown that the increasing share of higher socio-economic groups and their search for housing in central urban spaces may lead to desegregation, as they spill over into formerly lower-income neighbourhoods during gentrification processes (Van Gent and Hochstenbach, 2020). While this may indicate a longer-term trend towards more socio-economically mixed neighbourhoods, such desegregation could also be temporary – especially in contexts like Amsterdam, where a relatively large social housing sector helps moderate these dynamics.
This paper offers a comparative analysis of socio-economic segregation – defined as the residential segregation of the economically active population by occupational status – across 16 large European city-regions over two decades. These cases represent different urban contexts, particularly concerning income inequality, labour and housing markets, as well as different historical and political-institutional development pathways. In this paper, research teams from 16 different European countries explore whether the earlier trend of increasing levels of segregation persists, or if, as in the US, there are signs of stabilisation or even desegregation. More specifically, the paper will address the following research questions for the 16 city-regions:
(1) How has the level of socio-economic segregation evolved over the two decades, from approximately 2000 to 2020? Has the increase in segregation continued, have segregation levels stabilised or can we observe signs of desegregation?
(2) How do the observed changes in residential segregation between socio-economic groups correspond to changes in occupational structures and levels of income inequality?
(3) Can we identify changes in the geographies of residential segregation of higher and lower socio-economic groups over the span of two decades?
To seek answers to these questions, we draw empirical evidence from the following case study city-regions: Amsterdam, Athens, Barcelona, Bratislava, Dublin, Helsinki, Lisbon, London, Oslo, Paris, Prague, Riga, Stockholm, Tallinn, Vilnius and Warsaw. All these cases are analysed by local research teams using a comparable research design. Before presenting the detailed methodology and findings, we will present the conceptual framework of the study on the link between income inequality and residential segregation among socio-economic groups, and how this link is mediated by the occupational structure of the labour market, and the spatial structures of the housing market. We acknowledge the role of factors such as ethnicity, age and gender, as well as political dynamics, immigration policies, and various other factors in shaping segregation, but a detailed analysis of how socio-economic segregation intersects with other important population characteristics is beyond this paper’s scope. Rather than analysing each contributing factor, our study focuses on the segregation patterns that emerge from these influences and how they evolve over time.
Framework for studying residential segregation between socio-economic groups
The spatial organisation of cities reflects and reproduces broader social hierarchies, as individuals are sorted into neighbourhoods based on personal characteristics and systemic factors and barriers (Maloutas and Fujita, 2012). Socio-economic status, measured through income, education and occupation, is considered as the key individual-level factor affecting the sorting of people into different residential neighbourhoods (Haandrikman et al., 2023). Socio-economic status also intersects with other characteristics such as ethnoracial belonging, immigration status, gender and age. For example, ‘eth-class’ segregation refers to a triple disadvantage, as low-income ethnic minorities concentrate in affordable housing areas (Andersson and Kährik, 2015). Vulnerable groups in disadvantaged neighbourhoods face barriers accessing urban opportunities, like employment, education and healthcare, making them a primary concern of residential segregation (Müürisepp et al., 2025). These residents are also disproportionately affected by global megatrends like climate change; for instance, heat-related risks impact vulnerable groups most in urban areas (Rodríguez et al., 2024).
The broader structural context – including city size and global position, welfare and political regimes, housing systems, labour markets and economic structures – varies across countries, influencing segregation levels and spatial patterns (Marcińczak et al., 2023). Large global cities tend to be more segregated than smaller ones (van Ham et al., 2021). Liberal welfare and market-based housing systems often intensify residential divides, while social-democratic regimes, combined with more regulated or redistributive housing systems, are more likely to counteract them (Tammaru et al., 2016). Likewise, migration and diversity policies affect the scale and nature of migrant inflows and can either reinforce or reduce discrimination and ethnic residential clustering, depending on migrants’ skill profiles (Skifter Andersen et al., 2016). These structural factors intersect with everyday experiences, as exclusionary practices – ranging from overt discrimination by employers and landlords to more subtle, place-based factors – shape how migrants and minorities perceive their sense of welcome and belonging in different neighbourhoods within the city (Krysan and Crowder, 2017).
Although segregation processes differ across city-regions, social tensions and housing-related unrest are increasingly visible in major cities worldwide (Hochstenbach et al., 2025; Kenyon et al., 2024). Thus, understanding the socio-economic dimension of residential segregation becomes critical. We address this by using a conceptual framework focused on income inequality and changes in the occupational structure in the production and reproduction of segregation (Figure 1). Previous research has shown that income inequality is the key factor shaping residential segregation between socio-economic groups (Haandrikman et al., 2023; Musterd and Ostendorf, 1998). After decades of decline, income inequality rose globally from the 1980s onwards (Piketty, 2013), alongside globalisation, economic liberalisation, marketisation, and deindustrialisation, which collectively reshaped social and spatial urban structures (Marcuse and Van Kempen, 2000). The increase in segregation followed with a time lag, as changes in the labour market take time to translate into transformations in the housing market and patterns of residential segregation (Tammaru et al., 2020).
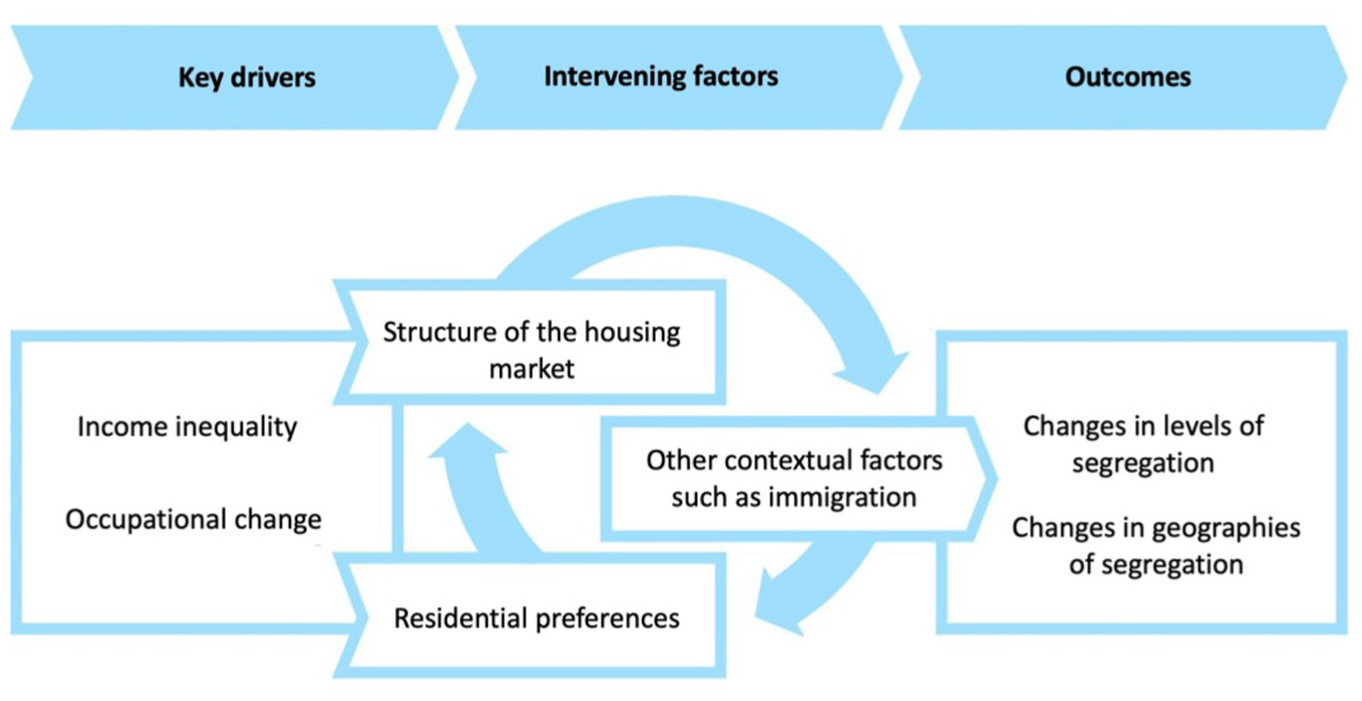
Conceptual framework for studying residential segregation between socio-economic groups (developed by the authors).
Segregation between occupational groups may also be shaped by the changes in the proportion of different occupational groups (Leal and Sorando, 2015). As the occupational composition in a city-region evolves along with changes in the labour market, it can significantly impact the levels and spatial patterns of residential segregation between socio-economic groups. This occurs for two main reasons: the socio-economic mobility of the existing population and the in-migration and out-migration of people with different occupational backgrounds (Figure 1). As large city-regions attract both domestic migrants and immigrants with varying skill levels, from highly paid professionals to lower-paid manual workers, this influx further shapes changes in their occupational composition. Based on her analysis of London, New York and Tokyo, Sassen (1991, 2001) argued that the combination of socio-economic mobility within the existing population and the in-migration of both highly-skilled and lower skilled migrants leads to increased polarisation of the occupational structure during the transition from an industrial to a post-industrial city. This polarisation is characterised by both the absolute and relative growth of jobs at the upper and lower ends of the occupational spectrum, and due to the contraction of the traditional urban middle class employed in manufacturing, as these jobs are relocated to lower-income countries. In its extreme form, the occupational structure change may also take the form of proletarianisation, which is characterised by the expansion of lower socio-economic groups rather than polarisation (Maloutas and Botton, 2021).
A series of works by Hamnett (1994, 2024; see also Manley and Johnston, 2014) on London challenge Sassen’s argument by presenting evidence that neither social polarisation nor proletarianisation might be a universal feature of occupational structure change in large urban areas. Instead, he suggests that professionalisation of the workforce is the main feature of post-industrial large cities, as the higher socio-economic groups grow more rapidly than the middle and bottom socio-economic groups shrink in size. Hamnett’s claims are supported by a series of comparative studies, which demonstrate a consistent trend of workforce professionalisation in large cities around the world, including New York, London and Tokyo (van Ham et al., 2020, 2021). However, the processes of professionalisation, polarisation, and proletarianisation may occur at a neighbourhood scale rather than at the urban region scale, leading to higher levels of residential segregation between socio-economic groups (Maloutas and Botton, 2021).
Higher income inequality alone is not sufficient for segregation to occur. Preferences for more attractive housing and neighbourhoods also play a role, as greater financial resources enable wider choice in the housing market (Hulchanski, 2010). In contrast, the residential mobility of lower socio-economic groups tends to be more constrained and reactive, often shaped by the residential sorting patterns of higher-income groups (DeLuca and Jang–Trettien, 2020; Hochstenbach et al., 2025). Existing research also shows that the higher socio-economic groups tend to be more residentially clustered compared to lower socio-economic groups (Haandrikman et al., 2023), especially in the inner city and low-density suburbs (van Ham et al., 2021). However, patterns of residential segregation may evolve in complex ways, as proposed by the segregation paradox (Sýkora, 2009; Tammaru et al., 2016). When higher socio-economic groups begin moving into inner-city neighbourhoods traditionally occupied by lower-income populations, levels of residential segregation may initially decline, followed by their rise along with the gradual displacement of lower socio-economic groups to the urban periphery (Hochstenbach and Musterd, 2018). The intensity and pace of this process are also city-specific, shaped by factors such as differences in the speed of professionalisation or the structural characteristics of local housing markets.
Many other city-specific factors further shape the levels and spatial patterns of segregation. Urban housing markets are among the most important among them (Hochstenbach et al., 2025; Torpan et al., 2024), influencing the opportunities for selective residential mobility of different socio-economic groups through the supply side of different types of housing in different parts of the city-regions (see Figure 1). Both the availability of high-end and affordable housing and whether these housing types are spatially clustered in certain parts of the urban areas or mixed across neighbourhoods shape the extent to which different occupational groups can segregate within the city-regions. Likewise, welfare regimes matter, and segregation levels tend to be the highest in liberal societies (Tammaru et al., 2016). According to the paradox of welfarism, however, high levels of segregation may evolve in social democratic welfare regimes, as exemplified by the finding that a sizeable social housing segment can produce highly segregated outcomes when spatially clustered (Friesenecker and Kazepov, 2021). Such clustering in the form of housing estates is common in Stockholm, but also in Paris and in many other large city-regions across Europe (Hess et al., 2018). Hence, in city-regions where high-end and affordable housing are spatially concentrated in separate neighbourhoods, segregation levels are likely to rise more rapidly than in city-regions where such housing types are more evenly dispersed – regardless of the broader welfare regime.
The extent, nature and regulation of new housing development projects are also crucial in shaping patterns of residential segregation. The prices of new-built homes tend to be higher than those of older housing stock, making them more accessible to higher socio-economic groups (Hess et al., 2018). When new housing construction is extensive, spatially clustered in certain parts of the city-region, and access to it is based on market principles, levels of residential segregation tend to grow rapidly, too (Leal and Sorando, 2015). This occurs due to the combined effect of higher socio-economic groups leaving other urban neighbourhoods, where the share of lower socio-economic groups increases, and moving to newly built neighbourhoods, where the residential over-representation of their group grows.
To conclude, while the mechanisms linking income inequality or occupational change to residential segregation between occupational groups may be similar, the way these mechanisms play out is city-specific, leading to variation in the levels of residential segregation between socio-economic groups in different city-regions (cf. Maloutas and Fujita, 2012). In this study, we examine changes in residential segregation between occupational groups and assess whether these changes are linked to broader transformations in income inequality and labour markets – specifically the processes of professionalisation, polarisation, and proletarianisation. By focusing on changes in segregation within each city over time, our analysis reduces sensitivity to cross-city differences in housing market structures. At the same time, we acknowledge that housing markets play a crucial role in shaping segregation patterns. We also recognise that occupational status intersects with other key personal characteristics – such as ethnicity, age, gender and migration background – which significantly contribute to the complex and multifaceted dynamics of segregation (see e.g. Consolazio et al., 2023; Sabater and Finney, 2023).
Findings from previous comparative studies of residential segregation betweensocio-economic groups
There have been few previous studies that, similar to this one, aimed to compare the levels and geographies of residential segregation between socio-economic groups and how these change over time, both in European city-regions and beyond. Musterd (2005) conducted a study on segregation in 16 European cities, using data from international projects carried out around the year 2000. The findings suggest that, overall, socio-economic segregation tends to be lower in European cities compared to American cities. However, the author emphasises the difficulties in comparing segregation levels due to the lack of harmonised data, stemming from variations in indicators and measurement units. Not surprisingly, many subsequent comparative studies have involved author collectives with local knowledge and access to relevant data. For instance, in their edited book, Maloutas and Fujita (2012) aimed to showcase the diverse urban experiences of residential segregation worldwide. They selected 11 cities, studied by local experts, to achieve geographical diversity and a range of urban contexts, although compatibility issues arose due to the lack of comparable data. The book’s key finding is that residential segregation varies significantly in the case study cities, with varying correlations to class inequality. Despite these differences, patterns of residential segregation in all 11 cities stayed relatively stable over three decades.
Another study, conducted by Marcińczak et al. (2015), used data from the 2000 census round to compare the levels and geographic patterns of socio-economic segregation in five European capital cities: Tallinn, Budapest, Vilnius, Warsaw and Prague. Their analysis involved assessing global levels of socio-economic segregation using traditional indexes and investigating the patterns of socio-economic residential intermixing and neighbourhood typology. The results revealed that despite growing income inequality, levels of residential segregation between socio-economic groups in these cities remained generally low. A more recent study by Haandrikman et al. (2023) compares patterns and levels of socio-economic segregation in another five European capital cities – Brussels, Copenhagen, Amsterdam, Oslo and Stockholm – employing highly harmonised geocoded indicators of poverty and affluence. The study used data from 2011 to produce comparable measures of socio-economic segregation at multiple scales. The analysis provides insights into residential segregation in these European capitals, with the main finding being that the level of segregation by affluence is significantly higher than that of segregation by poverty.
While the above-mentioned studies focused on single-year data without explicitly examining changes over time, the studies by Tammaru et al. (2016), van Ham et al. (2021) and Sarkar et al. (2024) placed a specific emphasis on changes in residential segregation over time. These three studies analysed data from two time points, examining changes in the levels and patterns of socio-economic segregation and exploring the links between income inequality and residential segregation, defining socio-economic status based on occupation, income, or education. Tammaru et al. (2016) investigated residential segregation in 13 European cities and their surrounding regions, including Amsterdam, Athens, Budapest, London, Madrid, Milan, Oslo, Prague, Riga, Stockholm, Tallinn, Vienna and Vilnius. They found a strong correlation between residential segregation and welfare regimes: cities in social democratic welfare states were generally less segregated, while cities in Eastern Europe with a socialist past experienced a shift from very low to higher levels of segregation, in line with rising income inequalities. The study also highlighted the role of various factors such as the spatial structure of housing markets and the intensity of immigration. Notably, high levels of immigration and the presence of extensive affordable suburban high-rise housing tended to increase segregation levels. A follow-up the study by Tammaru et al. (2020) based on Athens, Budapest, Helsinki, Madrid, Milan, Oslo, Stockholm and Tallinn further showed that changes in residential segregation follow changes in income inequality with a time-lag.
Building on this, van Ham et al. (2021) examined residential segregation in 24 large city-regions around the world – including major European cities like London and Paris – offering a truly global perspective. Similarly, Sarkar et al. (2024) analysed residential segregation in Australia’s five largest capital city-regions. These studies also showed that cities in the Global North had lower levels of segregation compared to those in the Global South in 2001; however, due to uneven rates of growth in both inequality and segregation, these differences diminished by the 2011 census round. Collectively, their results support the Global Segregation Thesis (proposed by van Ham et al., 2021), which suggests a worldwide trend of increasing levels of residential segregation between socio-economic groups. This trend of increased segregation was found to be accompanied by a shifting geography of residential segregation, where higher socio-economic groups cluster in city centres and desirable low-density suburban locations, while lower socio-economic groups are pushed to suburban areas with more affordable housing.
To conclude, previous comparative studies of residential segregation between socio-economic groups reveal increased socio-spatial inequality between higher and lower socio-economic groups across the observed cities and their regions. However, the levels of residential segregation between socio-economic groups vary significantly in European capital city-regions, being shaped by a range of factors, including (a) levels of income inequality and welfare regimes, (b) structures of the labour market and changes in occupational structure and (c) housing market systems, area-based policies and patterns of residential mobility shaped by individual preferences and constraints, as well as (d) dynamics of in-migration and out-migration shaping the population compositions of the city-regions. Most existing findings are based on the 2011 census round, and much has changed since then. In this study, we will shed new light on changes in residential segregation between occupational groups in European capital city-regions by extending the analysis to include data from the most recent, 2021 census round.
Methodological approach and challenges of comparative segregation research
This study examines socio-economic segregation in 16 large European city-regions over two decades, using census or register-based data from around 2001, 2011 and 2021, depending on data availability. Obtaining comparable data across multiple countries to study changes in segregation levels and geographies is challenging. We addressed this by engaging a collaborative team of researchers with local knowledge and data access in each city-region. Our aim was to include as many European capital regions as possible; however, data availability constraints limited the final sample to 16 cases across Europe. These include Amsterdam, Athens, Barcelona, Bratislava, Dublin, Helsinki, Lisbon, London, Oslo, Paris, Prague, Riga, Stockholm, Tallinn, Vilnius and Warsaw (Online Supplemental Appendix 2). Data for Dublin, Vilnius and Warsaw are incomplete, so these city-regions are excluded from some analyses. Still, the sample covers East, North, South and West Europe and represents different globalisation positions, welfare regimes, labour markets, income inequality contexts, and housing systems. London and Paris are the most globalised, while Tallinn and Vilnius are among the least. Furthermore, cities with a socialist past (Bratislava, Prague, Riga, Tallinn, Warsaw and Vilnius) differ considerably in size, globalisation position, and income inequality.
Conducting comparative studies involves methodological challenges such as varying spatial units, lack of standard segregation measures and issues related to spatial scale (Haandrikman et al., 2023). To address these challenges, each city was analysed by a local team with direct data access, using a unified methodology focused on changes in segregation over time (see Online Supplemental Appendix 1). City-regions were delineated either by the authors based on local expertise or following the OECD’s definition of functional urban areas, with both approaches covering areas with integrated housing and labour markets. The empirical analyses use small spatial units (hereafter referred to as neighbourhoods), predefined administrative subdivisions for planning purposes, usually census tracts or postal code areas, with a median population of 1700. Exceptions are Oslo (∼6000 inhabitants) and Lisbon (∼11,750), where units are larger, and Riga and Vilnius (∼600), where units are smaller. Because we focus on changes over time within individual city-regions, these differences in unit size do not undermine our main findings. Moreover, research by Marcińczak et al. (2023) shows that national context is the key factor explaining segregation differences across European cities. Still, the large units in Lisbon should be noted when interpreting results, especially given high micro-segregation levels typical in Southern Europe (Maloutas and Fujita, 2012).
In this study, residential segregation between socio-economic groups refers to their uneven distribution across neighbourhoods within a city-region. Groups are distinguished based on nine main International Standard Classification of Occupations (ISCO) occupational categories (except Amsterdam, where income was used), grouped into higher (managers and professionals), lower (elementary occupations, plant and machine operators, and assemblers), and middle (all other categories) groups. Our focus is on the working-age population’s residential segregation by recent occupational status, so vulnerable groups like ethnic minorities, unemployed, pensioners or lone parents are not fully captured. Notably, grouping ISCO categories into higher and lower occupational groups does not alter the main findings compared to comparing only extremes (managers versus elementary occupations). We use broader groups to avoid focusing on contracting or selective subgroups. Online Supplemental Appendix 2 presents segregation indices for all occupational pairings, confirming that broader groupings moderate segregation differences without changing overall patterns.
To ensure comparability with previous studies, we use the Dissimilarity Index (DI) – the most widely applied segregation measure (Brown and Chung, 2006; Duncan and Duncan, 1955; Massey and Denton, 1988). Ranging from 0 to 100, the DI indicates the share of a group that would need to relocate for an even distribution across neighbourhoods. A value of 0 reflects complete integration, and 100 reflects total segregation. While widely used, the DI has limitations due to its aspatial nature and dependence on how neighbourhoods are defined.
To add a spatial perspective, we use the location quotient (LQ) to measure local concentration of groups relative to the larger area, indicating over- or under-representation. The LQ maps visualise changes in residential clustering of higher and lower occupational groups across two decades. Notably, our focus is on residential locations, not job distribution. Finally, we examine whether changes in income inequality (Gini Index), correspond with the changes in residential segregation (DI), lagging the two indices, as segregation typically follows inequality (Tammaru et al., 2020; Wessel, 2022).
Our study has limitations. First, our framework (see Figure 1) focuses on income inequality and occupational change as key drivers of segregation, but other factors – housing market, immigration, and other contextual differences – also influence segregation; we do not analyse these factors directly, but address them in the discussion of the findings. Second, we use occupational groups rather than income data (which is used only in Amsterdam) to examine socio-economic segregation, as income data is often unavailable for large international and longitudinal comparisons. Occupational groups, standardised across censuses and registers, generally align with income levels despite some within-group variation (see Tammaru et al., 2016). A study by Mysíková and Večerník (2018) in Austria, Czechia and Poland found that occupation type accounts for the largest share of earnings inequality. These standard classifications of occupational groups also reflect class belonging and represent the main structures of socio-economic positions in society (Erikson and Goldthorpe, 1992). Therefore, occupational groups are commonly used in cross-country and longitudinal studies on socio-economic segregation (e.g. Hamnett, 2024; van Ham et al., 2020). Third, differences in spatial units pose challenges too, including the Modifiable Areal Unit Problem (MAUP), where segregation measures can vary depending on the scale of aggregation and the configuration of the spatial boundaries. We use the smallest units available that are consistent over time to track intra-city change. Since the DI is aspatial and does not account for spatial relationships, future studies could apply spatial autocorrelation methods, such as Moran’s I, LISA or k-nearest neighbour approaches, to better capture clustering and scale effects (see also Elbers, 2023, for a decomposition method that addresses margin dependency and unit appearance/disappearance in temporal and spatial comparisons, enabling attribution of segregation changes to individual units like census tracts). In this study, we use LQ maps to provide initial spatial insights into segregation patterns.
As a final limitation, we measure income inequality using the national-level Gini Index since income data is not available at the city-region level. 1 However, urban and national Gini values strongly correlate, with larger city-regions usually showing higher inequality (Comandon and Veneri, 2021; Maloutas and Fujita, 2012). Since this study focuses on changes in income inequality rather than levels, using the country-level Gini index is less problematic. Additionally, the nature of segregation varies within and between city-regions, reflecting complexity. Our approach has limitations, and caution is needed when interpreting findings. We ensured comparability across city-regions by using consistent data and identical calculations in each city, allowing us to reliably track whether segregation is rising or shifting towards desegregation over time.
Results
Changes in the occupational structure
We begin our analysis by examining changes in the occupational structure within and between European city-regions to identify whether there are any shifts in each of them towards professionalisation, polarisation or proletarianisation. Figure 2, which illustrates the occupational structure and its evolution, shows that the higher occupational group has consistently expanded over the 20-year period in all investigated European city-regions, although the extent of this growth varies across cases. The most significant increases in the proportion of this group during these two decades are observed in Warsaw, Prague and Bratislava. Notably, the higher occupational group has become the largest in Vilnius (52%) and Warsaw (50%). Simultaneously, the proportion of the middle group has declined in all city-regions, although this group remains the most prevalent in labour markets, comprising 40–60% of the workforce in most of the studied capital city-regions. The share of the lower occupational group is the smallest in all city-regions, and its size has either been stable or has slightly decreased.
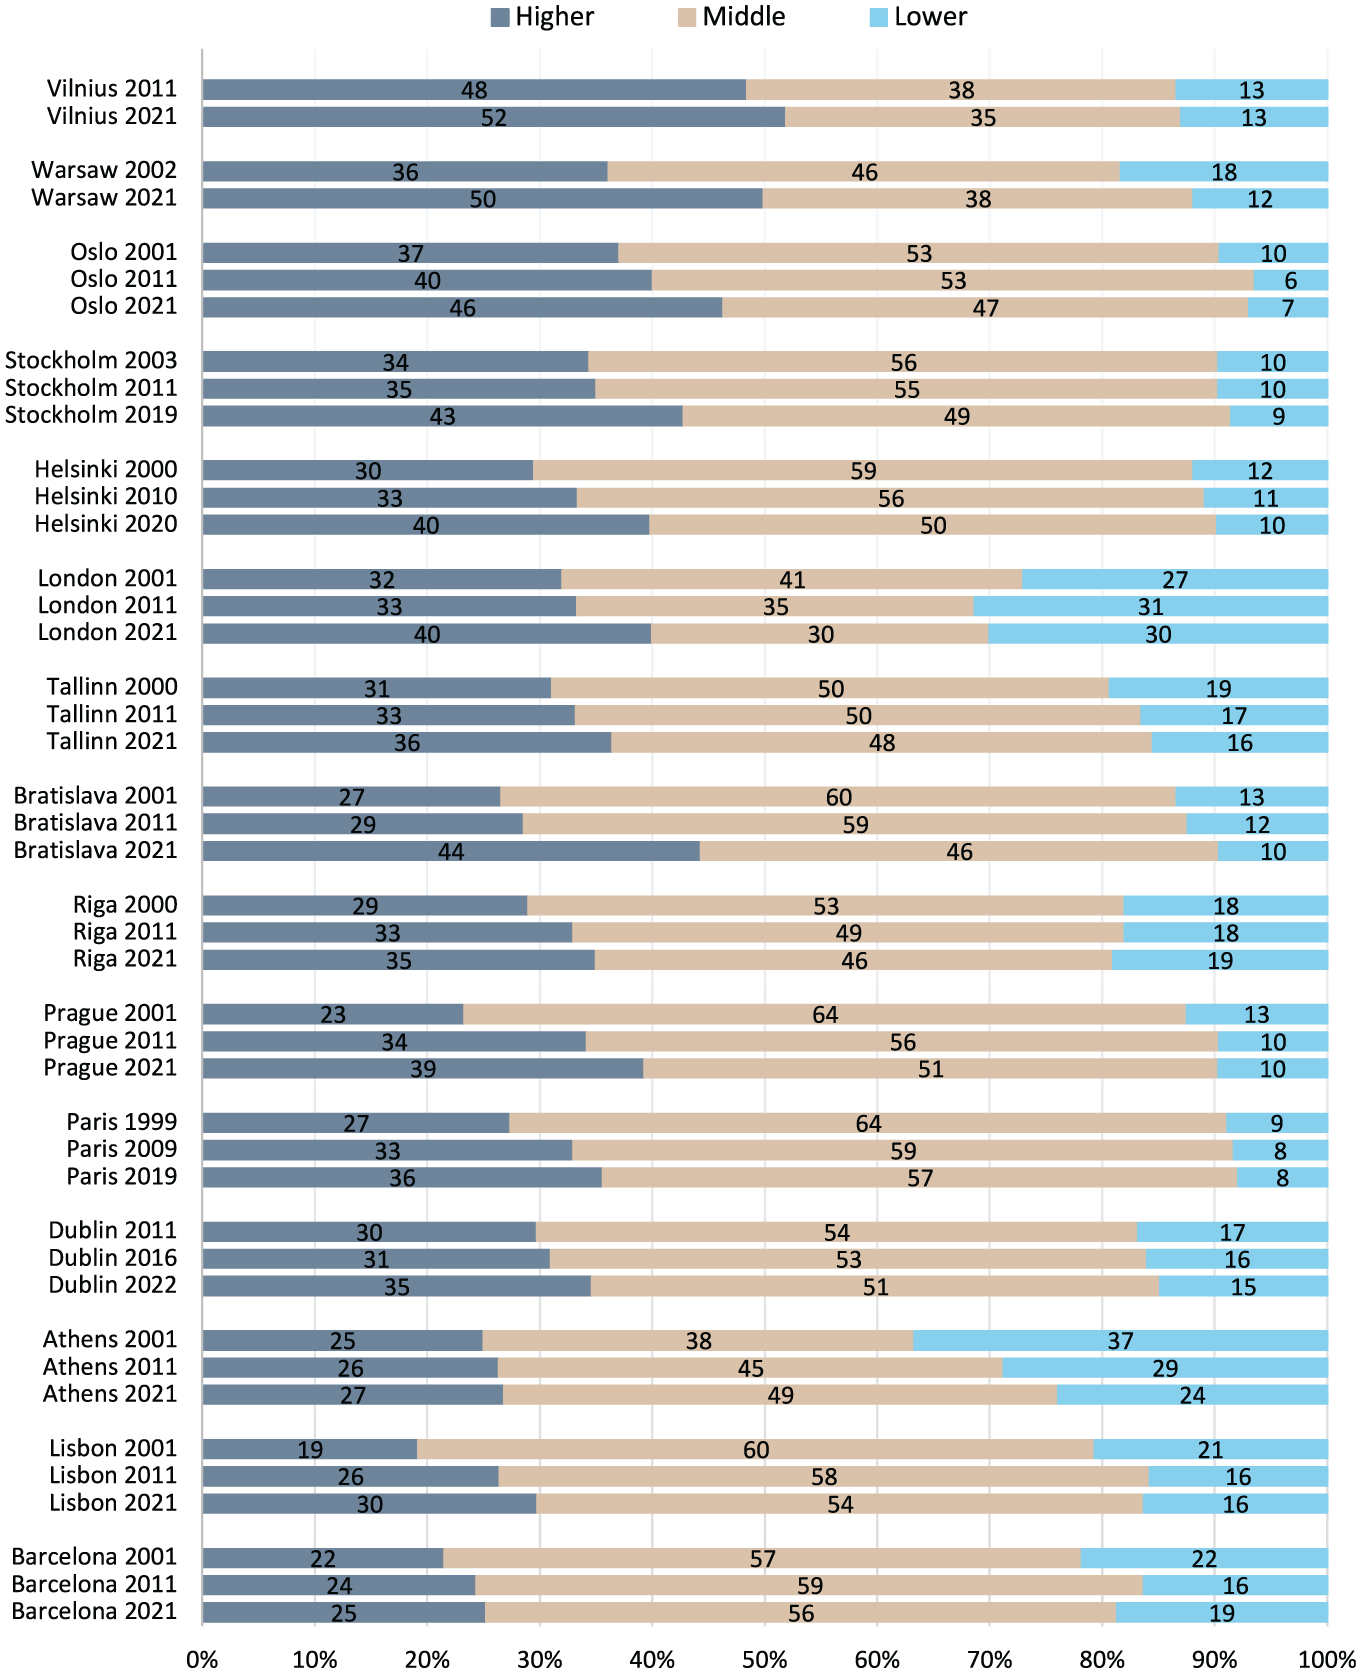
Occupational structure in the case study city-regions.
The observed changes indicate a clear trend of professionalisation across all case studies between 2001 and 2021, which contrasts the original social polarisation thesis by Sassen (1991), being in line with findings by Hamnett (1994, 2024) and van Ham et al. (2020, 2021). Cities in Eastern and Northern Europe have undergone more intense professionalisation compared to Southern and Western Europe. Eastern European countries may have benefitted from the EU accession around 2004, that initially brought along emigration and East–West brain-drain but may yield longer-term benefits for their urban economies. However, it must be noted that there is considerable variation in the pace and extent of this process across different city-regions, which needs closer examination in future studies. For example, the decline in lower occupational groups within major city-regions may be due to these groups being priced out of urban housing markets, resulting in increasingly longer commuting distances.
Changes in the levels of residential segregation
Table 1 presents the values of the dissimilarity indices (DI) between higher and lower occupational groups, as well as the DI between other pairs of occupational groups. We find that segregation levels tend to be higher in older EU member states with larger immigrant populations. Based on the DI values between higher and lower occupational groups, the most segregated European capital city-regions are Paris and Stockholm, where DI values exceed 50. There are marked differences exist between the case studies. Most notably, segregation levels in London are significantly lower than in Paris and Stockholm. This may reflect several factors. For instance, Great Britain has long attracted substantial flows of professional labour migrants, while Sweden and France have pursued more open refugee policies. The spatial structure of housing markets may also play an important role. Both Paris and Stockholm are also characterised by homogeneous areas of affordable housing in suburbs. To illustrate, in Stockholm, the legacy of the Million Homes Programme – a large-scale public housing initiative launched in the 1960s in the suburbs – has significantly shaped residential segregation, as the most vulnerable population groups increasingly cluster in those residential areas. This spatial pattern has been amplified by large-scale immigration since the 1990s, resulting in ‘eth-class’ segregation, as minority groups in lower occupational categories are overrepresented in areas with affordable housing (Andersson and Kährik, 2015). Similarly, in Paris, historical urban planning decisions and the concentration of large-scale social housing developments in the suburbs have contributed to persistent spatial segregation (Lelévrier and Melic, 2018).
Indices of dissimilarity (multiplied by 100) between occupational groups in 2001, 2011 and 2021 (authors’ calculations).
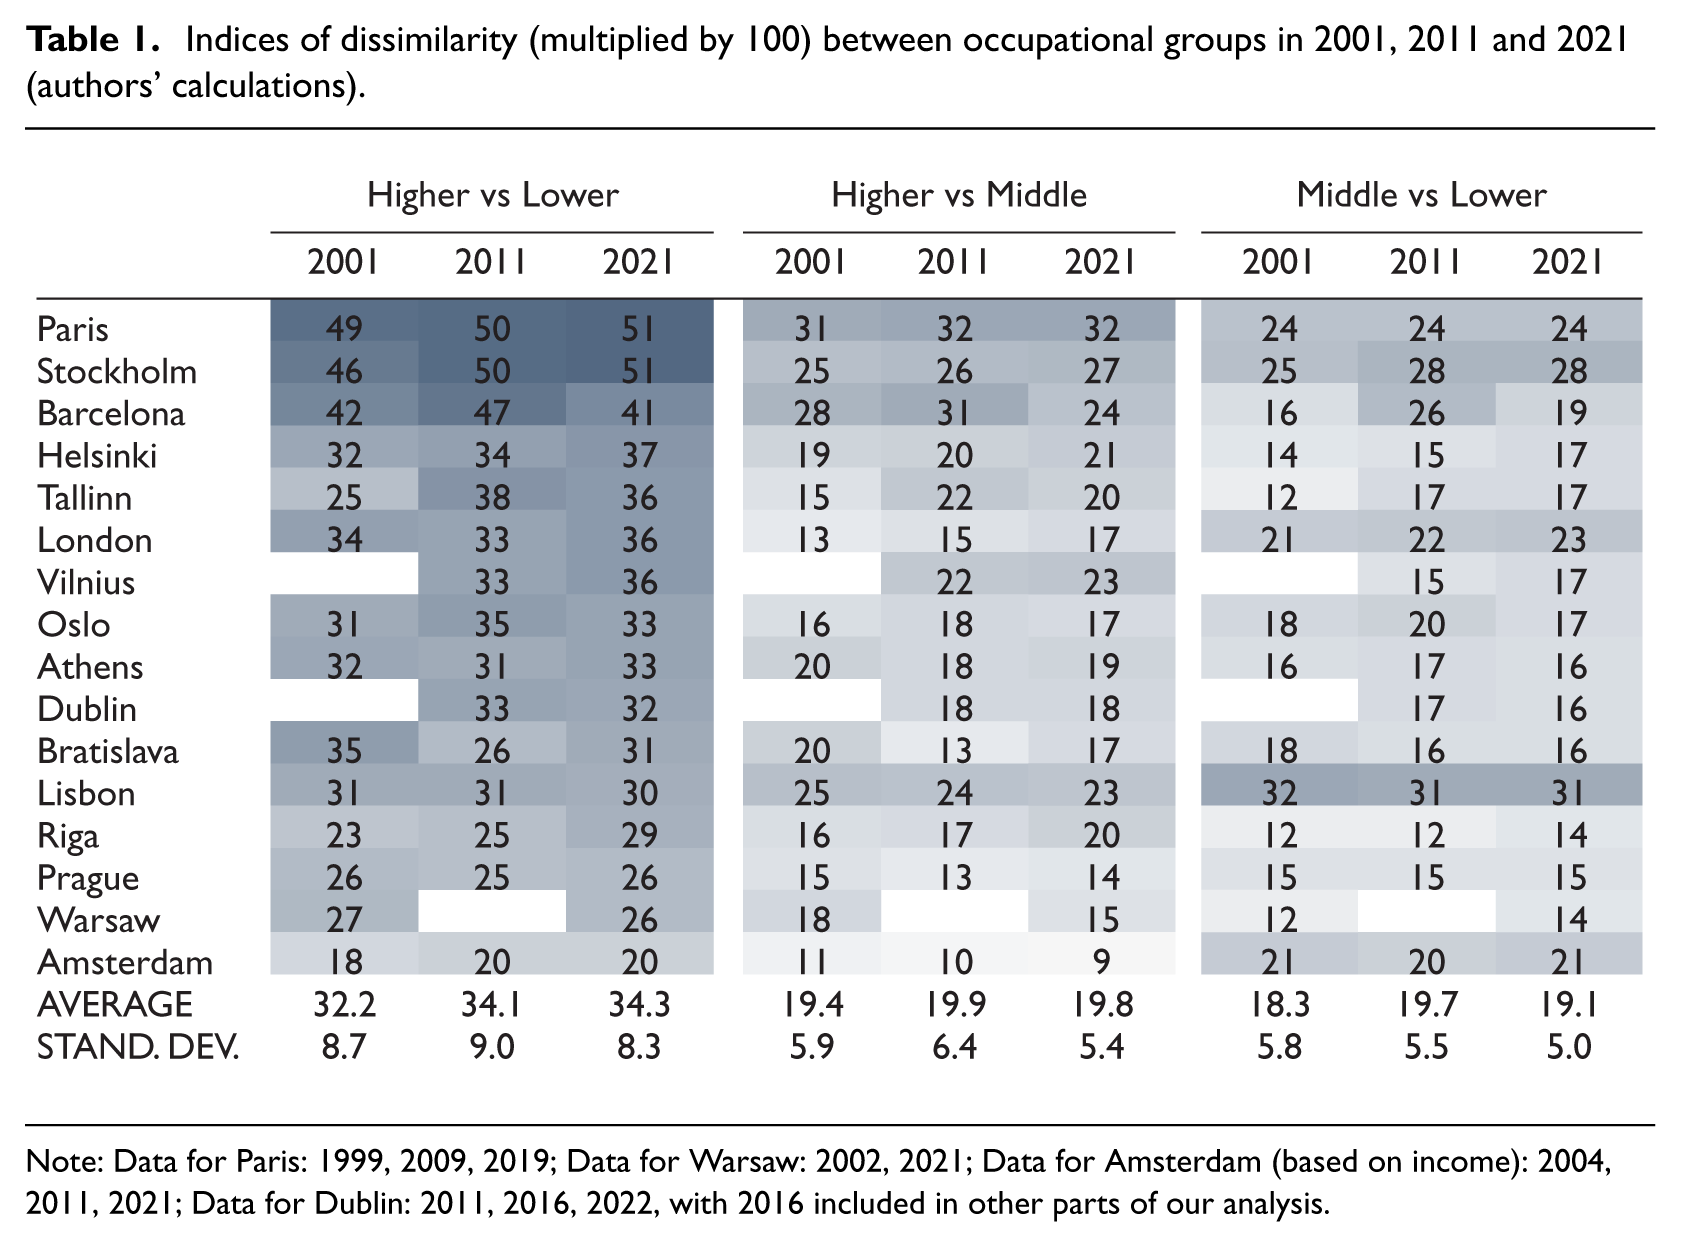
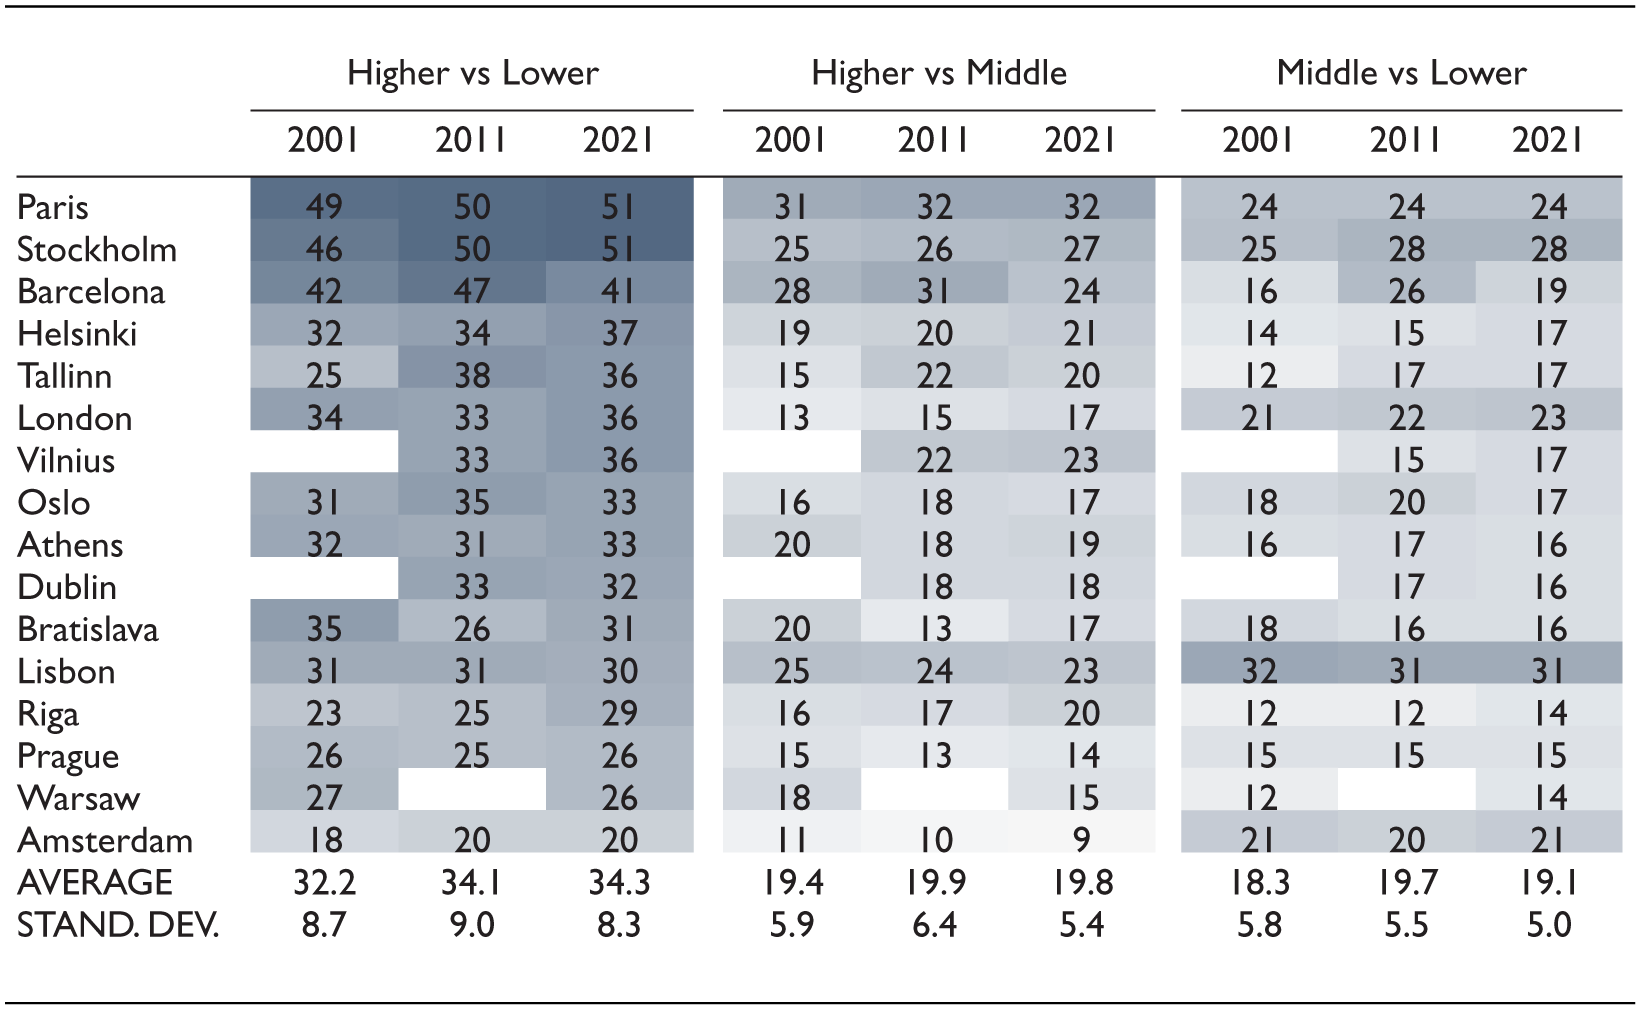
Note: Data for Paris: 1999, 2009, 2019; Data for Warsaw: 2002, 2021; Data for Amsterdam (based on income): 2004, 2011, 2021; Data for Dublin: 2011, 2016, 2022, with 2016 included in other parts of our analysis.
Many capital regions of the newer EU member states with a socialist past – such as Prague and Warsaw – are among the least segregated in our sample of studied city-regions. However, important differences exist within this group, too. Notably, the Tallinn city-region stands out as one of the most segregated, raising important questions about why segregation dynamics have diverged so markedly across these post-socialist urban contexts. Several plausible explanations can be considered that need to be tested in future research. For instance, Tallinn lifted rent controls on restituted housing earlier than Prague, allowing for greater residential mobility in the years following the fall of the Berlin Wall in 1989 and the collapse of the Soviet Union in 1991. In addition, Estonia experienced particularly dynamic economic growth in the 2000s, in a context where a sizeable share of the Russian-speaking minority left the city after independence was regained in Estonia in 1991. As a result, Tallinn’s housing market offered greater flexibility and opportunities for residential differentiation compared to Prague where no such vacancy changes emerged (Kährik et al., 2016; Kalm et al., 2023). Combined with the faster pace of economic restructuring, these conditions may explain why segregation in Tallinn began to increase earlier than in the other Baltic capitals, such as Riga and Vilnius. Finally, the Southern European city-regions in the study – Barcelona and Lisbon – also show varying levels of segregation, with lower levels observed in Lisbon than in Barcelona. Southern European cities tend to have high levels of micro-segregation (Marcińczak et al., 2023), but the exception of Lisbon can partly be explained by the larger neighbourhood units used in the analysis.
Our main focus, however, is on changes in segregation levels within each city-region over time. We find that, collectively, the level of residential segregation between higher and lower occupational groups increased, with the average DI value across all city-regions rising from 32.2 in 2001 to 34.1 in 2011 to 34.3 in 2021. Additionally, segregation levels between higher and middle, as well as middle and lower occupational groups, also showed slight increases over the two decades. 2
We further find that, taken collectively, differences in the levels of segregation narrowed between higher and lower occupational groups from 2001 to 2021 in the studied city-regions. The average standard deviation of the DI values rose from 8.7 in 2001 to 9.0 in 2011, and decreased to 8.3 by 2021. This indicates that a shift towards convergence in the levels of segregation between the studied city-regions has occurred since cities that were previously comparatively less segregated have seen a rise in segregation between the last two census rounds. More specifically, we find that differences between higher and lower occupational groups increased by two percentage points or more in Bratislava, Helsinki, London, Riga, and Vilnius. In Amsterdam, Dublin, Lisbon, Prague, Paris and Stockholm, only marginal changes, slight increases in either segregation or desegregation, were observed. In Barcelona, Tallinn and Oslo, the rise in segregation during the 2000s was followed by a shift towards desegregation in the 2010s. The analysis of the changes in segregation levels thus reveals that the period around the 2011 census seems to mark a turning point in a trend, as the previously observed increase in segregation is no longer predominant across the studied city-regions. Overall, the growth in segregation levels has slowed down, with most city-regions not experiencing significant changes, and some of them transitioning from segregation to desegregation.
Relationship between income inequality and residential segregation
One reason why professionalisation and segregation are not strongly linked, and why we observed diverse trajectories of change in residential segregation levels, could be related to differences in how income inequalities between occupational groups have evolved. If these changes are small, they may not necessarily lead to significant shifts in the housing market. Conversely, bigger changes in the levels of income inequality between occupational groups may result in bigger changes in residential segregation. Previous research further shows that the relationship between changes in income inequality and residential segregation involves a time lag, as it takes time for people to adjust their housing situation in response to new financial opportunities or constraints (Musterd et al., 2017; Tammaru et al., 2020; van Ham et al., 2021; Wessel, 2022). Therefore, we use Gini Index values since 1991 in our analysis.
Figure 3 summarises the changes in the Gini Index. The index partly reflects the welfare regimes in Europe, being lower in the social democratic societies represented by the Nordic countries and higher in liberal post-socialist societies such as Latvia and Lithuania. Income inequality increased across Europe in the 1990s or at the beginning of the study period, followed by a slowdown or reversal of this trend towards the end of the period. Continued professionalisation in the labour market in the 2010s has thus taken place alongside a narrowing of income inequality between occupational groups. This implies that the underlying changes in the structures of income inequality broadly support the observed slowdown in the growth of residential segregation or even a shift towards desegregation. However, in addition to this major trend, there is also considerable diversity in the way income inequality has changed across different cases studied.
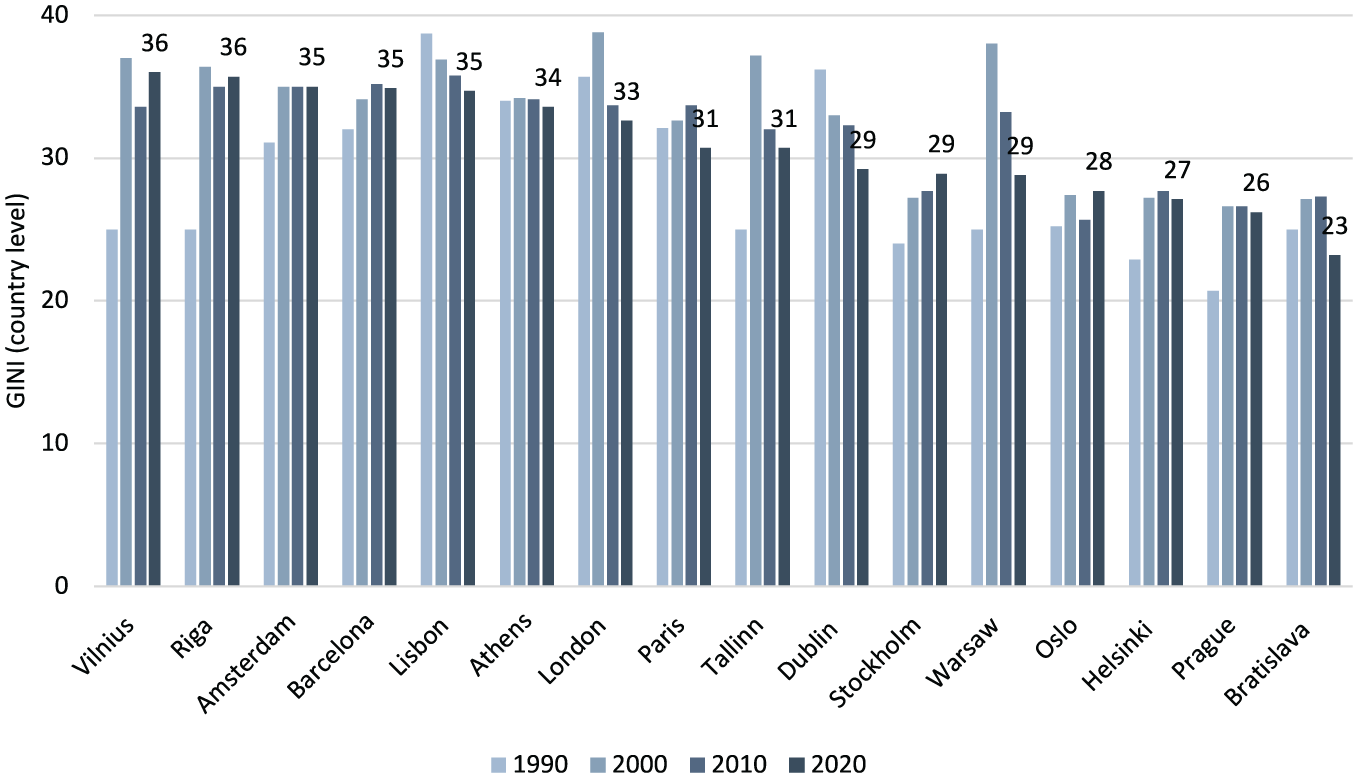
Income inequality (Gini Index) in the countries of the case study city-regions, 1990–2020.
Next, we analyse the relationship between income inequality and residential segregation between higher and lower occupational groups in 14 city-regions with data available for three time points. 3 We lag the Gini Index (measured in 1991, 2001, 2011) relative to the Dissimilarity Index (2001, 2011, 2021) and present changes in both, setting baselines to 1991 for the Gini Index and 2001 for the Dissimilarity Index. We seek to determine whether (a) changes in residential segregation follow changes in income inequality 10 years earlier, indicating correspondence between them, or (b) a segregation paradox exists, where changes in residential segregation do not align with changes in income inequality from an earlier decade. Figure 4 provides visual evidence: if the two lines move in the same direction, it suggests changes in residential segregation correspond with changes in income inequality 10 years earlier. Conversely, if the lines move in different directions, it indicates a segregation paradox where changes in residential segregation do not correspond to changes in income inequality 10 years earlier.
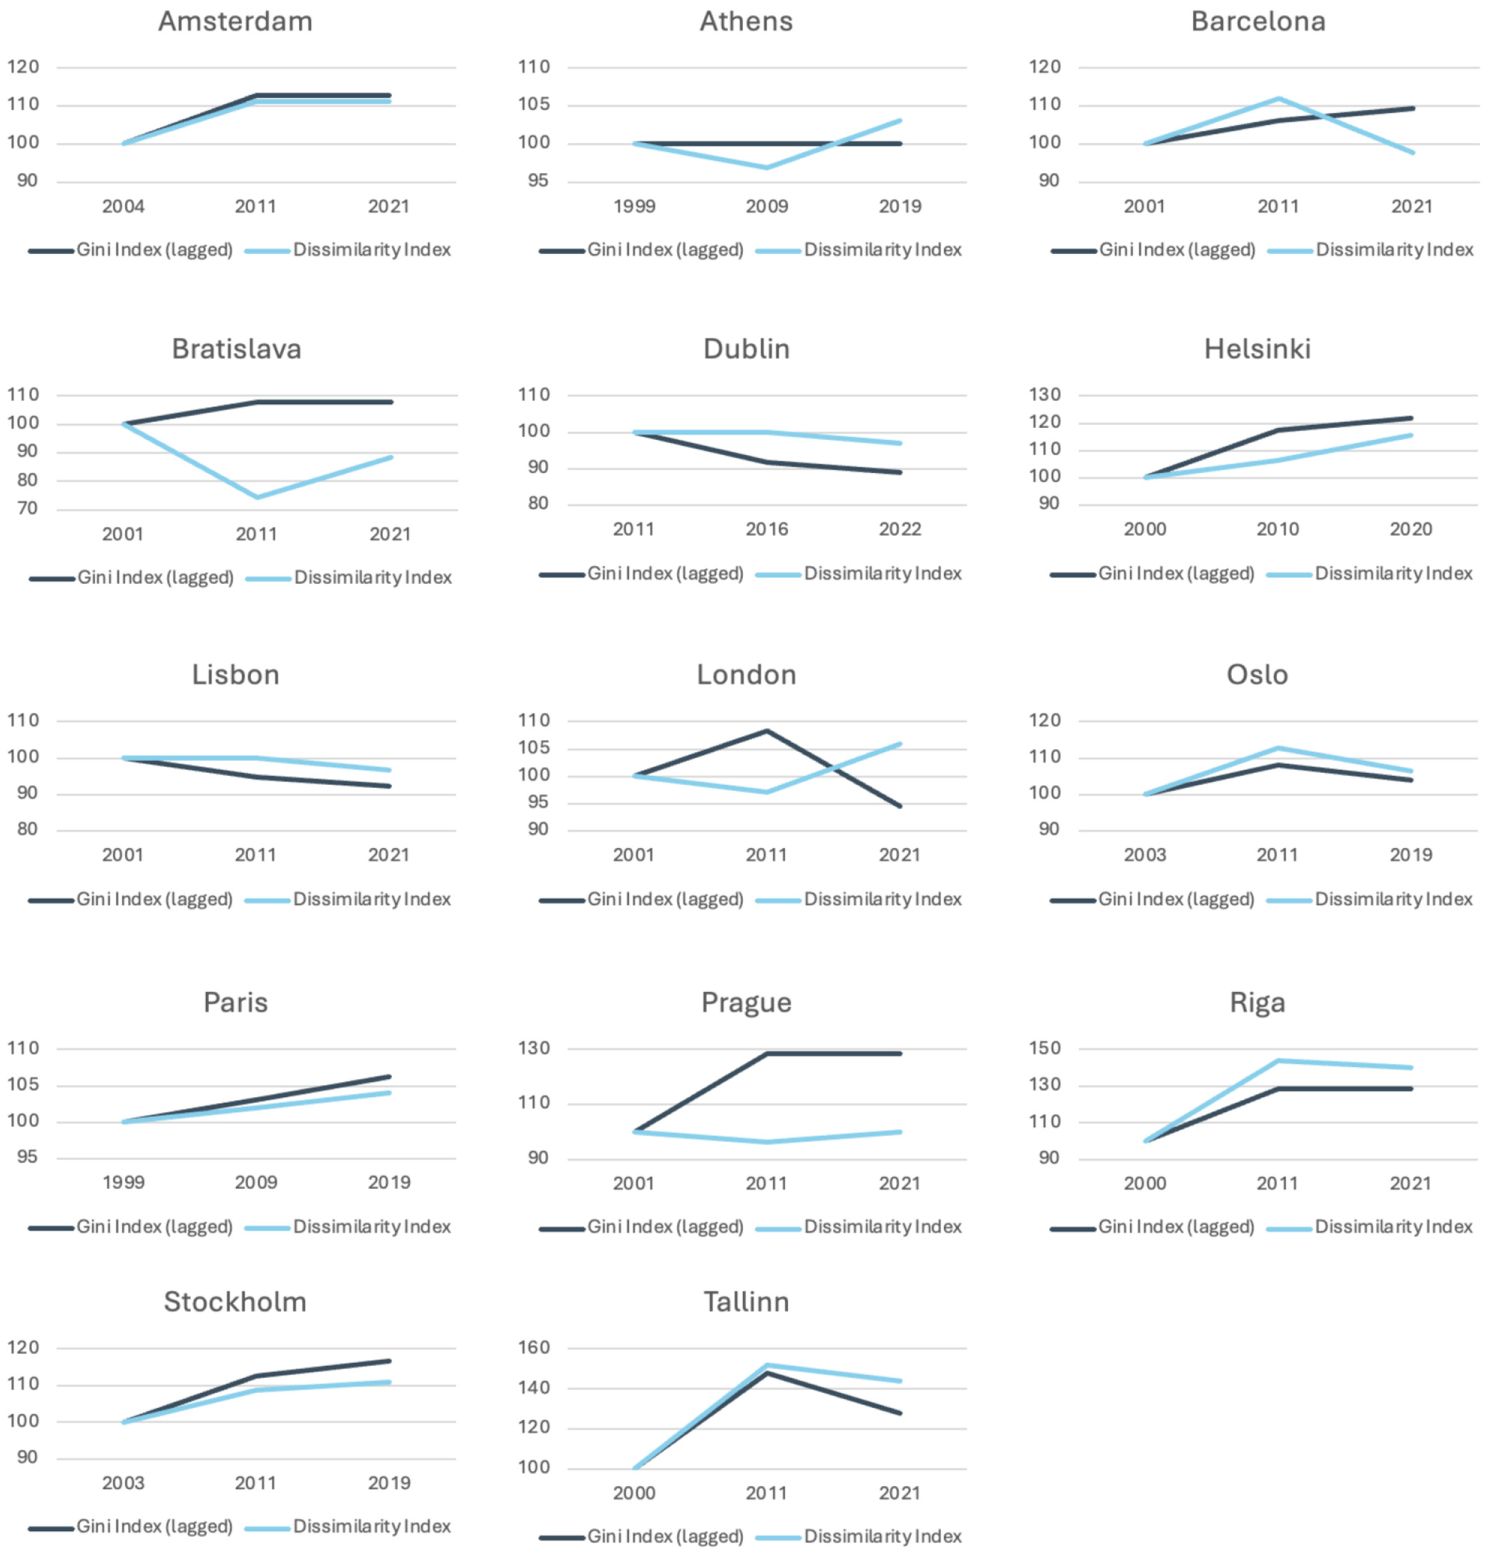
The relationship between the Gini Index (measured in most cases in 1991, 2001, and 2011) and the Dissimilarity Index between higher and lower occupational groups (measured in most cases in 2001, 2011, and 2021), with the Gini Index in 1991 and the Dissimilarity Index in 2001 set to 100%.
The findings show that in nine city-regions (Amsterdam, Dublin, Helsinki, Lisbon, Oslo, Paris, Riga, Stockholm, and Tallinn), changes in income inequality correspond with subsequent changes in residential segregation between socio-economic groups 10 years later. This group includes city-regions characterised by both higher (e.g. Paris and Tallinn) and lower (e.g. Helsinki and Oslo) levels of inequality. However, a stronger convergence emerges either when changes in income inequality are consistent over a longer period, as observed in the Nordic capitals where the Gini Index has been steadily rising, or where the change in income inequality is very pronounced, as in Tallinn. In the five remaining city-regions, various combinations of changes in income inequality and segregation can be observed. These findings align with the segregation paradox, but they also demonstrate that this paradox can take various context-specific forms, occurring in city-regions with both higher (e.g. Barcelona and London) and lower (e.g. Bratislava and Prague) levels of inequality. The duration of the relationship between changes in income inequality and segregation may also vary across different city-regions, depending on context-specific factors such as the characteristics of their housing and labour markets, as well as social protection arrangements (Wessel, 2015).
Spatial patterns of residential segregation
While changes in income inequality and levels of residential segregation combine in various ways, the underlying geography of segregation has remained largely unchanged across all studied cases, as revealed by the location quotient maps (included in Online Supplemental Appendix 2). By 2001, a clear concentric pattern had emerged in all analysed European capitals, which persisted and, in some cases, only slightly intensified by 2021. The defining features of this concentric pattern are (1) the overrepresentation of higher occupational groups in the central parts of the cities, with their presence sharply declining as the distance from the city centre increases, (2) the overrepresentation of lower occupational groups in neighbourhoods located further away from the centre and (3) a higher residential concentration of higher occupational groups compared to lower occupational groups.
In other words, despite using small spatial units as the main units for analysing the geographies of segregation, the LQ maps suggest high levels of spatial clustering of different occupational groups that largely follow the centrality dimension and related spatial structure of the housing markets. The over-representation of higher occupational groups in inner cities reflects the central role of gentrification – a decades-long process that has been a key driver of rising housing prices, alongside other contributing factors such as the expansion of short-term rental markets. The overrepresentation of higher occupational groups in the city centre is especially pronounced in the Nordic capitals of Helsinki, Stockholm and Oslo.
The over-representation of lower occupational groups outside the inner cities reflects their adaptation to the realities of metropolitan housing markets, where affordable housing is increasingly found on the urban fringes. This is notable in Bratislava, Lisbon and Vilnius. However, in several city-regions – Amsterdam, Barcelona, Prague, Tallinn, and Warsaw – we also observe a slight increase in the residential concentration of higher occupational groups in suburban neighbourhoods farther from the city centre. In Prague, this trend appears to be particularly extensive. The segregation paradox observed in inner cities may thus now be extending into suburban areas, signalling a potential new trend in which ongoing professionalisation reshapes the socio-spatial dynamics of the suburbs – particularly as residential space in inner-city areas becomes increasingly saturated. Finally, the geography of segregation in Athens is quite exceptional. Rather than following a concentric pattern of other European capitals, Athens is characterised by an over-concentration of higher occupational groups in the east and lower occupational groups in the west.
More pronounced shifts in the geography of segregation have occurred in the city-regions of the new member states of the European Union, notably in Bratislava, Prague and Riga, where higher occupational groups have increasingly concentrated in both the city centre and the inner suburbs. These shifts can be explained as delayed gentrification and suburbanisation of affluent households (cf. Sýkora and Stanilov, 2014). In many older member states of the European Union, suburbanisation is increasingly associated with the outpricing of less affluent households from the inner-city housing markets.
Discussion of the main findings
This paper sought, above all else, to provide a comprehensive understanding of how socio-economic segregation has evolved in the analysed European capital city-regions over recent decades. Previous studies based on the 2001 and 2011 data reported rising socio-economic segregation in Europe (Tammaru et al., 2016). Our first research question asked whether this trend continued or if a shift towards desegregation occurred in the 2010s compared to the 2000s. Our findings show that the rise in segregation between higher and lower occupational groups slowed during the 2010s. Collectively, the DI values for the studied city-regions shifted from 32.2 in 2001 to 34.1 in 2011 and to 34.3 in 2021 – indicating only marginal changes overall, though some cases show a shift towards desegregation.
Our main findings align with US evidence showing that high levels of residential segregation have stabilised or slightly decreased (Hwang and McDaniel, 2022; Logan et al., 2020). In most European capitals, segregation peaked at moderate levels. Marcińczak et al. (2015) suggest that a Dissimilarity Index between 20 and 40 indicates moderate segregation between occupational groups. Accordingly, none of the studied city-regions have low levels of segregation, while three – Barcelona, Paris, and Stockholm – stand out as highly segregated. Paris and Stockholm, with DI values above 50, are marked by large, homogenous areas of affordable housing (Hess et al., 2018), suggesting that urban planning and design decisions of the past have a long-lasting effect on patterns of segregation. Also, in these cities there is a and strong overlaps of ethnic, socio-economic, and spatial disadvantage – termed ‘eth-class’ segregation by Andersson and Kährik (2015). This poses significant segregation challenges (Lelévrier and Melic, 2018), perpetuating segregation inter-generationally from parents to children (Kalm et al., 2024). The 2015 refugee influx may have further amplified these challenges. Addressing them requires coordinated efforts that combine (a) place-based policies targeting housing, neighbourhoods, and access to urban opportunities beyond the home neighbourhood and (b) policies that tackle inequalities, and support socio-economic mobility and ethnic integration. Ultimately, this suggests that the US trend is part of a broader global slowdown in socio-economic segregation, as studies of 2001 and 2011 data (van Ham et al., 2021) have detected narrowing segregation gaps between large city-regions in the Global North and Global South.
Our second research question asked whether changes in residential segregation correspond to shifts in occupational structures and income inequality. The findings did not show straightforward correlations. Segregation changes occurred alongside upward socio-economic mobility and professionalisation across all city-regions. One interpretation is that the growing urban professional class has become more diverse – in income, housing preferences and age. This diversity may explain variations in segregation changes, as neighbourhood choices depend on income, preferences and life course stage. For example, the digital transition and rise of high-paid tech workers provide them with more housing options compared to other professional groups, such as teachers (Zālīte et al., 2025). Moreover, a considerable portion of high-paid tech workers are younger, with different housing needs and preferences compared to middle-aged or older workers. This calls for more differentiated studies of residential segregation of higher occupational groups.
The link between changes in residential segregation and income inequality appears stronger than that with professionalisation. Income inequality generally increased during the 1990s or early study period, then slowed or reversed in later years – paralleling the slowdown in segregation observed in many city-regions and, in some cases, a shift towards desegregation. In nine city-regions – Amsterdam, Dublin, Helsinki, Lisbon, Oslo, Paris, Riga, Stockholm and Tallinn – changes in income inequality corresponded with subsequent changes in residential segregation. In other city-regions, however, varied combinations of changes in income inequality and segregation were observed, supporting the segregation paradox. These variations may reflect differences in the timing and pace of change between income inequality and segregation. Housing and labour market contexts also influence this relationship. For example, the time-lag between changes in income inequality and segregation may differ in city-regions with different tenure structures, as renters are more vulnerable than owners. Moreover, wealth may play an important role in residential segregation, as younger generations increasingly depend on parental support to access the housing market (Kalm et al., 2024; Musterd, 2023). Finally, spatial distribution of jobs may vary more across European city-regions than in the US, where recent research shows growing separation in both residential and workplace locations by occupation – deepening segregation across both domains (Delmelle et al., 2021). All these factors and mechanisms should be explored further in future studies.
The segregation paradox suggests that residential mixing during periods of rising levels of income inequality is often temporary (Sýkora, 2009; Tammaru et al., 2016). While residential segregation may initially decrease with gentrification – as higher-income groups move into lower-income neighbourhoods – this trend can reverse as rising costs displace middle- and lower-income residents, resulting in increasing segregation again. Our findings suggest that metropolitan-level processes may cast the segregation paradox in a new light. As professionalisation continues and inner-city areas become increasingly saturated, more socio-economic mixing may emerge in the suburbs, where higher occupational groups spill over from city centres. This highlights the need to better understand how the suburbanisation of professionals affects residential mixing or segregation, and the role of spatial planning and housing policies in shaping these patterns.
Our third research question focused more specifically on the geographic shifts of higher and lower occupational groups. Despite using detailed spatial units, our analysis reveals clear macro-segregation patterns, as occupational groups cluster in ways that reflect the housing market’s centrality and spatial organisation. Despite the emerging spillover trends into the suburbs, higher occupational groups remain clearly over-represented in inner-city neighbourhoods, while lower groups are over-represented in more affordable suburban housing areas – a pattern consistently observed across all cases. Our analysis did not detect a fundamental shift towards further socio-economic upgrading in inner-city or downgrading in the suburbs.
It may be that the professionalisation of the workforce – a common trend across all city-regions – contributes to the segregation paradox by increasing income heterogeneity within expanding professional groups. This, in turn, may broaden their housing search beyond the inner city, due to both market saturation and rising unaffordability for some segments of the professional class. For example, in Prague, where inner-city prices are very high, higher occupational groups are increasingly present in certain suburban areas. Similar patterns are seen in other Eastern European cities, likely reflecting delayed suburbanisation, which accelerated only in the 1990s – unlike Western Europe, where it has been a longer-term trend. Future work could enhance our city-level and visual segregation analyses by incorporating spatially sensitive methods like spatial autocorrelation or k-nearest neighbour techniques.
Conclusion and future research
This comparative study offers new insights into changes in residential segregation between occupational groups across 16 European capital city-regions. It also lays a foundation for future research to better explore differences between city-regions and the underlying mechanisms shaping these segregation trends. Using city-level inequality measures and varying time lags could enhance understanding of the relationship between income inequality and residential segregation. Incorporating other vulnerable groups – such as the unemployed, pensioners, migrants, ethnic minorities and lone parents – would provide a more comprehensive view of the socio-economic landscape. We observe a clear slowdown in segregation growth in many studied European city-regions, with some of them transitioning from segregation to desegregation. Segregation research should increasingly focus on uncovering the mechanisms driving desegregation, the role of the growing professional class and how desegregation evolves across urban contexts shaped by distinct housing and labour market characteristics, as well as broader welfare systems.
Supplemental Material
sj-docx-1-usj-10.1177_00420980251378028 – Supplemental material for A comparative study of socio-economic segregation in European capital city-regions: From segregation to desegregation?
Supplemental material, sj-docx-1-usj-10.1177_00420980251378028 for A comparative study of socio-economic segregation in European capital city-regions: From segregation to desegregation? by Rūta Ubarevičienė, Tiit Tammaru, Maarten van Ham, Leandro Basílio Junior, Māris Bērziņš, Kevin Credit, Diogo Gaspar Silva, Richard Harris, Kadi Kalm, Timo Kauppinen, Zaiga Krišjāne, Jorge Malheiros, Thomas Maloutas, David Manley, Sako Musterd, Oriol Nel·lo, Milena Nevanto, Ladislav Novotný, Martin Ouředníček, Sergio Porcel, Antonine Ribardière, Martin Šimon, Maciej Smętkowski, Stavros Spyrellis, Magnus Strömgren, Wouter van Gent and Terje Wessel in Urban Studies
Supplemental Material
sj-pdf-2-usj-10.1177_00420980251378028 – Supplemental material for A comparative study of socio-economic segregation in European capital city-regions: From segregation to desegregation?
Supplemental material, sj-pdf-2-usj-10.1177_00420980251378028 for A comparative study of socio-economic segregation in European capital city-regions: From segregation to desegregation? by Rūta Ubarevičienė, Tiit Tammaru, Maarten van Ham, Leandro Basílio Junior, Māris Bērziņš, Kevin Credit, Diogo Gaspar Silva, Richard Harris, Kadi Kalm, Timo Kauppinen, Zaiga Krišjāne, Jorge Malheiros, Thomas Maloutas, David Manley, Sako Musterd, Oriol Nel·lo, Milena Nevanto, Ladislav Novotný, Martin Ouředníček, Sergio Porcel, Antonine Ribardière, Martin Šimon, Maciej Smętkowski, Stavros Spyrellis, Magnus Strömgren, Wouter van Gent and Terje Wessel in Urban Studies
Footnotes
ORCID iDs
Author contributions
Rūta Ubarevičienė, Maarten van Ham and Tiit Tammaru are the leading authors. The remaining 24 co-authors (listed alphabetically) made significant and equally important contributions by conducting statistical analyses for the case studies, participating in discussions, providing feedback and contributing to the review and editing of the manuscript.
Funding
The authors disclosed receipt of the following financial support for the research, authorship, and/or publication of this article: This study was supported by the Lithuanian Research Council (S-MIP-23-37 ‘Ensuring Housing Needs: Challenges and Prospects in Lithuania’), Estonian Research Council (PRG1996 ‘Living segregated lives: Exploring changes in spatial inequalities in digitally transforming societies’), the Estonian Ministry of Education and Science (Centre of Excellence in Energy Efficiency and the Infotechnological Mobility Observatory (![]() )), Estonian Academy of Sciences (Research Professorship of Tiit Tammaru), Polish National Science Centre (2022/45/B/HS4/00719 ‘The post-socialist city in the era of metropolisation: transformations of social space in XXI century Warsaw’), Scientific Grant Agency of the Ministry of Education, science, research and sport of the Slovak Republic and the Slovak Academy of Sciences (VEGA 1/0768/24 ‘Multiscale assessment of spatial variability of social-economic population stratification’), and the Czech Academy of Sciences, Institute of Sociology (institutional support RVO: 68378025).
)), Estonian Academy of Sciences (Research Professorship of Tiit Tammaru), Polish National Science Centre (2022/45/B/HS4/00719 ‘The post-socialist city in the era of metropolisation: transformations of social space in XXI century Warsaw’), Scientific Grant Agency of the Ministry of Education, science, research and sport of the Slovak Republic and the Slovak Academy of Sciences (VEGA 1/0768/24 ‘Multiscale assessment of spatial variability of social-economic population stratification’), and the Czech Academy of Sciences, Institute of Sociology (institutional support RVO: 68378025).
Declaration of conflicting interests
The authors declared no potential conflicts of interest with respect to the research, authorship, and/or publication of this article.
Data availability statement
We have prepared a supplementary file that includes a factsheet for each of the 16 case studies, offering a more detailed data overview than what is presented in the main paper. Please note that the analysis for each of the 16 case study cities was carried out by local experts with access to census or register-based data. Although the data used in this study is anonymised and aggregated at the spatial unit level, it cannot be publicly shared. For any further inquiries, please contact the corresponding author.
Supplemental material
Supplemental material for this article is available online.
Notes
References
Supplementary Material
Please find the following supplemental material available below.
For Open Access articles published under a Creative Commons License, all supplemental material carries the same license as the article it is associated with.
For non-Open Access articles published, all supplemental material carries a non-exclusive license, and permission requests for re-use of supplemental material or any part of supplemental material shall be sent directly to the copyright owner as specified in the copyright notice associated with the article.