
Abstract
In this study, in accordance with the basic principle of the water repellency test, images of visually evaluated samples were captured, and the wetted areas were numerically calculated using image processing techniques. Water repellent finishes were applied to different types of fabrics at varying concentrations, resulting in 102 samples with different water repellent properties. After the spray test, the sample images were compared with ISO shower test rating cards by 10 expert observers. In addition, the wetted areas of the samples were determined as percentages using image classification techniques with ERDAS 8.4 software. Kendall’s W test demonstrated a high level of agreement among the observers (W = 0.882). A strong negative correlation (r = −0.908) was found between objective and subjective data, as the evaluation rating decreases with increasing wetted area according to ISO shower test rating cards. This confirms that the objective evaluations closely align with the subjective measurements.
Resistance to surface wetting is a functional property of fabrics which is required for protective clothing without deteriorating the comfortability. These fabrics have many industrial and apparel uses. These fabrics are inherently, or have been treated to become, resistant to penetration by water and wetting.1,2 The water repellency property of textiles can be obtained by using paraffin wax, silicone compounds, fluorochemicals, polyurethanes, dendrimers, and hydrophobins, as well as nanomaterials such as SiO2 nanoparticles and carbon nanotubes. 3 Water repellent agents are chemicals that resist the penetration of water into the fabric and can keep water droplets (or other liquids) in tiny drops without distributing them on the fabric surface. 4
Water repellency works by applying a finished coating that prevents water droplets from spreading across the fabric or fiber surface. This effect is achieved when the coating’s critical surface tension is lower than the surface tension of water, causing the droplets to bead up and roll off. 5
The water repellency of the materials is evaluated mainly using the spray test method and contact angle measurement, which are the most commonly used techniques for evaluating water repellent properties. 6 Waterproof breathable fabrics are studied based on spray test ISO 4920:2012, 7 in which the fabric resistance to surface wetting is investigated by spraying a specific amount of distilled water and comparing the sample with standard pictures. 8 But visual assessment of fabric surface wetting relies on human’s eyes to make a judgement, which is easily affected by subjective factors.
Image processing technology, which has developed rapidly since the 1960s, is especially useful in textile manufacturing, inspections, including texture evaluation, and examination of textile surface characteristics. Image processing is used for the determination of pore size and porosity,9–11 thickness and appearance of coatings,12,13 yarn defects and yarn structure,14–16 abrasion resistance, 17 objective measurement of woven fabric’s cover factor, 18 the diameter of yarns and nanofibers,19–21 fabric shrinkage and damage,22,23 color measurement and cotton grading, 24 and fiber length distribution of long staple CF. 25 A method for detecting water spots in fabrics using near-infrared (NIR) hyperspectral imaging with the effect of textile dyes minimized was reported by Jiang et al. 26 An objective method for evaluating water repellency through image analysis of sprayed patterns on woven fabrics, following AATCC Test Method 22-2001 was developed by Jeong and Jang. 27 An image processing technique to analyze the wicking height of certain fabrics by capturing images every minute for 30 minutes, using a geometric correction formula to compensate for optical distortions and evaluate water absorption and moisture management performance was presented by Jiang et al. 28 A measurement method for evaluating the wicking performance of textiles with different thicknesses has been developed by Memariani and Ekhtiari, 29 which involves applying a water droplet using a syringe, capturing images with a digital camera, and analyzing them with Matlab 7.4. Radial liquid spreading from an infinite reservoir onto fabrics was investigated in an experimental study by Cotorobai et al., 30 using two setups: one for imaging wet spots and another for tracking reservoir weight loss, with wicking kinetics analyzed using LabVIEW. The three-dimensional moisture mapping device (3D-MMD), presented by Süpüren et al., 31 is a new test device for measuring the multidirectional moisture transmission of fabrics, which captures temperature changes caused by heat transfer when liquid is applied using two thermal cameras and identifies the wet area through infrared data.
The spray test method (spray water repellency test) is one of the methods used to evaluate the water repellency degree. The evaluation of this test is made visually using ISO shower test rating cards (ISO 4920:2012). The wetted areas of the fabric after the test are compared with the ISO shower test rating cards, but observers may give different grades to the same sample. Computerized image capture and image analysis offer promising applications for rapid, accurate, and objective measurements of a wide range of textile material properties.32,33 In this study, wetted areas were determined numerically using image processing techniques. The samples photographed in a standard way were processed using the ERDAS 8.4 program after making the necessary technical and geographic corrections.
Methodology
Water repellent finishing
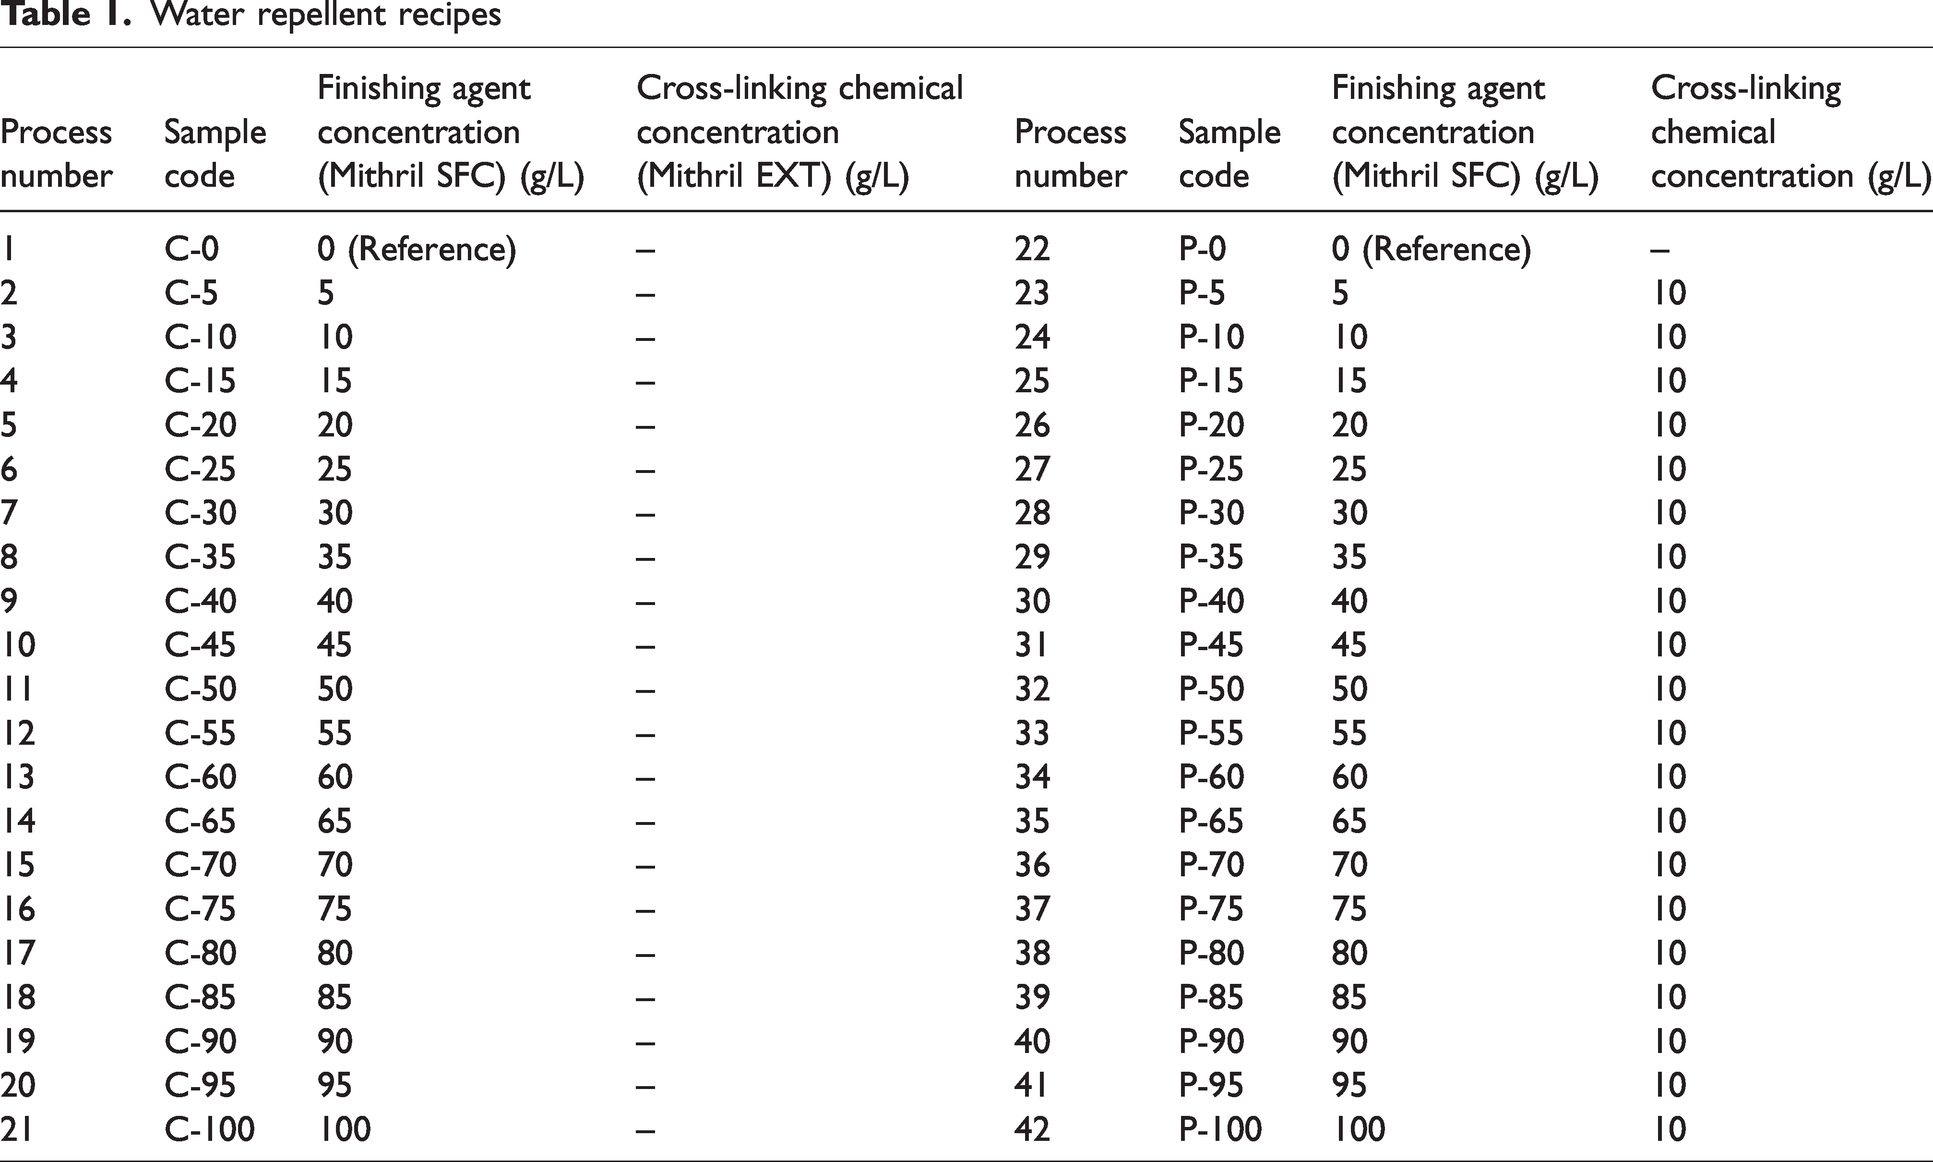
Water repellent finishing treatments were applied to cotton and polyester fabrics at 20 different concentrations. The water repellent solution was prepared using pure water. The chemicals employed in the process, Mithril SFC and Mithril EXT, are commercially available products from Ecopol Chemical Company. Mithril SFC is a fluorocarbon-based water repellent finishing agent, whereas Mithril EXT acts as a crosslinking agent. No cross-linking agent (Mithril EXT) was used for cotton fabrics. For polyester fabrics, however, the cross-linking agent (Mithril EXT) was used at 10 g/L in all baths, whereas the amount of the water repellent finishing chemical (Mithril SFC) varied from 0 to 100 g/L (Table 1). The bath pH was adjusted to 4.5 using acetic acid. Water repellent finishing for cotton and polyester samples was performed using a horizontal impregnation machine, with a sample passage speed of 1 m/min and a liquor uptake of 60%. After impregnation, samples were dried at 120°C for 3 minutes, followed by fixing: cotton at 160°C for 60 seconds and polyester at 170°C for 40 seconds using a stenter.
Water repellent recipes
Spray test
The surface wetting resistance of cotton and polyester fabrics was assessed using a spray repellency test device in accordance with the ISO 4920:2012 standard. A total of 102 samples, treated with water repellent finishes at varying concentrations, were imaged post-test using a digital camera. Following the spray water repellency test, 102 samples were captured under standardized conditions, including controlled light intensity, angle, and positioning. The 102 images were then subjectively evaluated by 10 expert observers, who assessed them in accordance with the ISO shower test rating cards. A fabric that exhibited complete nonwetting properties was assigned a rating of “5,” whereas a fabric that was fully wetted was assigned a rating of “1.”
Image processing
Standardization of sample photographs
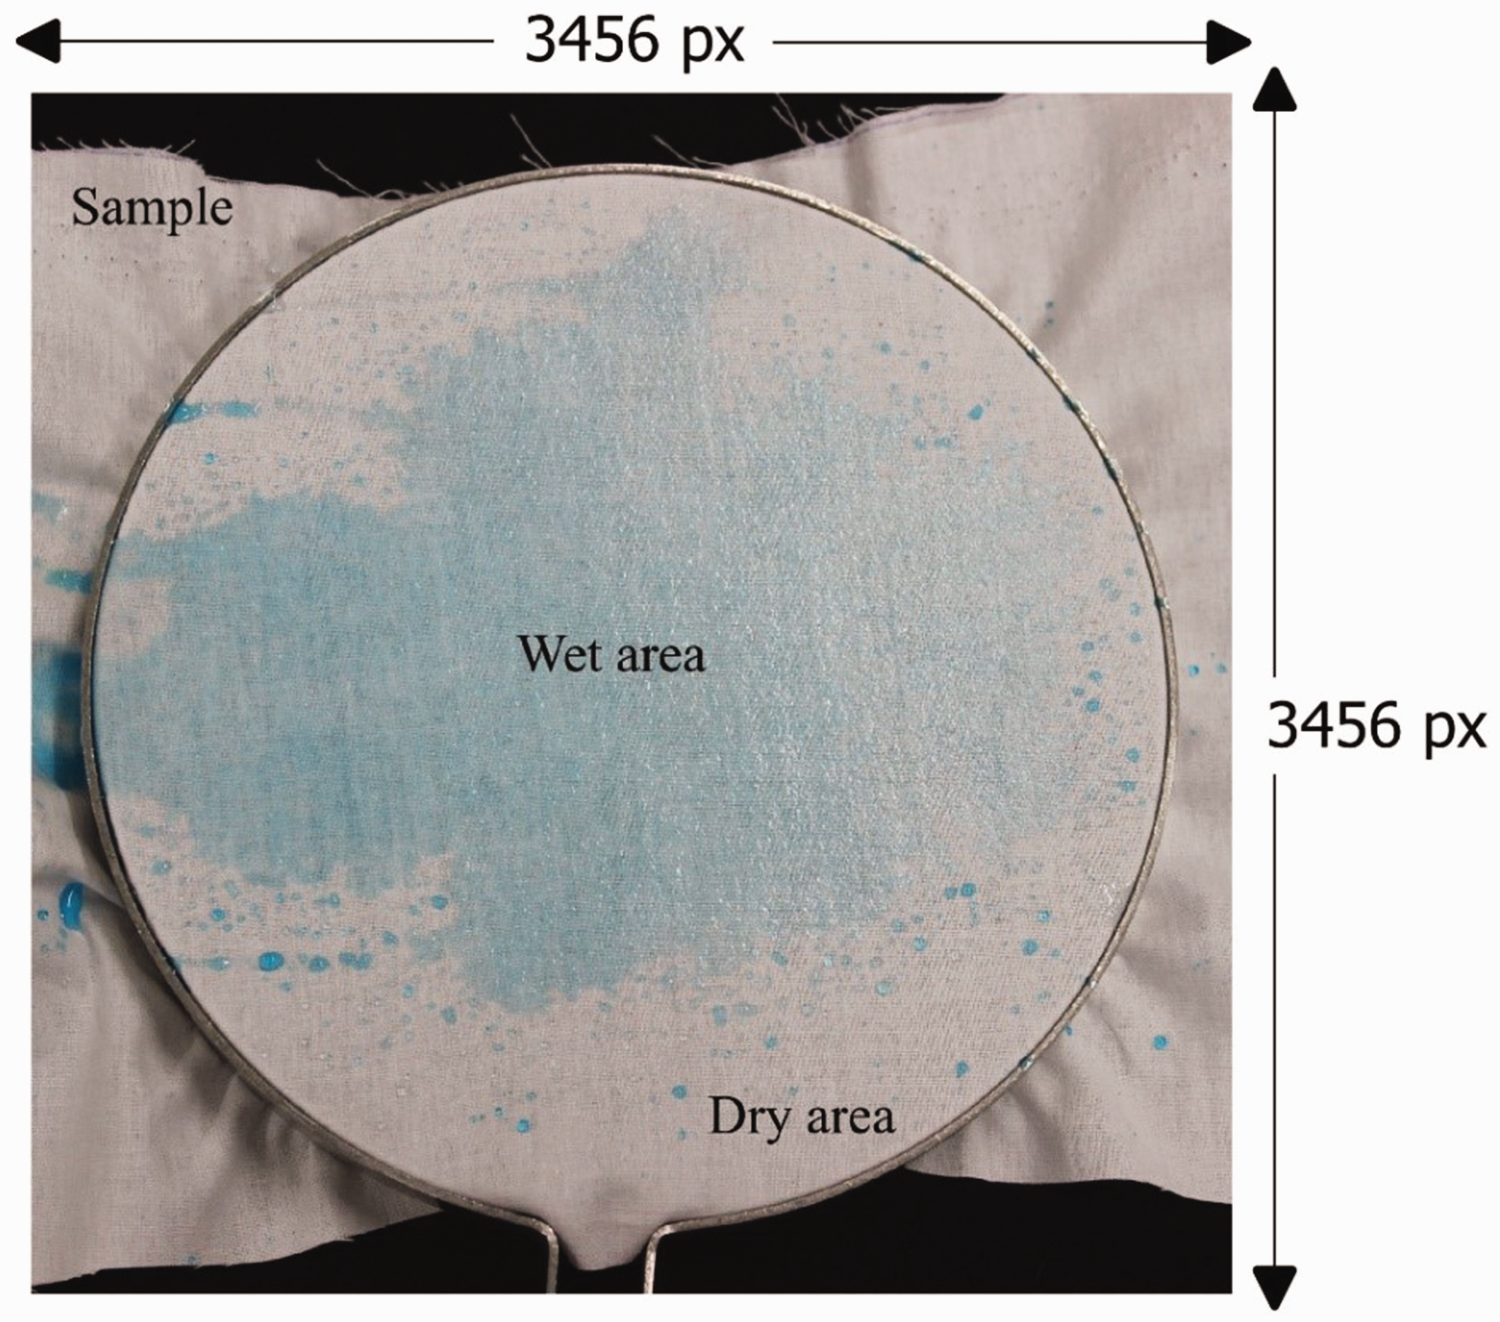
Since the aspect ratios of the sample images were not square, the Paint 3D software was employed to adjust the longer side of the image to match the size of the shorter side, while maintaining the aspect ratio. Throughout this process, the image scale was preserved. Geographical correction was made by coordinating the image. Figure 1 shows the wet and dry areas of the fabric fixed using the sample holder.
Paint 3D application screen for image resizing (both sides are set to 3456 pixels).
Geocorrection process of sample photos
Square coordinates from a 1:25,000 scale topographic map were used as corner coordinates for the geometric correction of square-shaped sample photographs. These coordinates were assigned using the “Georeferencer” tool in the QGIS 3.16.2 software.
During the image classification process, the wet and dry areas of the fabric remaining in the sample holder were assessed (Figure 2(a)). The region outside the yellow dashed line represents an area that should be excluded from the image processing (Figure 2(b)). The exterior of the sample holder was then masked to remove the area beyond the yellow dashed circle (Figure 2(c)). Following this, the newly masked images were saved under a different filename in the “.img” format, ensuring compatibility with ERDAS 8.4 software.
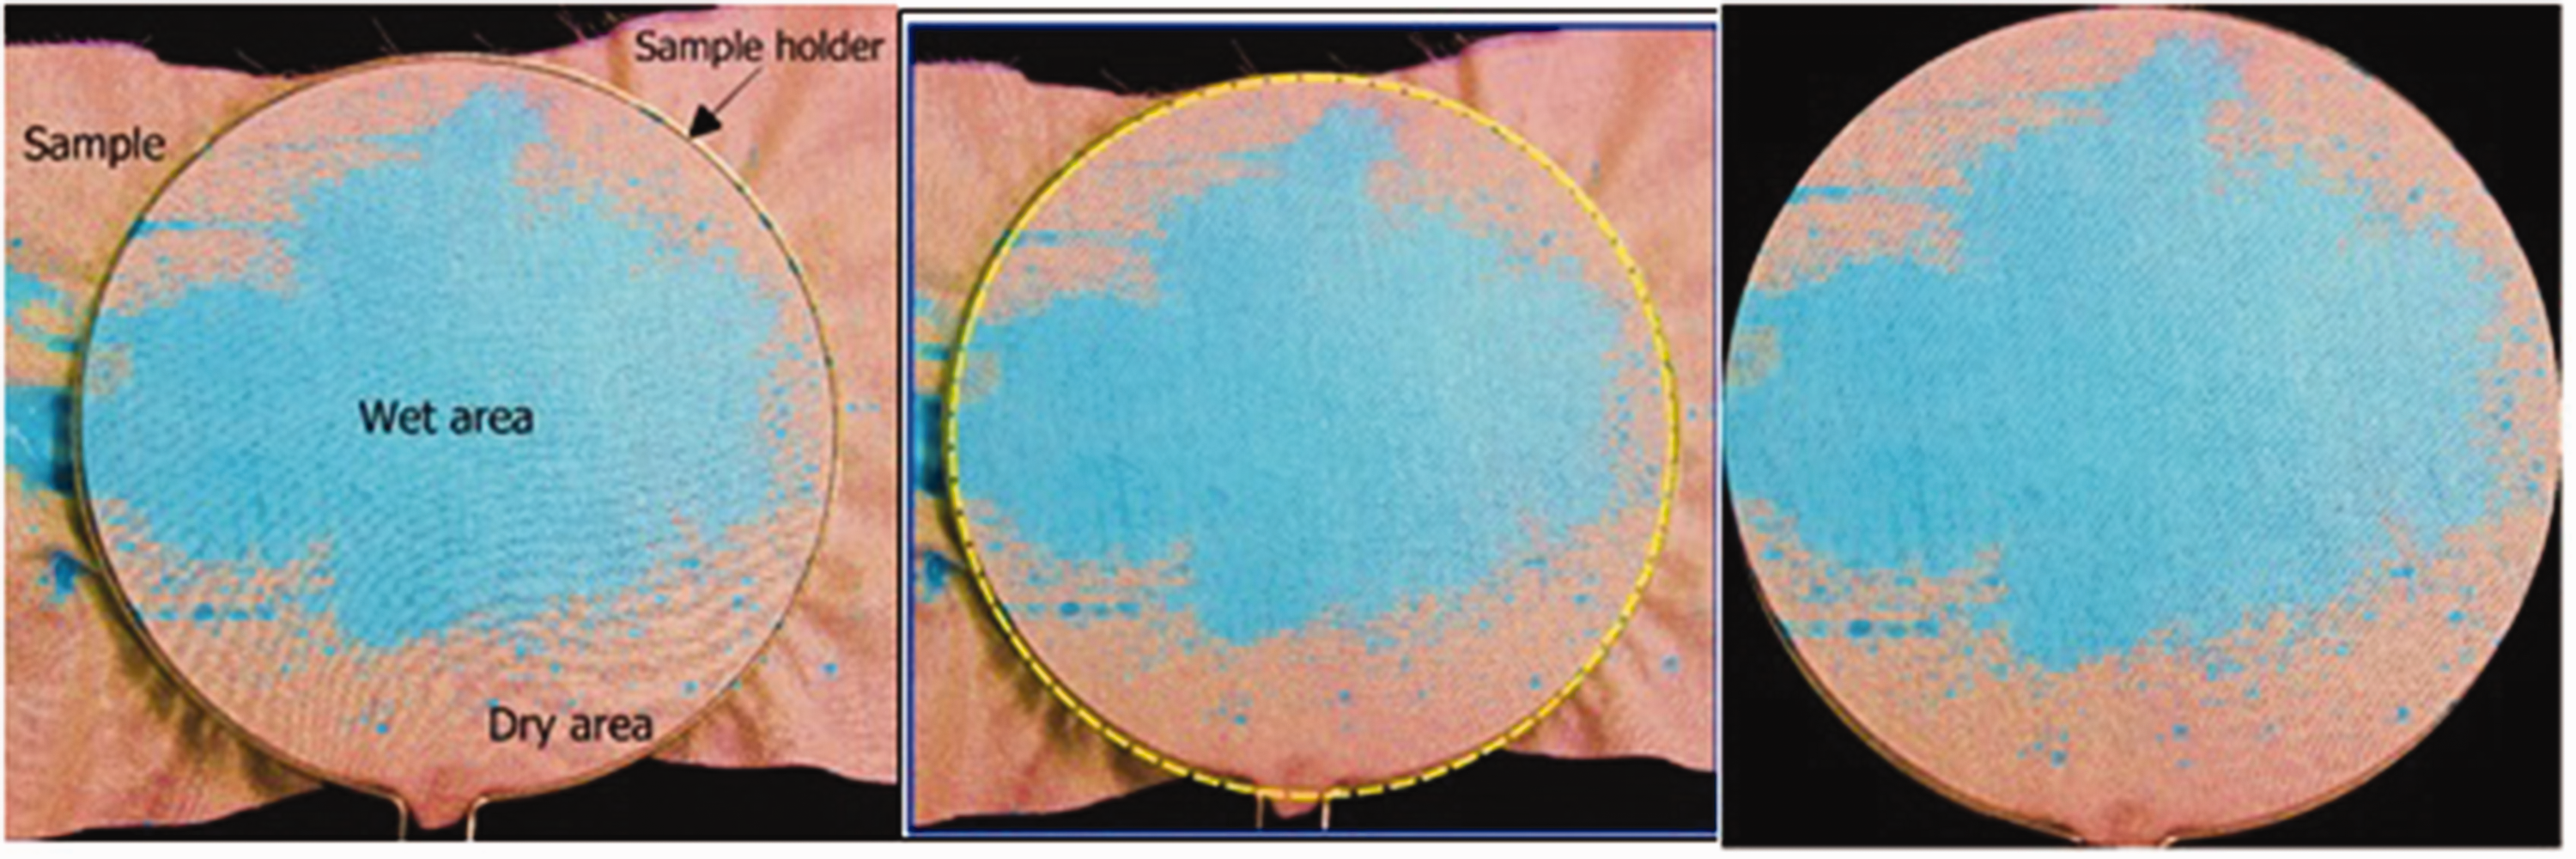
Masked and evaluated areas for image classification on the fabric sample.
Image classification process
In some of the classified sample photographs, the clarity of distinction between wet and dry areas was observed to be low. To enhance the clarity and make the distinction between wet and dry areas more apparent, the order of the band combination in the raster data of the samples was rearranged to be more suitable for visual interpretation. Accordingly, the 1st band was set to red, the 2nd band to green, and the 3rd band to blue (Figure 3). Blue color represents wet areas, whereas red color represents dry areas.
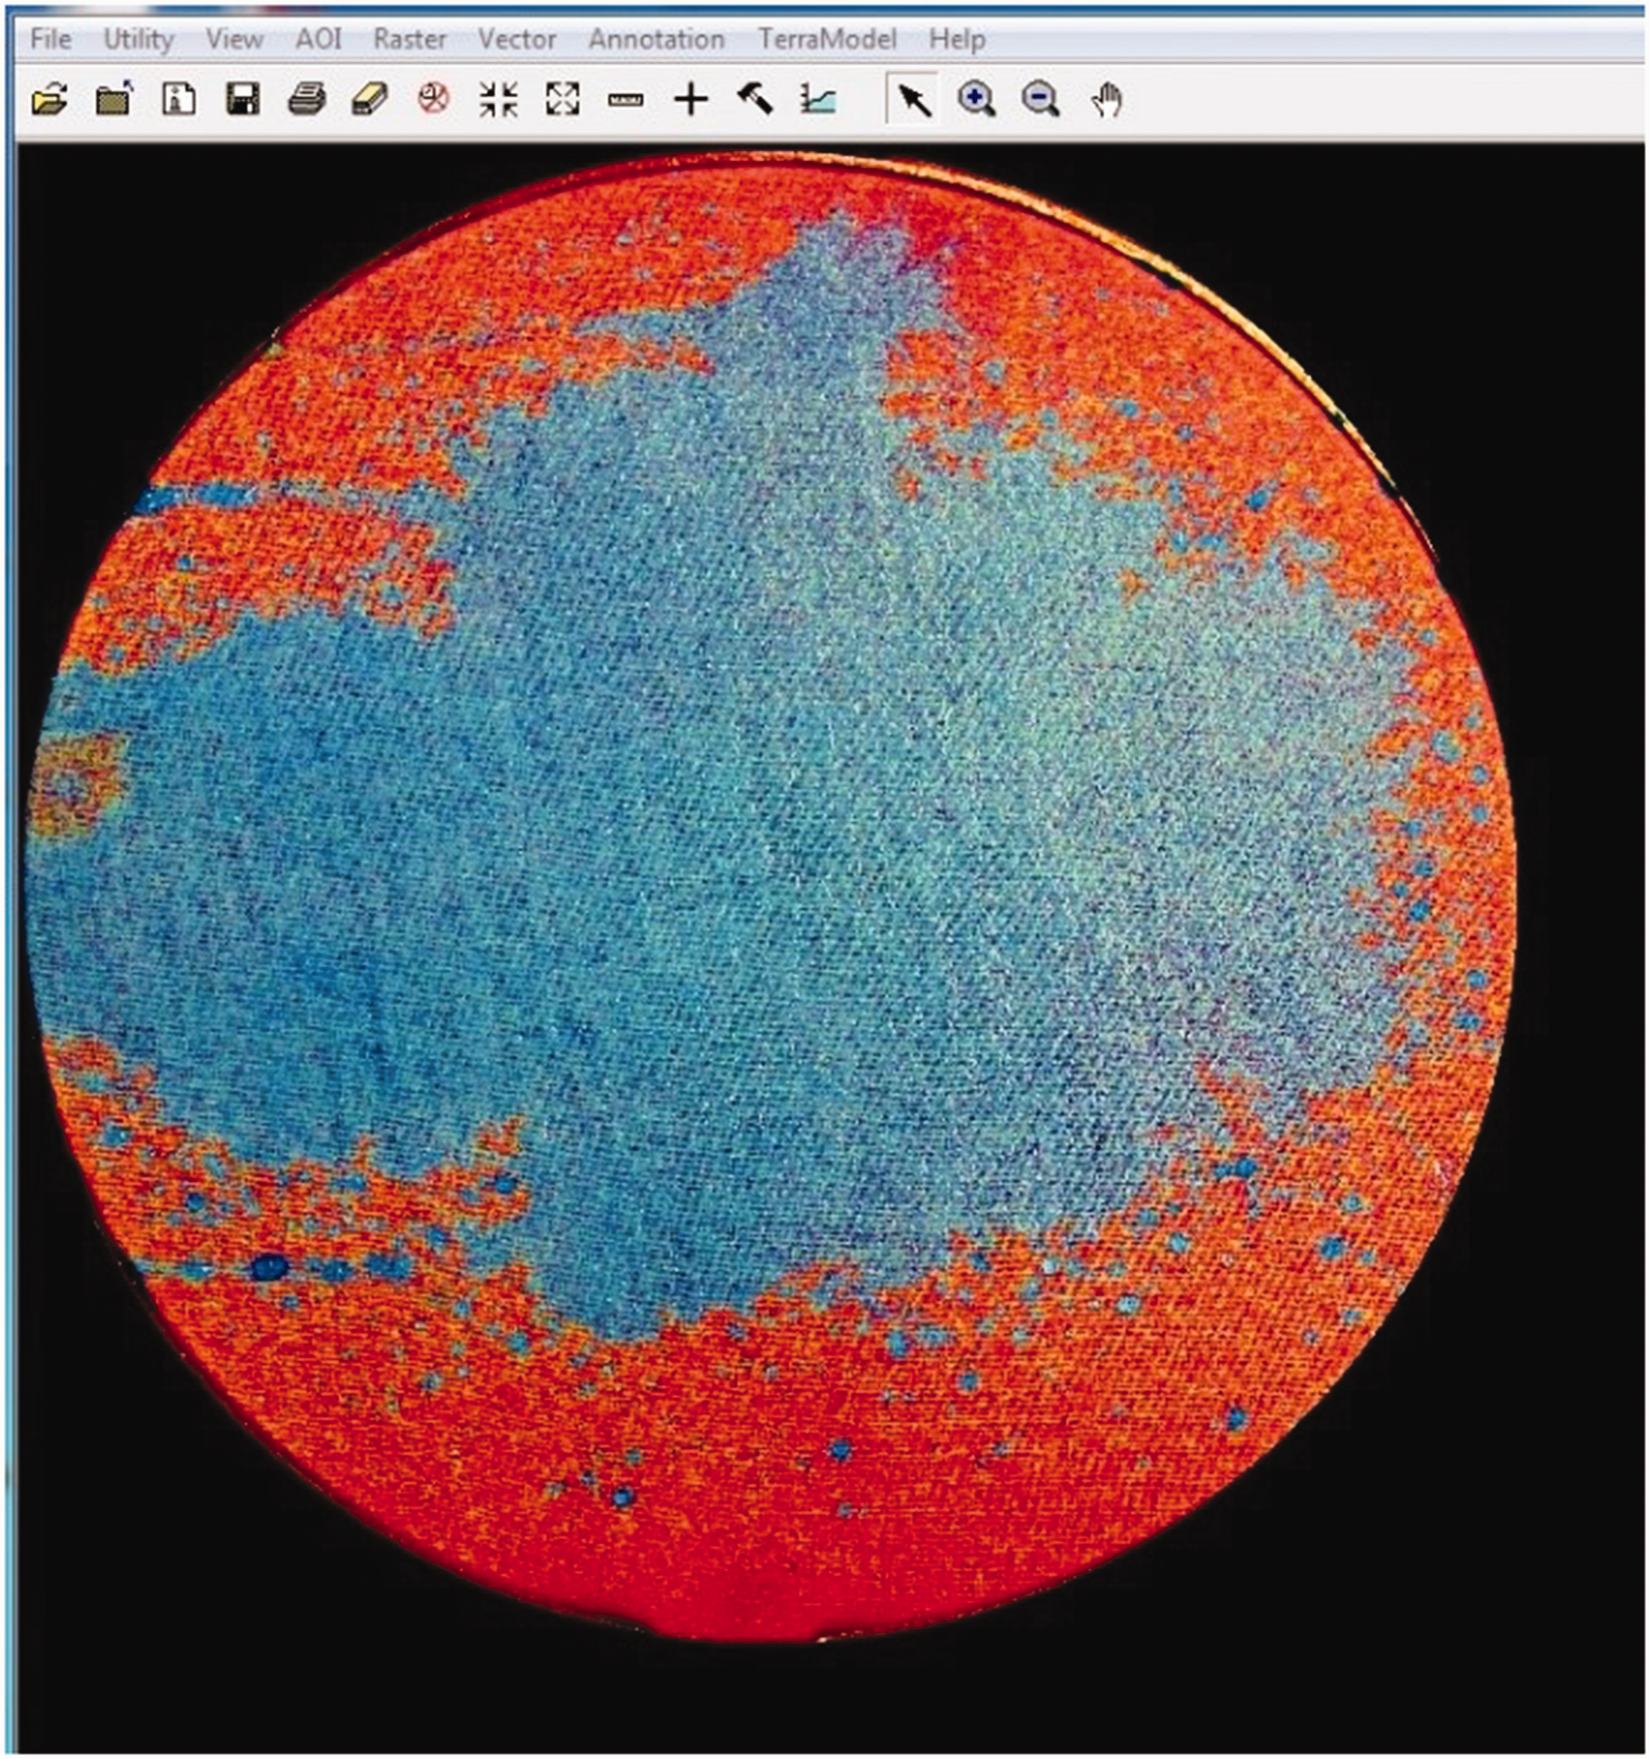
High-contrast image obtained from the rearranged band combination.
Following this step, the classification of the sample images is performed. At this stage, accurately determining the number of classes is crucial for the success of the study. While determining the number of classes, factors that could cause varying reflections in the image were taken into account. The greater the number of these factors, the higher the number of classes should be. In this study, factors contributing to varying reflections were identified as wetness, the degree of wetness, dry surface characteristics, light intensity, and the angle of incidence of light on the fabric surface. These factors were taken into account during the image processing. To determine the most accurate number of classes, several different class numbers should be applied to the same image, and the appropriate number of classes for that image should be determined accordingly. For this purpose, 3, 4, 5, 10, and 20 classes were selected, and initial trials were conducted on the same images. When more classes than necessary are used, the desired wet or dry areas within the same class may be incorrectly grouped into different classes (such as unnecessary distinctions between wet and dry areas). On the other hand, if fewer classes than necessary are used, the required wet or dry areas from different classes may be grouped into the same class.
The 20-class “Unsupervised” classification process was applied to all samples in parallel using the “Data Classification” menu of ERDAS 8.4 software. The resulting image was then resaved in “.img” format with a different file name. An example of a sample with this process applied but not colorized is shown in Figure 4.
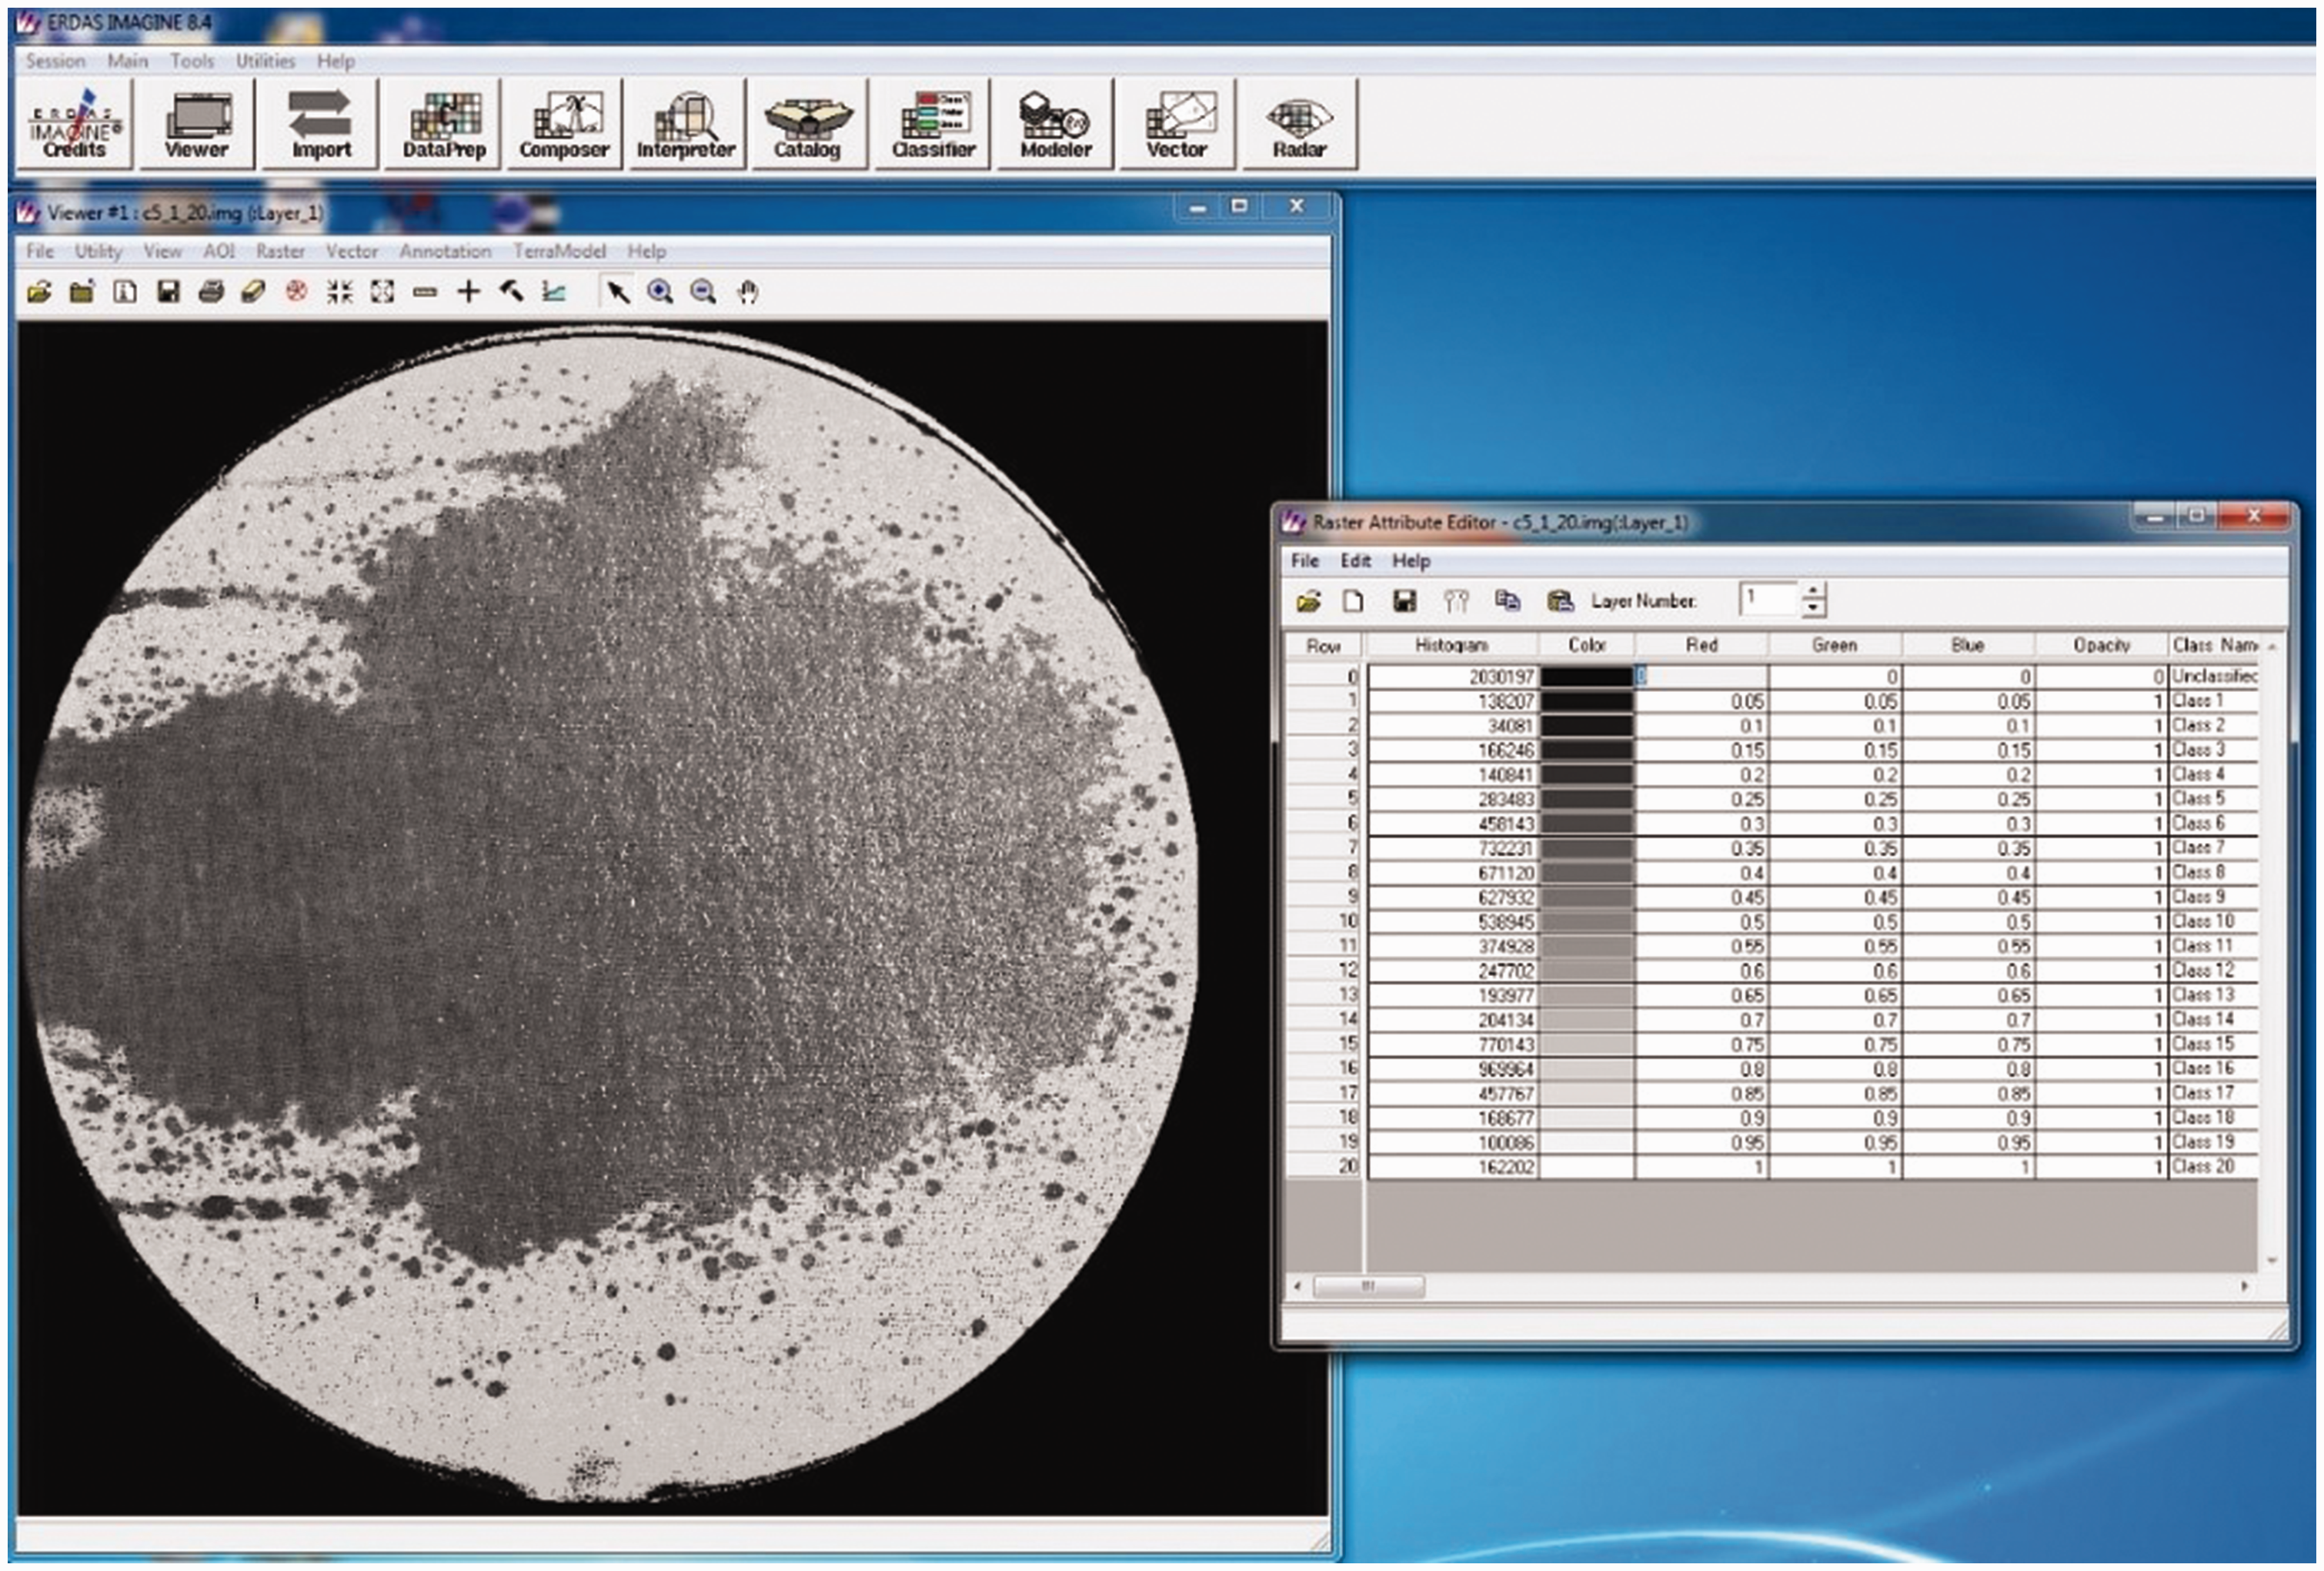
Example image obtained from the application of unsupervised classification.
Owing to the low contrast between wet and dry areas in the raw image, a more accurate colorization can be achieved by interpreting the contrast-enhanced image, obtained by changing the band combination, together with the classified image (Figure 5).
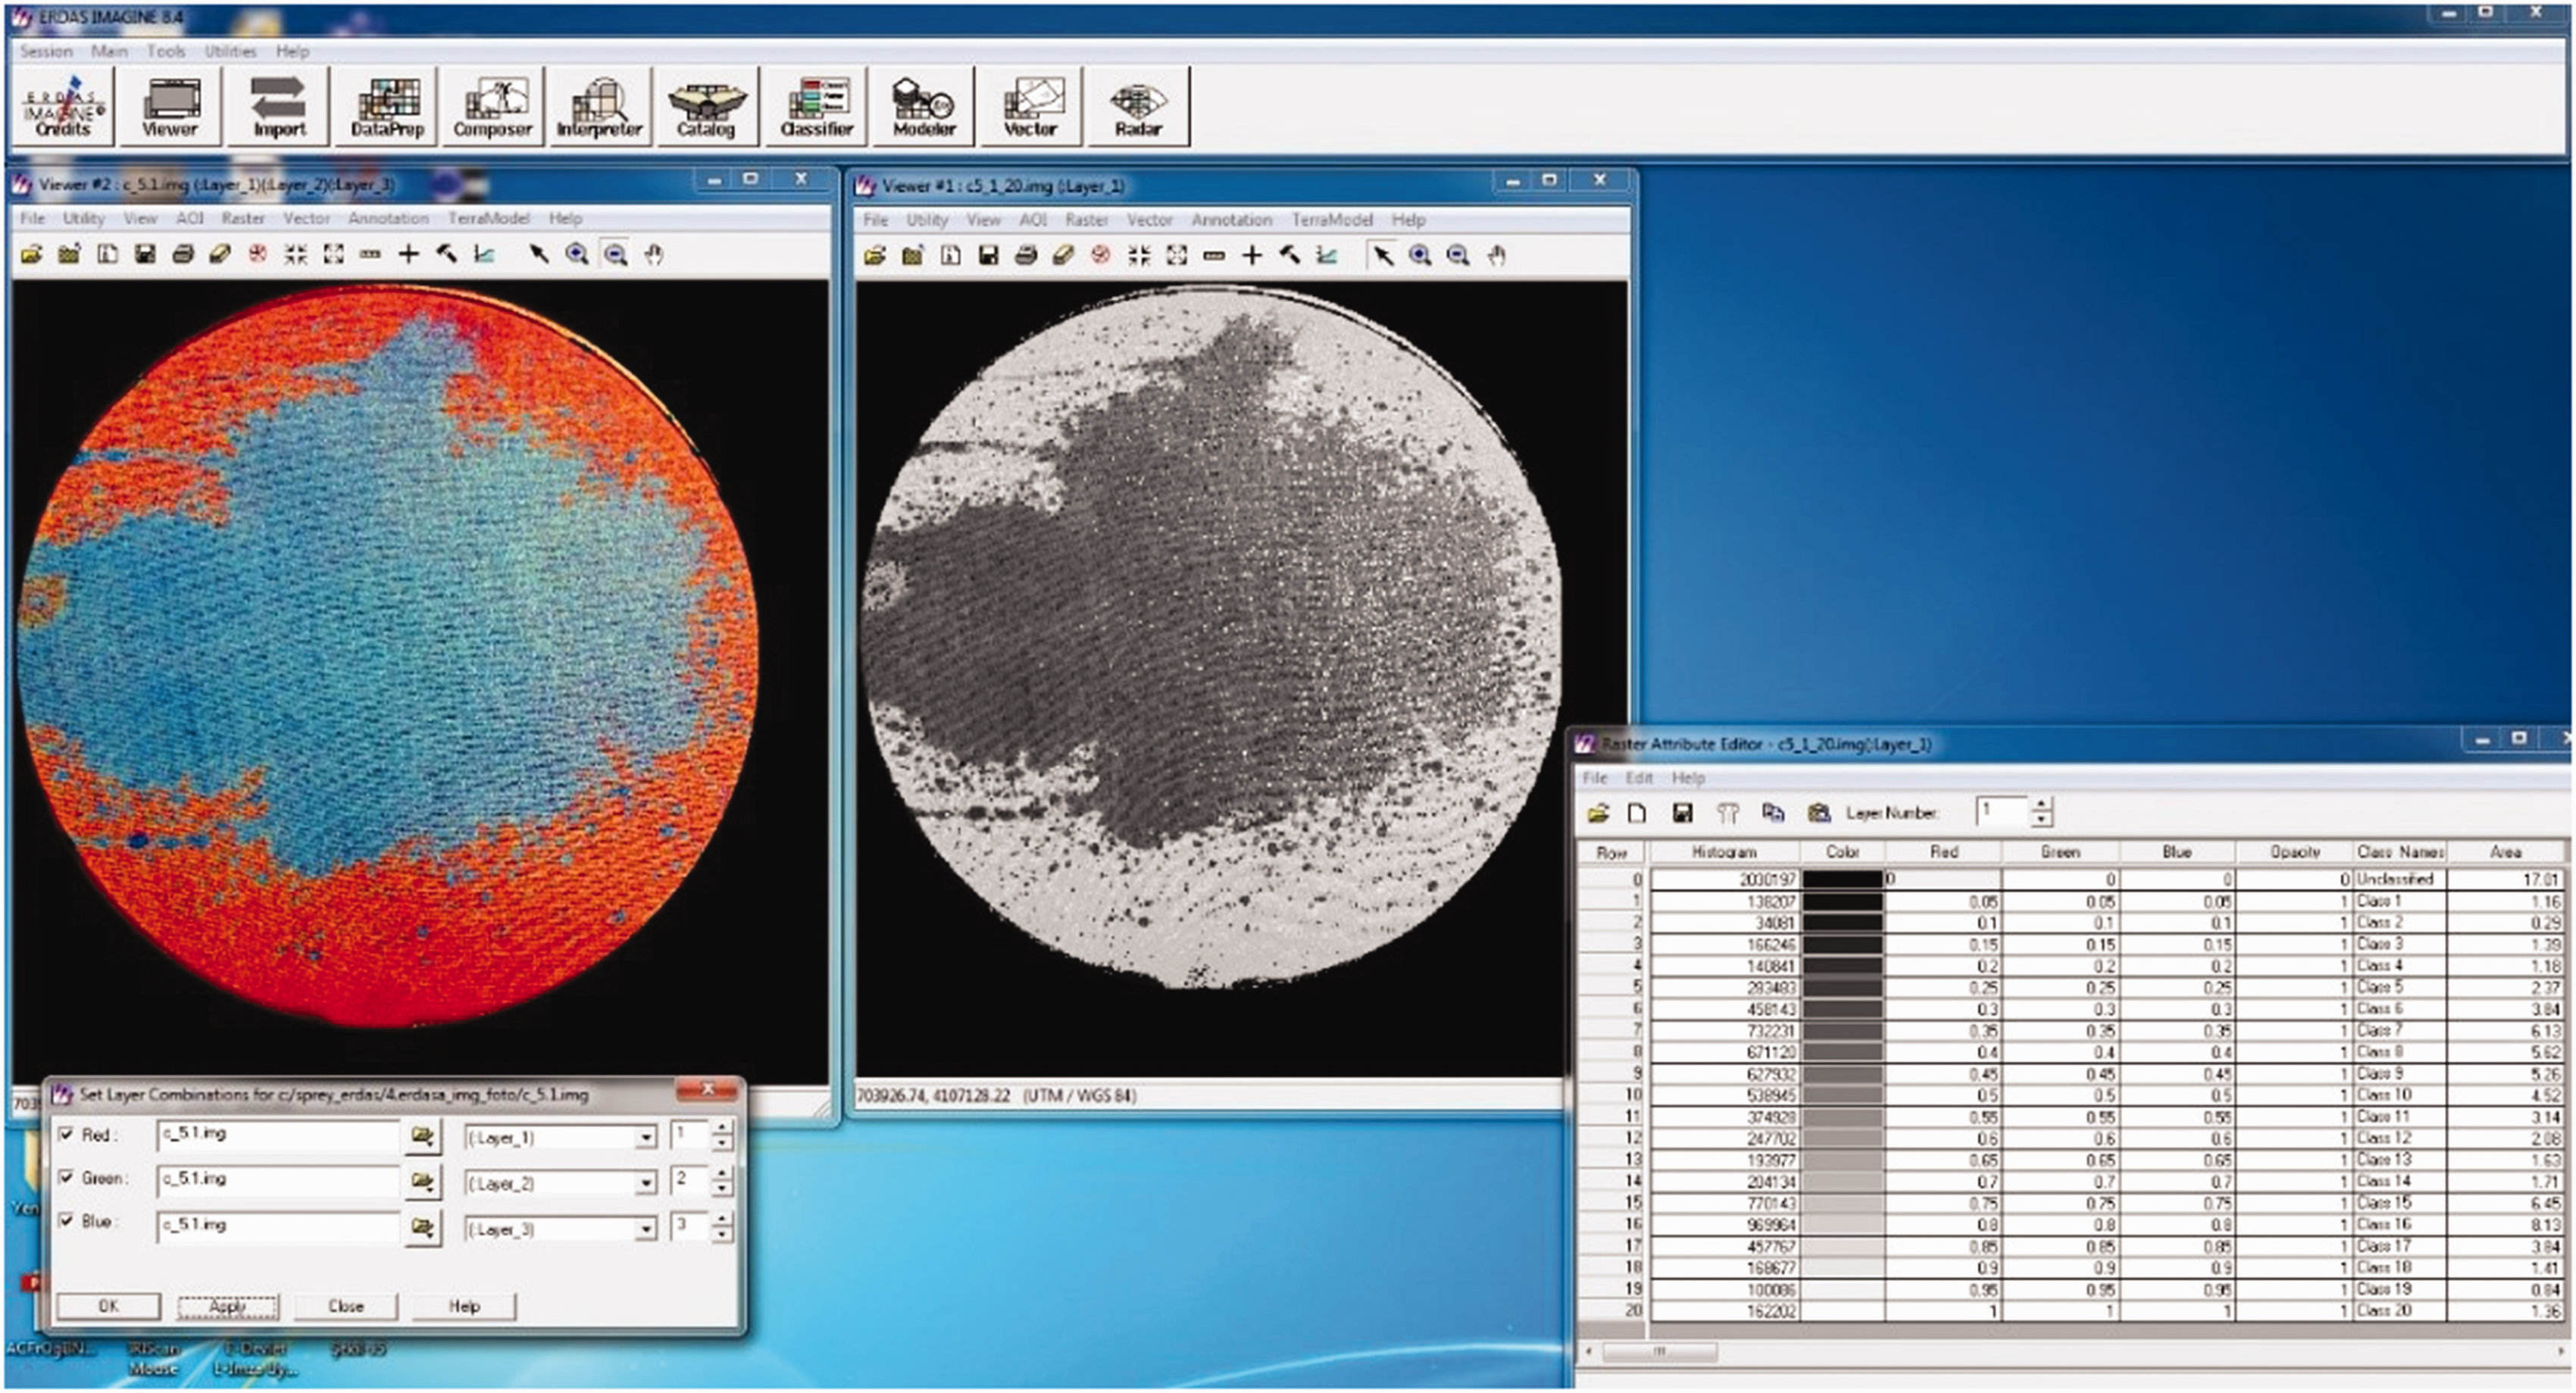
Contrast-enhanced image (a), classified image (b), and the list of classes (c).
In the samples, the colors assigned to the wet and dry areas resulting from the spraying process are entirely dependent on the researcher’s experience or preference. In this study, wet areas are colorized blue and dry areas are colorized white to reflect their typical appearances. Therefore, in the given example, 11 out of 20 classes represent wet areas and 9 represent dry areas (Figure 6). Twenty classes are standard for each sample, but the reflectance values of dry and wet areas vary depending on the degree of wetness of the samples. For this reason, wet and dry reflection class numbers may differ for each sample.
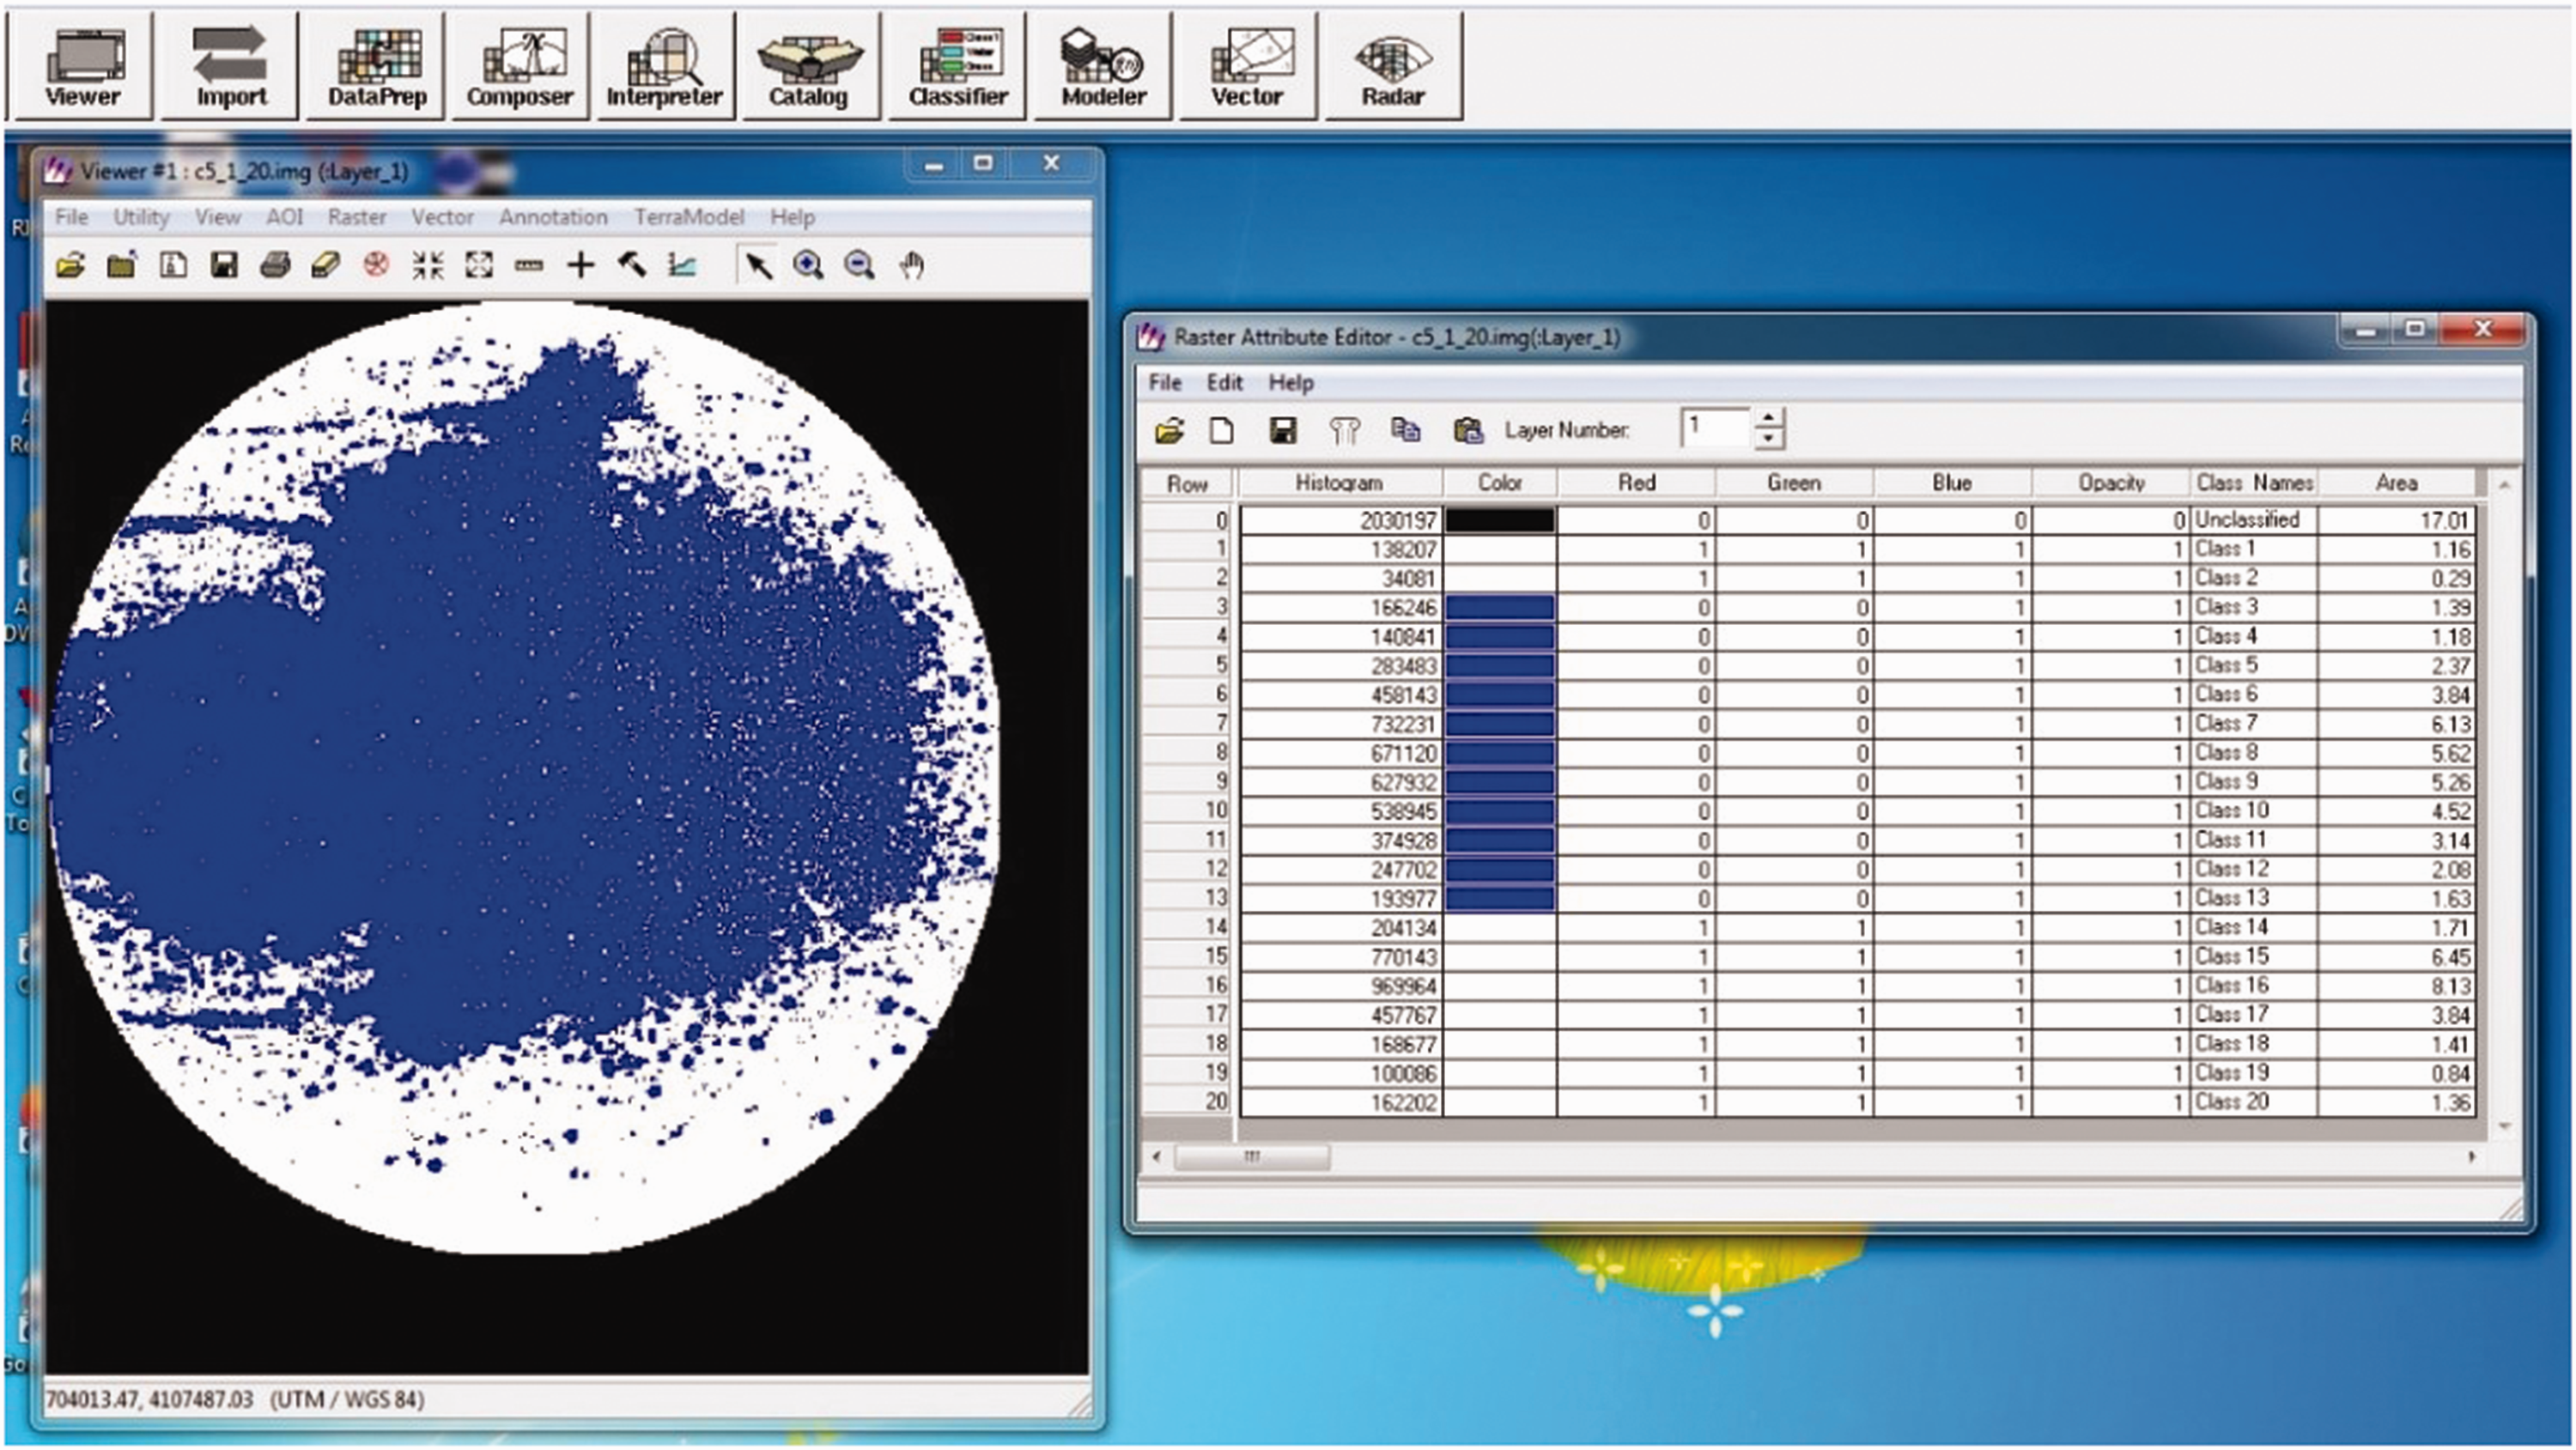
Classified image with assigned colors and classification table.
Results
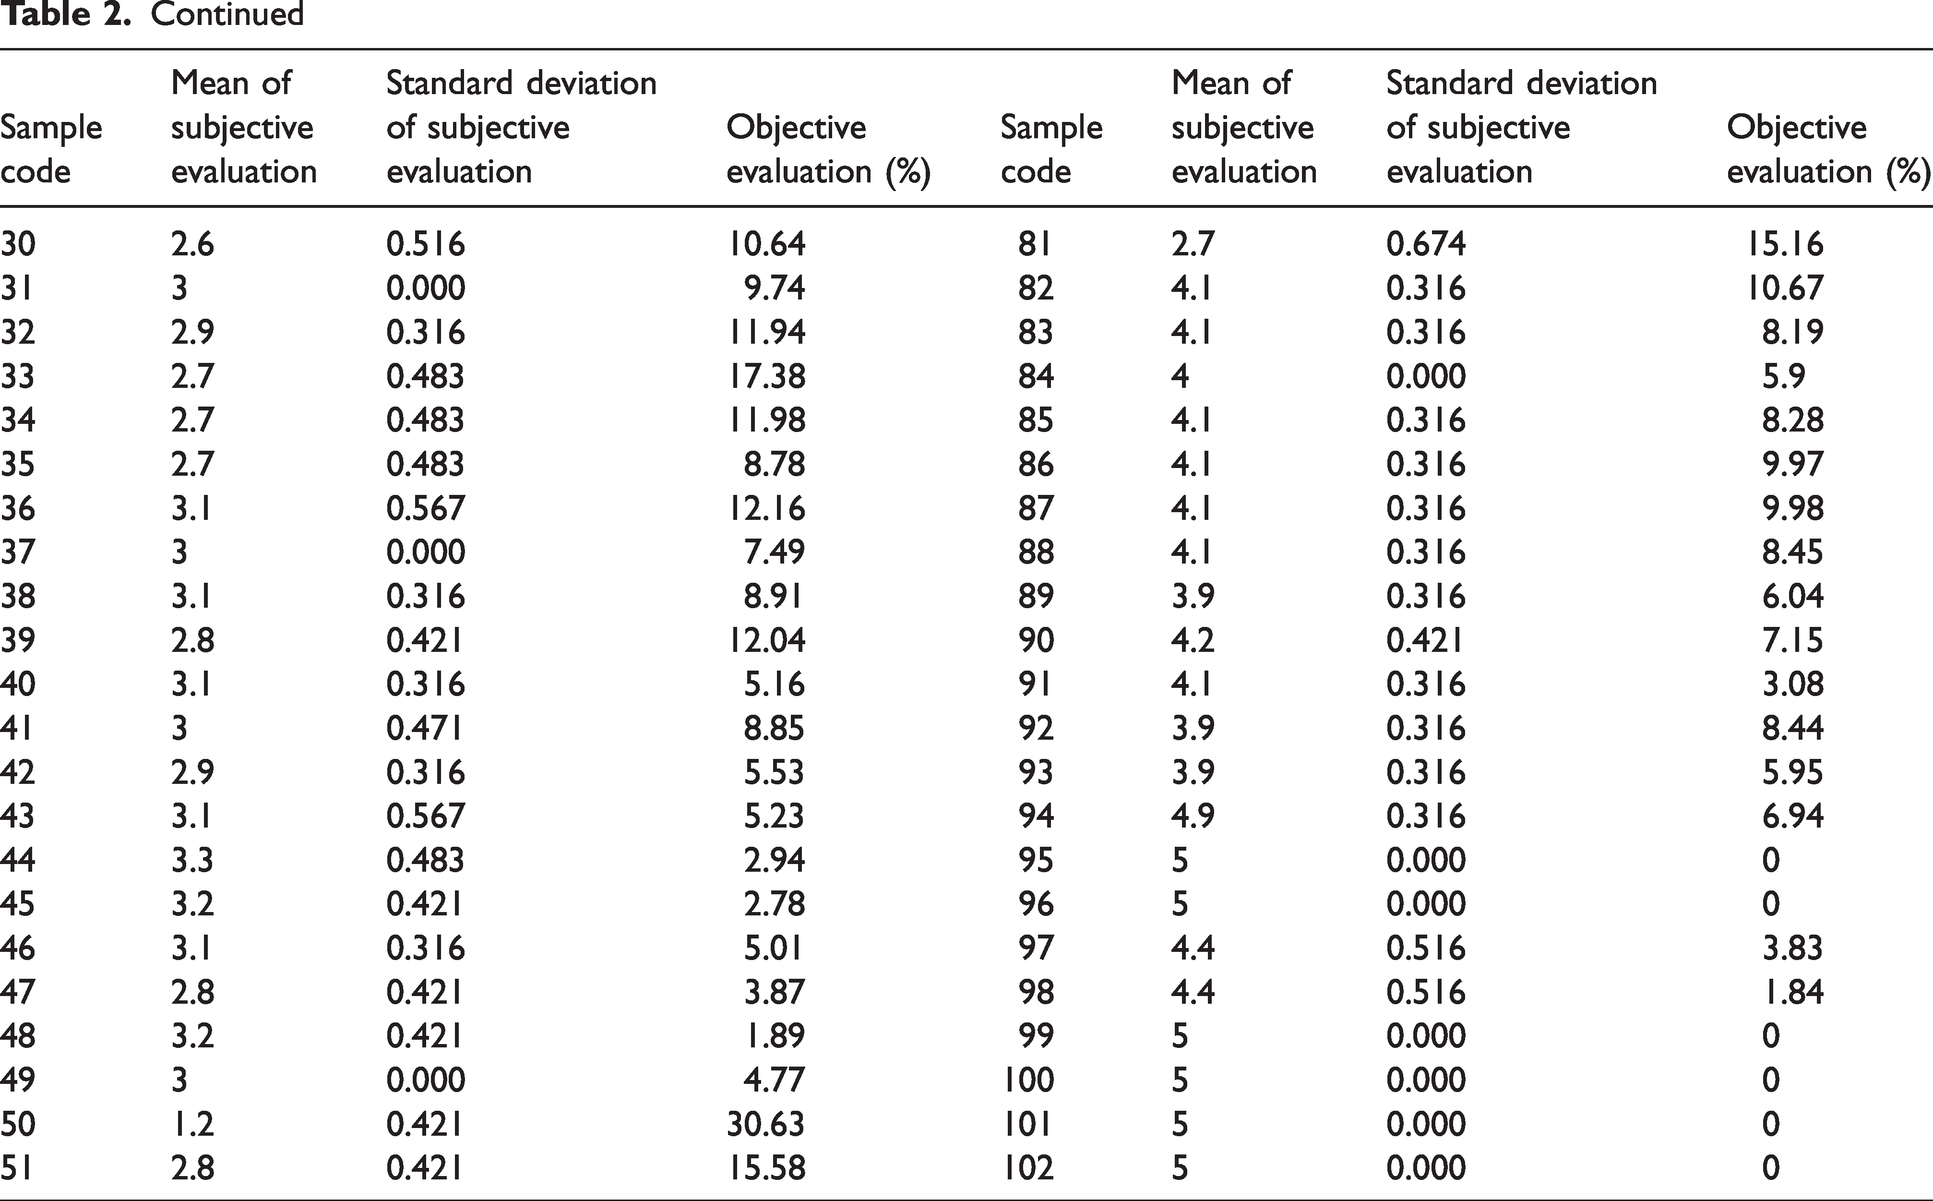
In this study, subjective evaluation was carried out by 10 different expert observers. After the test, images of the samples were captured, and wetted areas were numerically detected through image processing techniques. The objective results, along with the average values and standard deviation values of the evaluation grades provided by the 10 expert observers, are presented in Table 2.
Water repellency (spray) test results
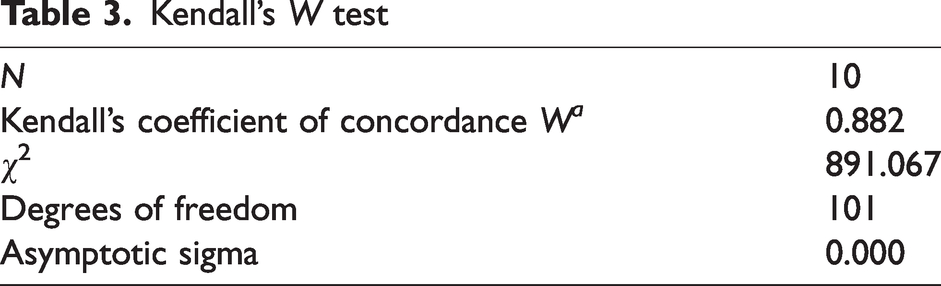
Kendall’s W (coefficient of concordance) test was applied to determine the reliability and consistency of the ordinal data provided by the observers. This statistical test is commonly used when multiple raters are involved, particularly when their ratings are on an ordinal scale, such as the 1 to 5 scale used in this study. Kendall’s W value quantifies the degree of agreement among the observers, and its range spans from 0, indicating no agreement, to 1, indicating perfect agreement. In this study, Kendall’s W concordance coefficient was found to be 0.882, which is very close to 1 and suggests a high level of agreement among the observers (Table 3). Furthermore, the result of the Kendall’s W test was statistically significant (p < 0.05), meaning that the agreement observed among the raters is unlikely to have occurred by chance. As a result of this analysis, it can be confidently stated that the evaluations made by the observers are reliable and consistent.
Kendall’s W test
Kolmogorov–Smirnov and Shapiro–Wilk tests were used to determine whether the distribution of the objective and subjective evaluation data were normal (Table 4).
Kolmogorov–Smirnov and Shapiro–Wilk tests
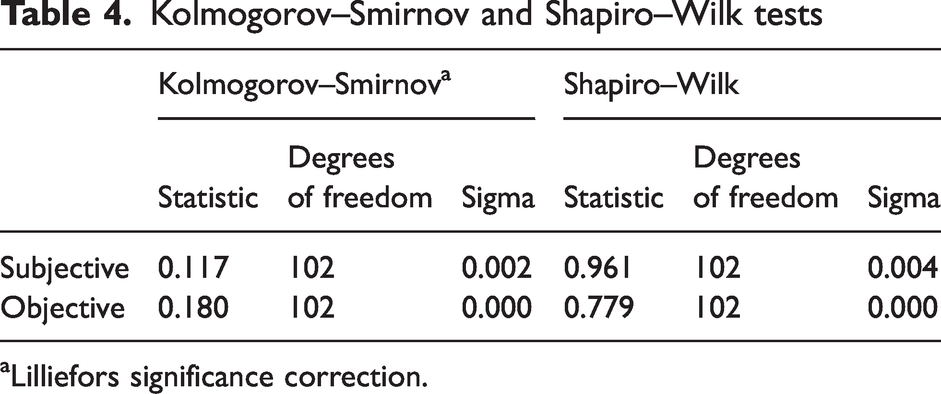
Lilliefors significance correction.
The p value of the distribution of both objective and subjective assessment data was less than 0.05 (p < 0.05; Table 4). Since the data failed to meet the assumption of normality, nonparametric tests were deemed more appropriate for analyzing the relationship between the objective and subjective evaluation results.
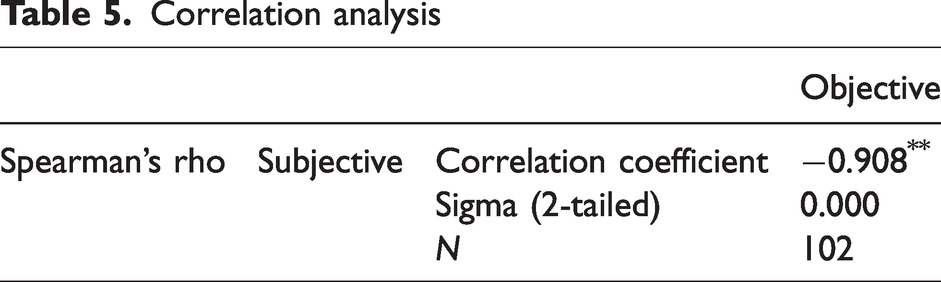
The correlation between the objective data obtained from the evaluation of wet areas and the subjective data is independent of the fabric structure. That is, the structural differences of different fabric types (such as fabric type and construction) do not influence the relationship between the objective and subjective results in the evaluation of wet areas. Therefore, in statistical analyses, the objective and subjective evaluation data of both cotton and polyester fabrics were combined and evaluated without considering the differences between fabric types. To examine the correlation between the objective and subjective data, Spearman’s rho was employed (Table 5). This analysis is crucial because it enables the determination of whether the subjective evaluations performed by the observers are consistent with the objective measurements, providing insights into the reliability and validity of the evaluation process. If a strong positive correlation is found between the two sets of data, it would suggest that the subjective ratings correspond closely with the objective measurements, further supporting the reliability of the evaluation method. Accordingly, a significant positive correlation was found between objective and subjective values (p < 0.01). The negative relationship between the objective and subjective evaluation data was found (r = −0.908). The reason for the negative correlation is that in the ISO shower test rating cards, a grade of 5 indicates no wetness, whereas in the objective evaluation results, the value increases as the wet area increases.
Correlation analysis
A scatter plot is used to visually present the comparison and correlation between the objective and subjective evaluation data. This graph clearly illustrates the relationship between the two datasets (Figure 7). In line with the results of the correlation analysis, the scatter plot shows a strong negative correlation between the objective and subjective values, as well as indicating that the data are consistently aligned with each other. This finding is significant as it demonstrates the extent to which the two types of evaluations overlap, highlighting the consistency of the evaluation process.
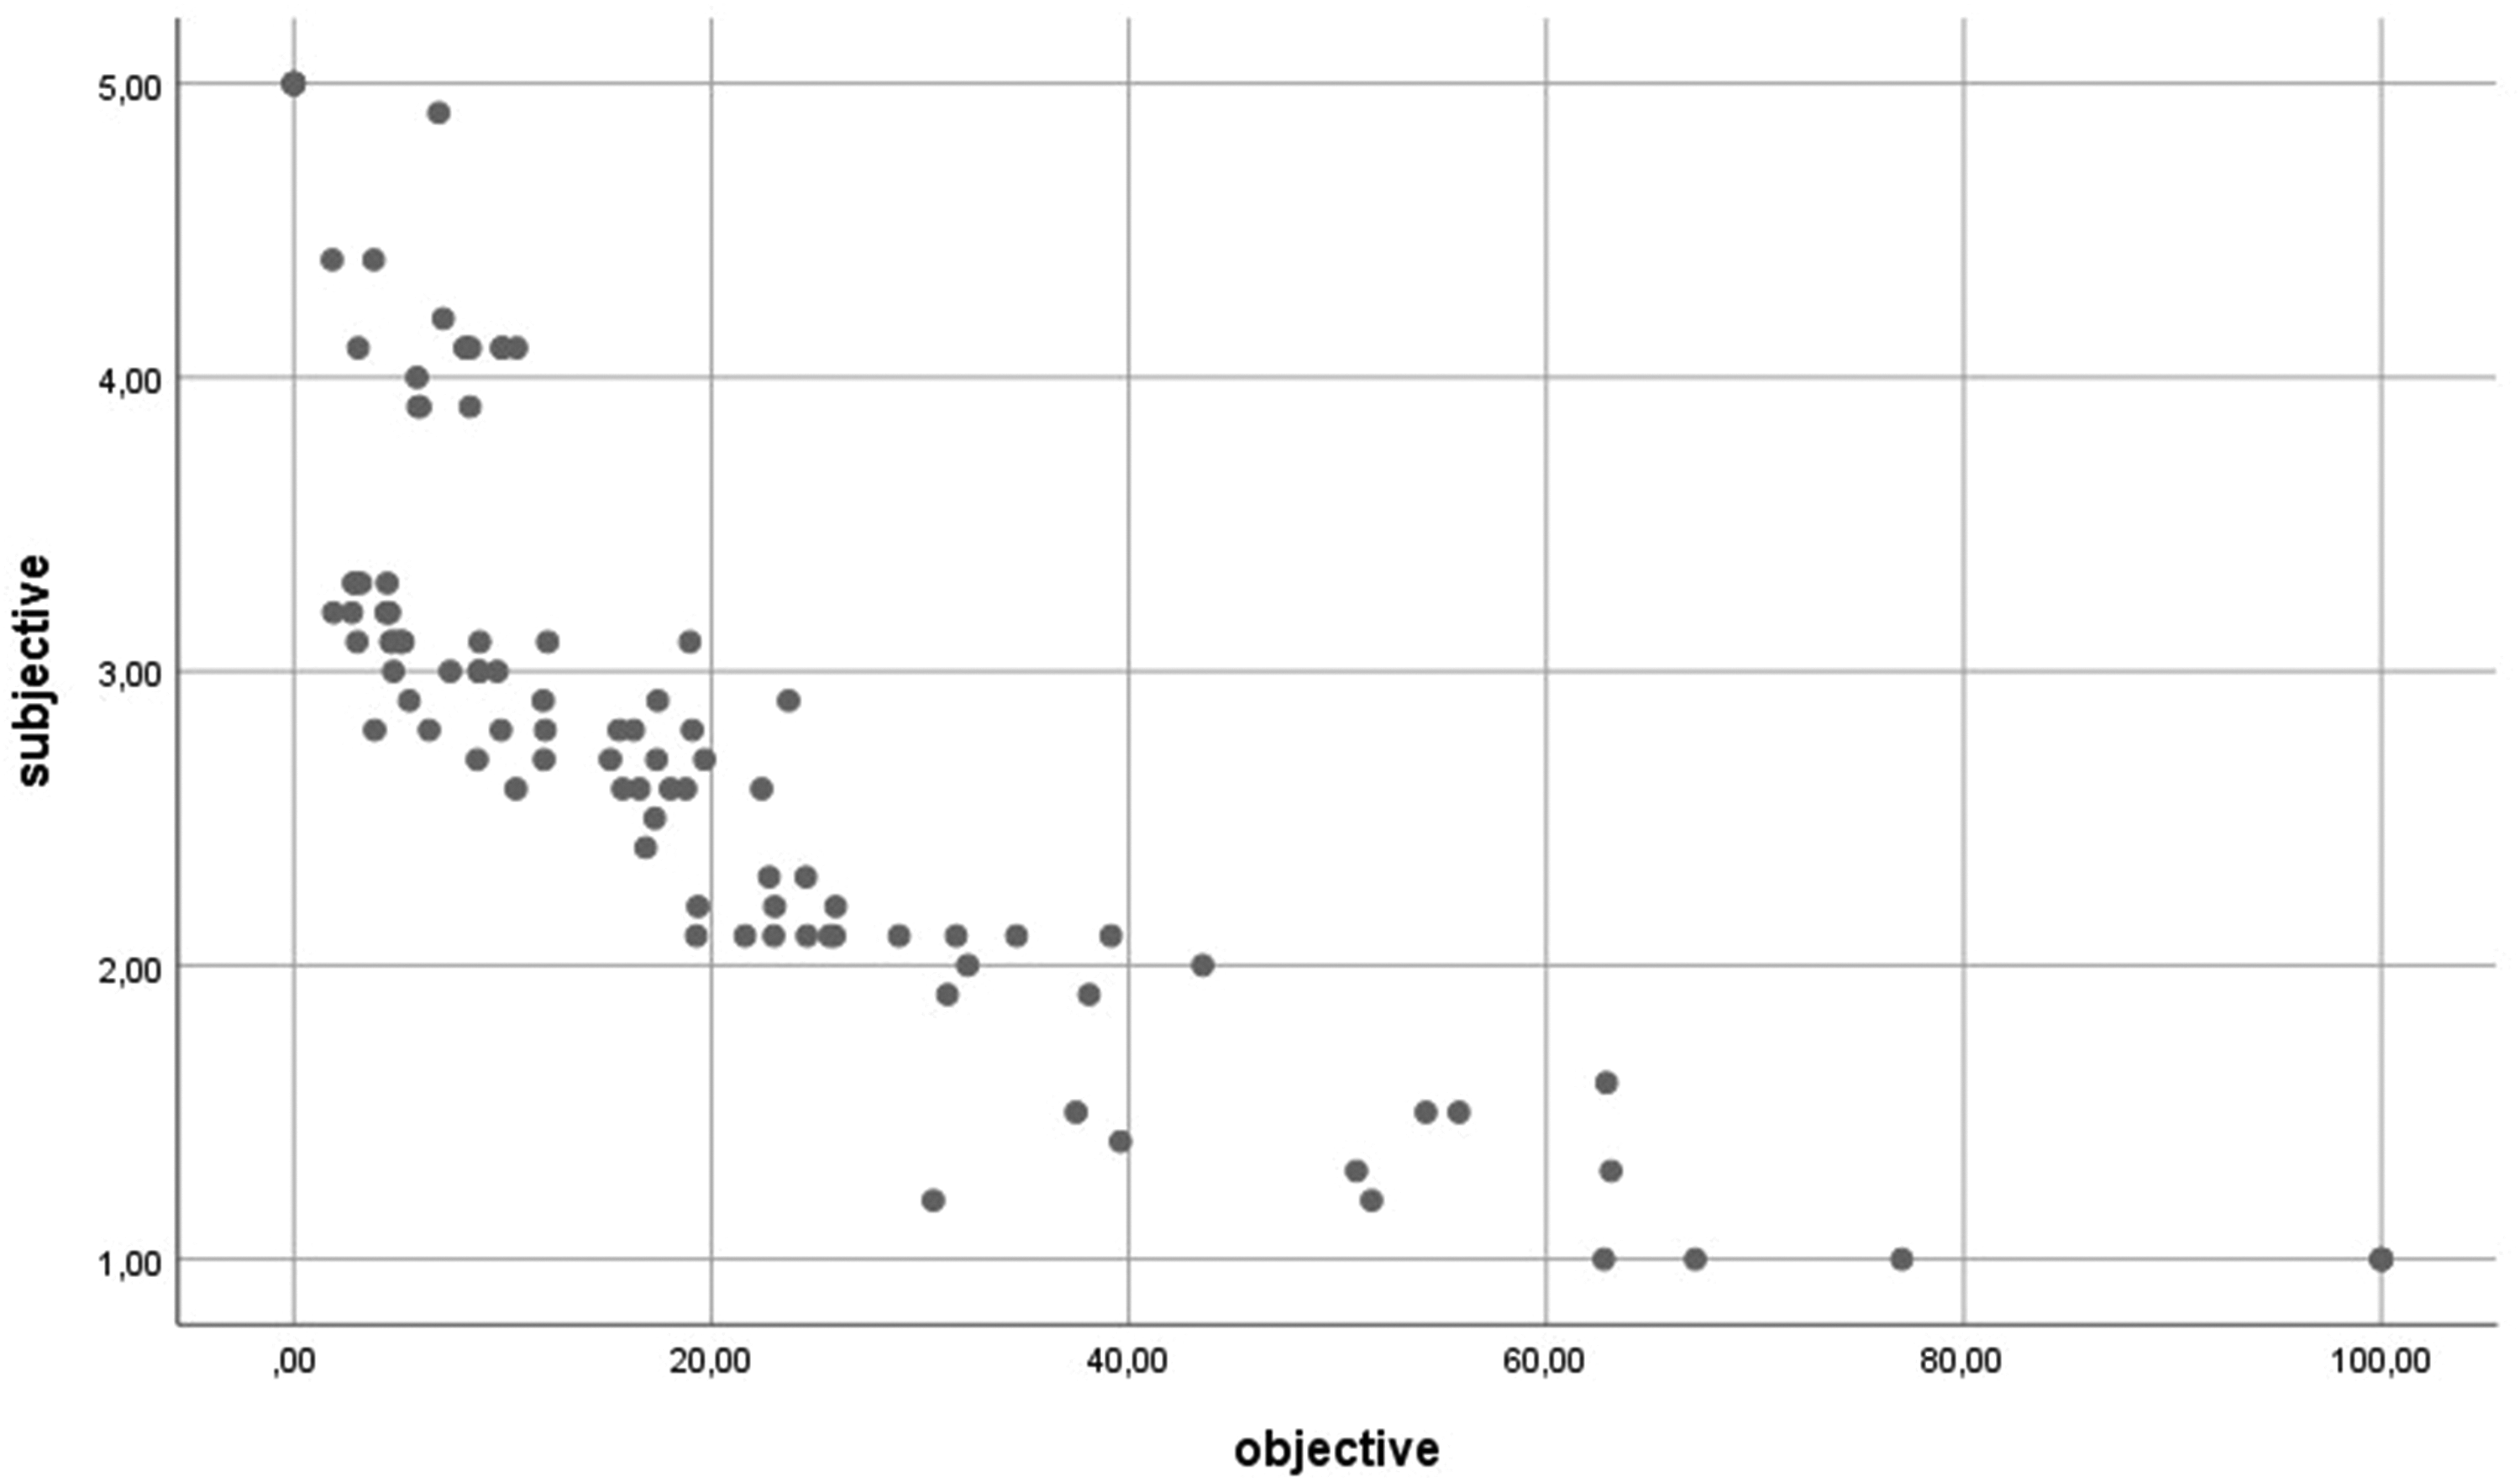
Scatter plot.
Conclusion
The spray test method (spray water repellency test) is a technique used to measure the resistance of fabrics to wetting. The spray water repellency test evaluation is conducted subjectively using ISO shower test rating cards in accordance with the ISO 4920:2012 standard. According to this standard, five different grades are used to evaluate the resistance of the samples to surface wetting. During the evaluation stage of the test, the observer may sometimes be undecided between two or three assessment levels when rating the wet area pattern of the sample. In this study, images of the samples were captured after the spray test, and these images were subjectively evaluated by 10 expert observers. Upon examining the subjective evaluation results, it was observed that the observers assessed the same sample differently. However, the agreement among the observers was analyzed using Kendall’s W test, and it was found that the level of agreement between the observers’ evaluations was very high (W = 0.882). After the test, the images were processed to numerically detect the wetted areas. When the correlation between the objective and subjective evaluation data was examined, a strong negative correlation was observed (r = −0.908). This negative correlation is due to the fact that, according to ISO shower test rating cards, as the wetted area increases, the evaluation rating decreases. The strong correlation between the two datasets indicates that the objective evaluations closely align with the subjective measurements.
Footnotes
Acknowledgment
The water-repellent finishing chemical utilized in this study was generously provided by Ecopol Chemical. We sincerely thank the company for their valuable contributions.
Declaration of conflicting interests
The author(s) declared no potential conflicts of interest with respect to the research, authorship, and/or publication of this article.
Funding
The authors disclosed receipt of the following financial support for the research of this article: This work was supported by the Çukurova University Scientific Research Projects Unit (grant number FBA-2021-12892).