
Abstract
Multilayer reinforcement fabrics are increasingly used for manufacturing structural polymer composites. In liquid molding processes, dry reinforcement fabrics are draped on a mold first, and infused with a liquid resin such as an epoxy in a subsequent manufacturing step. This presents major advantages in terms of operational flexibility and costs. However, draping multilayer reinforcement fabrics on complex mold geometries is challenging. Small radius mold corners constitute a major manufacturing challenge as they lead to variability in dry fabric positioning and resin-rich corners in polymer composite parts. Spring-back of fabrics bent over or into single curvature mold corners is a widespread industrial concern. However, contrary to draping over double-curvature surfaces, bending spring-back from convex or concave single-curvature corners has received very limited attention. No testing method is available. This paper quantifies reinforcement fabric bending spring-back. Single and multiple layer stacks were bent along three directions over convex and into concave 90° corners with five radii spanning 1.59 mm to 12.70 mm. In all cases, five replicated tests enabled variability quantification. Fabric stacks were also quantified using cantilevered bending tests for comparison purposes. Mold radius was found to affect the behavior to a larger extent than testing direction, number of layers or use of a binder.
Polymer matrix composite (PMC) liquid molding processes, in which dry reinforcement fabrics are first draped onto a mold and liquid resin is infused in a subsequent step, offer many advantages. However, draping multilayer reinforcement fabrics on complex mold geometries is challenging. Spring-back from bending dry fabrics over or into small radius mold corners is a widespread industrial concern as it induces variability in fabric positioning. Once the mold is closed prior to infusion, correct fabric positioning and conforming cannot be verified. Poor fabric positioning can lead to PMC parts with resin-rich corners, or to defective parts altogether. PMC manufacturing loses consistency, making process simulations inaccurate or irrelevant. Furthermore, bending spring-back is consistent for some reinforcement fabrics and highly variable for others. Fabric forming over double curvature surfaces such as hemispheres, paraboloids and box corners, in which the main deformation mode is in-plane shear, was studied extensively.1,2 On the contrary, spring-back of single and multiple layer stacks of reinforcement fabric bent over convex or into concave small radius single curvature corners is not documented in the literature, and has received very limited attention. No accepted or relevant test method is available for fabric reinforcements.
This paper quantifies bending spring-back for single and multiple layer stacks of reinforcement fabrics bent over concave and into convex small radius corners. Bending spring-back testing methods are introduced and used for quantifying behavior observed in industrial production. In all tests, fabrics were positioned on a simulated mold corner, an initial fabric position was measured, boundary conditions corresponding to bending on draping were applied and released, and a final fabric position was measured after a set time. Tests were conducted over convex and concave 90° corners with five radii spanning 1.59 mm to 12.70 mm. Single and multiple layer stacks were tested along three directions; in all cases, five replicated tests enabled variability quantification. All fabric stacks were also quantified using classic large radius cantilevered bending tests for comparison purposes.
Literature
Different approaches were used for probing the single curvature bending stiffness of fabrics. Peirce devised a test in which a fabric bends under its own weight over a 41.5° incline.
3
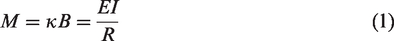
Modeling the fabric as a linear elastic beam subjected to a uniform load, bending stiffness is calculated as

The Kawabata evaluation system (KES) features five tests quantifying the mechanical behavior of fabrics. 5 In the KES bending test a 20 cm wide sample is bent using clamps positioned 1 cm apart along the fabric. Once the sample reaches maximum curvature it is straightened and bent in the opposite direction; sample deformation is controlled at all times. Parameters quantified are the bending stiffness normalized by sample width B (gf · cm2/cm) and bending moment hysteresis 2HB (gf · cm/cm).
KES is widely used in the garment textile industry but usage with reinforcement fabrics has been limited. Yu et al. 6 used KES for characterizing three carbon fiber fabrics: a plain weave, a five harness satin and an angle-lock interwoven were tested along the warp, weft and bias, with the bias direction defined as the bisector between warp and weft. Hysteresis was observed in all tests. Response was nonlinear as well as rate and time dependent, hence quantifying parameters at set curvature values is arbitrary. Lomov et al. 7 used KES for testing a biaxial carbon fiber fabric at [+45/−45] and at [0/90], and a quadriaxial carbon fabric [0/−45/90/+45] in the machine, cross, bias +45° and bias −45° directions. All results were obtained under constrained, low load conditions.
Reinforcement fabrics show bending spring-back, although this has not been reported in the literature. However, related behavior was studied for clothing fabrics: wrinkle recovery, defined as the ability of a fabric to recover from being folded.
8
Standards ISO 2313
9
and AATCC 66
10
quantify wrinkle recovery angles of fabrics using the Shirley tester. A piece of fabric is folded and the tester measures the angle at which the fabric springs back. A rheological model of crease recovery behavior was proposed in which the fabric is modeled as a linear elastic component parallel with a frictional constraint component.
11
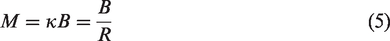
The linear elastic component is linearly proportional to bending stiffness:
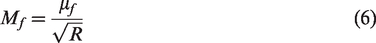
The frictional constraint moment is assumed proportional to the square root of the bending curvature with μf introduced as a frictional constraint coefficient:
Using an energy method, the crease recovery force is expressed as

Wang et al. 12 measured dynamic wrinkle recovery angles. Force was applied for 5 min and the recovery angle was measured at different points in time. In a subsequent study, Kawabata bending stiffness and hysteresis of fabrics were found to correlate well with initial angular velocities obtained from dynamic wrinkle recovery angle tests. 6 However, the same parameters did not correlate with the final angle.
Standards ISO 2313 9 and AATCC 66 10 state that wrinkle recovery should be measured along the warp and weft. This does not represent the full creasing behavior, as creases often are not aligned with either warp or weft yarns. Fridrichova and Zelova 13 tested creasing behavior off the warp and weft directions, and proposed a crease recovery coefficient for multiple directions. The authors found that different weave types lead to different wrinkle recovery angles.
Experimental section
Materials
Four fabrics were tested. Fabric 1 is a plain weave glass fiber fabric made from 2.2 k yarns with warp and weft yarn counts 6.3 and 5.5 yarns/cm, typical yarn width 1.4 mm, surface density 325 g/m2, manufacturer specified thickness 0.28 mm, tested as one and four layer stacks. Fabric 2 is a 8 HS satin glass fiber fabric made from 0.55 k yarns with warp and weft yarn counts 22.4 and 21.3 yarns/cm, typical yarn width 0.45 mm, surface density 303 g/m2, manufacturer specified thickness 0.23 mm, tested as one and four layer stacks. Fabric 3 is a 4 HS satin carbon fiber fabric made from 2.2 k yarns with warp and weft yarn counts 4.9 yarns/cm, typical yarn width 2.0 mm, surface density 196 g/m2, manufacturer specified thickness 0.25 mm, tested as one and three layer stacks. Fabric 4 is the same as fabric 3 with micronized phenoxy powder binder applied at 3.0 g/m2 per layer, activated on individual flat layers in the 75°C to 80°C range using an infrared lamp, and cooled. Testing for fabric 4 was conducted for one and three layer stacks.
Methods
Two test methods were developed for characterizing fabric spring-back over convex and concave mold corners. Fabric stacks were bent 90° over simulated mold radii (SMR) of 1.59 mm, 3.18 mm, 6.35 mm, 9.53 mm, and 12.70 mm, (1/16″, 1/8″, 1/4″, 3/8″, 1/2″) (see Figure 1).
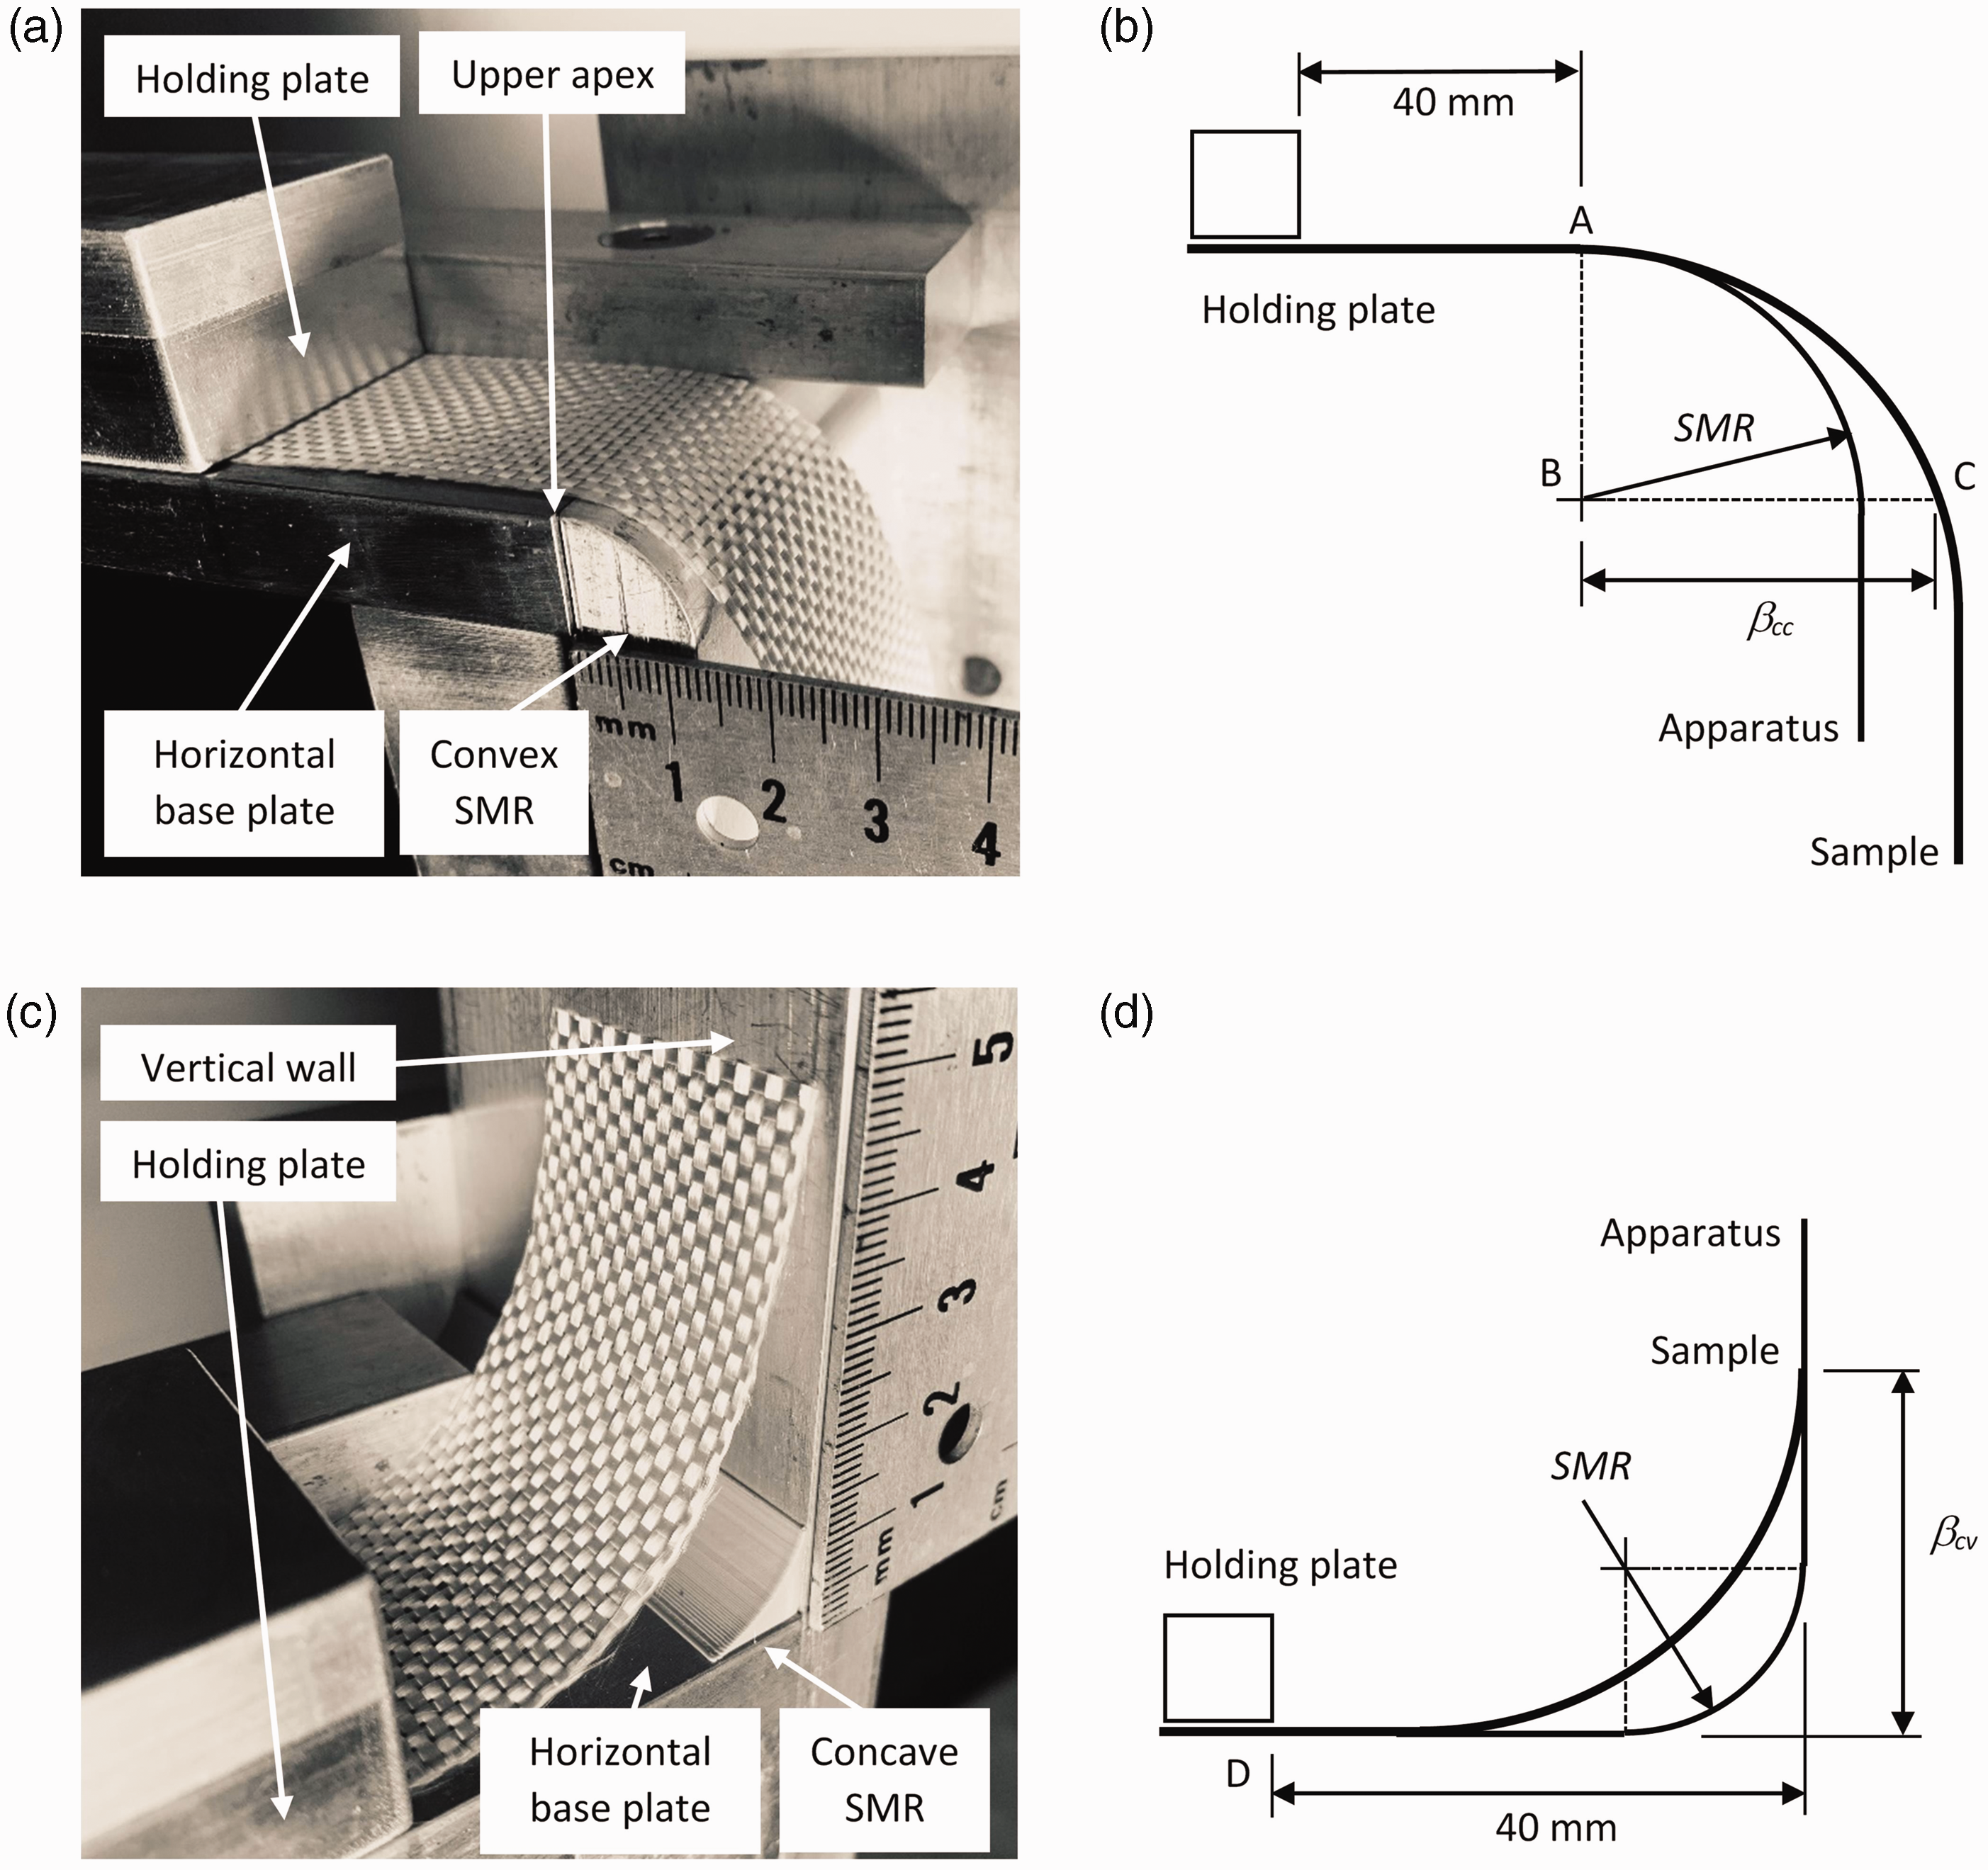
Bending spring-back testing method: (a) sample and apparatus, convex; (b) measured length βcv, convex; (c) sample and apparatus, concave and (d) measured length βcc, concave.
Bending spring-back over convex corners was characterized as shown in Figure 1(a). A single or multiple layer fabric sample with length 300 mm and width 25 mm was placed on a horizontal base plate, with its side aligned with the upper apex of the convex SMR, point A in Figure 1(b). The 25 mm sample width is the same as recommended in standards ASTM D1388 14 and F3260, 15 while its freestanding length is far shorter. The sample was gently slid horizontally by 100 mm beyond the upper apex of the convex SMR, leaving it to overhang in a procedure comparable to those in Peirce, 3 and standards ASTM D1388 14 and F3260, 15 as shown in Figure 2(a). The sample was held in this position under a holding plate located 40 mm from the apex to prevent it from interfering with the bending portion of the sample (see Figure 1(a)). At this stage, the sample is in its initial position. The fabric sample was then conformed to the convex SMR and vertical plane of the rig using a flat conforming plate (see Figure 2(b)). The plate was held in position for 15 s and removed, allowing the fabric to spring back. This step aimed at emulating manual draping operations in a reproducible manner. The holding time was selected from experimental evidence that spring-back typically settles well within this delay;9,10,12 and also from experimental evidence. The stabilized horizontal distance βcc from the center point of the convex SMR to the centerline of the overhanging fabric, respectively points B and C in Figure 1(b), was measured after 30 s in this final fabric position (see Figure 2(c)). Measurements were made by locating the centreline of samples using image analysis of photographs of higher magnification than presented in Figure 2 for illustration purposes. Measurements were performed along the warp, weft and bias direction defined as the bisector between warp and weft, similar to that in Yu et al., 6 and better than that in standards ISO 2313 9 and AATCC 66; 10 however, contrary to the KES bending test,6,7 all initial and final configurations resulted from fabric behavior only instead of being imposed by the testing apparatus.
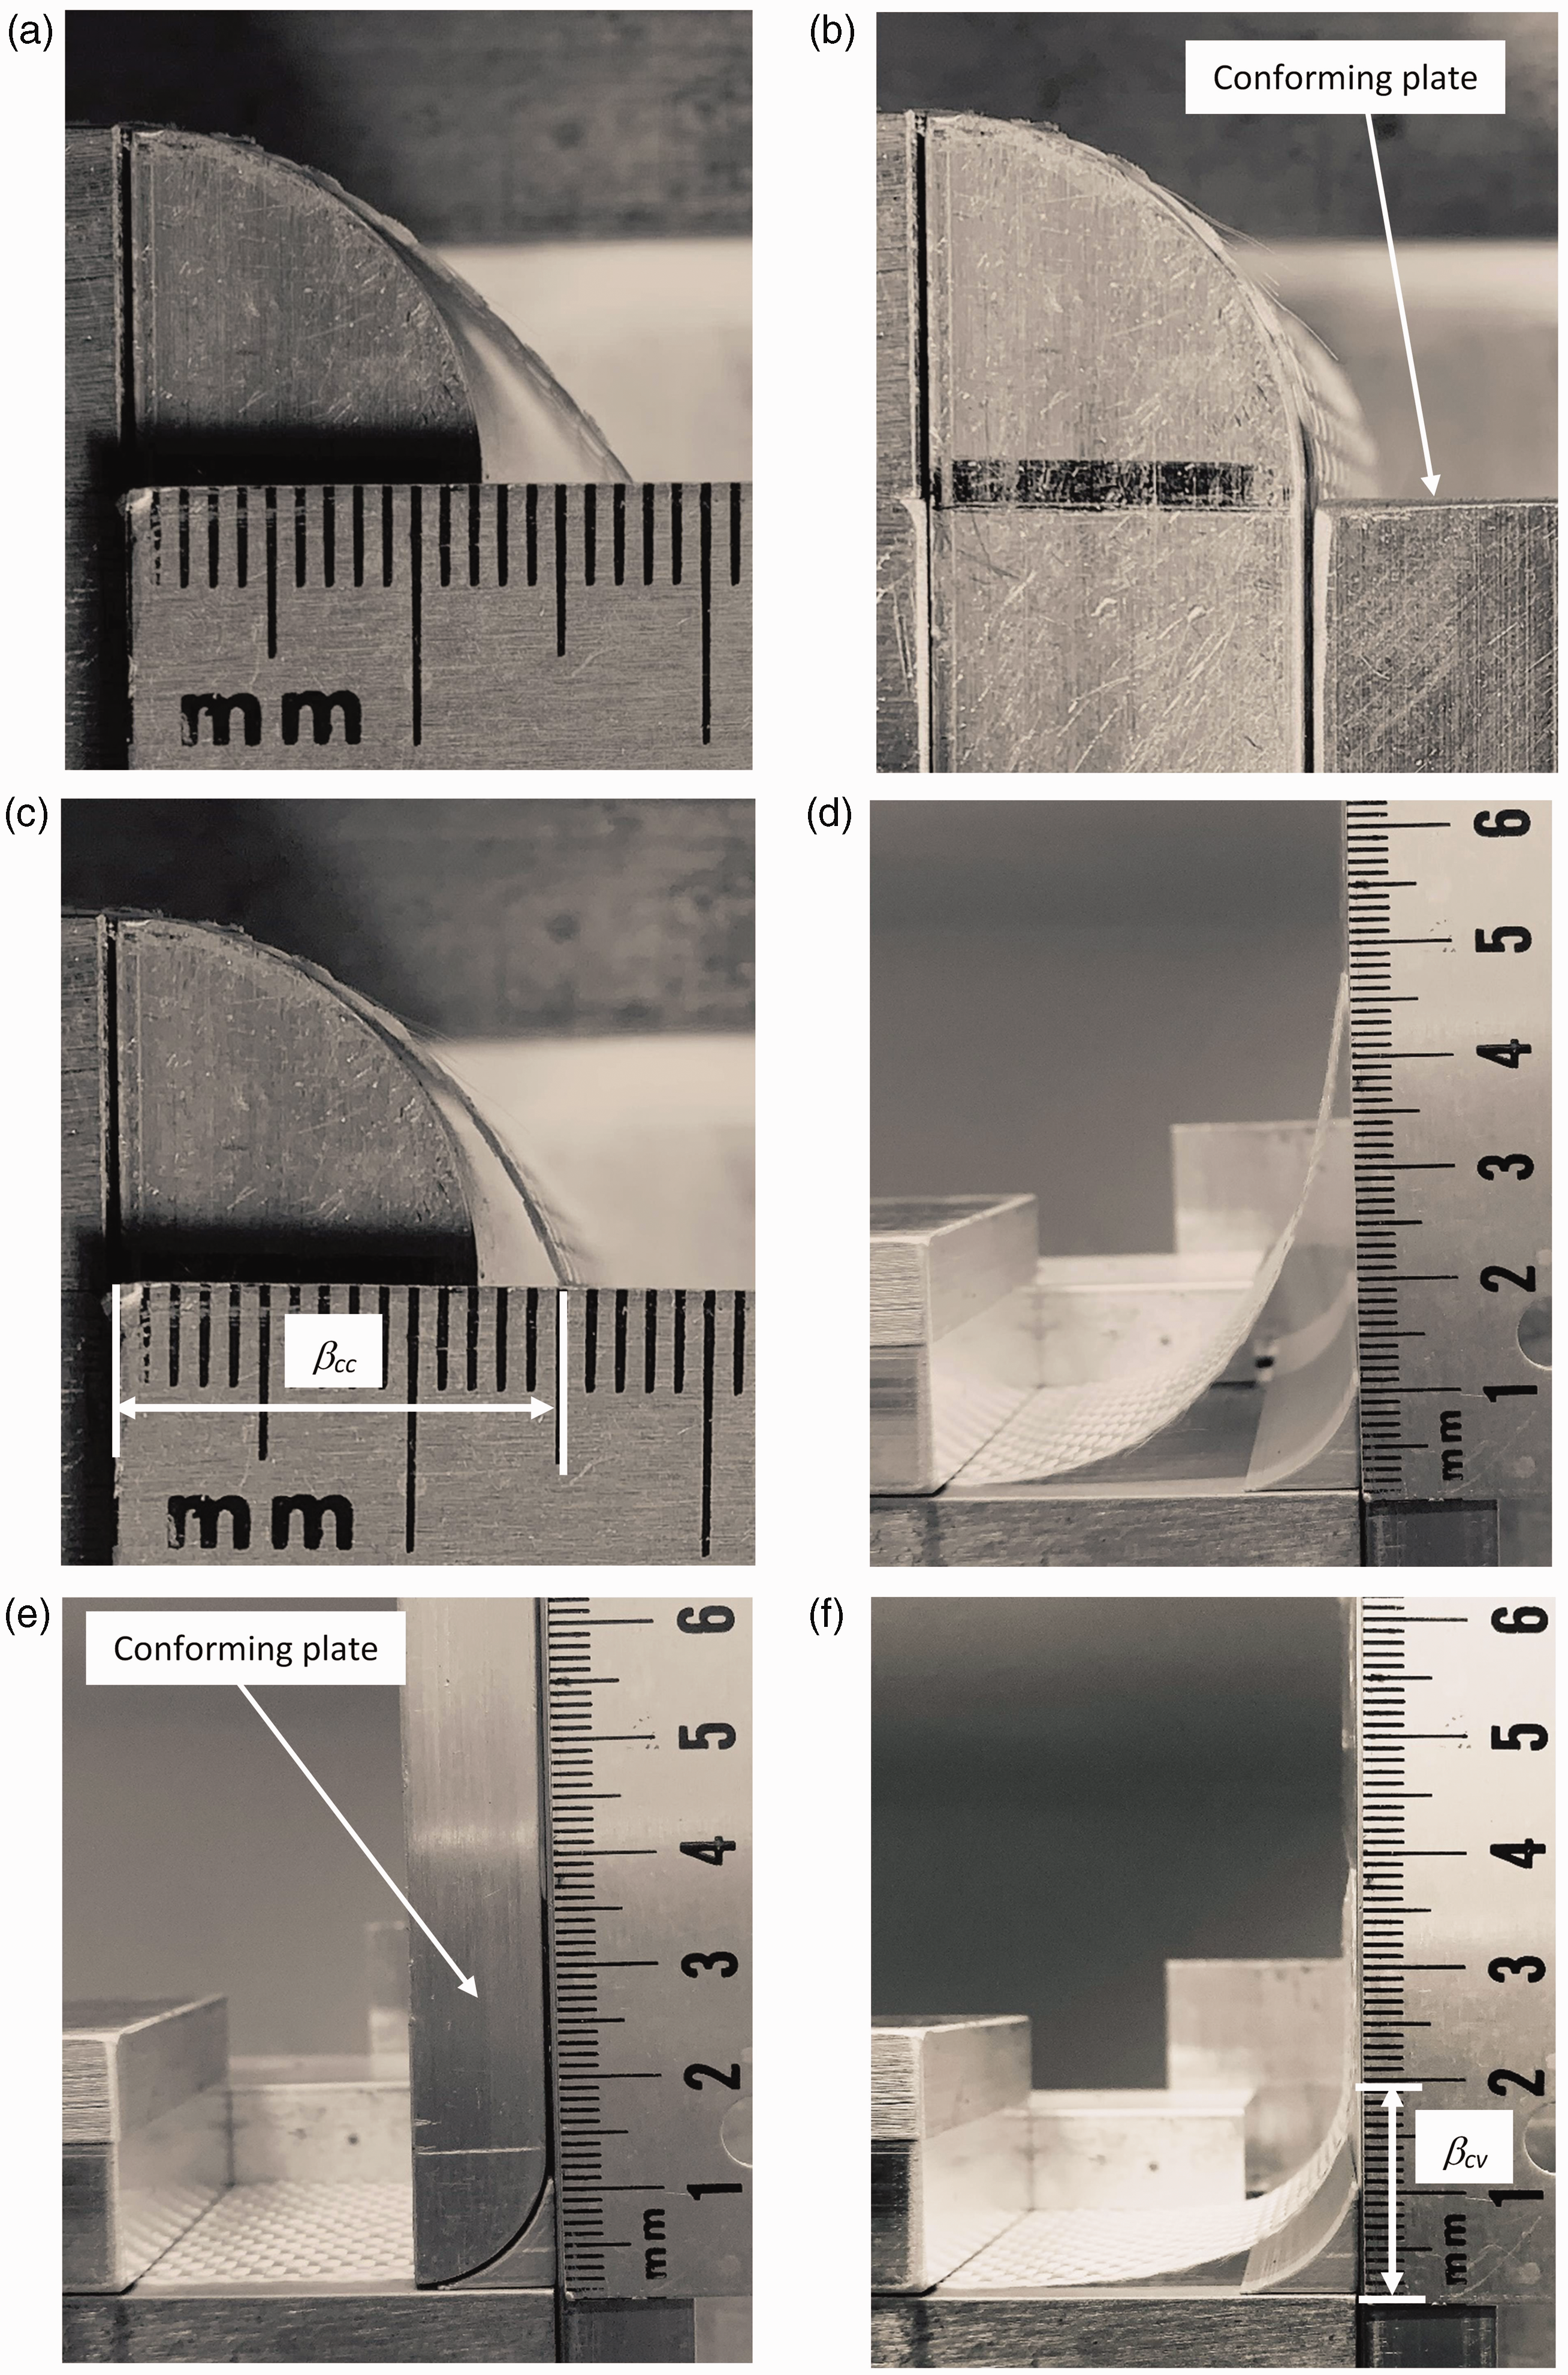
Bending spring back measurement with sample: (a) in initial position, convex; (b) under conforming plate, convex; (c) in stabilized final position, convex; (d) in initial position, concave; (e) under conforming plate, concave and (f) in stabilized final position, concave.
Bending spring-back into concave corners was characterized as shown in Figure 1(c). A single or multiple layer fabric sample with identical dimensions was placed on a horizontal base plate with its side aligned 40 mm from the vertical wall, point D in Figure 1(d). The sample was slid horizontally for 40 mm while gently lifting its edge in order to avoid the concave SMR, bringing it in a position where it would have touched the vertical wall in the absence of the concave spring-back ratio (SBR). The sample was then slid in the same direction for a further 40 mm, still gently lifting its edge. The fabric sample was kept in this position under a holding plate located 40 mm from the vertical wall, as in Figure 2(d). At this stage, the sample is in its initial position. The fabric sample was then conformed to the concave SMR and the vertical plane of the rig using a matching convex conforming plate (see Figure 2(e)). The plate was held in position for 15 s and removed, allowing the fabric to spring back. The stabilized vertical distance βcv from the horizontal base plate to the first contact between the fabric sample and vertical plane wall was measured after 30 s in this final fabric position (see Figure 2(f)). Measurements were made from image analysis in a similar manner.
Single and multilayer stacks of all fabrics were tested five times over five convex and into five concave radii along the warp, weft and bias directions for fabrics 1 to 3, and along the warp and weft directions for fabric 4. Measurements were normalized with respect to SMR radius to enable dimensionless comparisons through the SBR, as

Measurements of the cantilevered, large radius fabric bending stiffness were conducted for informing spring-back results. ASTM standards D1388
14
and F3260
15
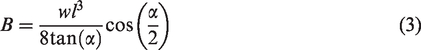
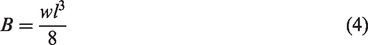
both use a cantilevered bending rig with a fabric sample bent under its own weight. However, their definitions of bending stiffness differ. In standard D1388, B is calculated as
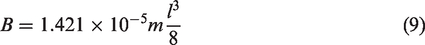
Five replicate tests were conducted for each individual combination of fabric, direction, number of layers and SMR, for convex bending spring-back tests, concave spring-back tests, and cantilevered bending tests. Error bars in histograms of property values represent one standard deviation of five repetitions. Tukey’s range test and the honestly significant difference (HSD) 17 were used for pairwise comparisons of the properties of single layer fabrics, multilayer fabric stacks, and single layer versus multiple layers of each fabric. Differences between averages smaller than HSD indicate no statistically significant difference between groups. HSD values are presented graphically. When single layers of four fabrics are compared, three independent comparisons can be made, hence three HSDs are shown. Similarly, when multiple layers of four fabrics are compared, three independent comparisons can be made, hence three HSDs are shown. In both cases, HSD values are shown between fabrics with the closest property averages. When single layers and multiple layers are compared for four fabrics, four independent comparisons can be made, hence four HSD values are shown. In this case, one HSD value is shown for each comparison.
Results
Cantilevered bending
The bending stiffness of single and multilayered fabrics was measured along the warp, weft, and bias directions for fabrics 1, 2 and 3, and along the warp and weft for fabric 4. Multilayered stacks featured four layers for fabrics 1 and 2, and three layers for fabrics 3 and 4. Each test was replicated five times. The average values and standard deviations appear in Figure 3. Different stiffness values were observed along different directions for all fabrics. The same patterns repeated for average values of single and multiple layers of each fabric; differences were contained within standard deviation limits for fabrics 1 and 2. Carbon fabrics were stiffer than glass fabrics, and the binder increased stiffness from fabric 3 to fabric 4. All ratios of multilayer to single layer bending stiffness values approached the corresponding ratios of number of layers, as presented in Table 1.
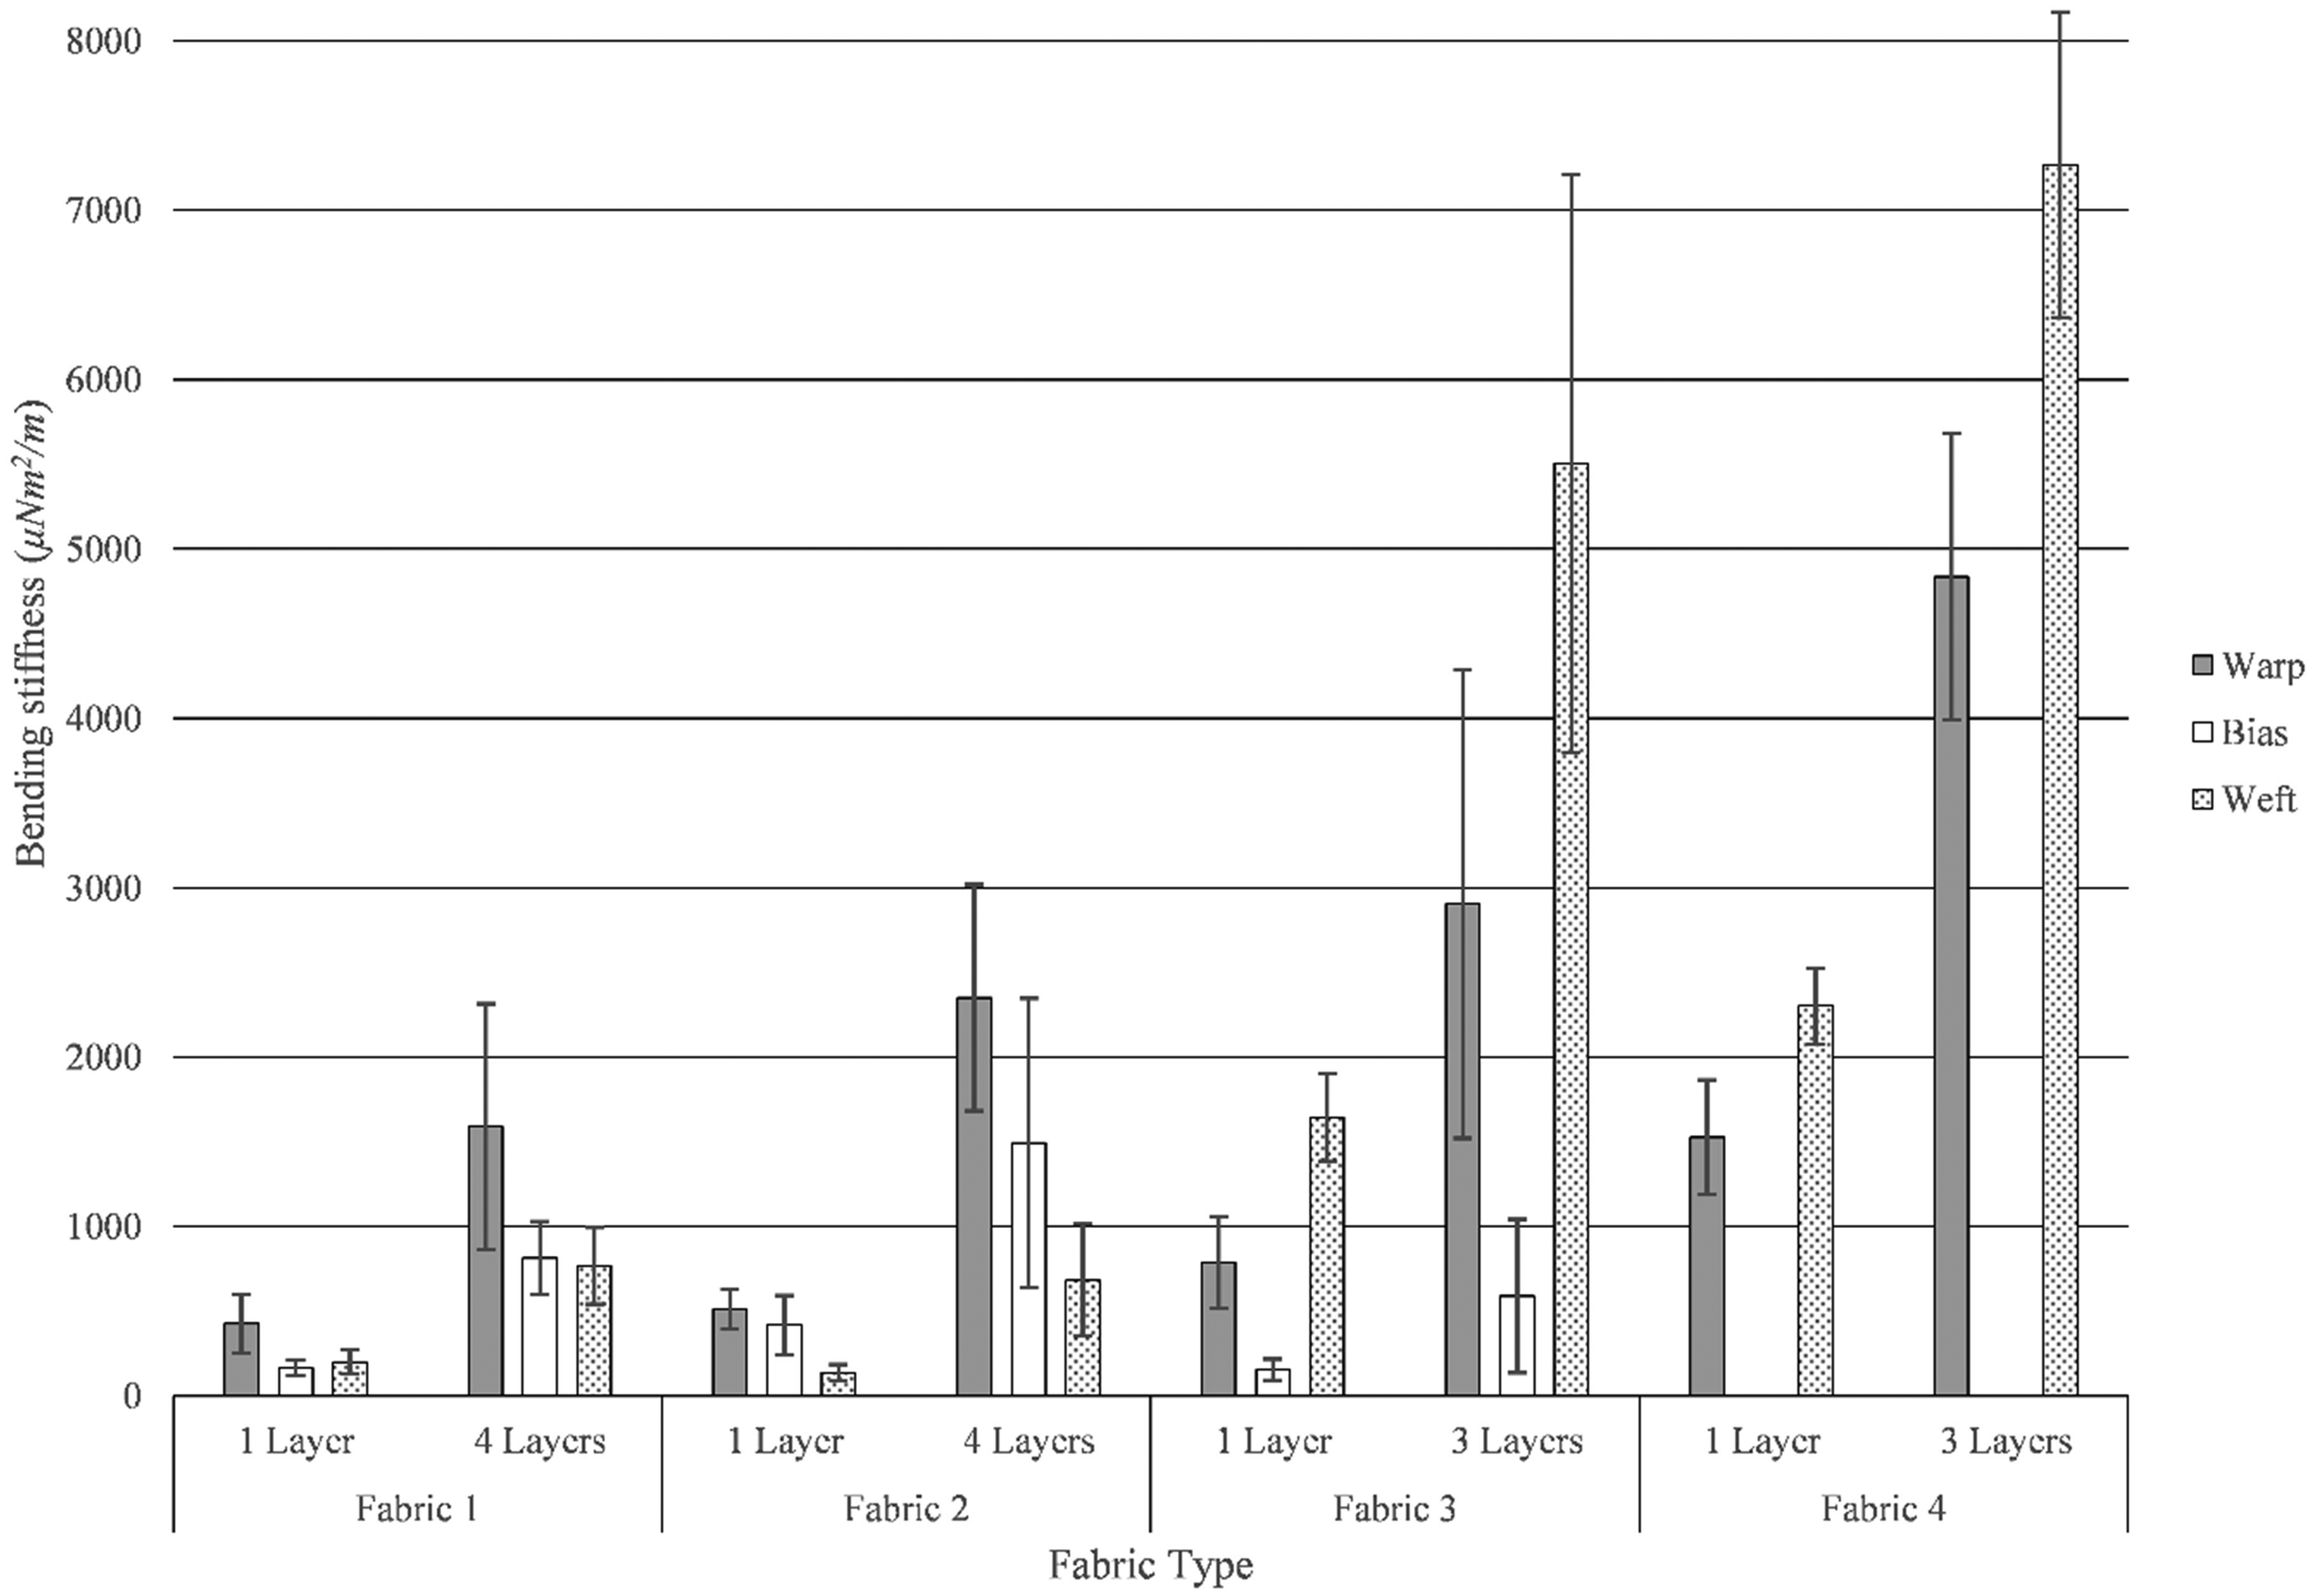
Bending stiffness data.
Ratios of multilayer to single layer bending stiffness values
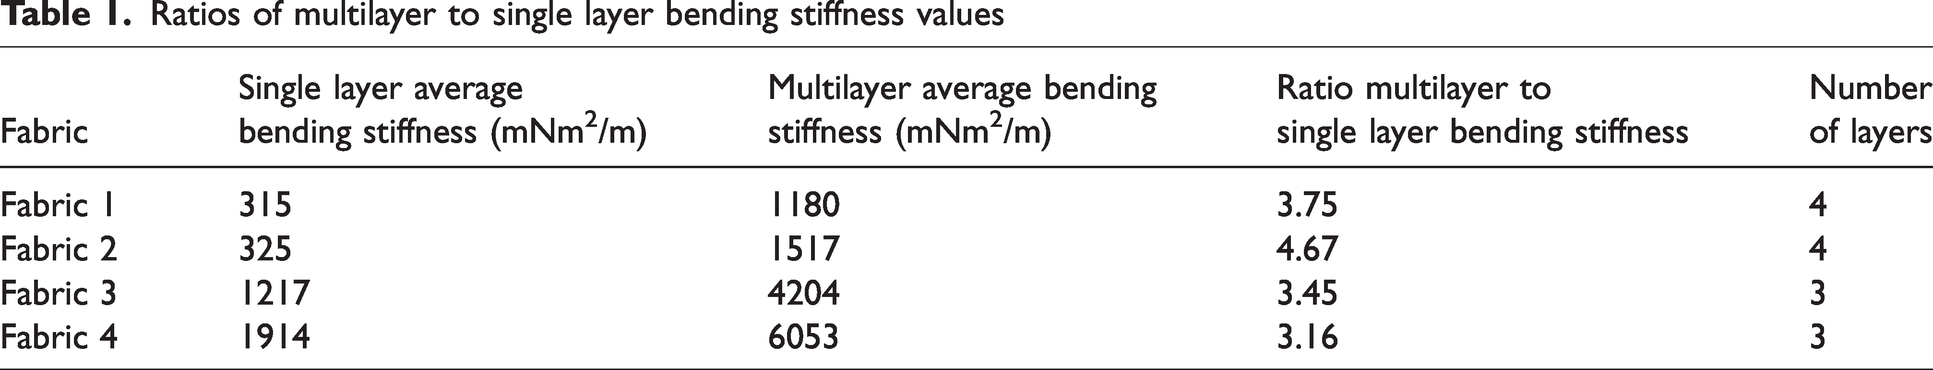
Pairwise comparisons of bending stiffness values of single layer fabrics, multilayer fabrics, and single versus multiple layers stacks appear in Figure 4. HSD values are represented by grey bars, with differences between averages larger than HSD indicating a statistically significant difference between groups. For both single layer and multiple layer stacks shown in Figure 4(a) and (b), respectively, bending stiffness values were not detectably different for fabrics 1 and 2, while all other pairwise comparisons involving fabrics 3 and/or 4 were detectably different. Bending stiffness values of single and multilayer stacks of each fabric were detectably different for all fabrics as expected, as shown in Figure 4(c).
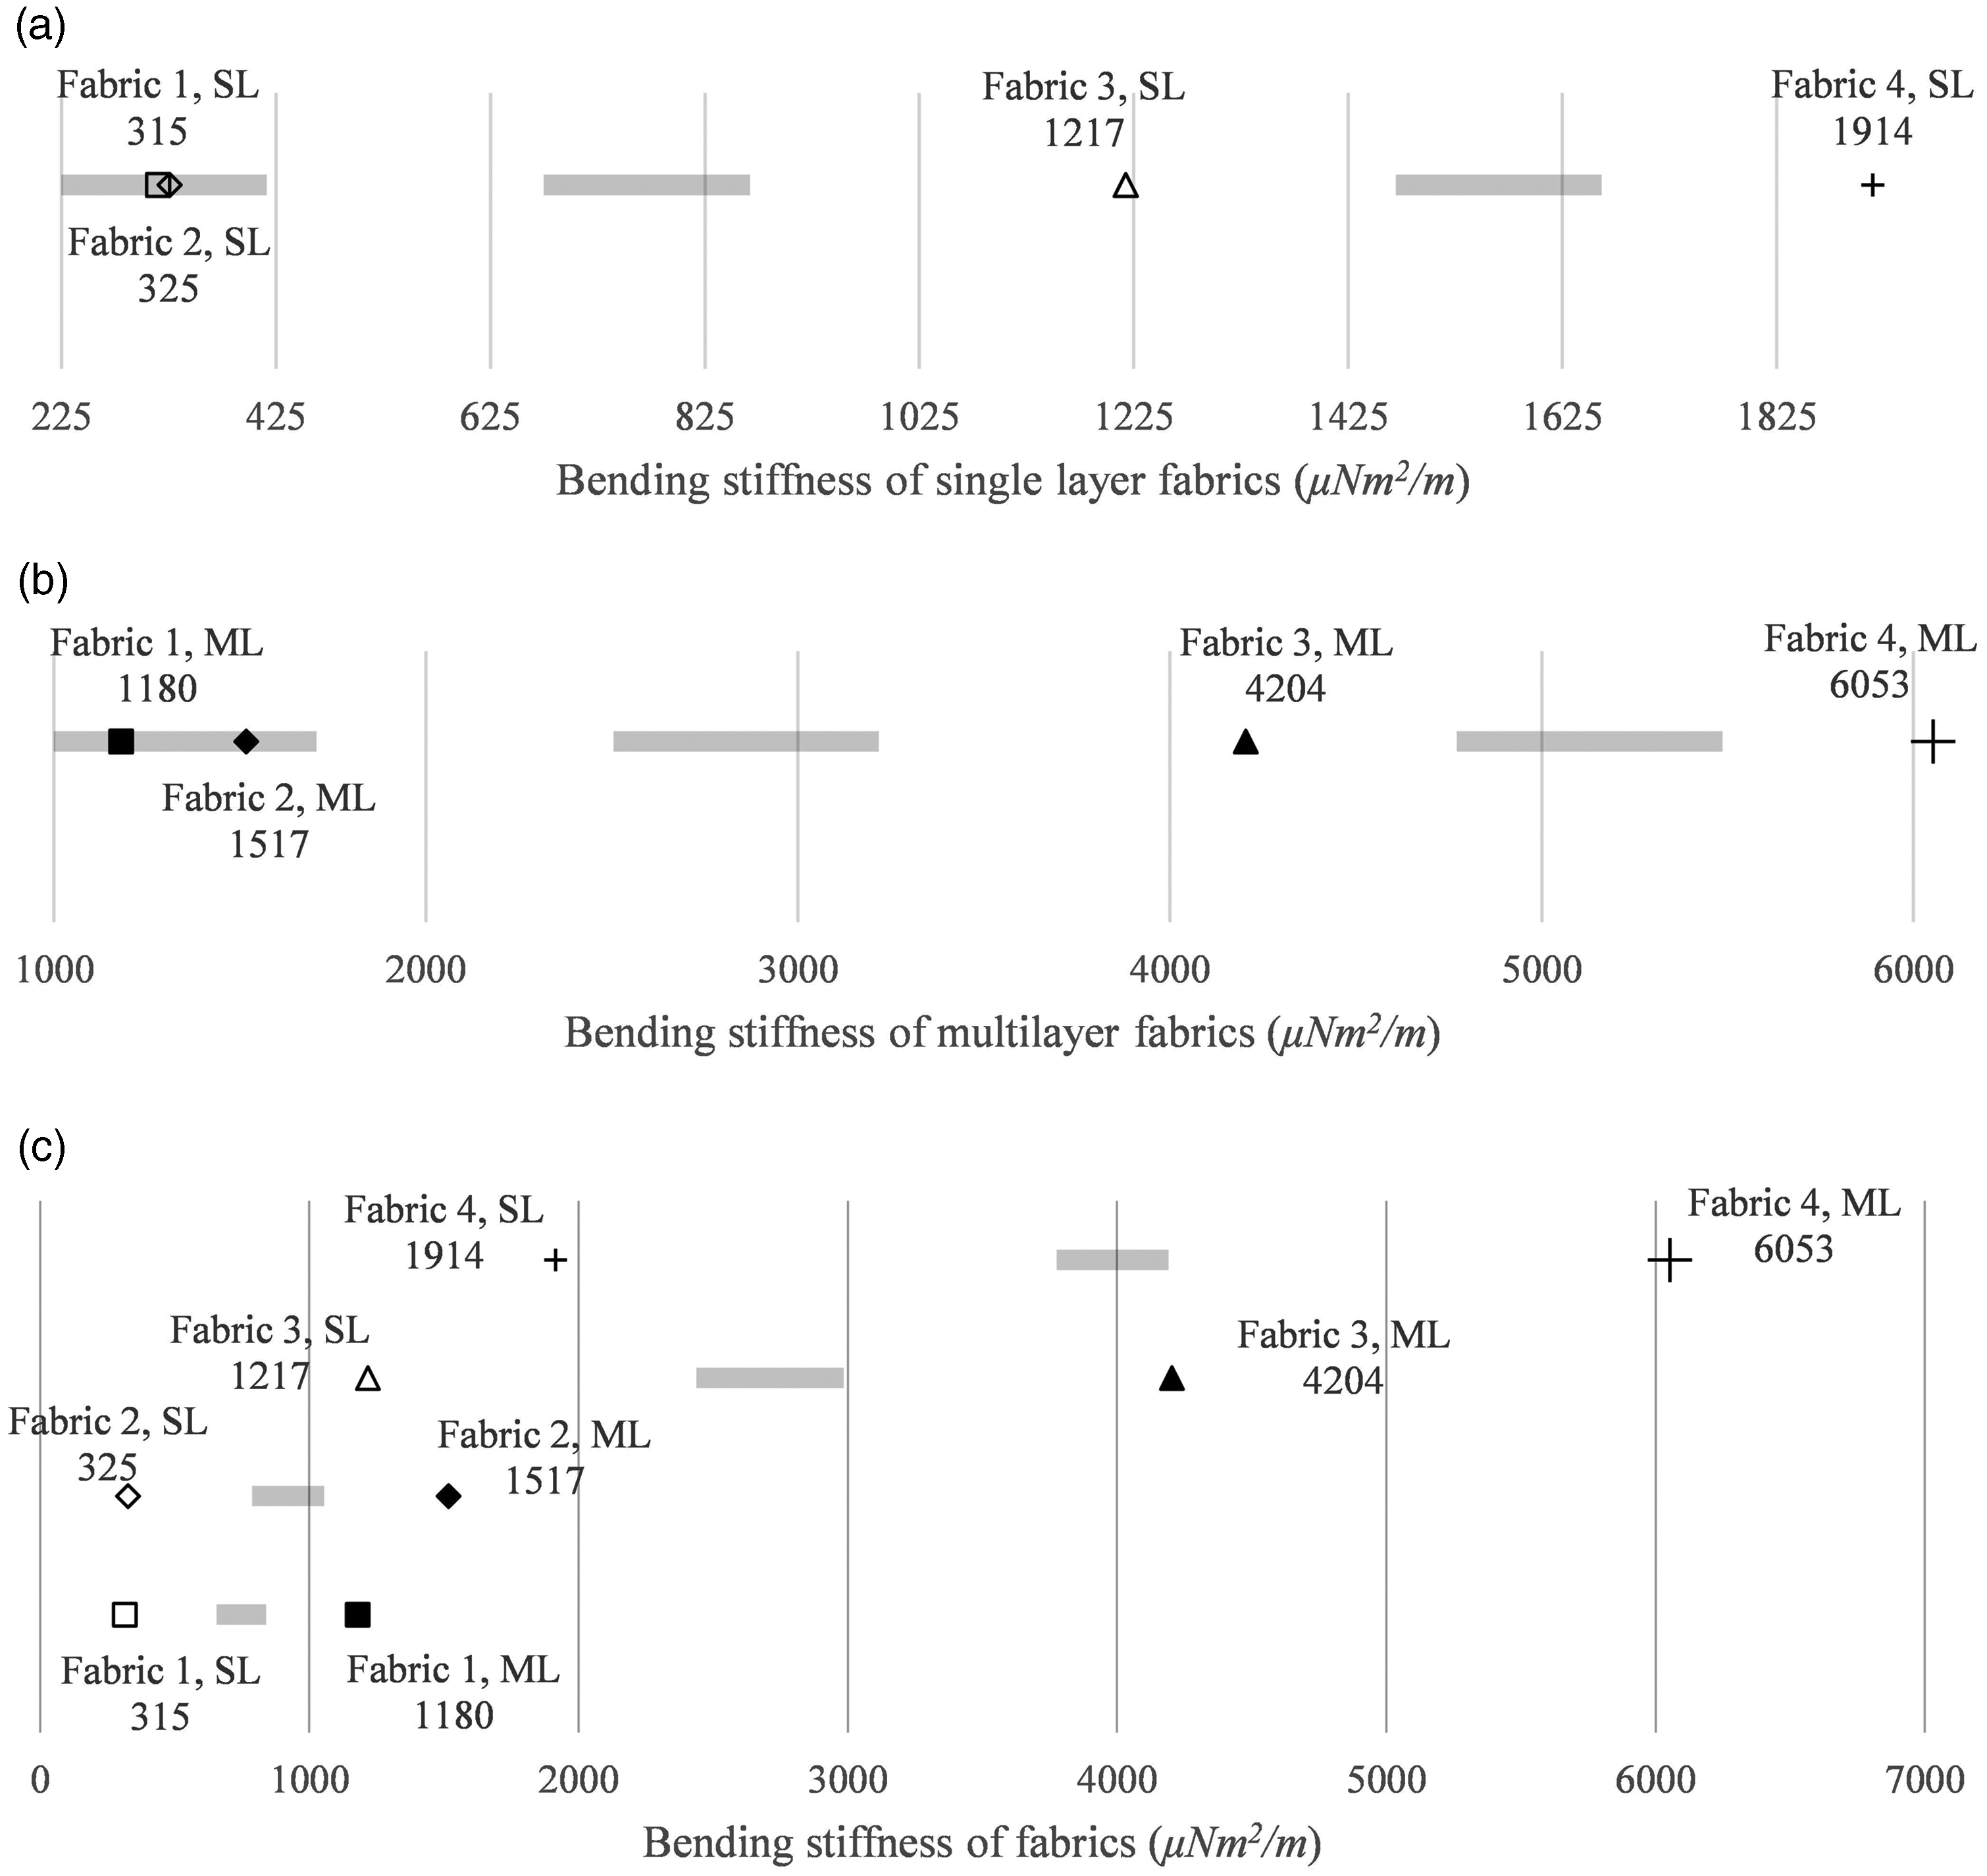
Honestly significant difference (HSD), bending stiffness: (a) single layers; (b) multiple layers and (c) single and multiple layers.
It is observed that the two woven fabrics with the same fiber material and similar surface densities returned similar stiffness values despite different weave structures and yarn sizes, and that the same fabric returned different stiffness values depending on binder use.
Convex bending spring back
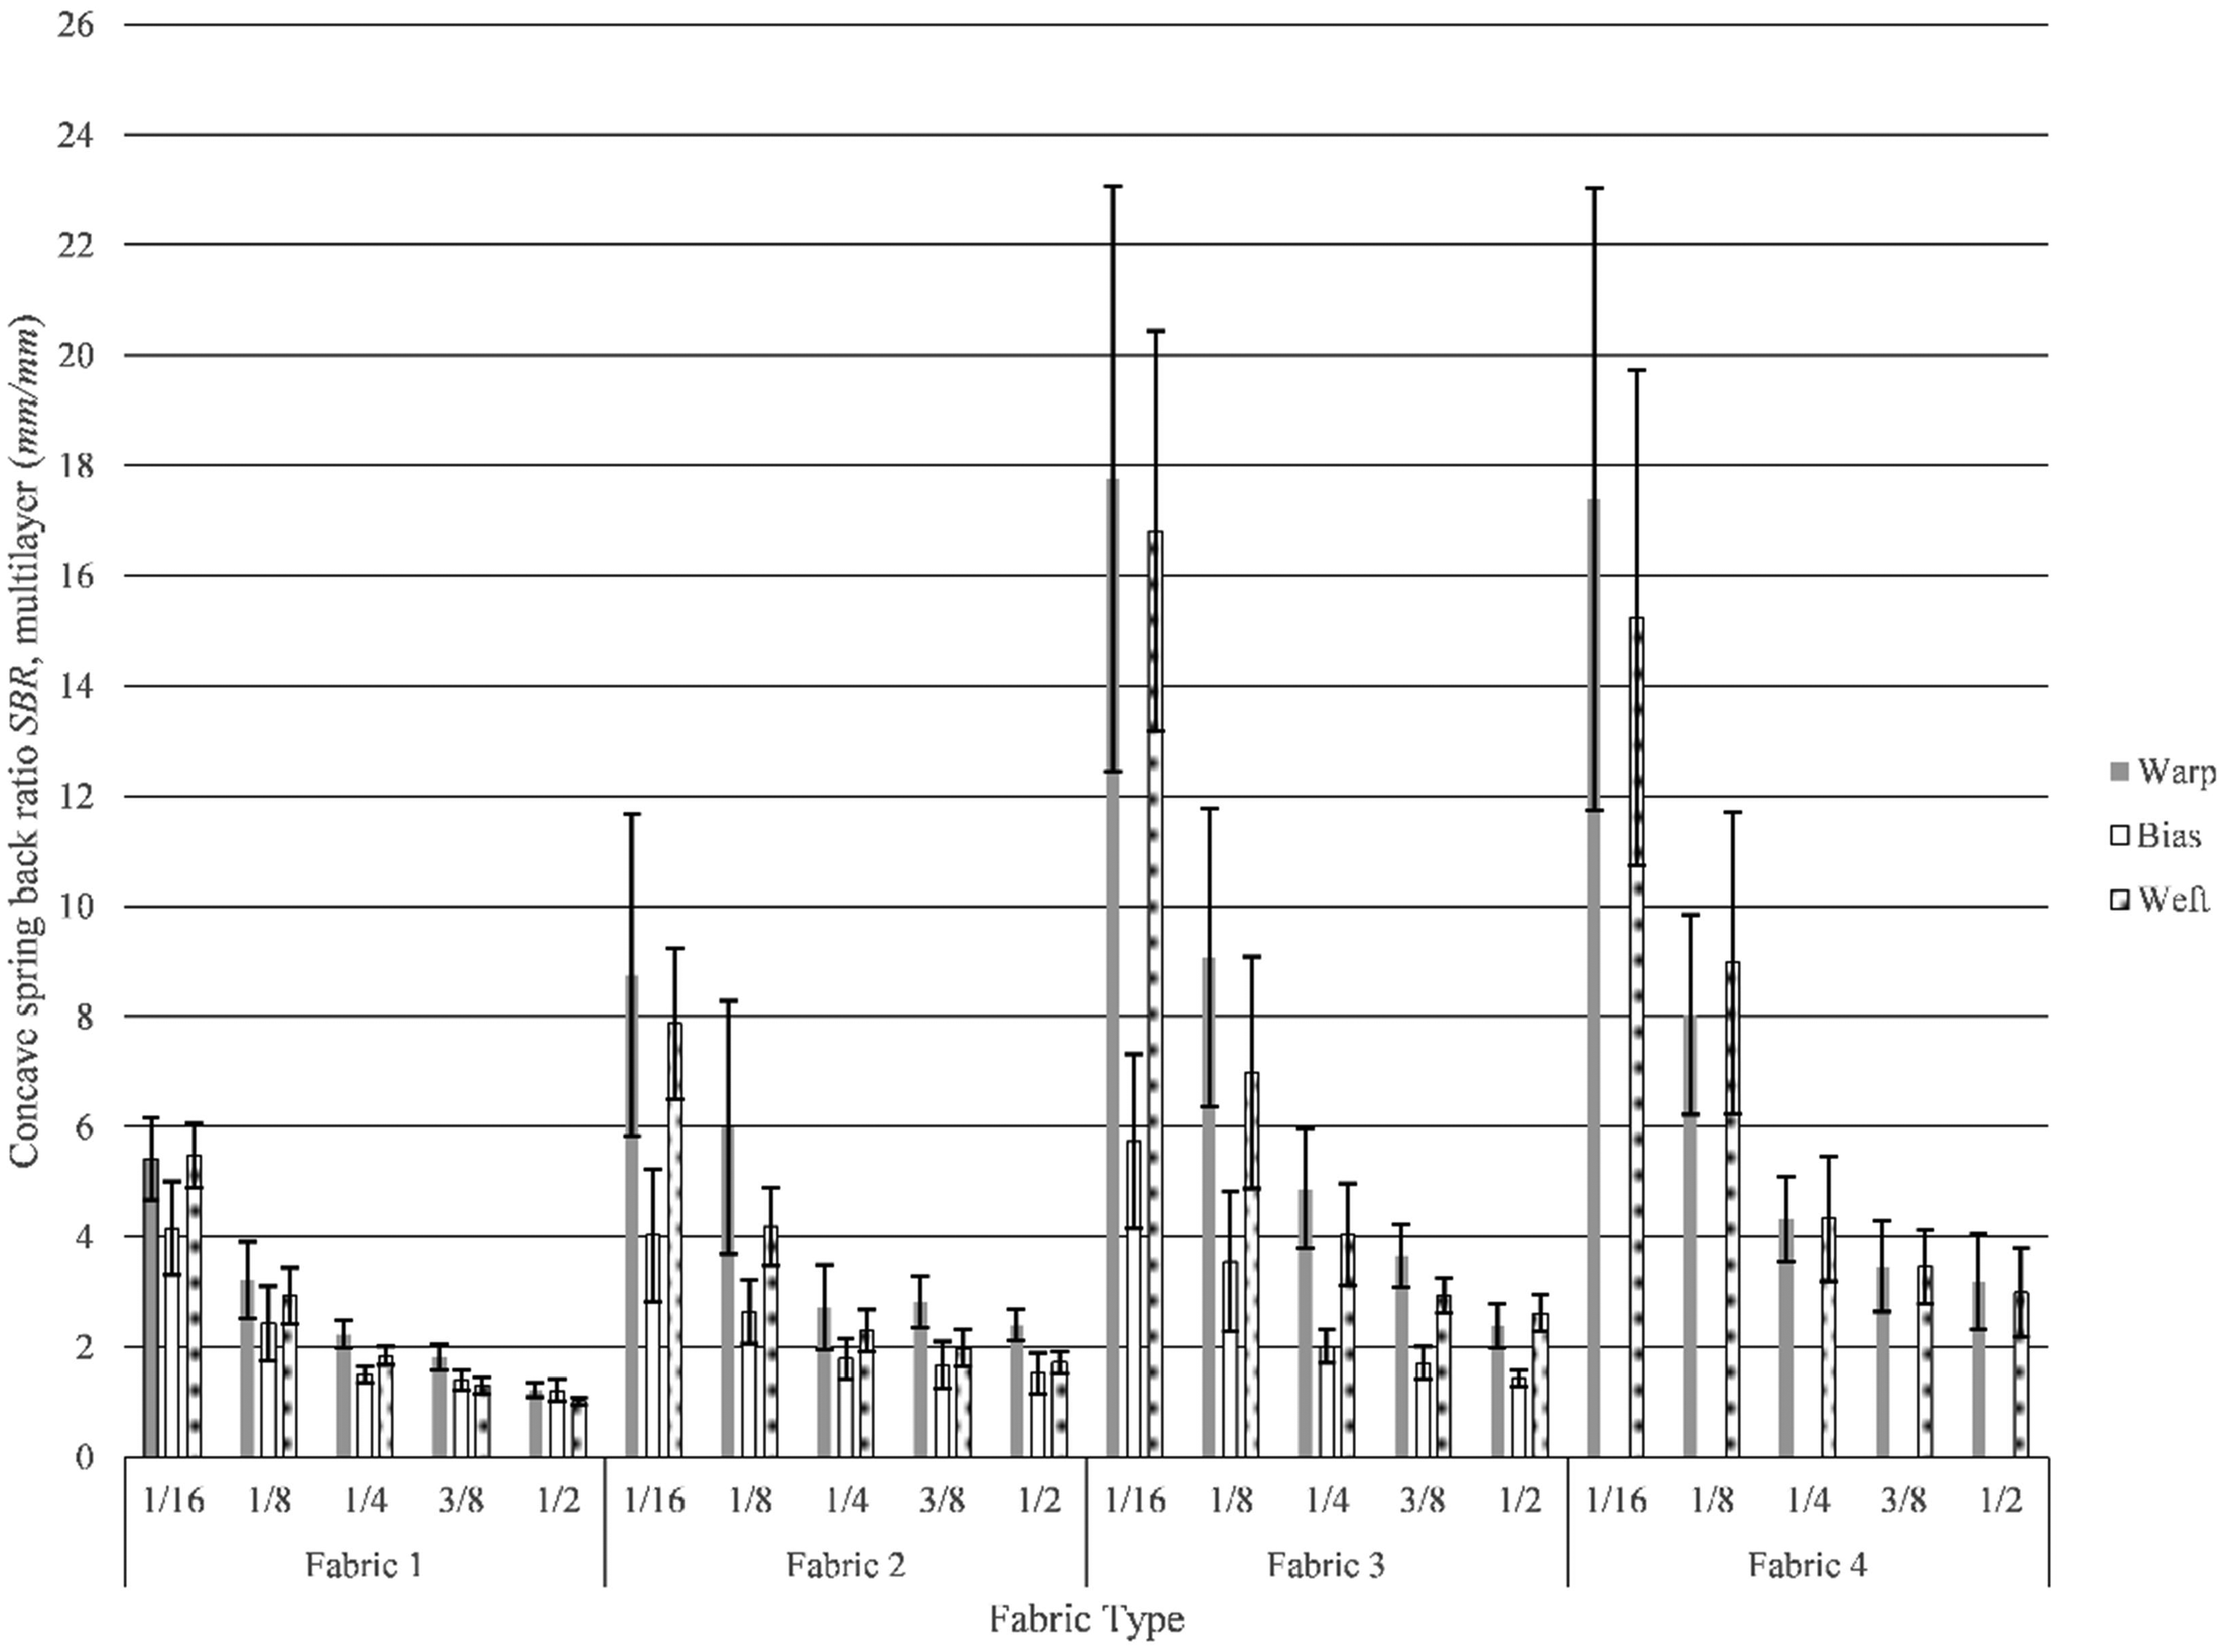
Bending spring-back of single and multilayered fabrics was measured along the warp, weft, and bias directions for fabrics 1, 2 and 3, and along the warp and weft for fabric 4. Multilayered stacks featured four layers for fabrics 1 and 2, and three layers for fabrics 3 and 4. Each test was replicated five times. Tests were conducted over radii of 1.59 mm, 3.18 mm, 6.35 mm, 9.52 mm, and 12.70 mm for both convex and concave corners. Average convex SBR values appear in Figures 5 and 6 along with standard deviations. SBR decreases with increasing radii for all fabrics. Orientation has a limited effect for fabrics 1 and 2, with behavior very similar overall. The effect of orientation is more pronounced with fabrics 3 and 4. Contrary to stiffness, binder has a more limited effect on convex spring-back. Interestingly, differences in behavior between single and multiple layers are limited. It should be noted that data variability is much lower for the convex spring-back ratio than it was for bending stiffness (see Figure 3).
Bending spring-back data, convex, single layer.
Bending spring-back data, convex, multiple layers.
HSDs comparing convex SBR values of single layer fabrics, multilayer fabrics, and single versus multiple layers stacks for a convex SMR of 1.59 mm appear in Figure 7. The smaller convex SMR was chosen for graphic representation as it leads to the strongest convex SBR spring-back values. For single layers, convex SBR values were not detectably different for fabrics 1 and 2, as shown in Figure 7(a); all other pairwise comparisons involving fabrics 3 and/or 4 were detectably different, but marginally so for fabrics 3 and 4. For multiple layers, all convex SBR values were detectably different, as shown in Figure 7(b). Finally, single layer and multilayer convex SBR values were marginally different for fabric 1, and detectably different for fabric 2, while they were not detectably different for fabrics 3 and 4, as shown in Figure 7(c). The ratios of multilayer to single layer convex SBR values of fabrics 1 and 2 were 1.16 and 1.38, respectively.
Honestly significant difference (HSD), 1.59 mm convex radius bending spring-back: (a) single layers; (b) multiple layers and (c) single and multiple layers.
It is observed that single layers of two woven fabrics with the same fiber material and similar surface densities returned similar convex SBR values despite different weave structures and yarn sizes. However, all convex SBR values differed between multilayer stacks of different fabrics. Interestingly, convex SBR values measured for single and multiple layers of the same fabric differed only for two fabrics out of the four tested. The use of a binder had a detectable effect on convex SBR for both single and multiple layers.
Concave bending spring-back
Concave bending spring-back test modalities mirrored those of the convex case. Average concave SBR values appear in Figures 8 and 9 along with standard deviations. SBR values evolved in a manner mostly similar to the convex case. Amplitudes compared well, confirming the proposed testing methods despite different configurations and lengths measured. The only difference of note is the amplitude of standard deviations that were generally larger in the concave case.
Bending spring back data, concave, single layer
Bending spring back data, concave, multiple layers
HSDs comparing concave SBR values of single layer fabrics, multilayer fabrics, and single versus multiple layers stacks for a concave SMR of 1.59 mm appear in Figure 10. The smaller convex SMR was chosen again for the same reason as above. For single layers, concave SBR values were not detectably different for fabrics 1 and 2, as shown in Figure 10(a). All other pairwise comparisons involving fabrics 3 and/or 4 were detectably different, but marginally so for fabrics 3 and 4. This behavior mirrors that observed with convex SBR values. Conversely, the behavior observed with multiple layers was different. Concave SBR values were only very marginally statistically significant for fabrics 1 and 2, as shown in Figure 10(b), and they were not detectably different for fabrics 3 and 4. However, concave SBR values were detectably different when either of fabrics 1 or 2 was compared with either of fabrics 3 or 4. Finally, concave SBR values of single and multilayer stacks were not detectably different for fabrics 1 and 3, but they were detectably different for fabrics 2 and 4, as shown in Figure 10(c). The ratios of multilayer to single layer concave SBR values of fabrics 2 and 4 were 1.34 and 1.26, respectively.
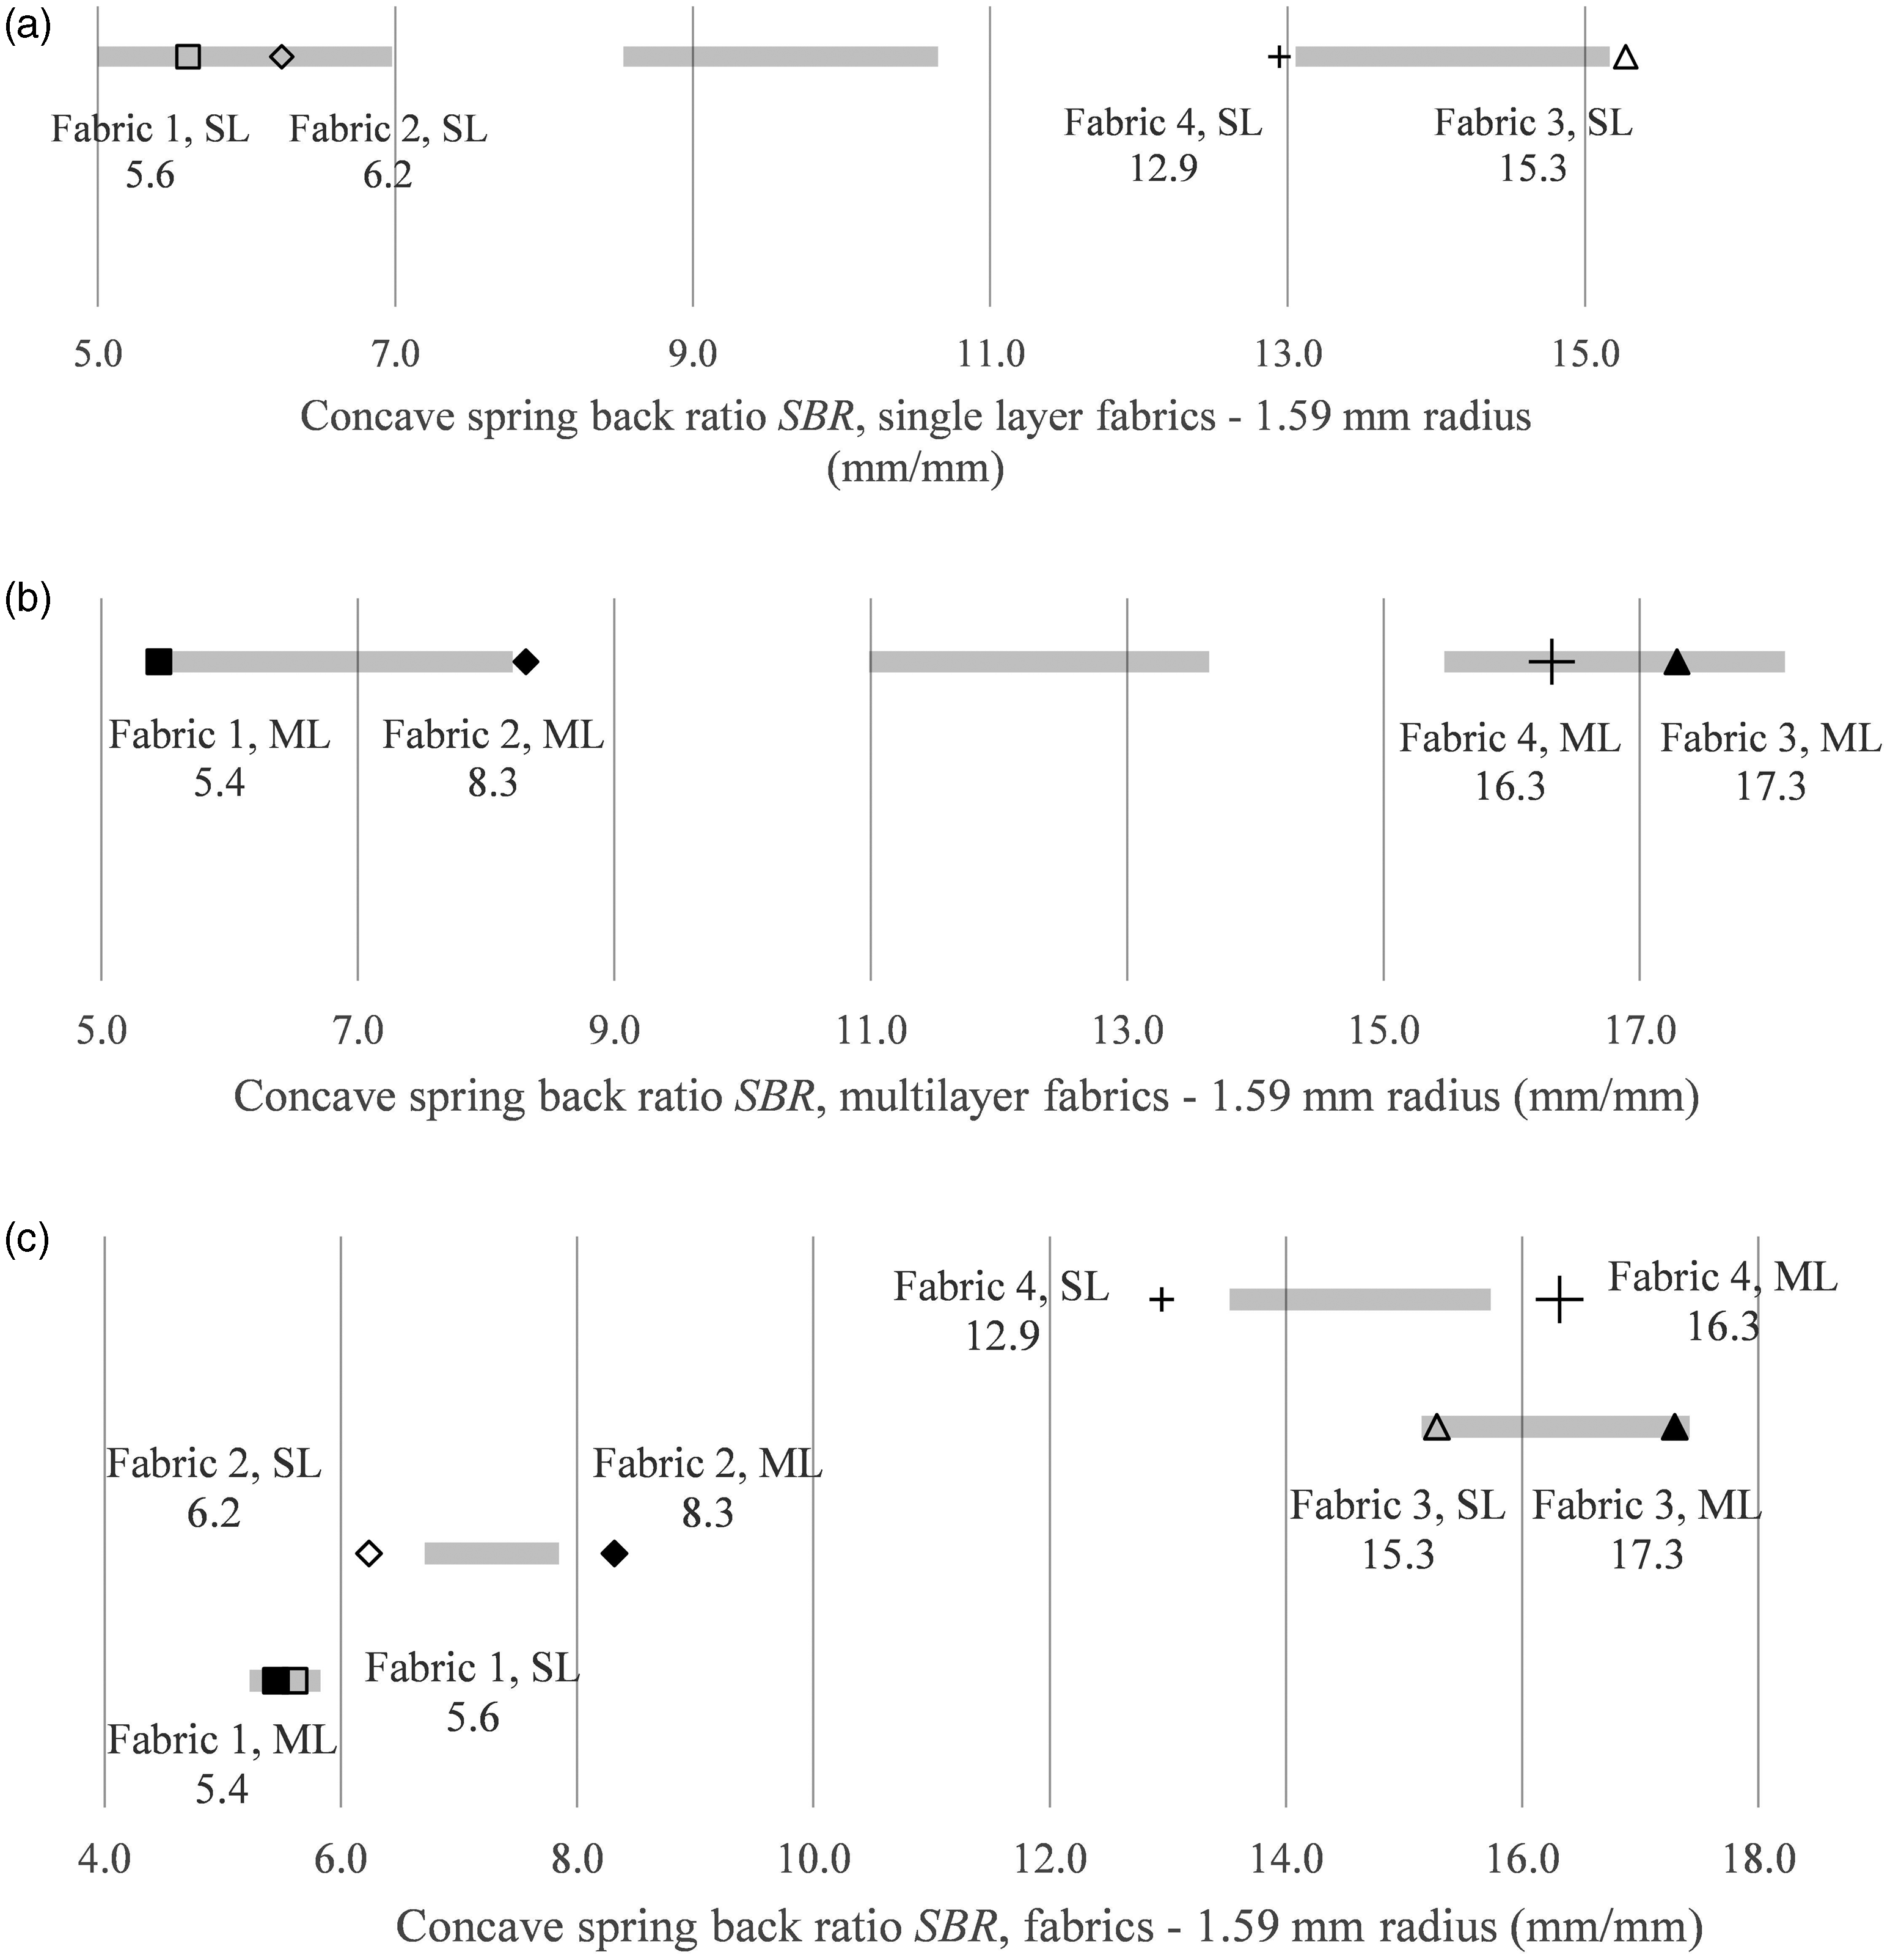
Honestly significant difference (HSD), 1.59 mm concave radius bending spring-back: (a) single layers; (b) multiple layers and (c) single and multiple layers.
Conclusions
Convex and concave bending spring-back and their variability were defined and characterized for single and multiple layers of different textile reinforcements, using varying corner radii and measuring along three fabric directions. Novel testing procedures were introduced. Cantilevered bending stiffness was also measured for single and multilayer versions of all fabrics, along multiple directions, for comparison purposes. Bending spring-back tests constitute a new method for quantifying the spring-back behavior of fabrics observed in industrial settings. The tests consisted of draping fabrics over convex and into concave surfaces of varying curvature radii, and measuring their configuration after removal of the load. Spring-back was found to be notionally proportional to the cantilevered stiffness of fabrics; fabrics showing higher cantilevered stiffness also showed more bending spring-back. However, spring-back is a more complex phenomenon in which the corner radius was found to affect the behavior to a larger extent than either testing direction or number of layers in the stack. Finally, the validity of the proposed methods for measuring bending spring-back was demonstrated; despite different initial and final configurations, and different lengths measured, the conclusions reached using both methods were highly consistent. Results can inform the design of small radius corners in PMC parts when a set reinforcement fabric must be used, or help reinforcement fabric selection when part design is set. Future work will relate the results presented herein to defects observed in the corners of PMC parts.
Footnotes
Acknowledgements
The support of the National Sciences and Engineering Research Council of Canada is gratefully acknowledged.
Declaration of conflicting interests
The author(s) declared no potential conflicts of interest with respect to the research, authorship, and/or publication of this article.
Funding
The author(s) received no financial support for the research, authorship, and/or publication of this article.