
Abstract
Due to the thickness of the spacer fabric, it is usually assembled in a multi-layered manner as a cushion material. However, few studies have been conducted on the compression properties of the multi-layered spacer fabrics. Firstly, this paper analyzes the factors affecting the compression properties of multi-layered spacer fabrics, and explains the influencing mechanisms. Results show that the fixing condition between the sample and the indenter, the fixing condition between layers, the overlaying direction and the compression speed have little effect on the compression property. However, when overlaying spacer fabrics with different moduli, a better compression property can be obtained by placing the fabric with a higher modulus on top. Secondly, this paper focuses on the relationship between the layers and the compression property of the spacer fabrics. It shows that the relation between the compression work and the number of layers is linear, with a high correlation coefficient. The relationship between the modulus and the number of layers is in the form of a cubic function with a good correlation coefficient. Finally, the Kelvin model is modeled and is found to be suitable for characterizing the stage II compressive properties of multi-layered spacer fabrics. The above quantitative analysis provides theoretical support for the design of cushion materials with different moduli and support performance in different regions, and has practical guiding significance.
Spacer fabric consists of upper and lower surfaces and spacer yarns (filaments) connecting them. 1 It is widely used in various industries for good air permeability, moisture permeability, pressure relief and impact resistance.2 –6 Currently, the thickness of spacer fabrics generally ranges from 2 to 25 mm. 7 The weaving process of large-gauge fabrics is still immature, 8 and there are problems such as low weaving efficiency and high requirements for mechanical parts. Therefore, thick spacer fabrics formed by overlaying thin spacer fabrics have great advantages, and it is important to study the compression properties of multi-layered spacer fabrics.
The current research on spacer fabrics focuses on the compression properties of single-layered spacer fabrics. Firstly, many researchers have studied the factors affecting the compression properties of spacer fabrics,9 –11 such as the thickness, weave angle, surface structure and arrangement of the spacer filaments, and some researchers have studied the influence of experimental conditions on the compression properties. 12 Secondly, more studies have been carried out on the compression model of single-layered spacer fabrics. Van Wyk 13 proposed a compression mathematical model, and De Jong et al. 14 and Beil and Robert 15 improved the model with more accurate results. Miu and Ge 16 regarded the spacer yarn as a slender compression rod with a fixed lower end and a simply supported upper end, and established a mechanical model. Mokhtari et al. 17 proposed the elastic bending rod model. Chen et al.18,19 theoretically analyzed the compression deformation process of spacer yarns. Ravi et al. 20 established a mechanical model of the parallel connection of a nonlinear spring and the Maxwell element. Liu and Hu 21 used micro-computed tomography (µCT) scanning technology to obtain a three-dimensional structural model of the spacer fabric, and simulated the compression force process of the spacer fabric through finite elements. Although the above studies are relatively mature, they were all aimed at single-layered spacer fabrics, but there are very few studies on the compression properties of multi-layered spacer fabrics. Yu et al. 22 studied the relationship between multi-layer warp-knitted spacer fabrics and compression properties by combining experiments and finite element simulations, but did not establish a quantitative relationship.
Compared with sponge materials, the advantages of warp-knitted spacer fabrics as mattress materials include excellent pressure relief performance, good heat and humidity regulation function, an environmentally friendly production process, flexible design and light weight. 23 Due to differences in body weight and sleeping positions, the pressure distribution on cushion materials is uneven, and the most stressed body parts are the head, shoulders and buttocks.24 –26 If the mattress is too hard, the area between the head, shoulders and buttocks will not be well supported; if the mattress is too soft, it will cause the spine to shift and deform, causing fatigue, so it is more urgent to design mattresses with different moduli and support in different regions.
This paper focuses on the compression properties of multi-layered spacer fabrics. The first step is to analyze the factors affecting the compression properties of multi-layered spacer fabrics, such as whether the test indenter and the fabric are fixed or not, whether the layers are fixed or not, the different overlay methods, the different test speeds, the overlay order of different types of spacer fabrics, etc.; the second step is to quantitatively analyze the relationship between different layers and compression properties, which provides a powerful basis for designing mattresses with different moduli and pressure relief properties in different regions.
Experimental details
Spacer fabric samples
For the experiment, two spacer fabrics were selected and named A and B, respectively. They are warp-knitted spacer fabric, and the parameters are listed in Table 1. Their front and back structures are shown in Figure 1. Both samples have a mesh structure on the front and a dense structure on the back. The arrangement of the spacer yarns is mainly determined by the number of movement stitches of the two comb needles in the middle during the knitting process, generally including “I”, “V” and “X.” As shown in Figure 2(a), the arrangement of the spacer yarns of samples A is “X”; Figure 2(b) shows the weave angle of the spacer fabric.
Sample parameters
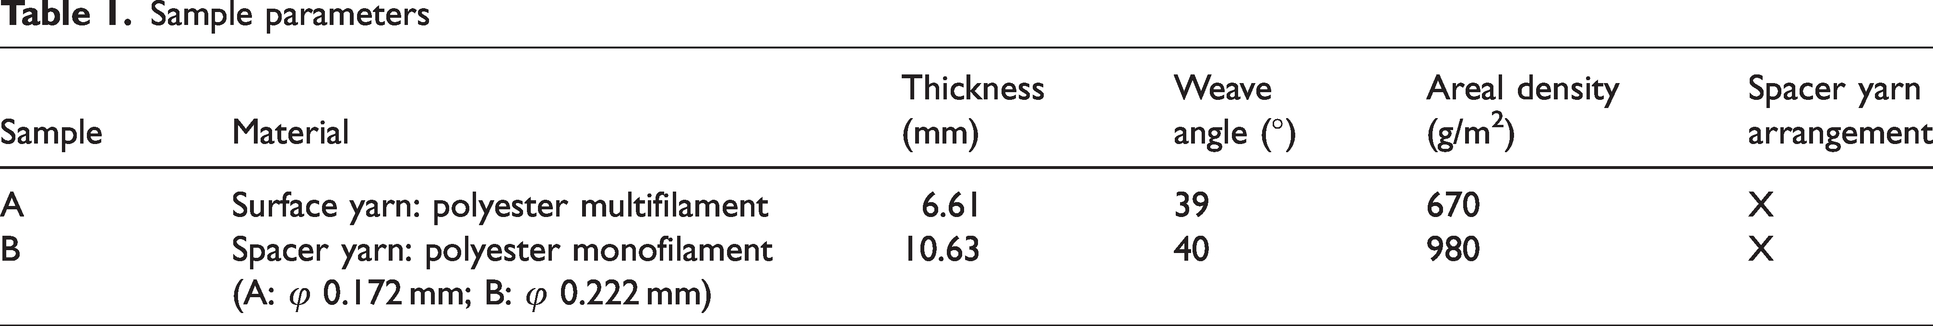
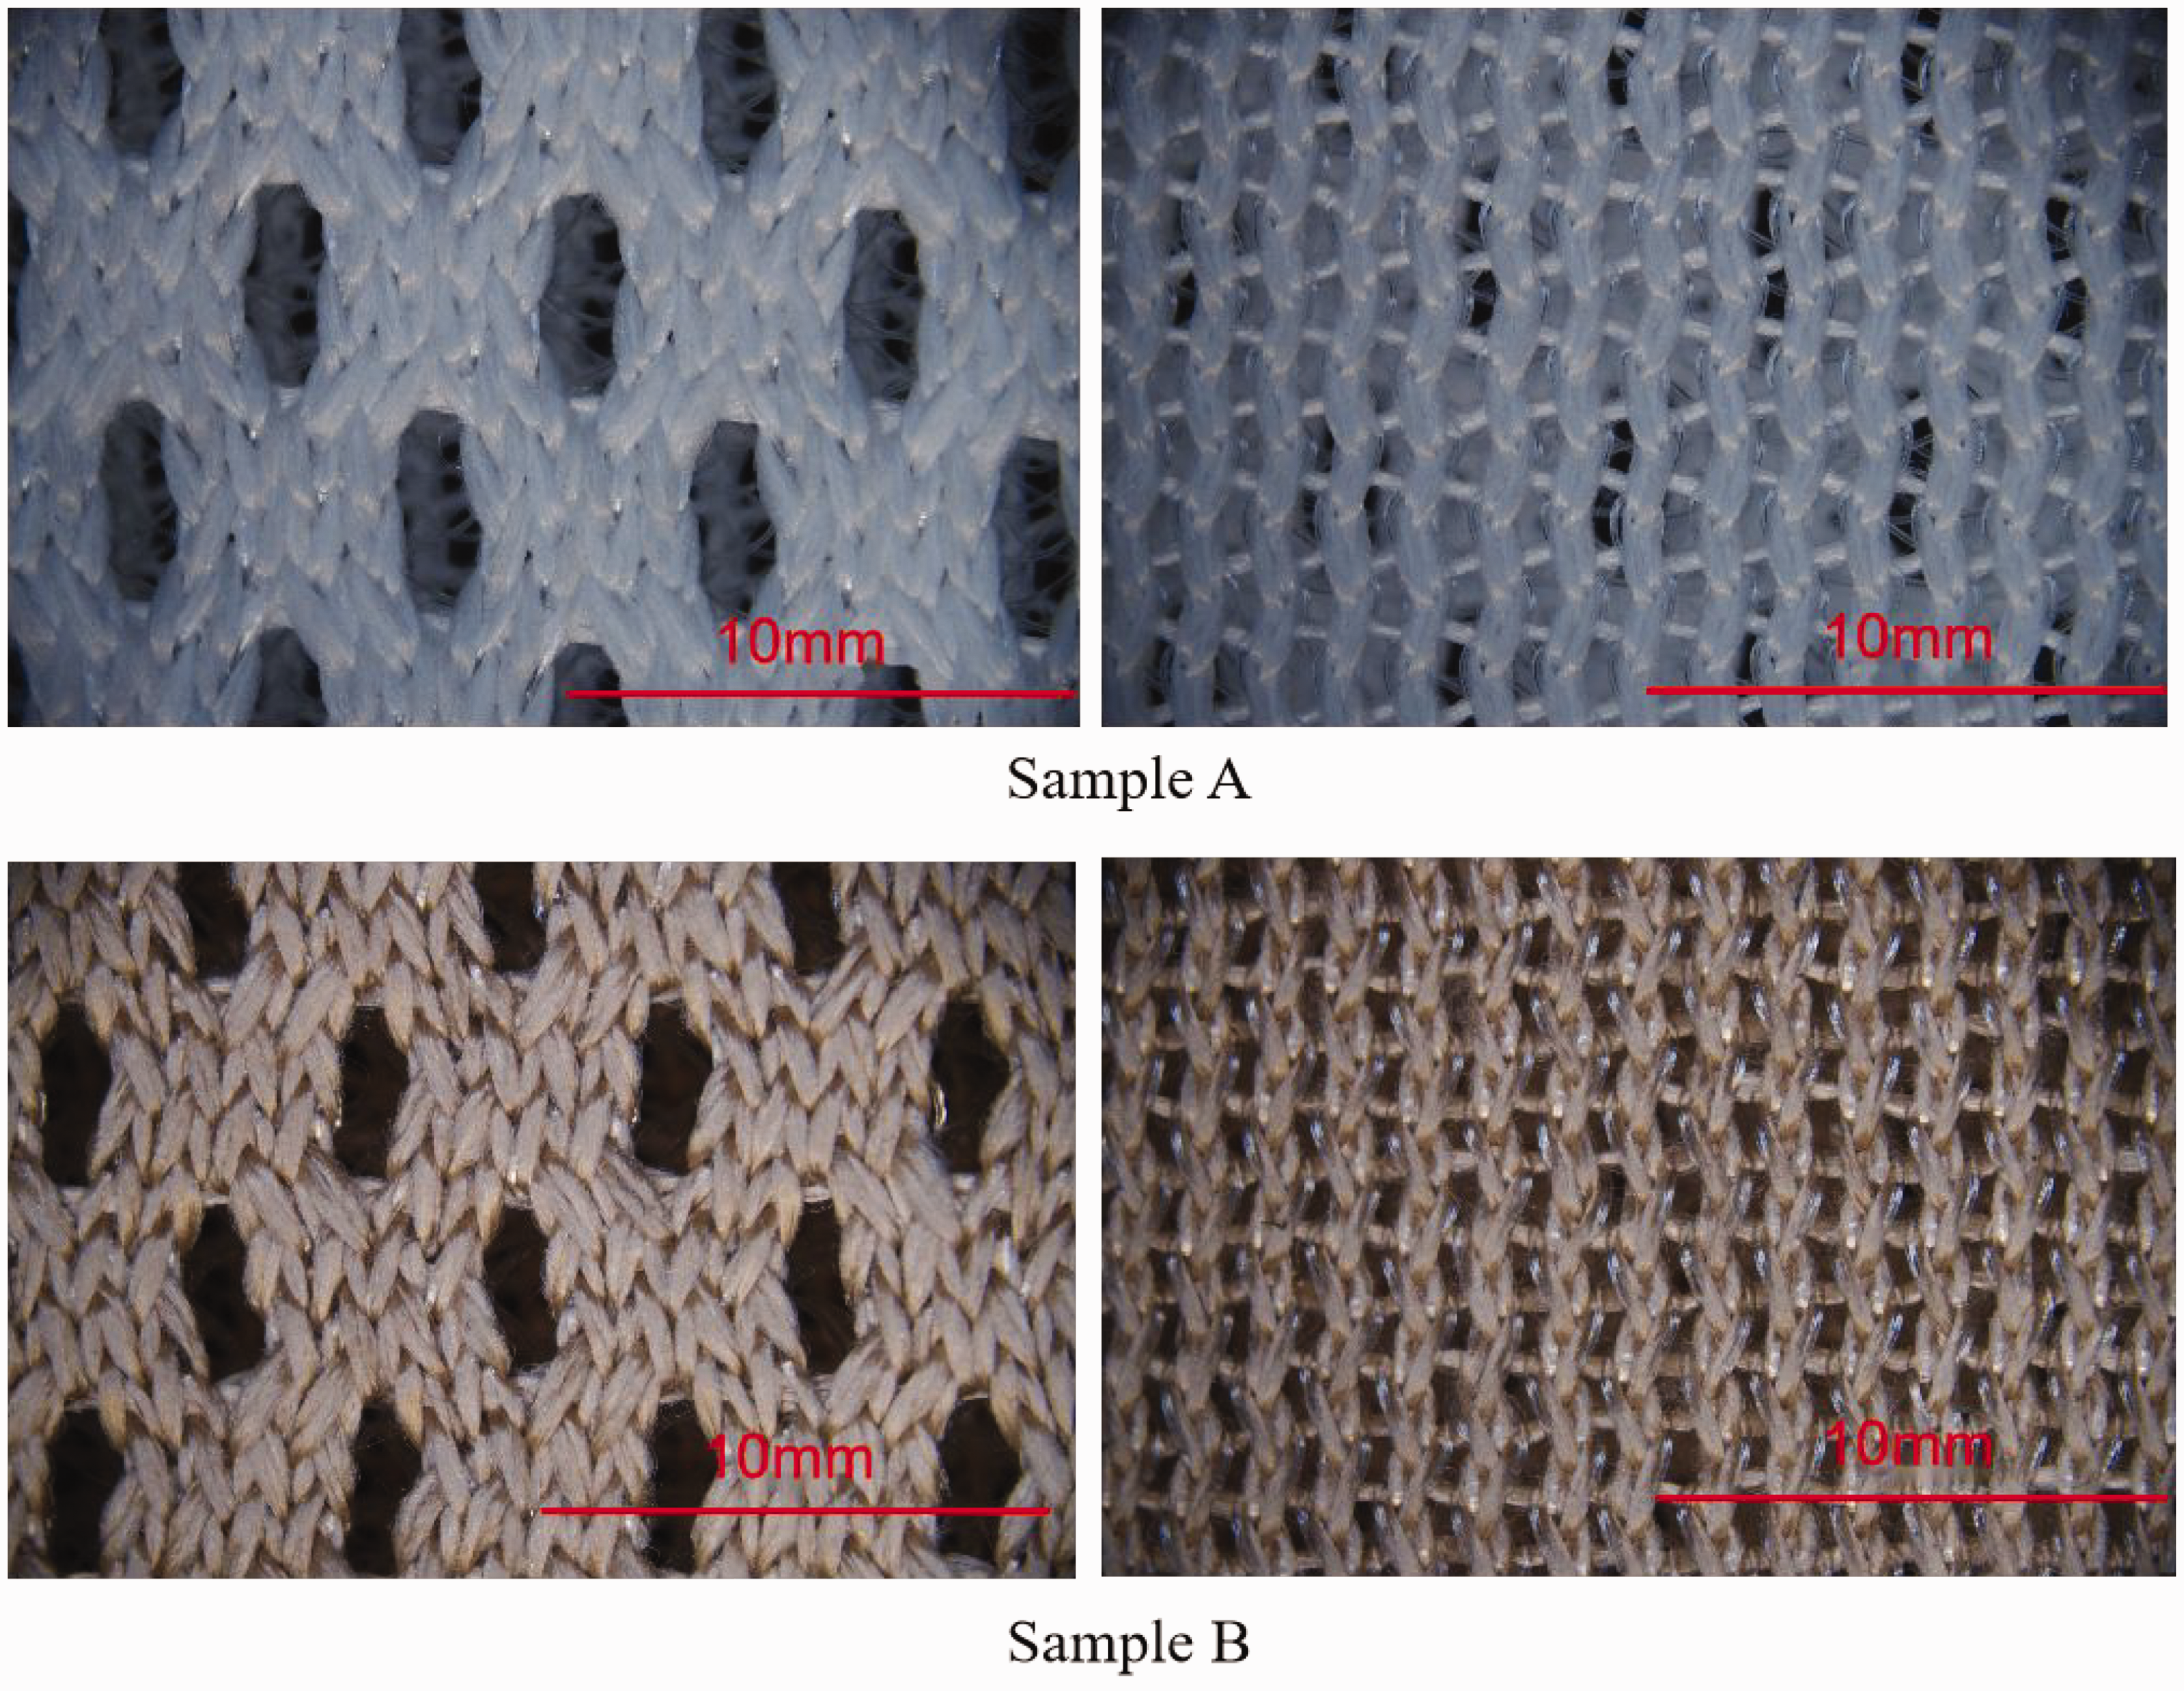
Surface structure of the spacer fabrics.
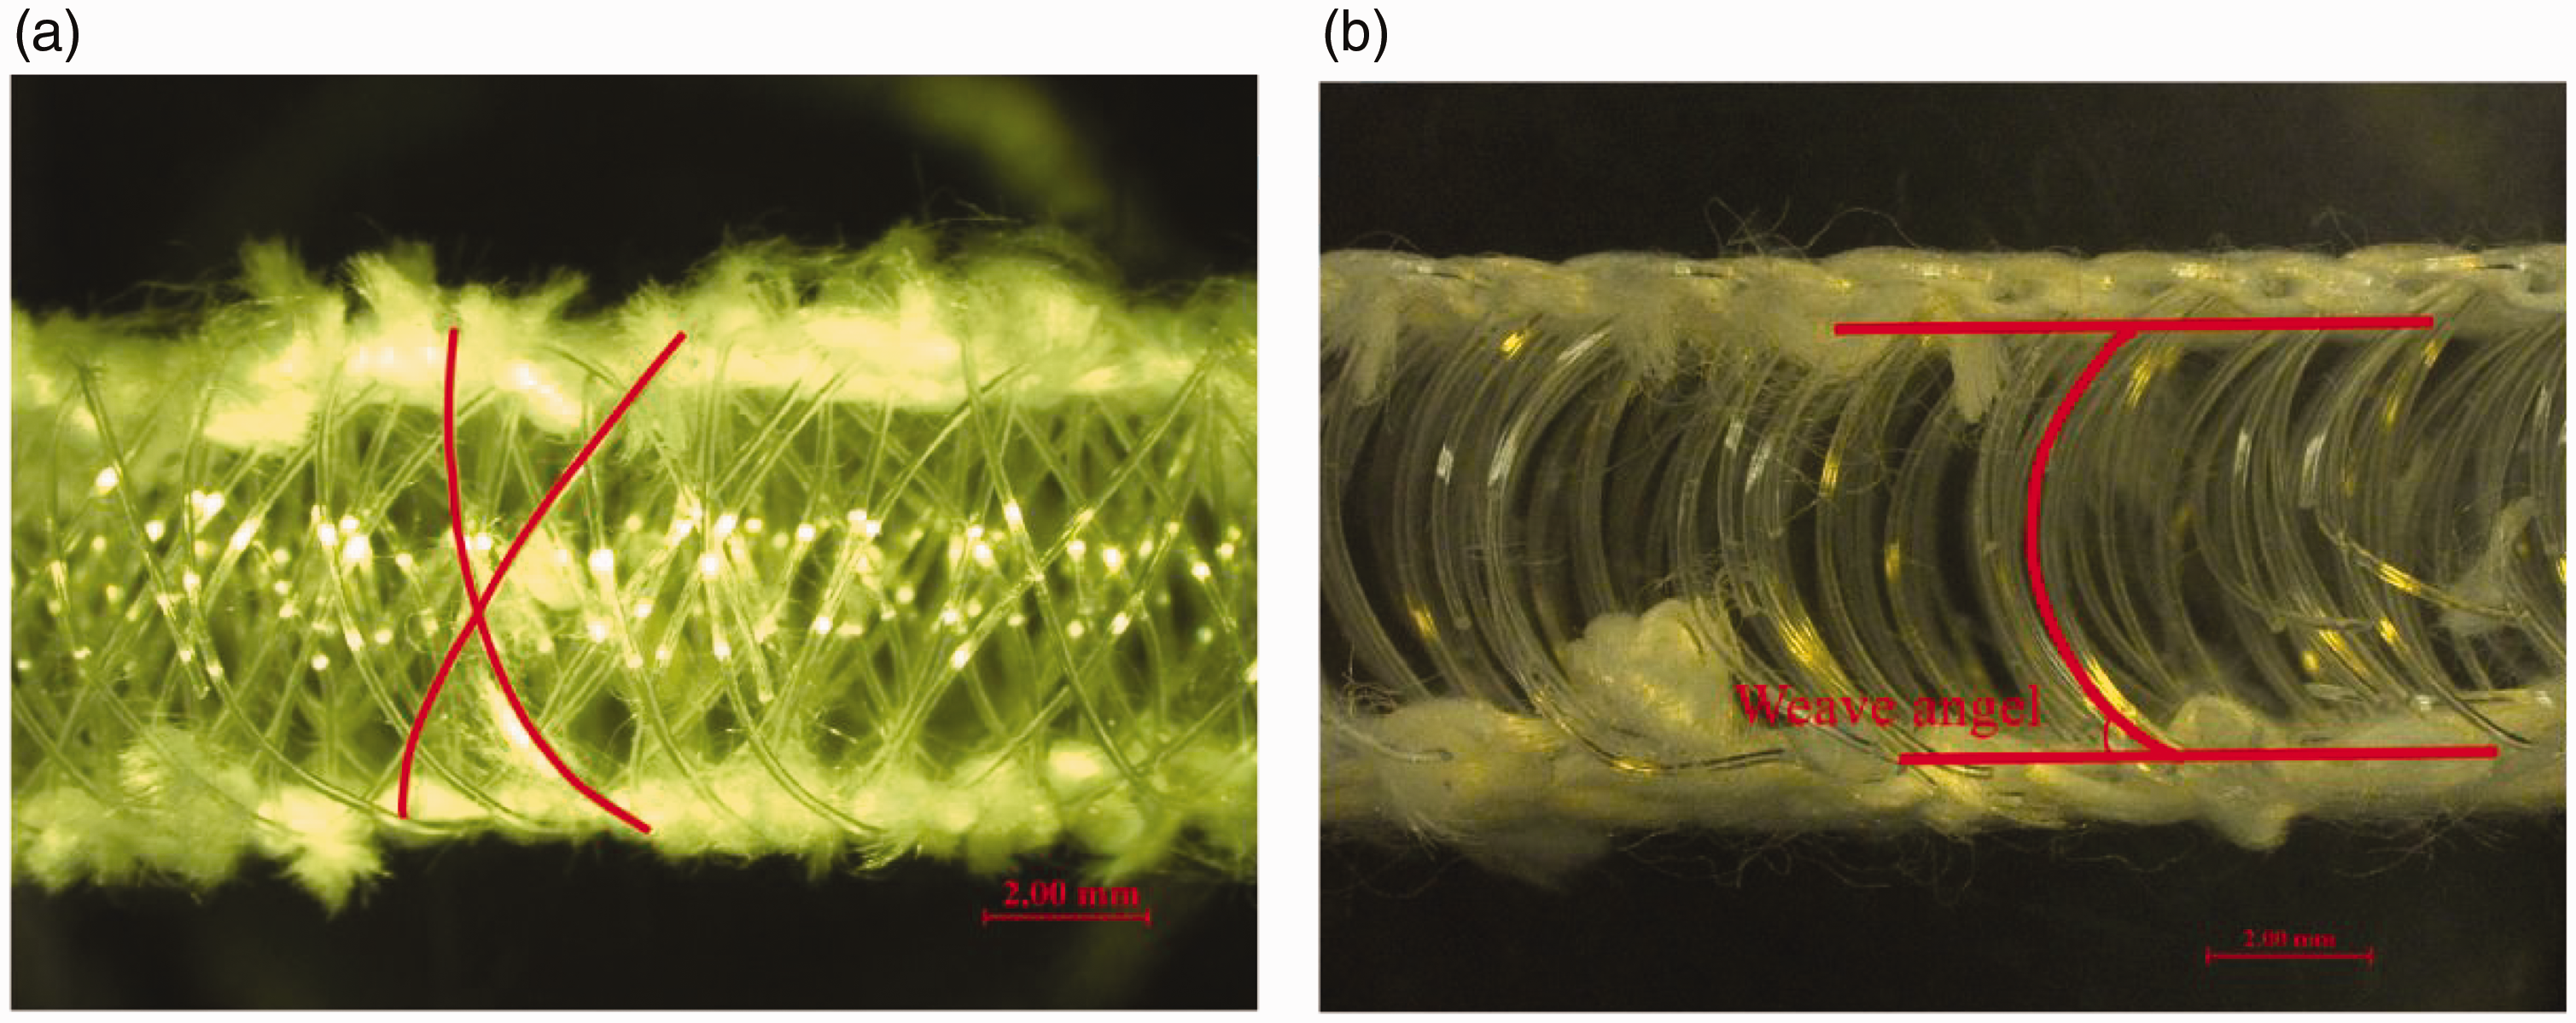
(a) Arrangement of spacer yarns: weaving direction view and (b) Weave angle: side view.
The sample cutting size is 8.5 cm × 8.5 cm, and the integrity of the edge spacing yarn is ensured during the cutting process. The test environment temperature is (20 ± 2)°C, and the relative humidity is (65 ± 2)%. Prior to the test, test samples are kept for 24 hours in environmental laboratory conditions.
Compression test
An Instron Micro Tester 5848 Model, shown in Figure 3, is used as the test equipment. The force measuring range of the equipment is ±2000 N, and the accuracy is ±0.5%. Compression test standards refer to GB/T 24442.1-2009. 27 The speed is set as 12 mm/minute, the test indenter diameter is 120 mm, the thickness is 10 mm and the material is 304 stainless steel. For every test, three samples were tested and the average was computed as the result. In the pre-experiment, the complete compression curves of samples A and B could be measured at a pressure of 700 N. Therefore, the constant compression pressure value was set as 700 N.
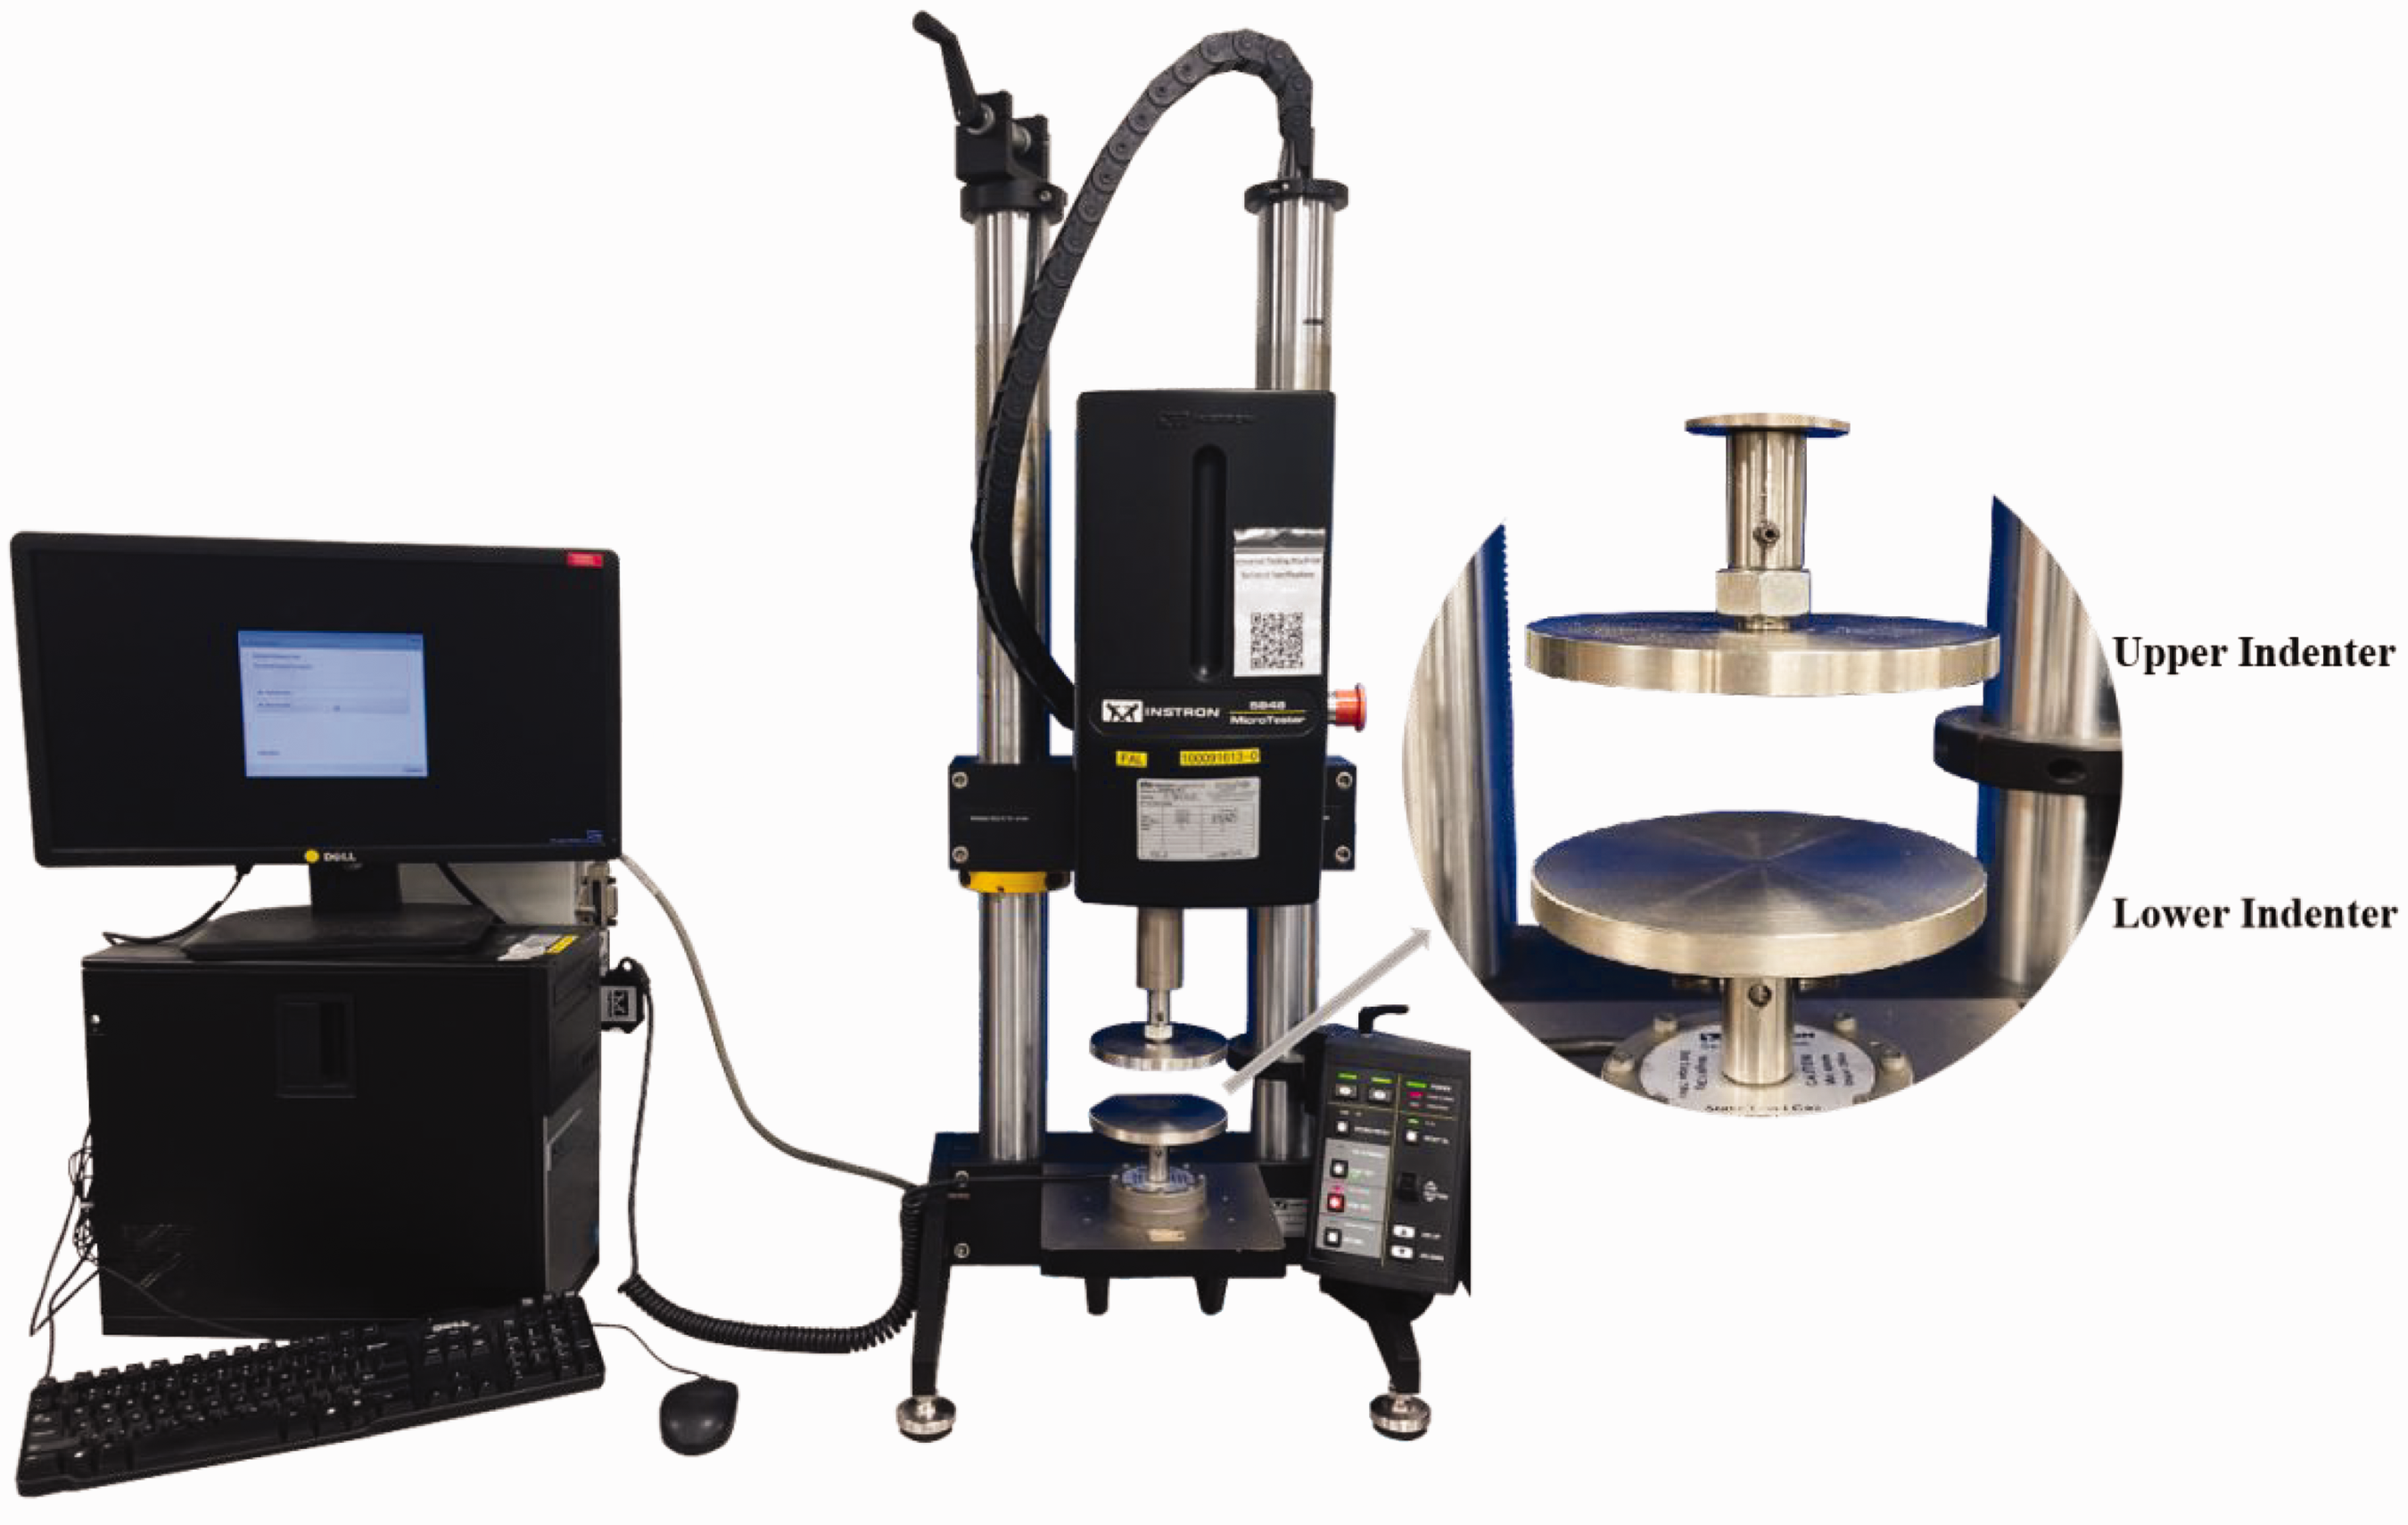
Compression equipment.
The main analysis indicators used in this paper are the compression ratio, compression work, recovery work, recovery ratio and modulus. Referring to the definitions in GB/T 24442 and “Textile physics,”
28
the detailed explanations of each indicator are as follows.
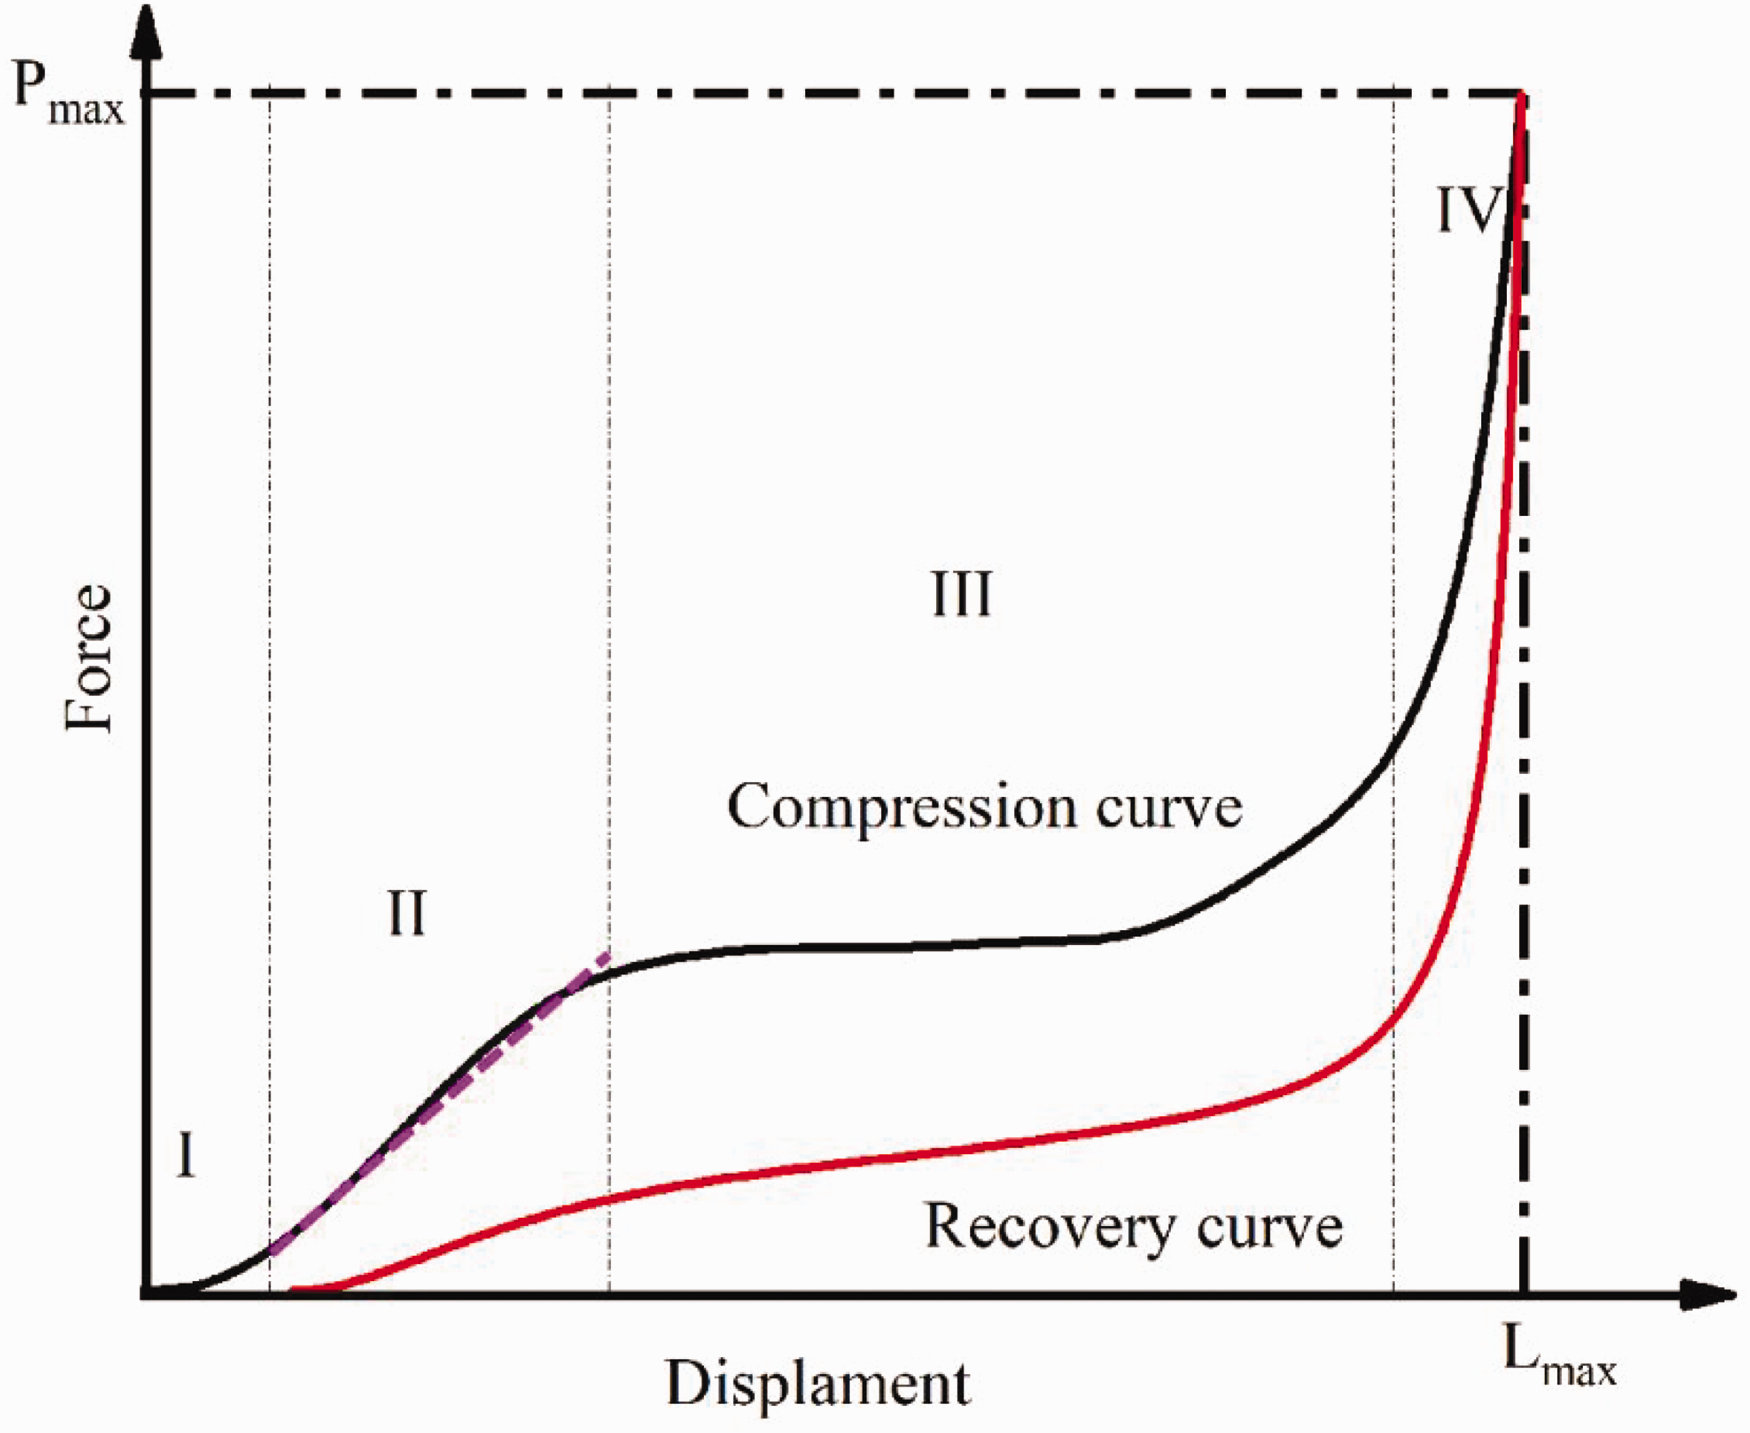
Compression ratio: a typical compression curve for a spacer fabric is shown in Figure 4, where Pmax is the constant pressure value and Lmax is the displacement at the constant pressure value Pmax. If the thickness of the fabric is L0, the formula for calculating the compression ratio is as follows:
Typical compression curve of spacer fabric. Compression work: the work done by the indenter during the continuous compression process when the force increases from 0 to Pmax. The calculation formula is as follows:
Recovery work: the work done by the indenter during the continuous recovery of the force from Pmax to 0. The calculation formula is as follows:
Recovery ratio: the percentage of recovery work to compression work. The calculation formula is as follows:
Modulus: the modulus here refers to the compression modulus E, that is, the ratio of stress (ϭ) and strain (ε) when compressed. The calculation method is to perform linear fitting on phase II as shown in Figure 4, and obtain the following formula:

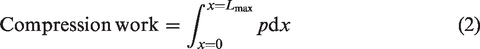


This experiment includes six test methods and conditions, which are described in detail as follows. The details of each test method can be understood in conjunction with Figure 5.
Schematic diagram of the experimental method.
Test method 1: test of fixation or no fixation between the sample and the indenter.
This test method is mainly to test the effect of fixation between the sample and the indenter on the compression performance. The test objects are single-layered samples A and B. As shown in Figure 5(a), the upper and lower surfaces of the samples and the test indenter are completely fixed with 3M adhesive tape. Compression tests are performed on the samples before and after fixing.
2. Test method 2: test of fixation and no fixation between layers.
This test method is mainly to test the effect of fixation between the samples on the compression performance. The test objects are two-layered samples A and B. As shown in Figure 5(b), the upper and lower samples are tightly fixed with 3M tape, but there is no fixation between the sample and the indenter. The overlay method of the upper and lower samples is parallel. Compression tests are performed on the samples before and after fixing.
3. Test method 3: tests of the same sample with different overlay directions.
This test method is mainly to test the effect of the overlay method on the compression performance. The test objects are two-layered samples A and B, and there are three situations shown in Figure 5(c) when the same samples are overlaid: parallel, reversed and vertical. From Figure 5(c), it can also be seen that there is no fixation between the samples, or between the sample and the indenter. Compression tests were carried out on the three overlay methods, respectively.
4. Test method 4: tests of different compression test speeds.
This test method is mainly to test the effect of compression speed on the compression performance. The test objects are two-layered samples A and B, and the overlay method of the upper and lower samples is parallel. The speed is set to 6, 12, 18, 24 and 60 mm/min according to GB/T 24442.1.
5. Test method 5: tests of different overlay order between different samples.
This test method is mainly to test the effect of overlay order between samples A and B on the compression performance. The test objects are the overlaid samples A and B. As shown in Figure 5(d), if sample B is on the top and sample A is on the bottom, it is sample (A + B); if reversed, it is sample (B + A). From Figure 5(d), it can also be seen that there is no fixation between samples A and B, or between the sample and the indenter. The overlay method of samples A and B is parallel. Compression tests are performed on two different overlay orders.
6. Test method 6: test of the same sample with different layers.
This test method is mainly to test the effect of the number of layers of the sample on the compression performance. Compression tests were carried out on samples A and B with laminated layers ranging from one to eight layers. The overlay method of samples is parallel, and there is no fixation between the samples or between the sample and the indenter.
Results and discussion
Analysis of compression between the sample and the indenter with or without fixation
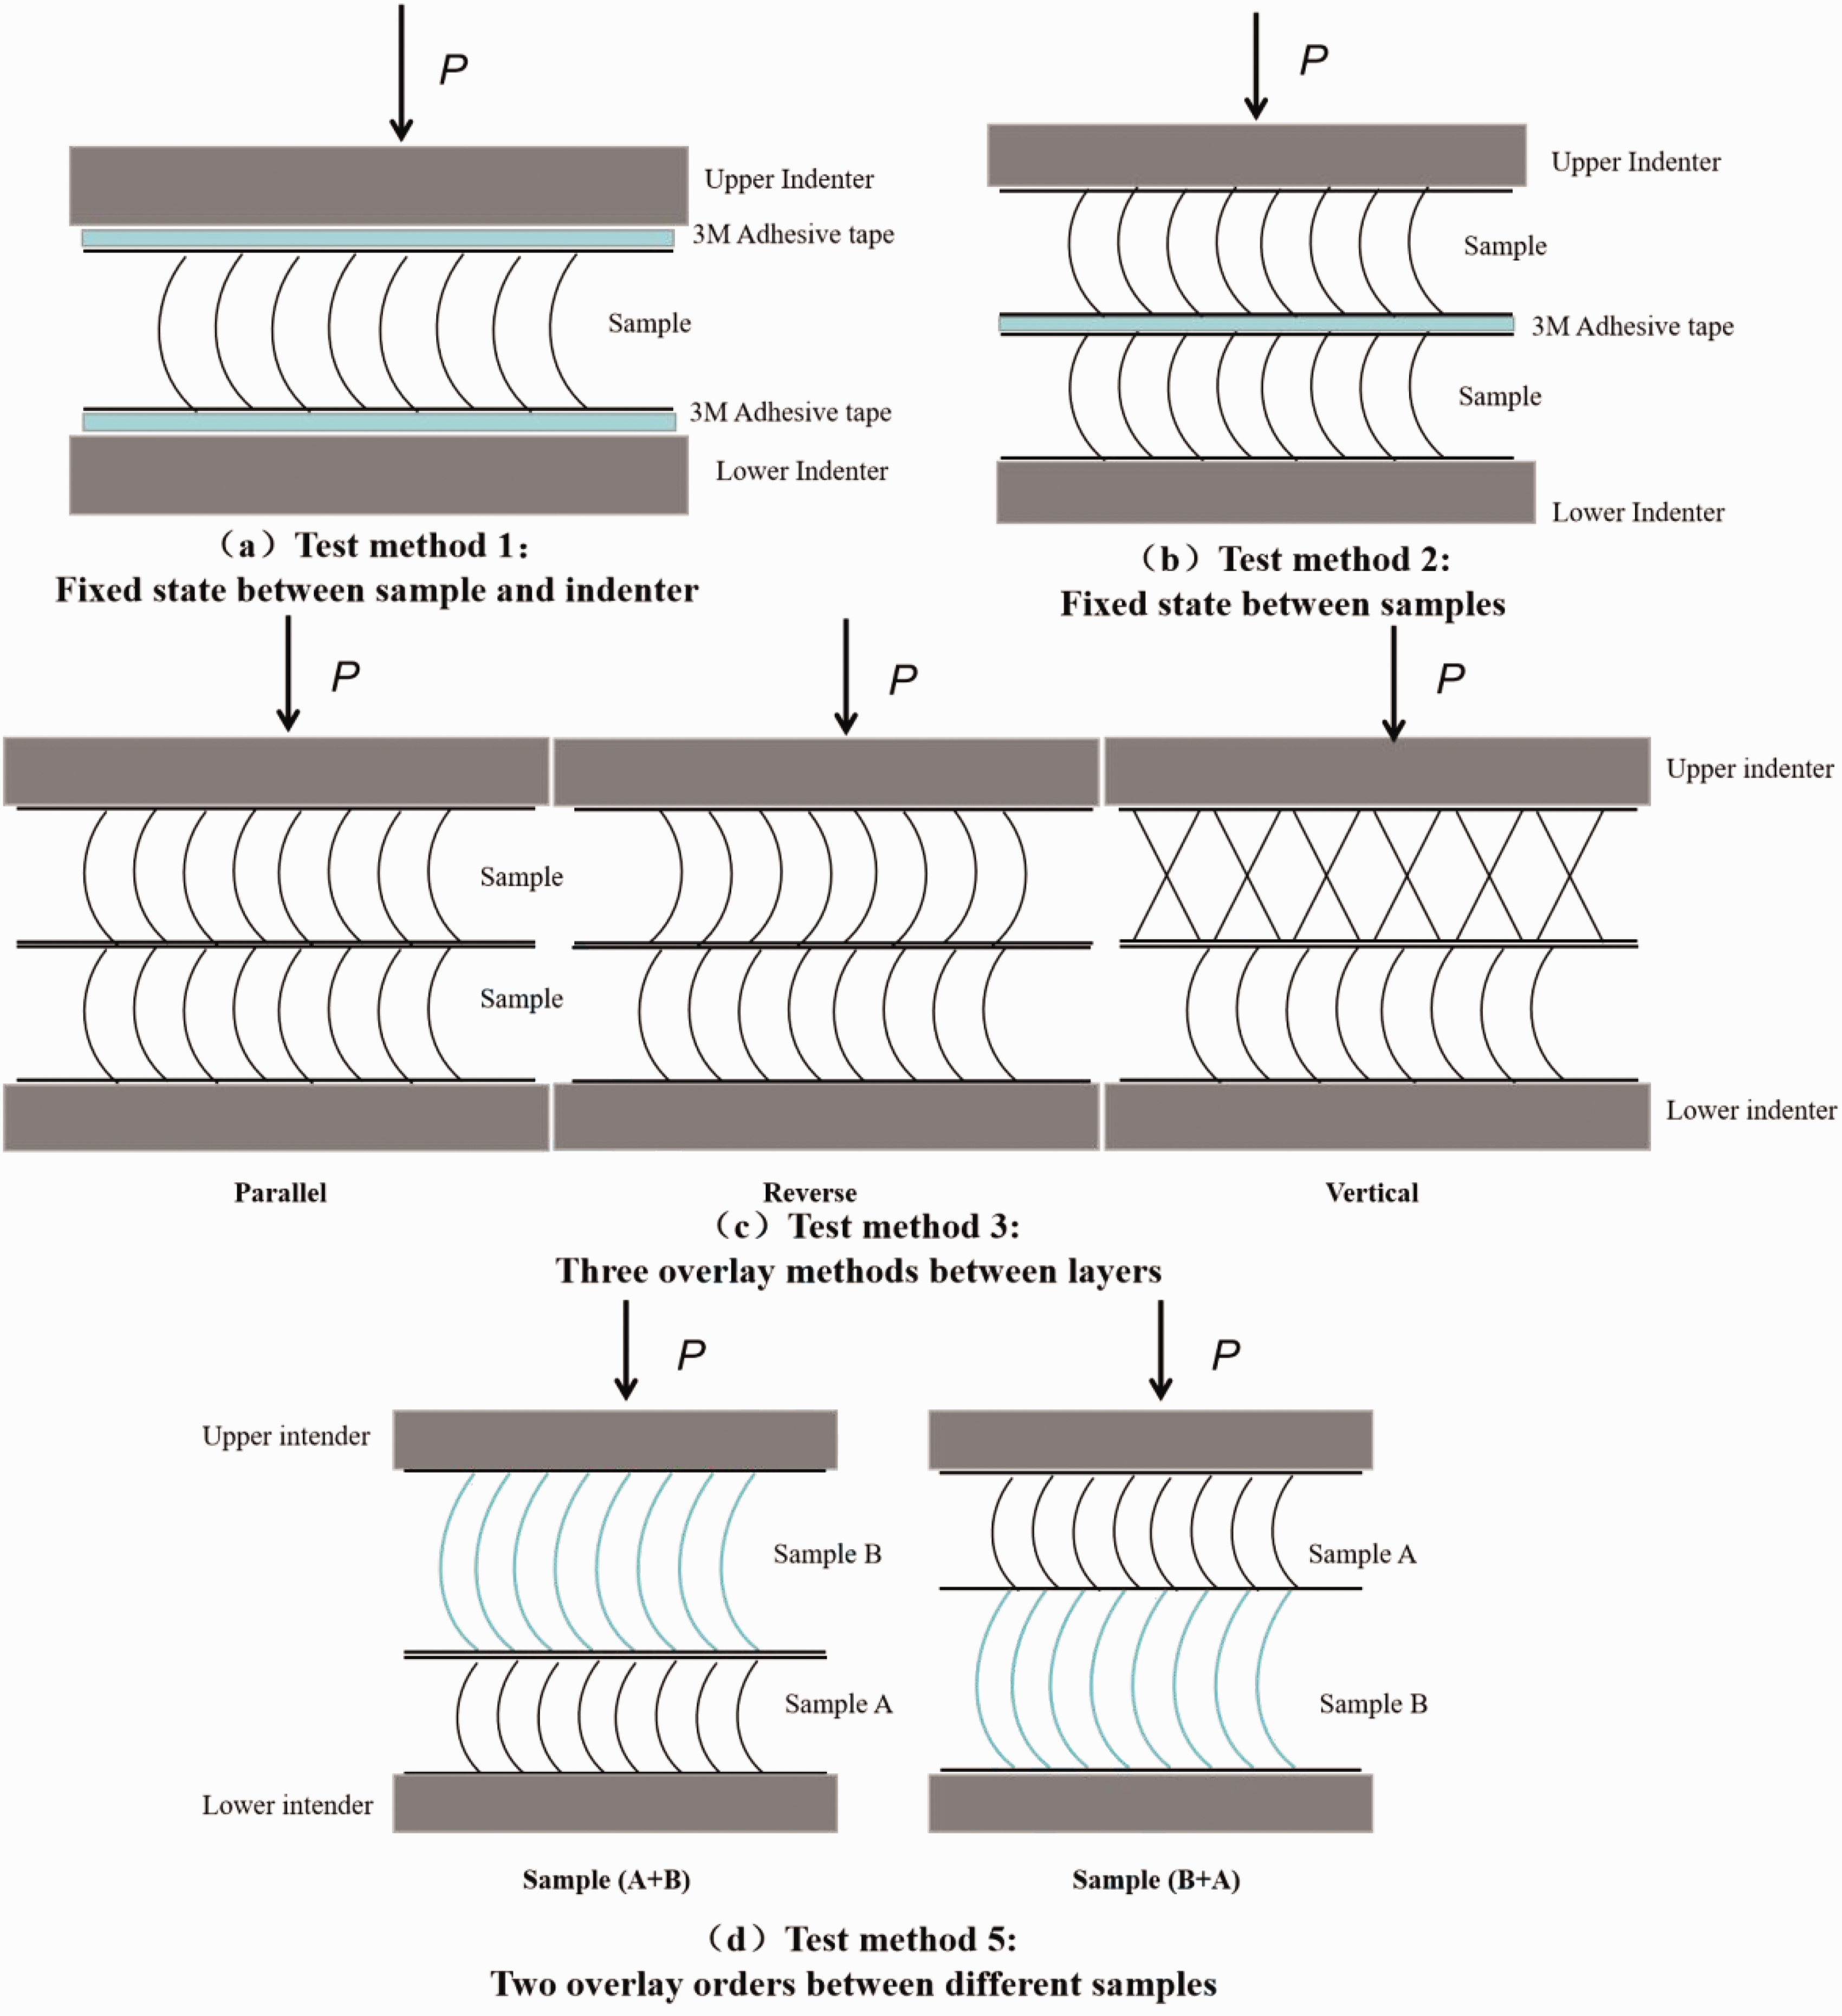
This part of the experimental data comes from experimental method 1: test of fixation or no fixation between the sample and the indenter. Figure 6 shows the compressive stress–strain curve before and after fixation between the sample and the test indenter. It can be seen from the figure that typical compression curves for a spacer fabric can be divided into four stages: initial stage I, linear elastic stage II, yield stage III and densification stage IV. The deformation mechanism of each stage is as follows. (a) Stage I: the spacer fabric is in its initial state, with some space between the upper and lower surfaces and the spacer filaments, the spacer filaments can move freely without restriction by the upper and lower surfaces and the fabric is effectively positioned. (b) Stage II: this stage is relatively short, and the upper and lower ends of the spacer yarn are effectively fixed by the surface layer, which is a small deformation state before the instability. (c) Stage III: after the yield point, when entering the yield stage, the spacer filaments are unstable and elastically deformed. (d) Stage IV: intimate contact between the upper and lower surface layers and spacer filaments; the small strain requires large stress.
Compression stress–strain curve before and after fixation between the specimen and the indenter.
The compression curves of samples A and B include four stages; stages I, II and IV have basically the same trend shape, and there are large differences in stage III, because the deformation of the spacer filaments as the main force carrier is very different at this stage. The fixed points of the spacer yarns on the upper and lower surface layers are vertical to the surface layers when the spacer fabrics A and B are in their initial state, as shown in Figure 7(a). When sample A is stressed, the main deformation of the spacer filament is buckling, it presents instability state 1, as shown in Figure 7(b), that is, the spacer yarn will deform from the middle after the pressure reaches the limit and a peak point will appear in stage III. When sample B is stressed, the spacer filament presents instability state 2, as shown in Figure 7(c), that is, the spacer yarn will not end from the middle part, but from the upper part after the pressure reaches the limit, and the force is gradually increased in stage III, and there is no obvious peak point.
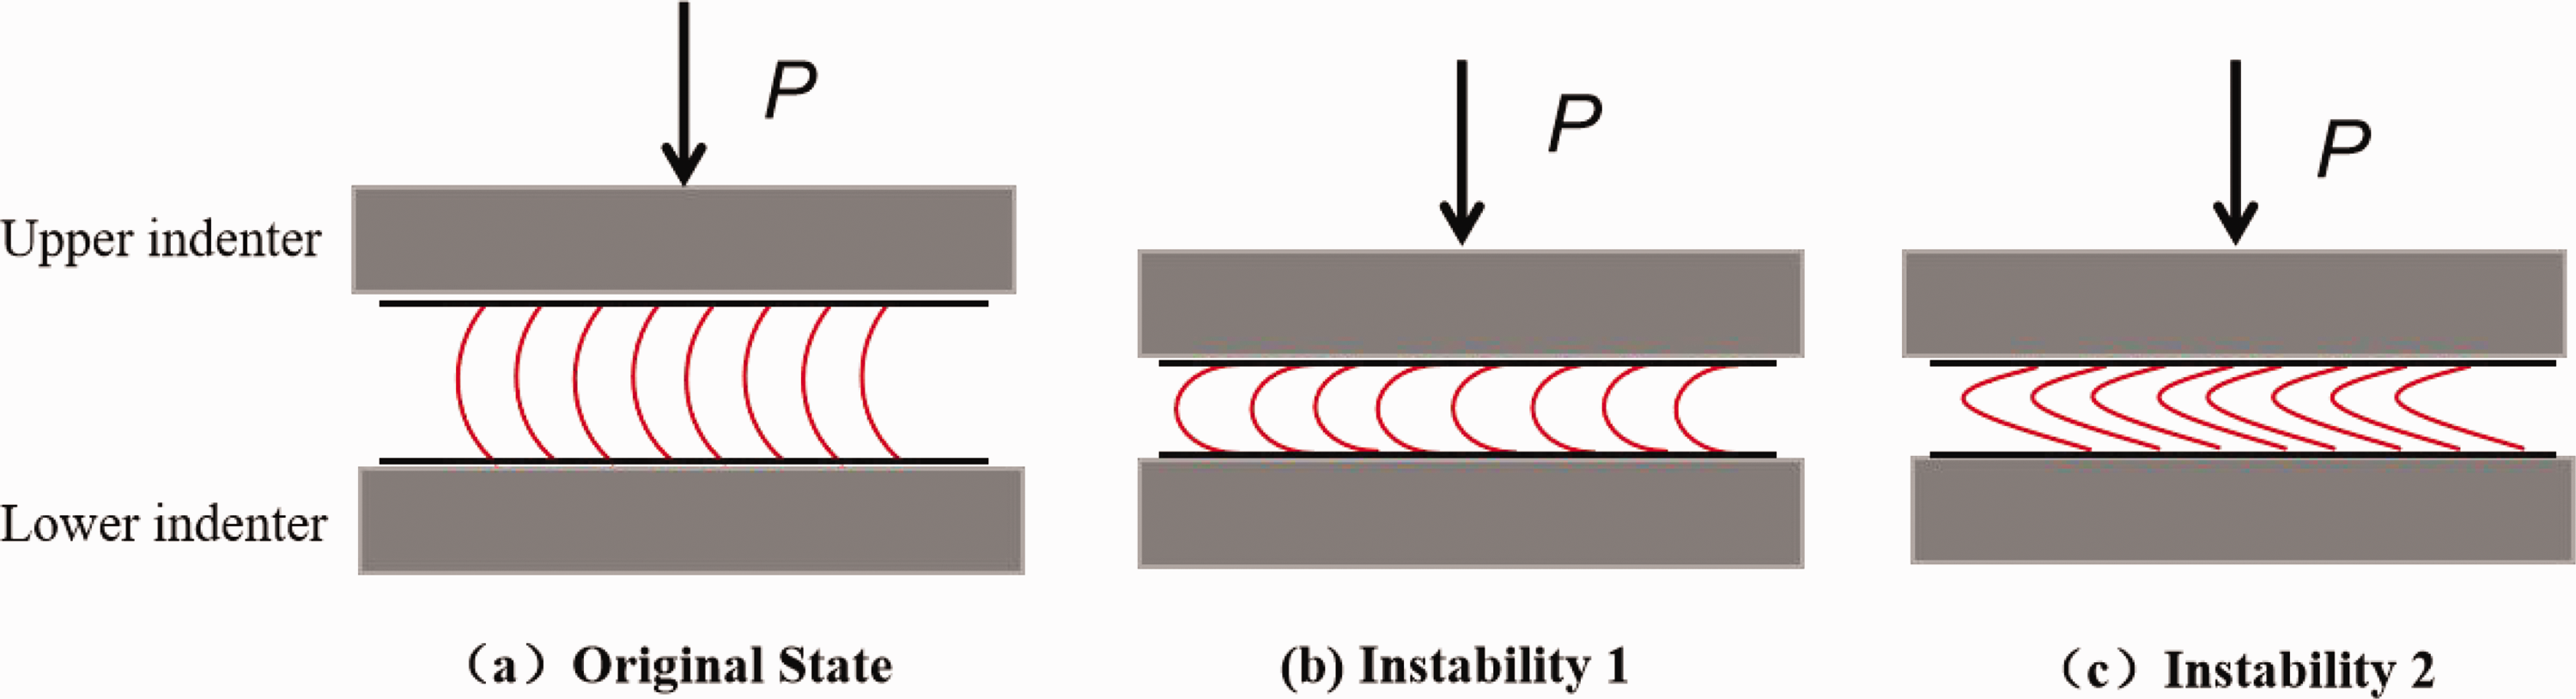
Spacer filament instability diagram.
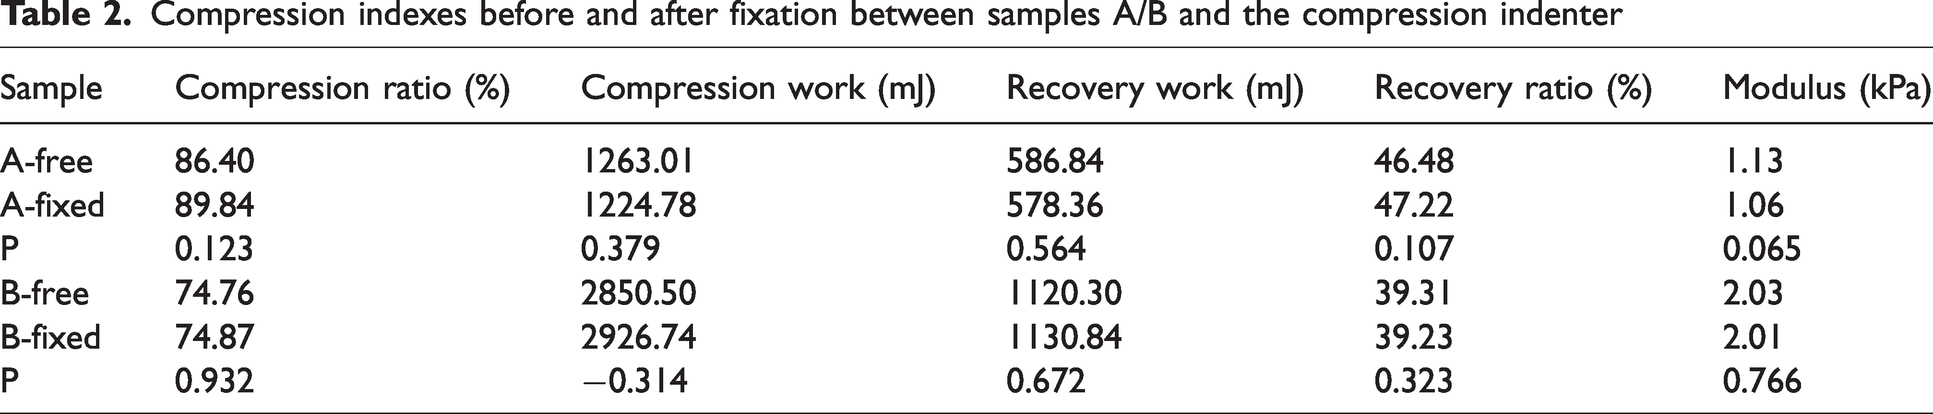
Table 2 shows the compression index average values before and after fixation between samples A and B and the indenter. In order to analyze whether the difference before and after fixation is significant, we use analysis of variance (ANOVA) to analyze the experimental results. In the table, P is the significance level; if P < 0.05, it means there is a significant difference and if P > 0.05, it means that the difference can be ignored. It can be seen from Table 2 that for samples A and B, the P-values of all compression indexes are greater than 0.05, which shows that when the material of the indenter is stainless steel, whether the indenter and the sample are fixed or not has a little influence on the compression experimental results.
Compression indexes before and after fixation between samples A/B and the compression indenter
There may be two reasons for spacer filament instability state 2: (1) during the compression process, relative motion occurs between the sample surface and the indenter, which causes the upper and lower fixed points of the spacer filament to move, resulting in instability state 2 of the spacer filament; (2) deformation occurs inside the spacer fabric, that is, shear, torsion and friction between the spacer filaments and the upper and lower surfaces of the spacer fabric, resulting instability state 2.
Based on the above test results, it can be concluded that whether the sample and the indenter are fixed or not has no significant impact on the compression results, especially for sample B, where the instability state of the spacer filament has not changed. This also shows that the real reason for spacer filament instability state 2 is the second reason mentioned above. The factors leading to reason (2) include the surface structure of the spacer fabric, the parameters of the spacer yarn, the weaving process, etc.
Analysis of compression results between layers with and without fixation
This part of the experimental data comes from experimental test method 2: the test of fixation and no fixation between layers. Figure 8 shows the force–displacement curve before and after fixation of samples A and B, in which the one-layered sample is the force–displacement curve before and after the indenter and the sample are fixed, and the two-layered sample is the force–displacement curve before and after the fixation between the layers.
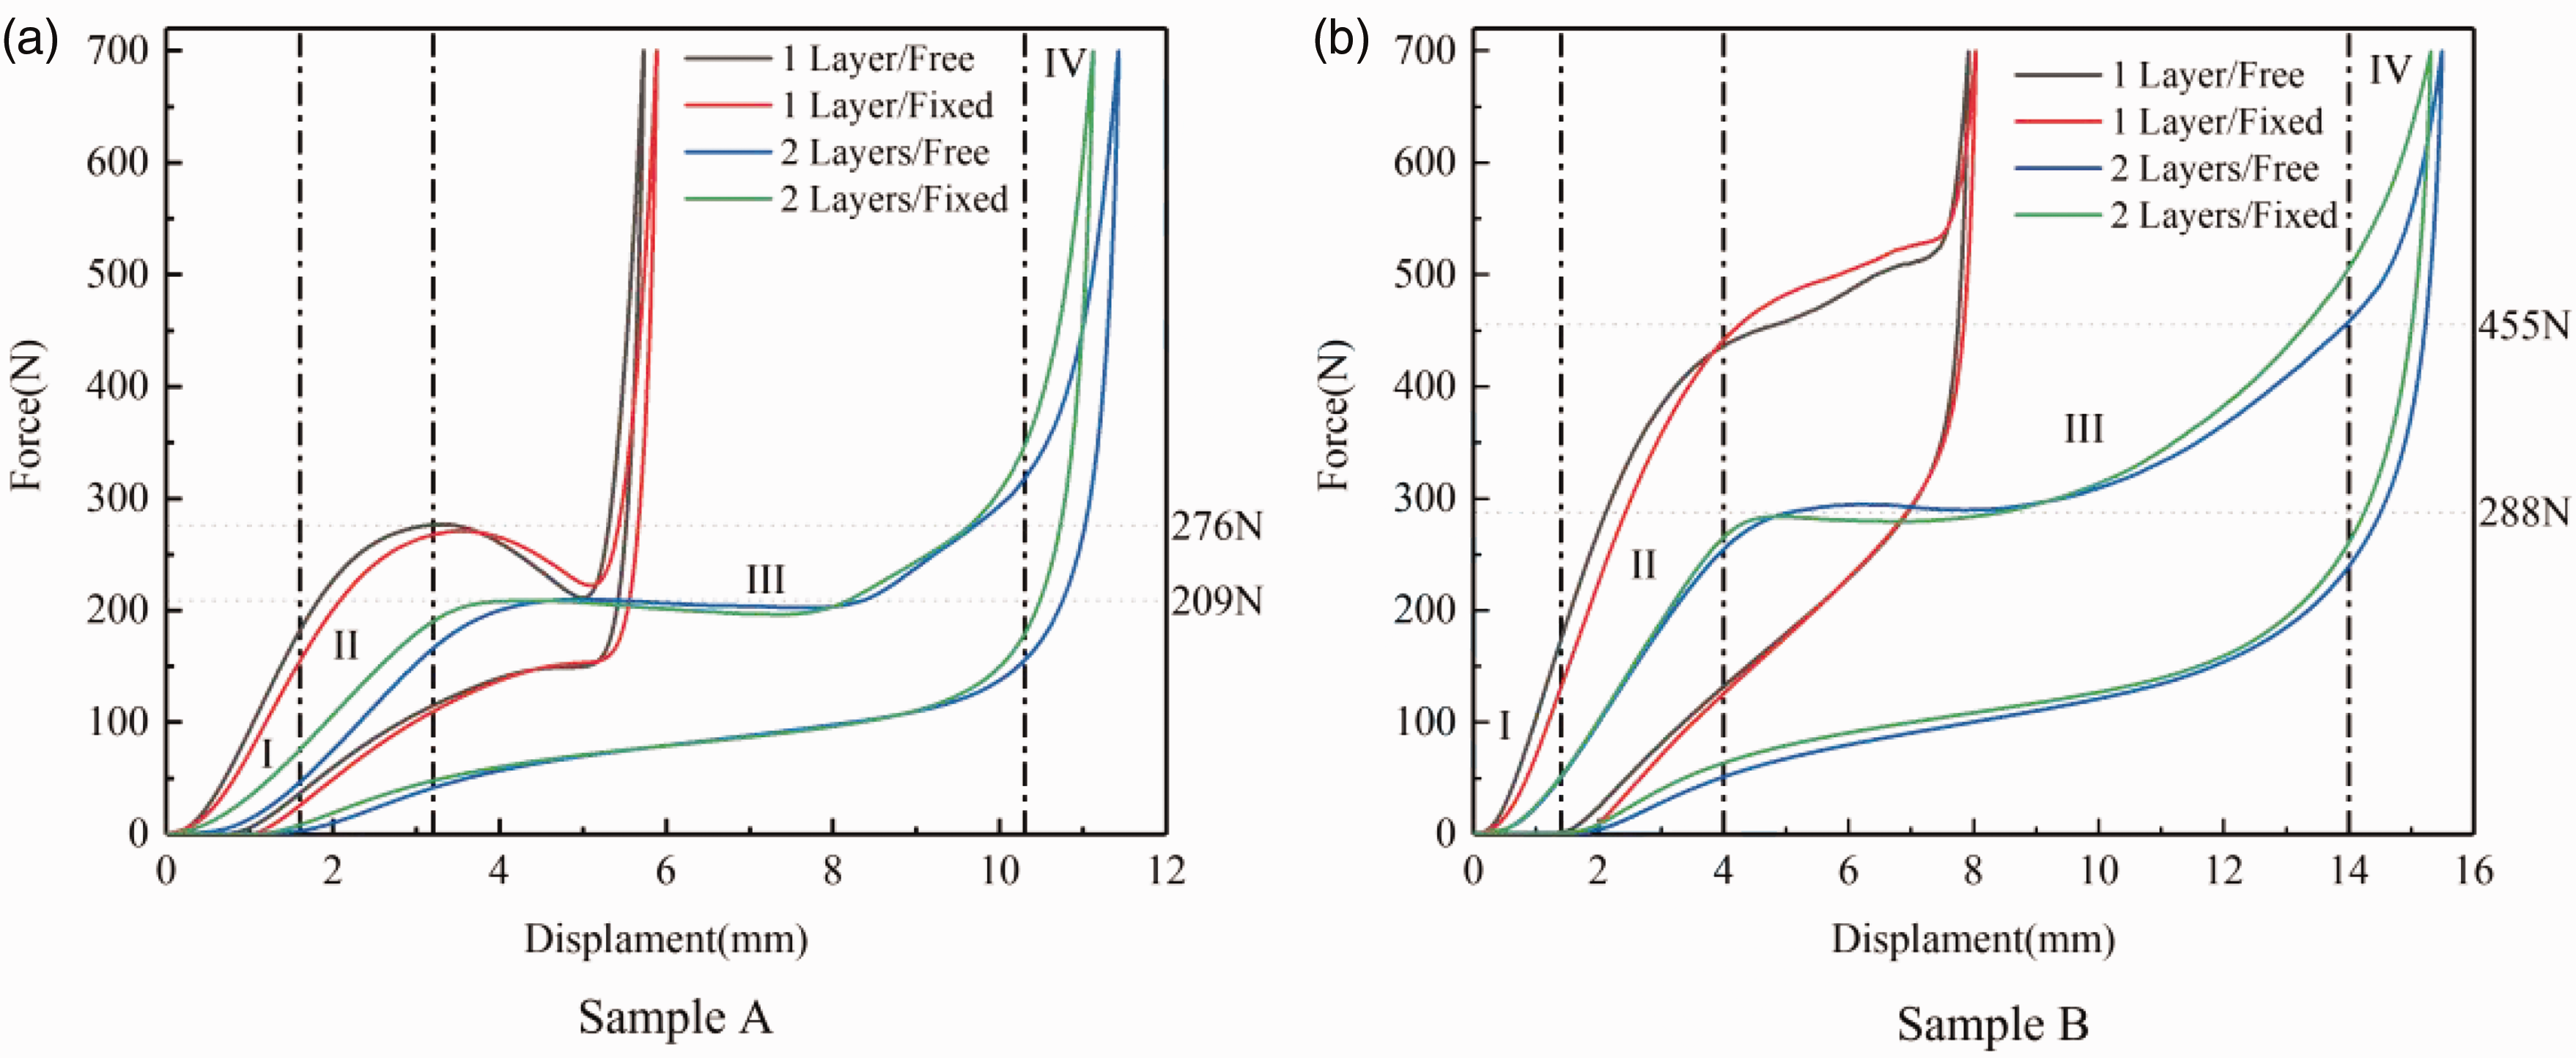
Compression force–displacement curves before and after fixation.
It can be observed from Figure 8 that the compression curve of a two-layered spacer fabric is also divided into four stages: the initial stage, linear elastic stage II, yield stage III and densification stage IV, but this is significantly different from the four stages of a one-layered spacer fabric. An analysis of combined deformation mechanisms is presented as follows. (1) Stage I: a space adjustment is made between the spacer filaments and the surface layer within the upper and lower spacer fabrics. Rather than the one-layered deformation mechanism, there is also a mechanism for adjusting the space between the upper and lower spacer fabrics. (2) Stage II: the spacer filament is the main force-bearing unit, and this stage refers to the small deformation of the filament itself before it becomes unstable. (3) Stage III: the spacer filaments are unstable and deformed. From Figure 8 it can be seen that there is a peak point of 276 N in sample A, there is no obvious peak point in the two-layered sample and the average value is 209 N. As for sample B, the one-layer curve shows an increasing trend, the minimum point force is 455 N and the two-layered curve shows a stable value until around 288 N, and then increases. It is evident from the results that at this stage, the one-layered specimen deforms differently from the two-layered specimen. Firstly, the upper layer destabilizes, followed by the lower layer, resulting in an ascending point in phase III. (4) Stage IV: in the dense stage, both the upper and lower layers of the spacer fabrics are compacted, as well as the contact parts between them.
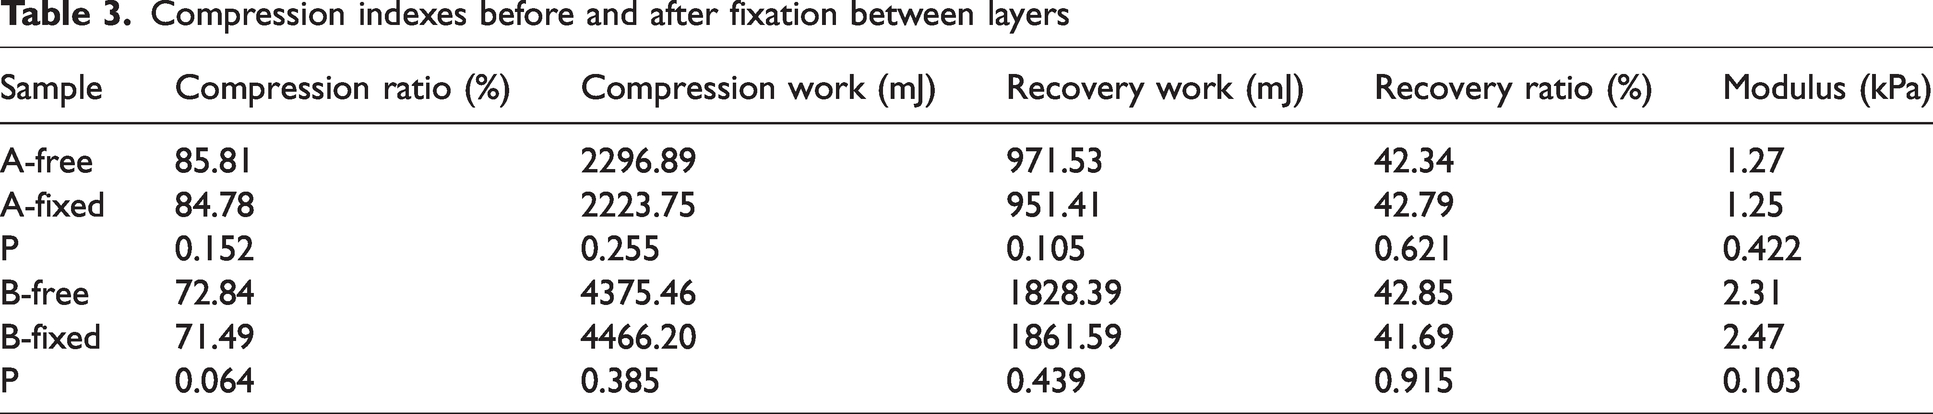
Table 3 shows the compression indexes average values and P-values obtained from ANOVA before and after fixing between layers. It can be seen from Table 3 that for samples A and B, the P-values of all compression indexes are greater than 0.05, which shows that when the material of the indenter is stainless steel, the influence of whether the sample layer is fixed or not on the test results is negligible. With the analysis of the compression process of the two-layered spacer fabric, it can be determined that no external force is acting on the contact surface between the upper and lower two-layer spacer fabrics in the lateral direction. The most important factor is the torsional force of the upper layer acting on the lower layer, and the friction between the two layers is extremely high, so there is no relative slippage between the two layers, but the overall contact surface will be translated to the right.
Compression indexes before and after fixation between layers
Analysis of test results of the same sample with different overlay directions
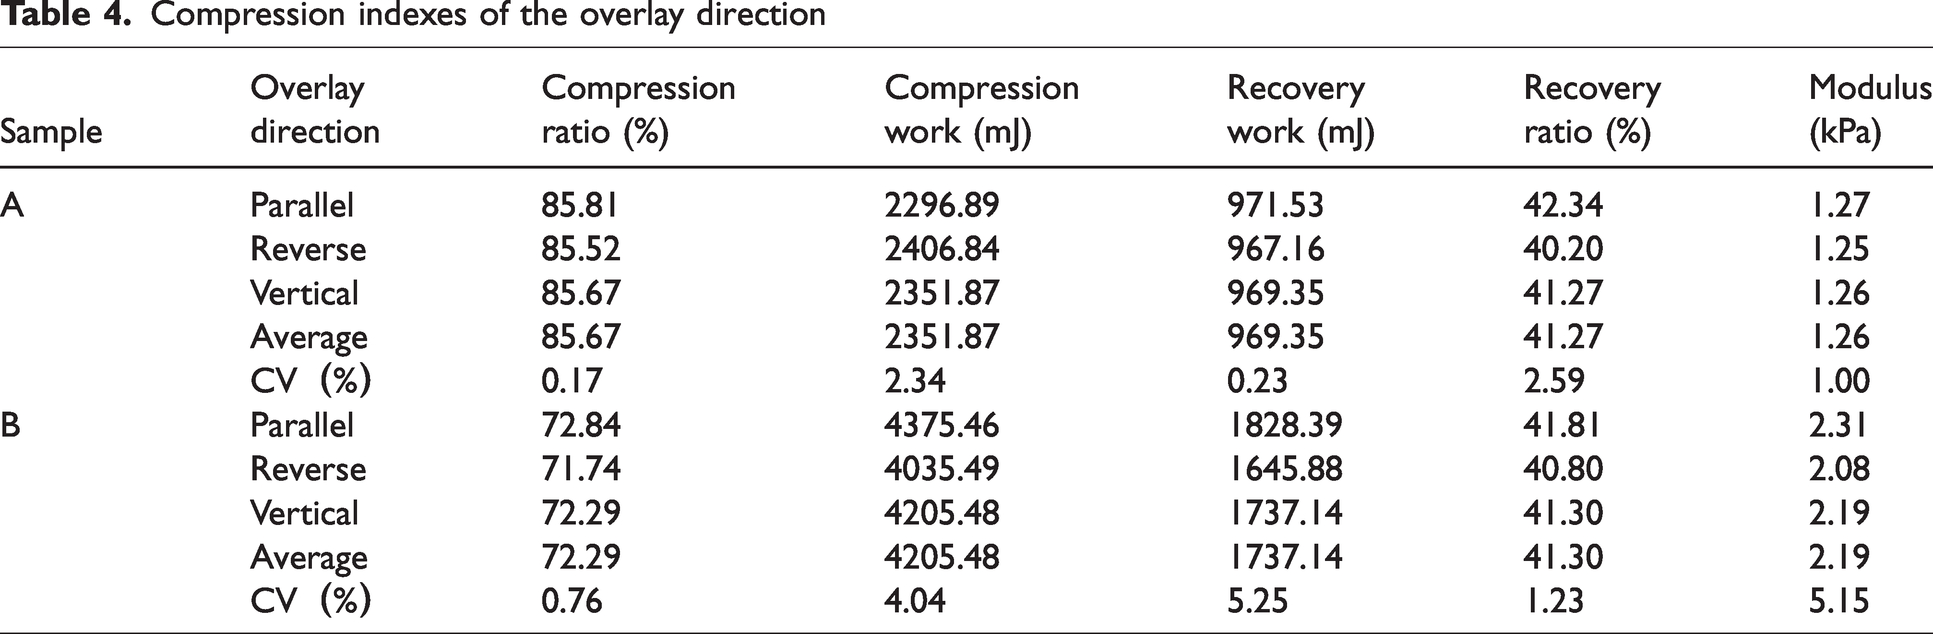
This part of the experimental data comes from experimental test method 3: tests of the same sample with different overlay directions. Table 4 illustrates the compression index average values and the statistical analysis results for the two-layered spacer fabric in three different overlay directions. For sample A, the CV values of the compression ratio, compression work, recovery work, recovery ratio and modulus are 0.17%, 2.34%, 0.23%, 2.59% and 1%, respectively, and none of them exceeds 3%. For sample B, the CV values of the compression ratio, compression work, recovery work, recovery ratio and modulus are 0.76%, 4.04%, 5.25%, 1.23% and 5.15%, respectively, and none of them exceeds 6%. As a result, when the two-layered fabric is overlaid, different overlay directions have little effect on the compression results and therefore can be ignored. According to the force analysis of the two-layered fabric during compression, it can be seen that the lower surface of the upper spacer fabric has a bending force to the right on the upper surface of the upper fabric, and then the upper layer drives the lower layer to move to the right. Different overlay directions have no effect on the deformation mechanism.
Compression indexes of the overlay direction
Analysis of compression results of different compression test speeds
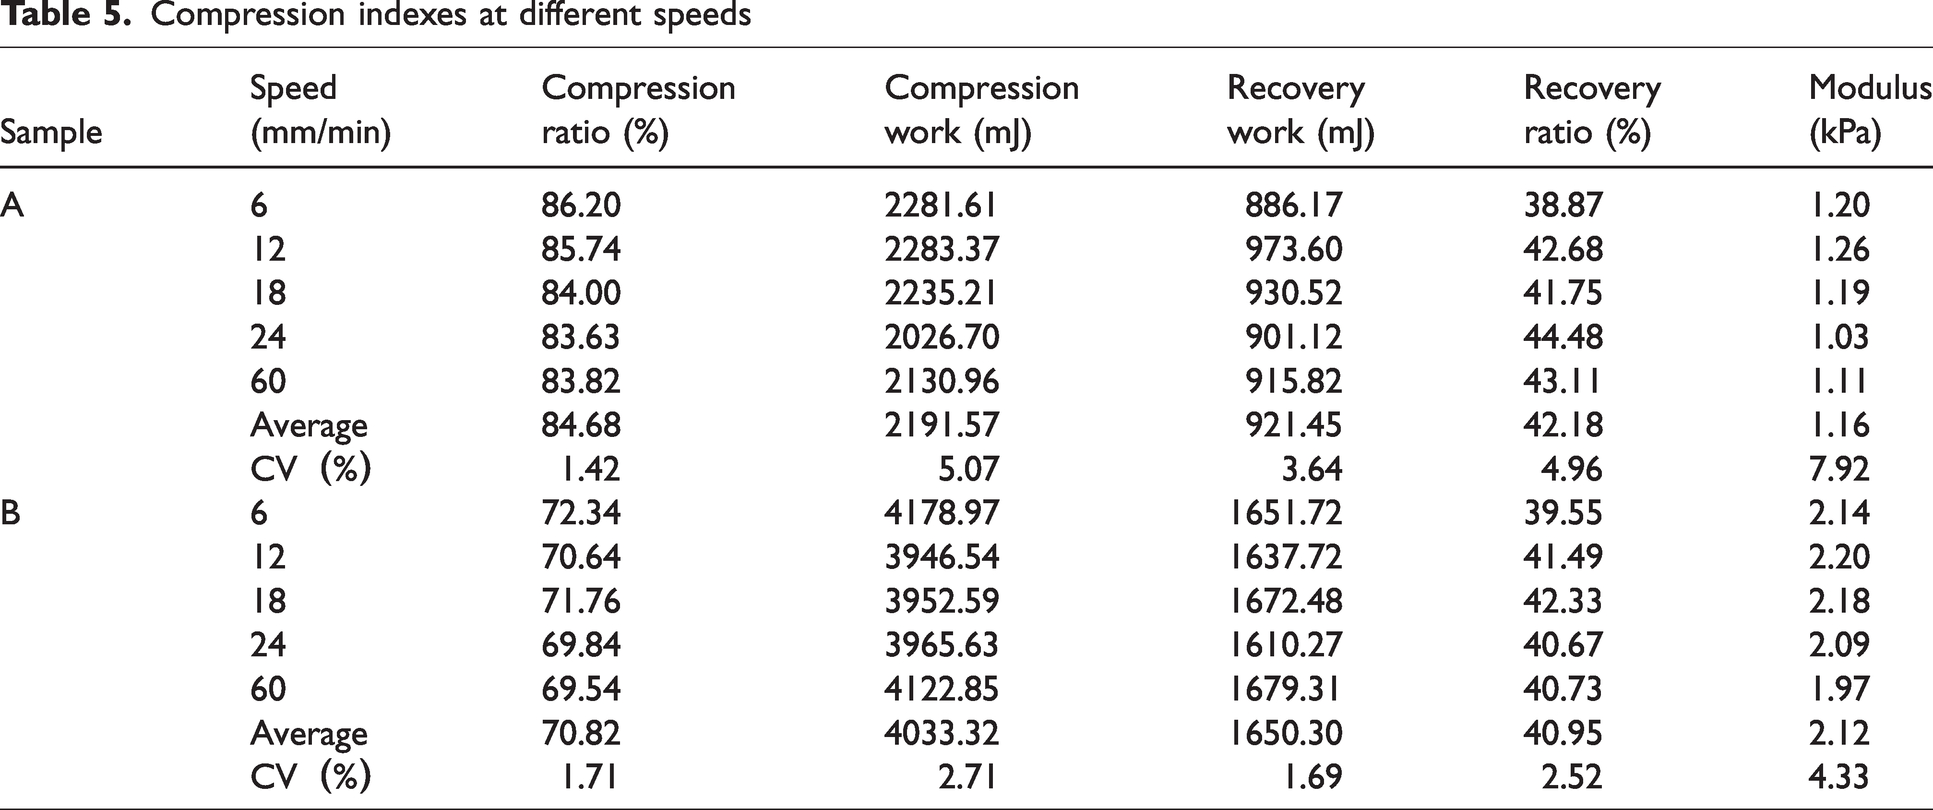
This part of the experimental data comes from experimental test method 4: tests of different compression test speeds. Table 5 shows the compression index average values and statistical analysis results of two-layered parallel overlaid samples at different speeds. For sample A, the CV values of the compression ratio, compression work, recovery work, recovery ratio and modulus are 1.42%, 5.07%, 3.64%, 4.96% and 7.92%, respectively, among which the CV value of the modulus is the largest, but none of them exceeds 8%. For sample B, the CV values of the compression ratio, compression work, recovery work, recovery ratio and modulus are 1.71%, 2.71%, 1.69%, 2.52% and 4.33%, respectively, but none of them exceeds 5%. The above data shows that, when a two-layer fabric is overlaid, different compression speeds have little influence on the compression results.
Compression indexes at different speeds
Analysis of compression results of a different overlay order between different samples
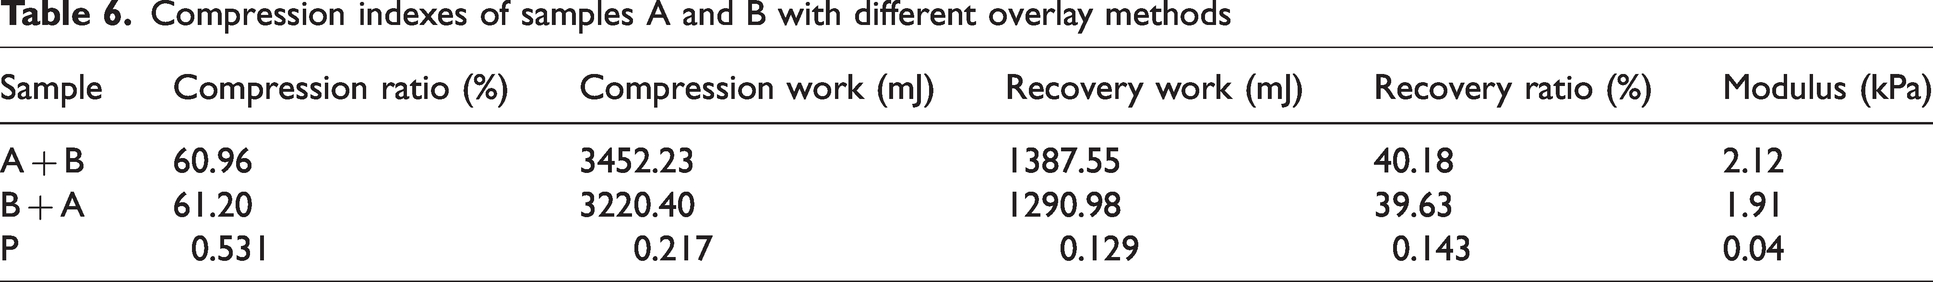
This part of the experimental data comes from experimental test method 5: tests of a different overlay order between different sample. Table 6 shows the compression indexes average values and P-values obtained from ANOVA of the different overlay order of two-layered structure between samples A and B. It can be seen from the table that the P-values of the compression ratio, compression work and recovery work are all greater than 0.05, but the P-value of the modulus is less than 0.05, which shows that the overlay order of samples A and B has a significant effect on the modulus. The fabric with a high modulus is on top of the fabric with a low modulus when spacer fabrics with different moduli are overlaid. In the table, the data results of all the compression indexes of sample (A + B) are better than those of sample (B + A). Therefore, it can be concluded that the different overlay order between samples A and B has an impact on the compression results.
Compression indexes of samples A and B with different overlay methods
During the test, it was found that sample (A + B) is that the upper surface of sample A is in contact with the lower surface of sample B. The contact surface moves to the left when a compressive force is applied, as shown in Figure 9(a). For sample (B + A), the contact surface moves to the right during compression, as shown in Figure 9(b). The instability state of the spacer filaments in spacer fabrics A and B is completely different from the one-layered experiment. Sample A does not appear to be folded in half in instability state 1, but is tilted left and right. However, sample B did not appear in the instability state 2, and also appeared to have tilting instability, which is mainly due to the “soft” support at the interface between the two samples. When sample (A + B) is stressed, the upper layer B is first stressed, and then it is transmitted to sample A. Since the “soft” support exists, layer B does not appear in instability state 2; rather, the force adjustment occurs first, resulting in the contact layer moving leftward. For sample (B + A), the upper layer A is first stressed, and then it is transmitted to sample B. Since the “soft” support exists, the contact layer moves to the right. The different deformation mechanisms are also responsible for the different moduli of the two samples.
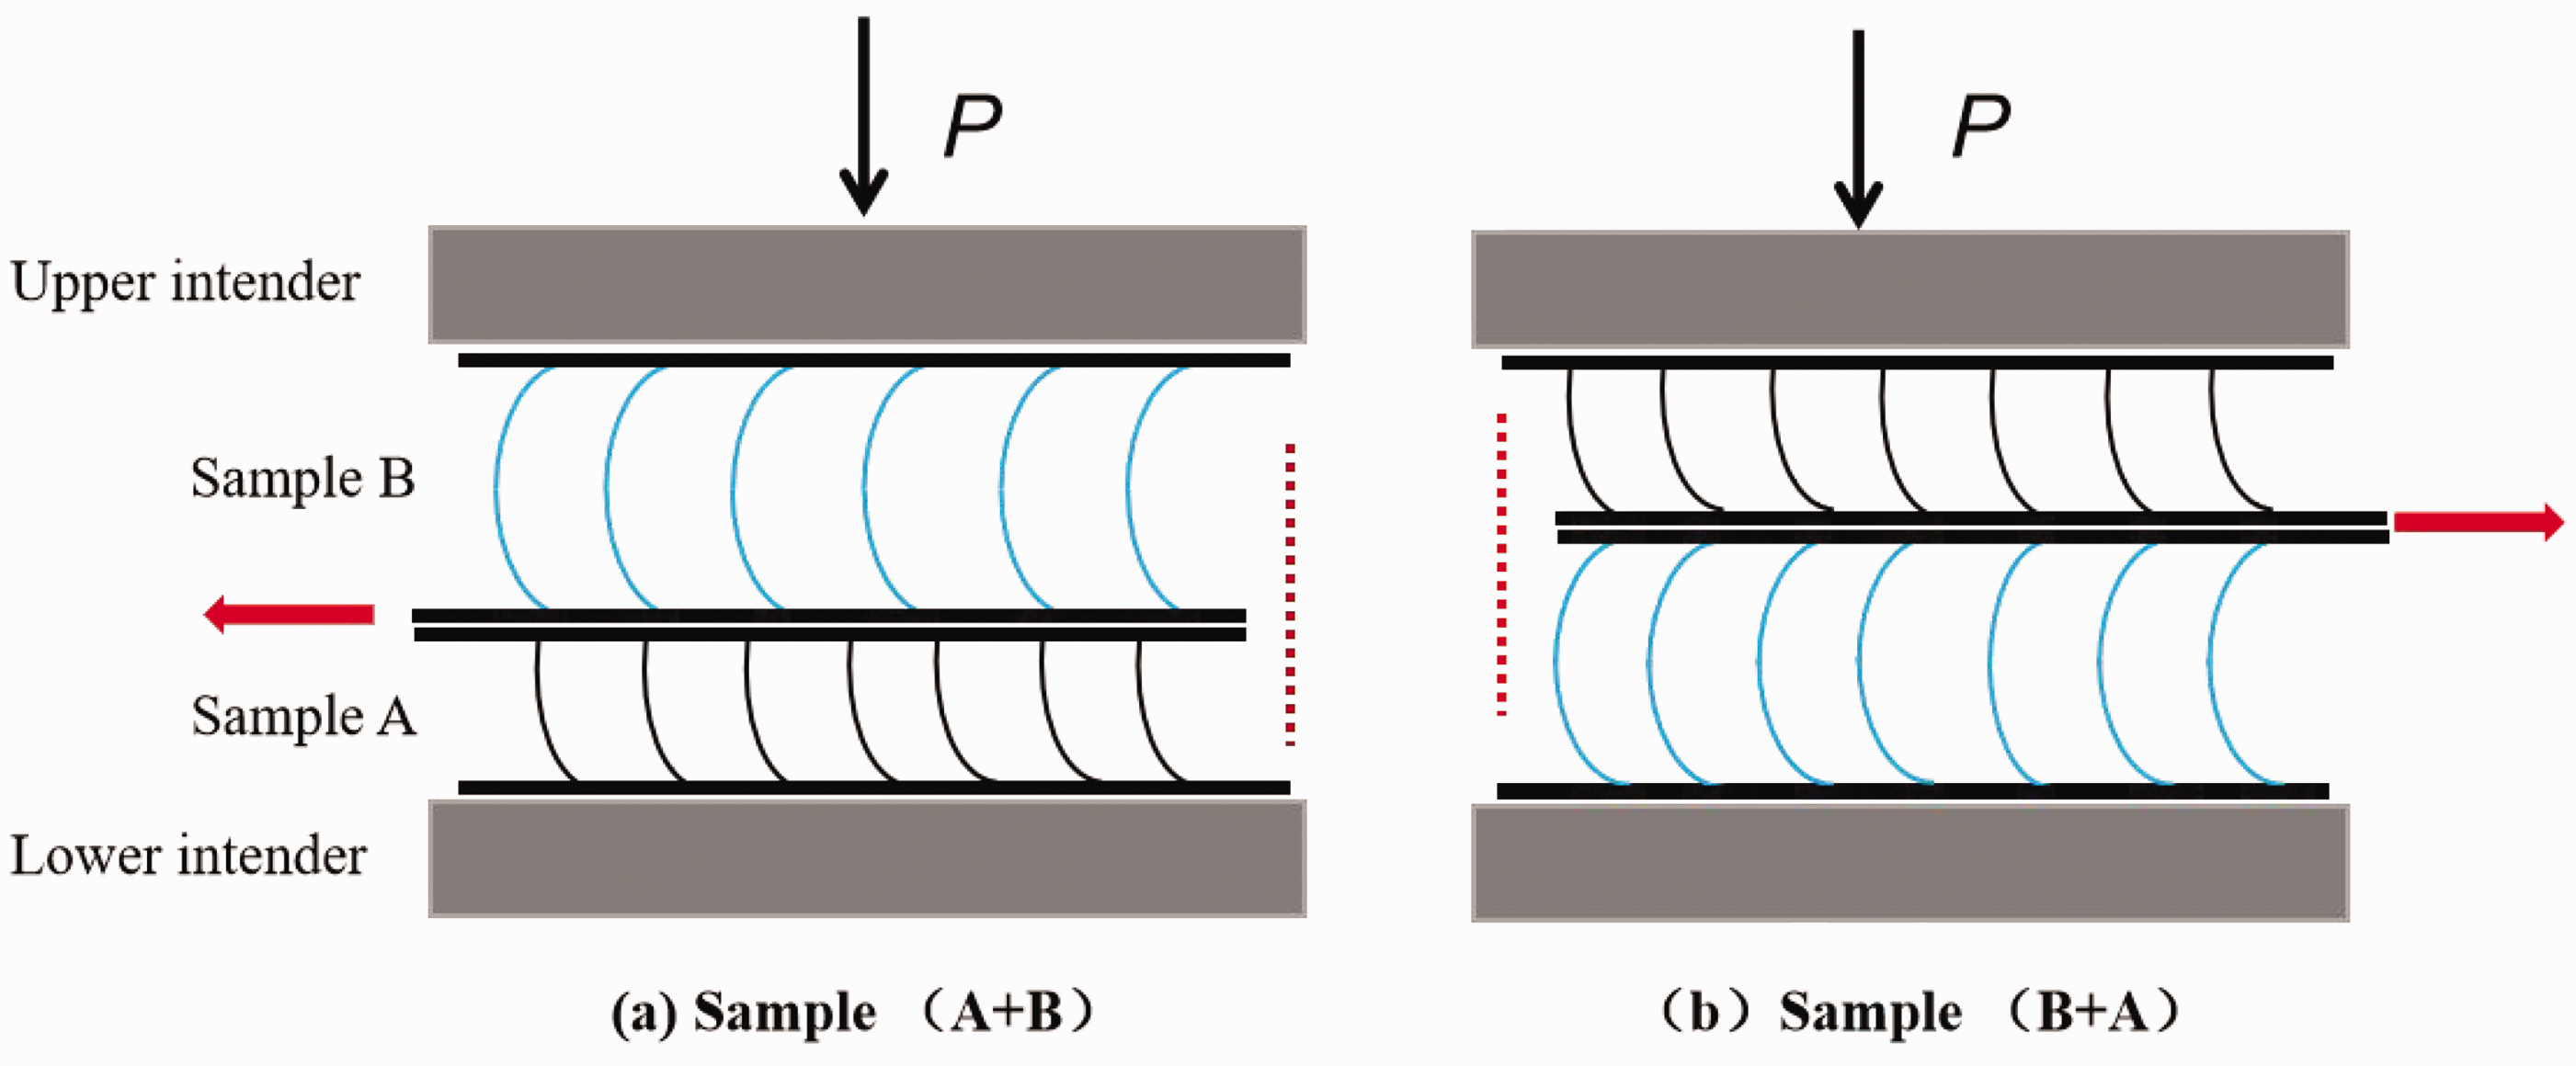
Compression deformation mechanism of samples A and B with different overlay methods.
Analysis of compression results of the same sample with different layers
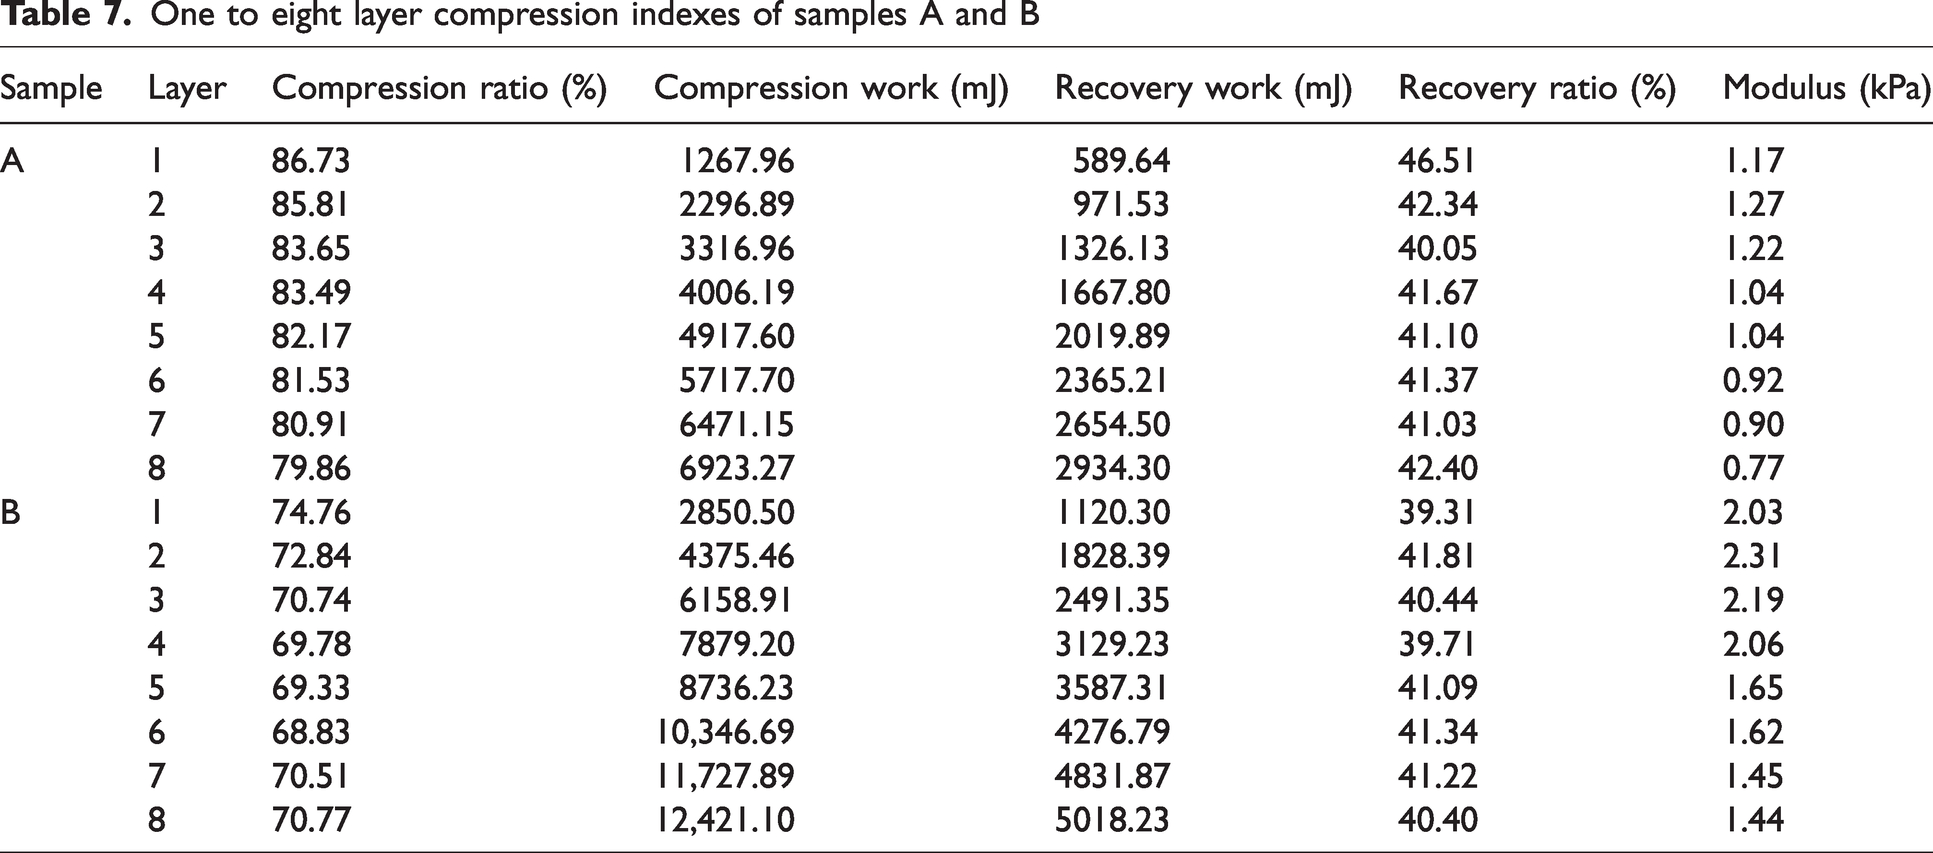
This part of the experimental data comes from experimental test method 6: test of the same sample with different layers. As shown in Table 7, the compression indexes average values for samples A and B from layers one to eight have been provided. As a mattress material, the compression work and modulus are important consideration parameters, so the relationship among the number of layers, compression work and modulus is further analyzed. Figures 10(a) and (b) show the fitting curves between the compression work and the number of layers of samples A and B, the relationship is y = ax + b and the correlation coefficient R2 is 0.99, which has a very high fitting degree, while the a and b values depend on the type of spacer fabric. Figures 10(c) and (d) show the fitting curves between the modulus and the number of layers of samples A and B, and the relationship is y = ax 3 + bx2 + cx + d and the correlation coefficients R2 are 0.88 and 0.94 respectively, which has a very high fitting degree, while the a, b, c and d values depend on the type of spacer fabric. As can be seen from the above analysis, once the required modulus and compression work are determined, the required number of spacer fabric layers can be reversed, which has significant implications for the design of cushion materials for multi-layered spacer fabrics.
One to eight layer compression indexes of samples A and B
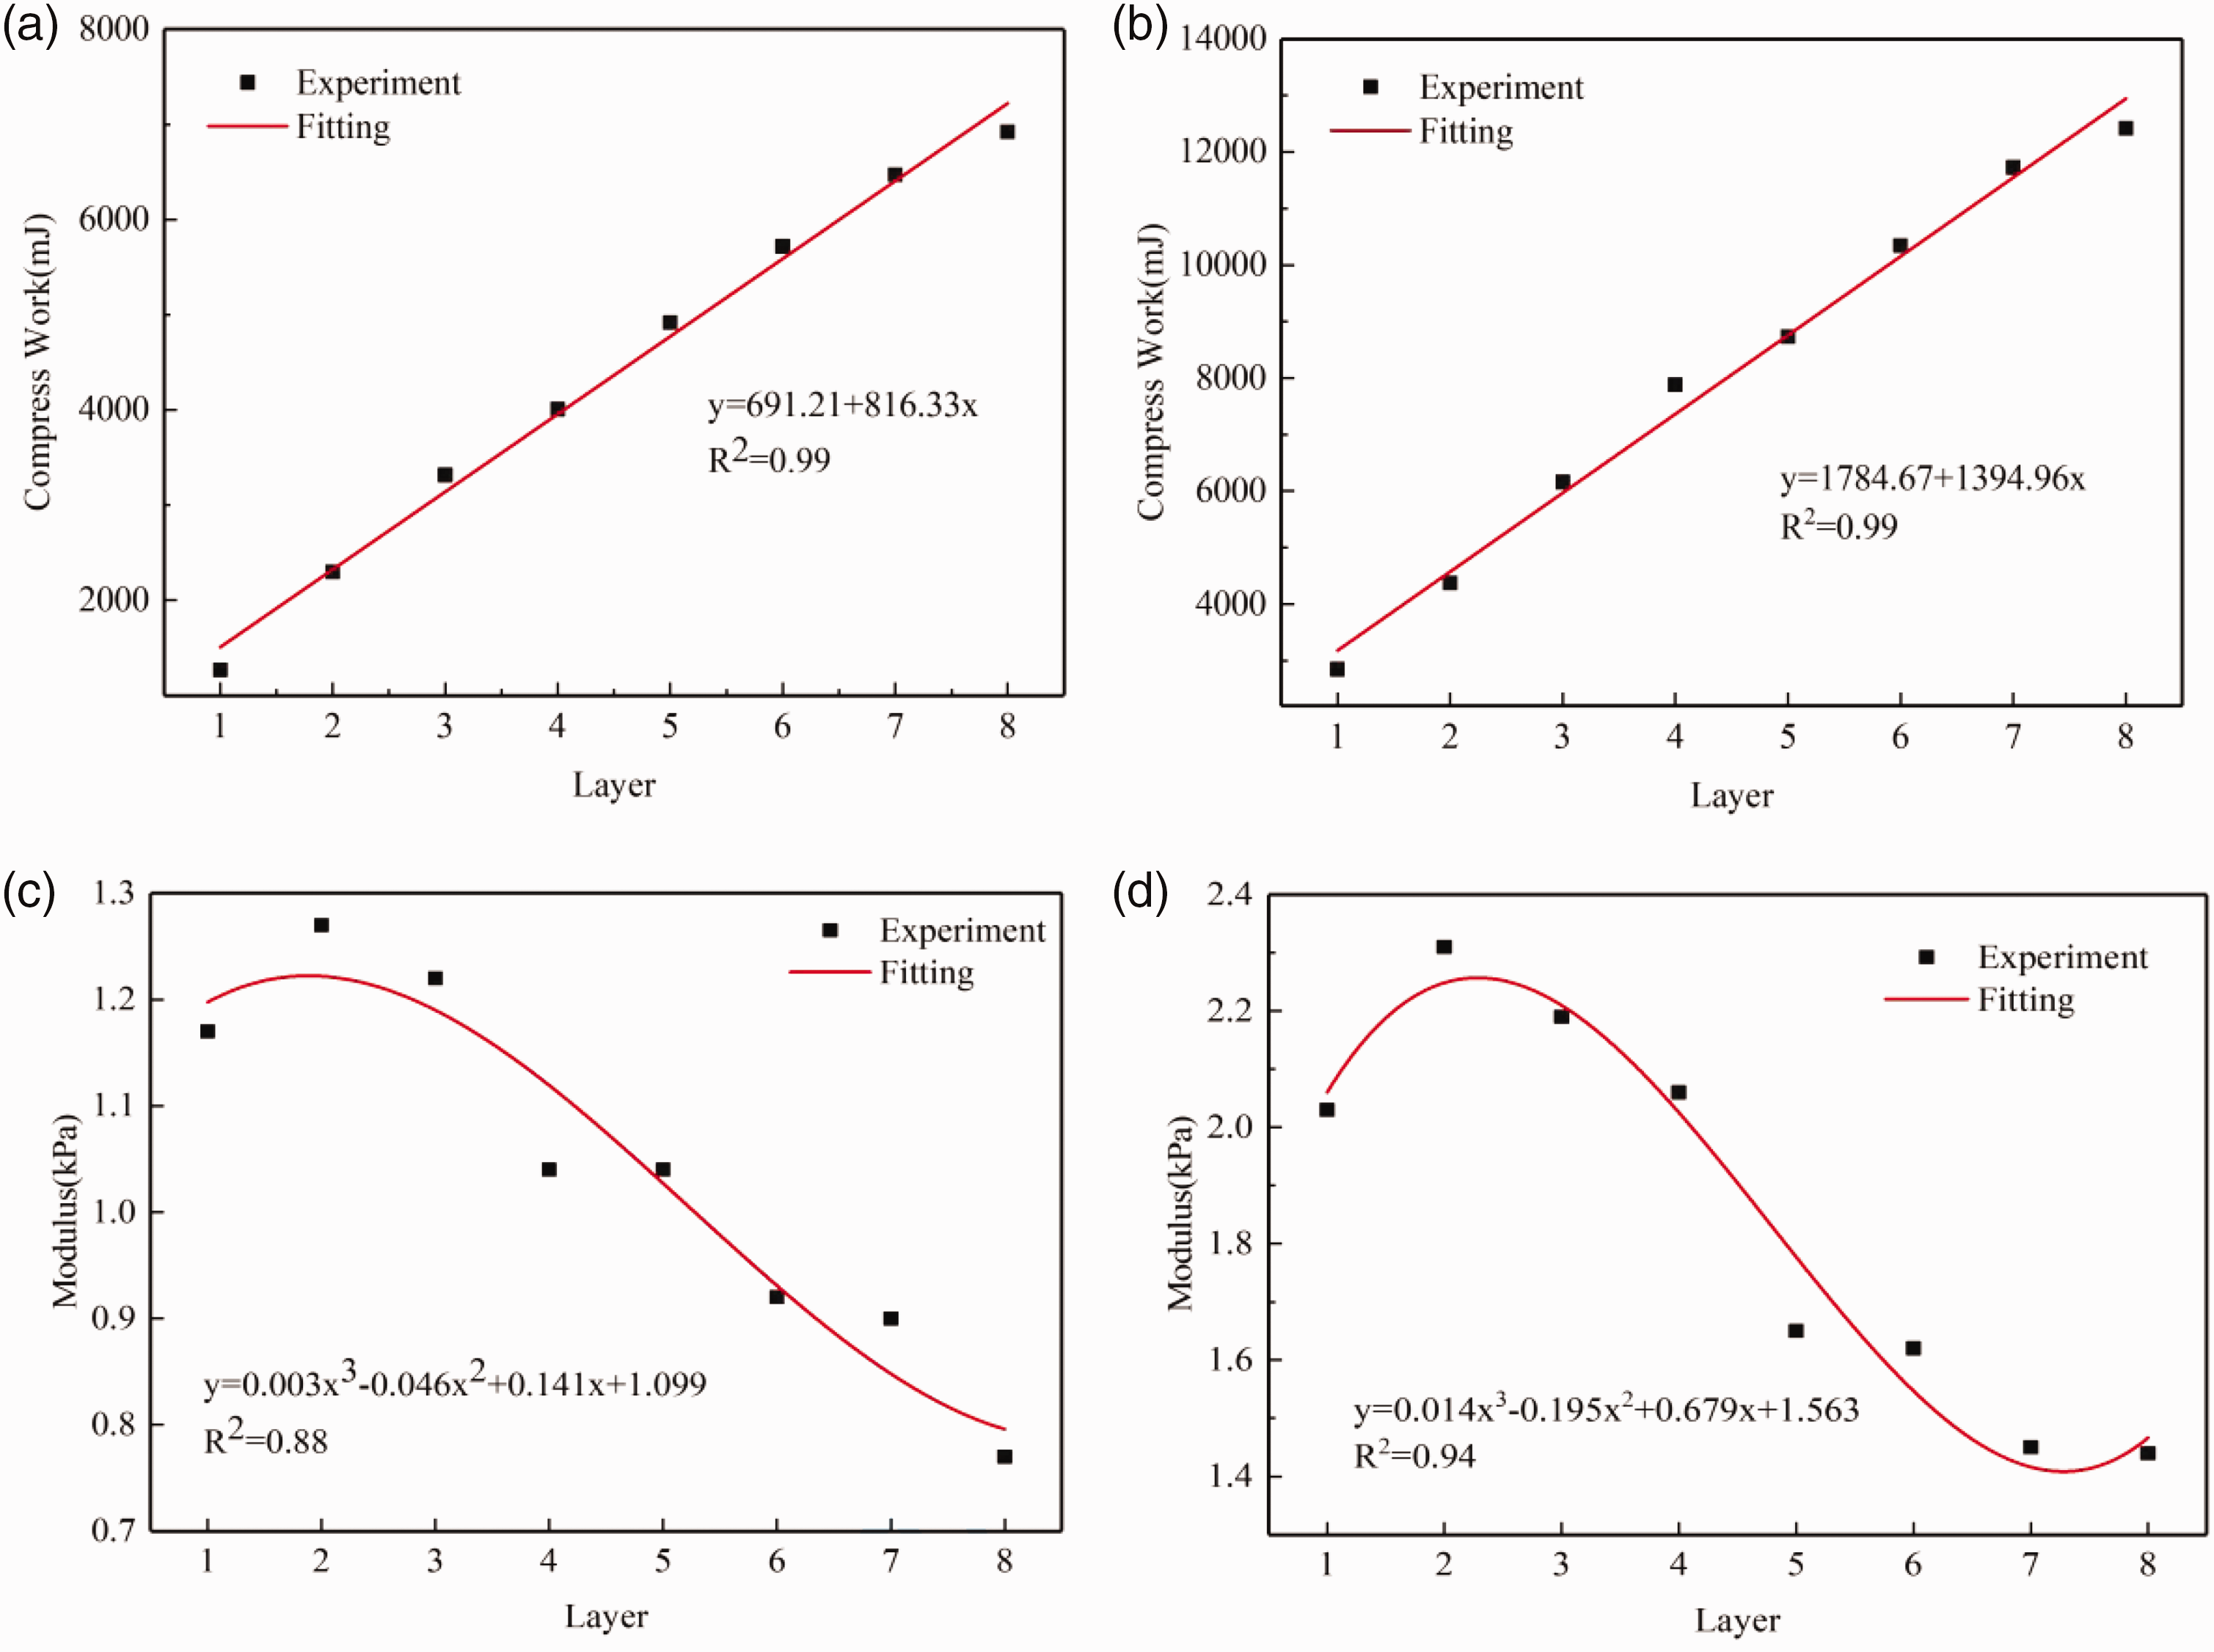
Fitting curve of the compression index layer.
Spacer fabrics are viscoelastic materials that combine the deformation characteristics of elastic solids and viscous fluids. According to the compression deformation mechanism analyzed above, it can be seen that stage II is the linear elastic stage. The kelvin model shown in Figure 11 can quantitatively characterize the performance of the spacer fabric in stage II. Based on this model, its compression modulus is calculated, and its suitability for the characterization of multi-layered spacer fabrics is evaluated.
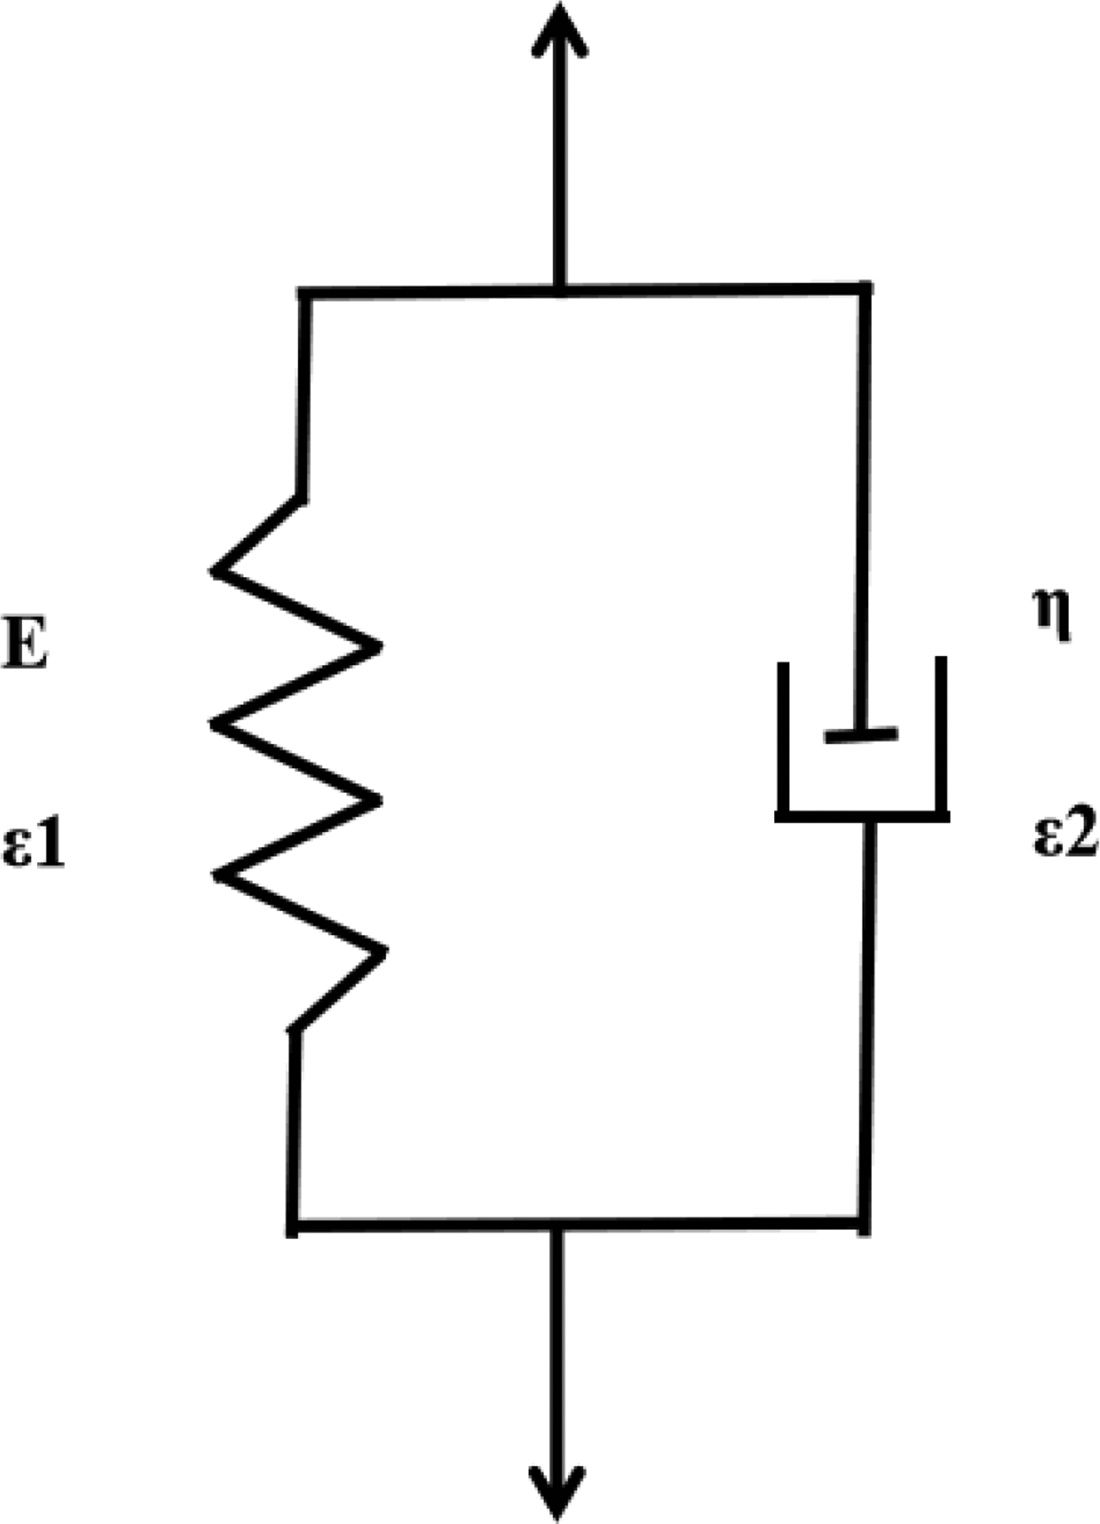
Kelvin model.
The constitutive relation equation is as follows:

It is a constant velocity compression experiment; therefore the following apply:


The calculation method of k is shown in Equation (8), where η is the viscosity coefficient, E is the elastic modulus and ϭ0 is the initial stress, which is 0.138 kPa. The Kelvin model's final stress–strain constitutive equation is Equation (9). The constitutive equation is brought into stage II for analysis of one-layered and multi-layered spacer fabrics, and the obtained average value of the modulus and viscosity coefficient are displayed in Table 8.
E and η at different layers
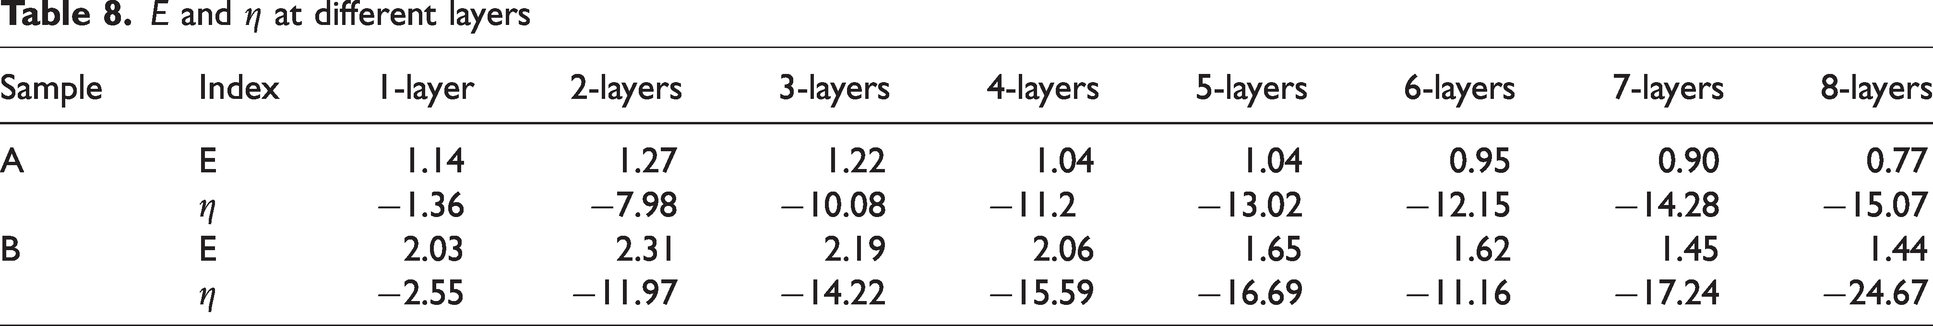
From Table 8 and Figure 12, it is apparent that with an increasing number of layers, the modulus first increases, and then decreases, and the two-layered spacer fabric has the highest modulus. However, the absolute value of the viscosity coefficient increases as the number of layers increases, except for the six layers. It is also shown that the viscosity of the material becomes increasingly important during the entire compression process, and the reasons are discussed as follows. (1) The surface thickness of the spacer fabric is much thinner than that of the spacer filaments. However, as the number of layers increases, the percentage of the surface on the whole becomes larger and larger, so the viscosity of the surface becomes larger and larger. (2) The force between the spacer fabric surface and the surface gradually increases as the number of layers increases. Based on the above analysis, it can be seen that the Kelvin model is a powerful tool for describing the compression deformation of multi-layered spacer fabrics.
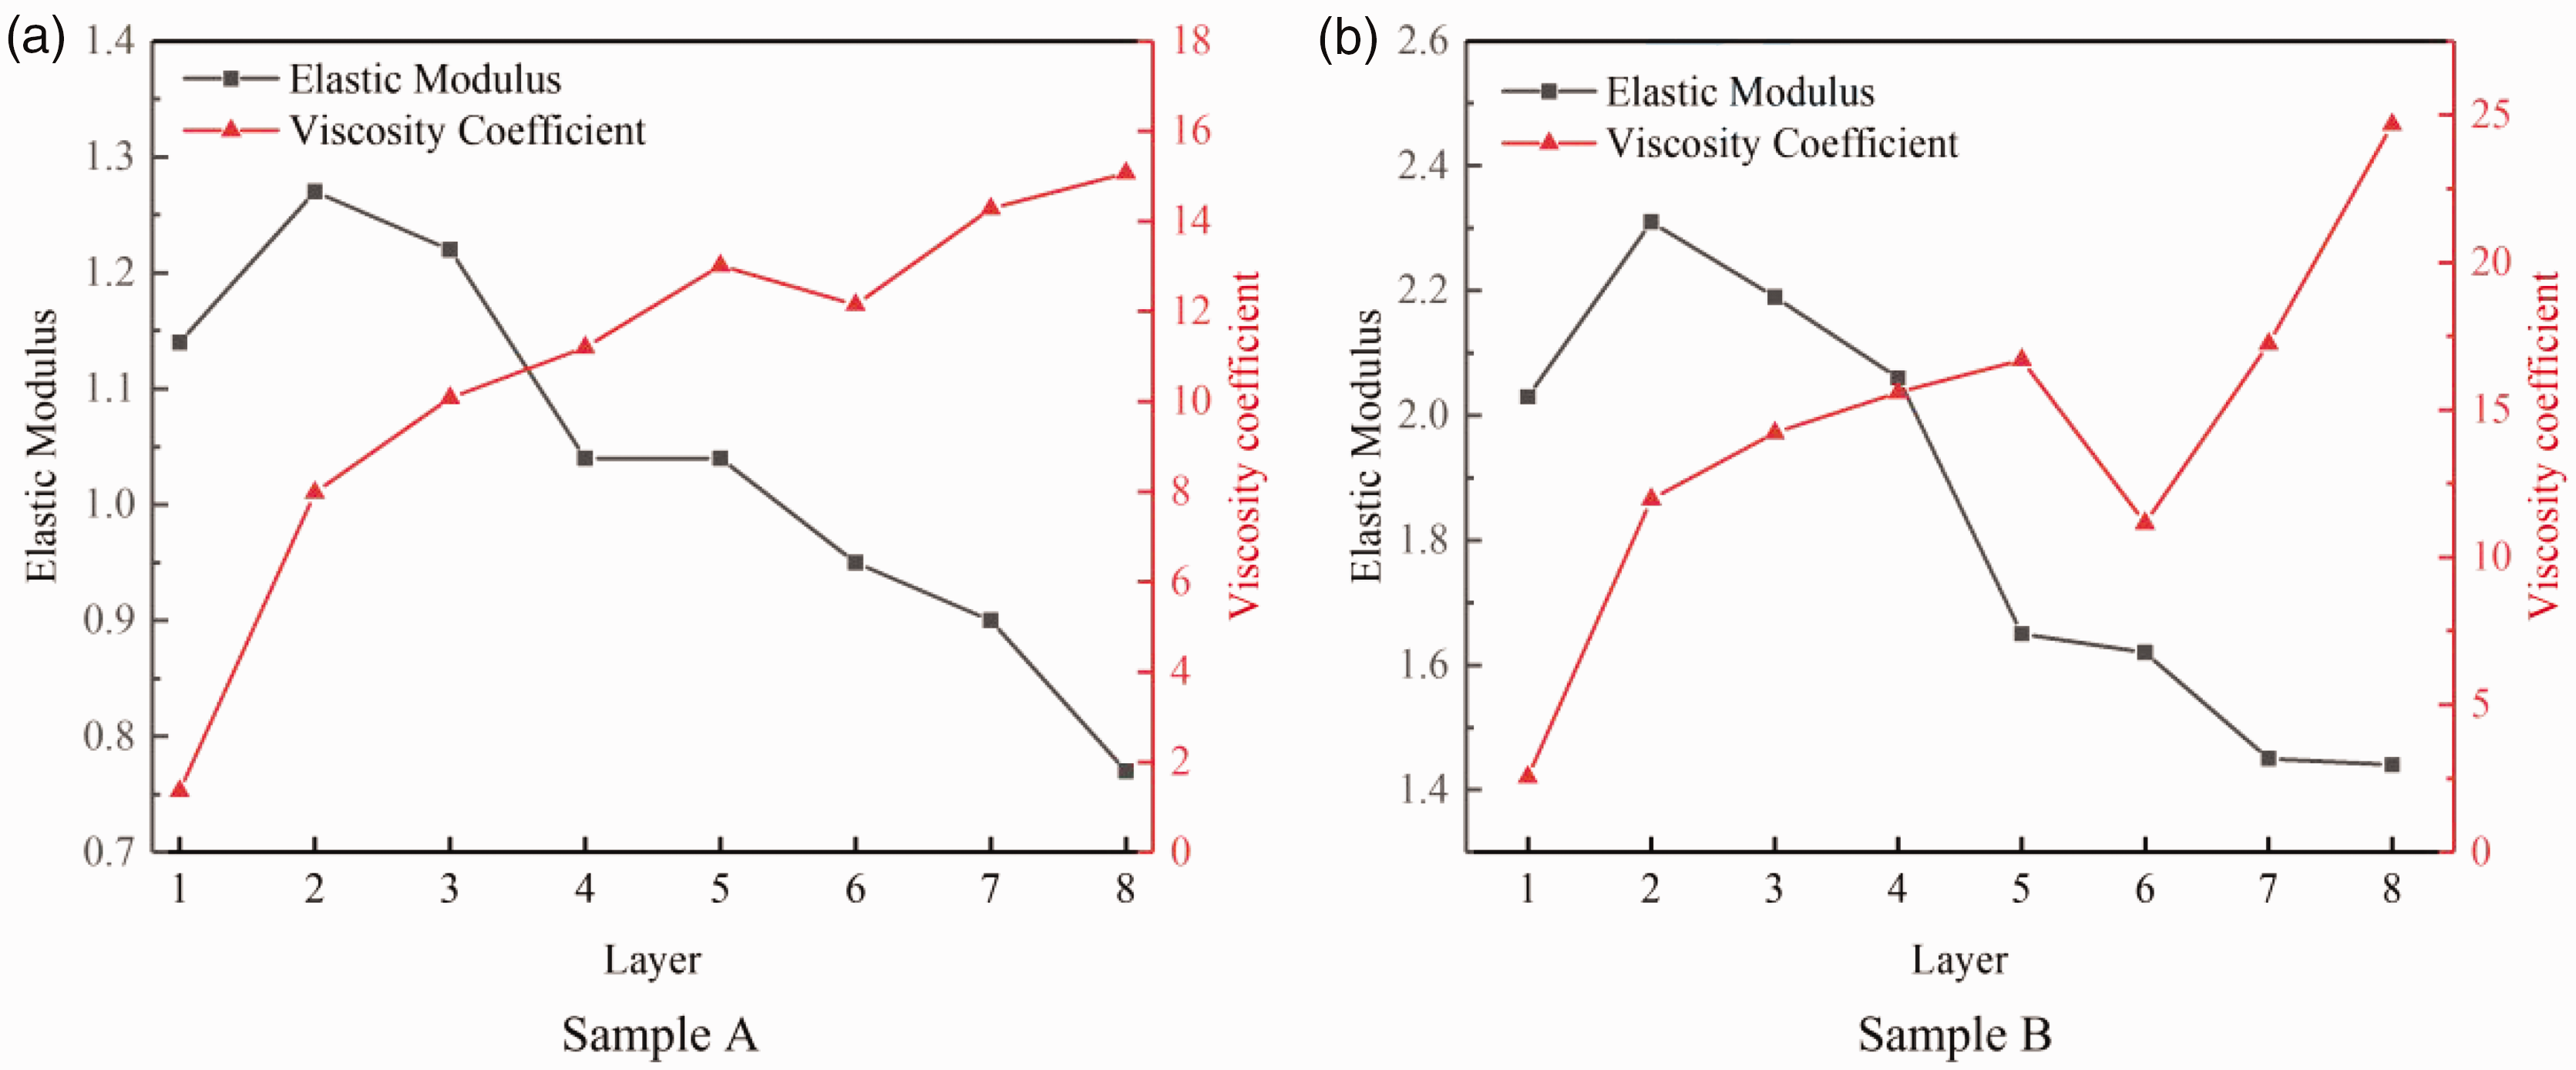
Elastic modulus (E) and viscosity coefficient (η) variation curves against number of layers.
Conclusions
This paper examines the factors that influence the compression performance of multi-layered spacer fabrics, deeply analyzes the influencing mechanisms and draws the following conclusions. (1) When the one-layered spacer fabric is compressed, the curve shapes in stages I, II and IV are essentially the same, but that of stage III is significantly different. The compression force value will have a peak value when the spacer filaments are in instability state 1, but the compression force value will increase all the time when it is in instability state 2. (2) As the one-layered spacer fabric is compressed, whether the sample and the indenter are fixed or not has little effect on the results, and the instability state of the spacer filament is not affected by this factor. (3) When the two-layered spacer fabric is compressed, the compression curve is divided into four stages, and the instability of the spacer filament in stage III is primarily caused by the movement of the contact surface between the upper and lower spacer fabrics. Whether the layers are fixed or not has little effect on the compression results. (4) Three different overlay methods of the same spacer fabrics had little effect on the compression results. (5) Compression test speeds do not seem to have a significant impact on the compression results of multi-layered spacer fabrics. (6) The overlaid orders of different types of spacer fabrics will affect their compression performance, especially for their modulus. It is ideal to overlay the fabric with a large modulus on top, followed by the fabric with a small modulus.
The article also examines the relationship between the number of layers of spacer fabric and the compression work and modulus of the fabric, and the conclusions are as follows. (1) There is a linear relationship between the number of layers and the compression work, and the fitting coefficient reaches 0.99. (2) There is a cubic function relationship between the modulus and number of layers for samples A and B with high correlation coefficients of 0.88 and 0.94, respectively. (3) The Kelvin model, which is widely applicable to one-layered spacer fabrics, can also be used to characterize the stage II compression properties of multi-layered spacer fabrics. The above quantitative analysis provides theoretical support for the design of cushion materials with different moduli in different regions.
Footnotes
Declaration of conflicting interests
The authors declared no potential conflicts of interest with respect to the research, authorship, and/or publication of this article.
Funding
The authors disclosed receipt of the following financial support for the research, authorship, and/or publication of this article: This work is jointly supported by Major scientific and technologic project of Fuzhou Science and Technology Project Plan (2022-ZD-007), by Jiangxi Provincial Administration for Market Regulation(GSJK202221), by Natural Science Foundation Project of Shanghai “science and technology innovation action plan” (22ZR1400500, 20ZR1400200), and supported by Project (Grant52173218) supported by National Natural Science Foundation of China, supported by the Key Research and Development Program of Science and Technology Bureau of Ningbo City (Grant No. 2023Z082), by Fujian Provincial Key Laboratory of Textiles Inspection Technology (Fujian Fiber Inspection Center) of China (2021-MXJ-01).