
Abstract
Egyptian cotton is one of the most important commodities for the Egyptian economy and is renowned globally for its quality, which is largely assessed and graded by manual inspection. This grading has several drawbacks, including significant labor requirements, low inspection efficiency, and influence from inspection conditions such as light and human subjectivity. This work proposes a low-cost solution to replace manual inspection with classification models to grade Egyptian cotton lint using images captured by a charge-coupled device camera. While this method has been evaluated for classifying US and Chinese upland cotton staples, it has not been tested on Egyptian cotton, which has unique characteristics and grading requirements. Furthermore, the methodology to develop these classification models has been expanded to include image processing techniques that remove the influence of trash on color measurements and extract features that capture the intra-sample variance of the cotton samples. Three different supervised machine learning algorithms were evaluated: artificial neural networks; random forest; and support vector machines. The highest accuracy models (82.13–90.21%) used a random forest algorithm. The models’ accuracy was limited by the human error associated with labeling the cotton samples used to develop the classification models. Unsupervised machine learning methods, including k-means clustering, hierarchical clustering, and Gaussian mixture models, were used to indicate where labeling errors occurred.
Cotton is an internationally important textile crop, accounting for 90% of all-natural fibers used in the textile industry. 1 The textile industry plays a significant role in the Egyptian economy and wider society, contributing around 14% of gross domestic product (GDP) 2 and employing 25.8% of the industrial workforce. 3 However, since the mid-1980s, the production of Egyptian cotton has been declining, 3 and between 1980 and 2019 exports have decreased from 164,000 to 71,000 tonnes. 4 The industry is subject to various challenges (e.g., fraud and low productivity 3 ), causing domestic 5 and international 6 strategies to be introduced to strengthen and modernize the Egyptian cotton industry.
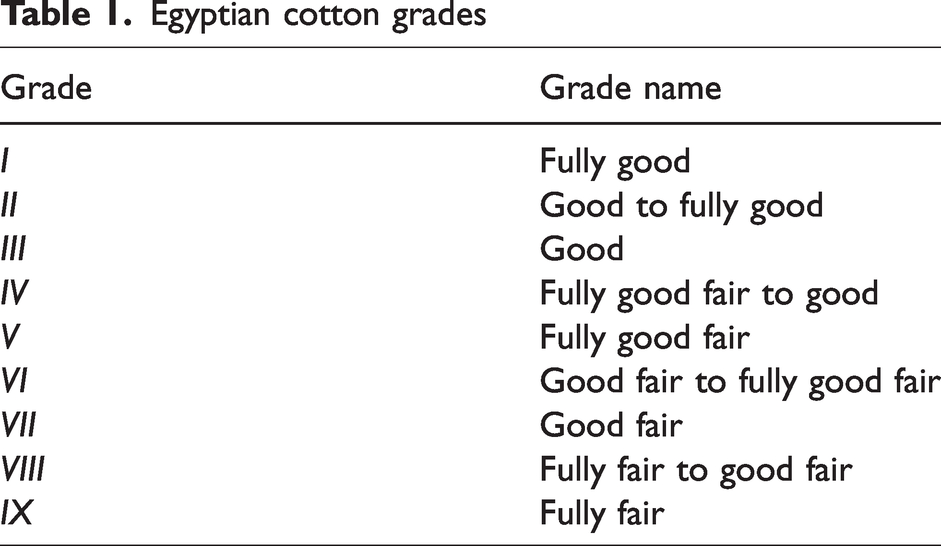
An important stage during the cotton production process is the grading of harvested cotton lint to evaluate its economic value, which is determined by its processability (e.g., cleaning requirements) and quality. 7 Incorrectly grading the cotton lint results in over-processing, which can lead to cotton fiber breakage, reducing the value of the cotton. 8 The most recognized and widely used grade standards are the Universal Upland Grade Standards, which have 25 grades determined by cotton lint color and leaf grade. 9 These standards are used to grade upland cotton staples that account for 90% of global cotton production 10 ; however, they are not suitable for long and extra-long cotton staples like Egyptian cotton, Gossypium Barba-dense L., as they do not consider fiber length in the system of classification or the variety of color present in Egyptian cotton lint. 11 The Cotton Arbitration and Testing General Organization (CATGO) in Egypt identifies 10 different cultivars of cotton that come under two categories: extra-long staple cotton and long staple cotton. Long staple cotton is divided into the lower-long staple varieties that grow in the Nile Delta region and the upper-long staple varieties that grow in Upper Egypt. Within Egypt, CATGO is responsible for maintaining Egyptian cotton quality using the local grading system consisting of nine cotton quality grades, outlined in Table 1. Egyptian cotton grades are still mainly determined by manual inspection performed by human expert classifiers. Samples are extracted from cotton lint bales and inspected for fiber color and length, the presence of “trash” (e.g., dried cotton leaves, seed coats, barks, grass, and dust), and maturity (i.e., age of the plant harvested from). 12 In addition, grading is also undertaken on a smaller selection of samples via a High Volume Instrument (HVI). Manual inspection has several drawbacks, including the following: significant labor requirements; low inspection efficiency; eye fatigue; and influence from inspection conditions, such as light.13,14 While the HVI overcomes the manual inspection drawbacks, it is a destructive sampling method, occupies a large floor area, is prone to temporal and spatial variations, and has a poor agreement between human classifiers and HVI grading for cotton lint not originated in the USA.15,16 Furthermore, the high cost of HVI equipment has limited its use within the Egyptian cotton industry, which is beset by high production costs and decreasing export value. 3 Instead, a low-cost and simple-to-use solution is required to address the current disadvantages of manual inspection and HVI grading. A low-cost solution that is accessible to both cotton lint farmers and processors will also help address the fraud problem within the Egyptian cotton industry (i.e., deliberating incorrectly labeling the cotton lint grade) 17 and help to drive value back toward the farmers suffering from reducing export value 3 by enabling them to demand an honest price for their cotton lint.
Egyptian cotton grades
Previous studies have evaluated alternative cotton lint measuring systems to replace or supplement manual inspection and HVI measurement systems, which include the following: the colorimeter;18,19 computer scanner;20,21 charge-coupled device (CCD) camera;12–14,22–26 single-lens reflex camera; 27 thermal camera; 28 infrared spectrometry;29,30 microscope; 31 X-ray scanner; 32 and optical spectrometry.16,20 A CCD is a digital camera widely used in digital photography and astronomy. 33 To date, the CCD has received a large amount of attention as a cotton lint image acquisition technique due to its low-cost and precise color measurement. 23 Image processing can extract characteristics from CCD images that describe the cotton lint color 23 and detect and characterize the trash present within cotton lint samples. As well as costing less than other measuring systems, the CCD captures color information of each pixel meaning color variation and distribution can be easily obtained, 33 a feature that current HVI systems are unable to measure. 23 An earlier analysis of US upland cotton samples evidenced the occurrence of intra-sample color variation, which impacted color grade assessment. 21 Yet to be explored is the extent of intra-sample color variation within Egyptian cotton lint samples and how intra-sample variation correlates to Egyptian cotton grades. When measuring the cotton lint color from CCD images, the majority of previous work has failed to account for the influence that trash has on the measurement of color values. 23 Recent work has proposed a two-step trash detection algorithm to improve the cotton lint color assessment accuracy by removing the influence of trash on the cotton lint color measurements. 23 To what extent the more accurate color values improve the accuracy of models classifying cotton grades is yet to be determined.
Cotton color and trash characteristics have been used as model inputs, referred to as “features,” for supervised machine learning models to successfully classify US upland cotton18,26 and Chinese upland cotton 13 grades, using the Universal Upland Grade Standards grading system. There is no evidence of similar work using Egyptian cotton samples and the Egyptian cotton grading system. Supervised machine learning models are built from self-learning algorithms that learn from labeled training data and are capable of fitting complex functions between input and output data. 34 Artificial neural networks (ANNs) 18 and support vector machines (SVMs)13,26 are two machine learning algorithms that have proven successful at classifying cotton sample grades using CCD images. The structure of an ANN algorithm represents the connections of biological neurons. 18 An ANN is comprised of multiple node (neurons) layers, containing an input layer, one or more hidden layers, and an output layer. 18 Each node connects to another and has an associated weight and bias, which stores the learning from the training data. More recently deep learning, which is an ANN with multiple hidden layers that automate feature extraction, has been used to measure cotton maturity, 31 extract Chinese cotton characteristics, 13 and identify foreign fibers in cotton lint. 14 While deep learning can produce highly accurate models, they require a larger volume of training data than traditional ANN models to learn from, which can limit deep learning use. 35 SVMs construct a hyperplane, or set of hyperplanes, in a high- or infinite-dimensional space, which can be used for classification. They are highly effective machine learning algorithms, even when presented with small quantities of data. 35 Both the ANN and SVM have proved successful in grading upland cotton samples as they are capable of fitting a non-linear barrier between the cotton grades. 18 The random forest (RF) is another non-linear machine learning algorithm that uses multiple decision trees and a statistical technique called “bagging.” 36 Rather than just averaging predictions from multiple trees, a RF instead randomly samples from the training data for each tree and randomly subsets the input variables at splitting nodes until the minimum node size is reached. 36 RF algorithms are simpler to train than ANNs or SVMs, as they are less complex and less prone to overfitting (i.e., matching too closely to noise in the training data, reducing the model's ability to accurately predict new data). 37 RFs also excel at multi-class classification problems, 37 making them ideal candidates for classifying cotton grades. Despite this, a comparison between the RF, ANN, and SVM to predict cotton lint grade is missing in the literature.
A supervised machine learning model requires data with labeled outputs (e.g., cotton grade). The grading of Egyptian cotton is a very intricate and complex subject, as it depends upon human perceptions of sight and touch and requires a high degree of critical judgment on the part of the officials responsible. 11 The complexity of this task leads to inevitable human error in the labeling of cotton lint grades. Unsupervised learning can be used when there are concerns regarding the labeling of the data by clustering. 34 Previous use of unsupervised learning within cotton evaluation includes reducing dimensions and separating spectral data into cotton lint grades 29 and evaluating the similarity or dissimilarity of different parts of cotton plants. 30 When the number of classes within the data is known, k-means clustering, hierarchical clustering, and the Gaussian mixture model are three popular unsupervised learning algorithms to cluster the data into a predefined number of clusters. 38 k-means clustering is a method that aims to partition observations into k clusters, in which each observation belongs to the cluster with the nearest mean (cluster centroid). 38 Linkage clustering is one of several methods of hierarchical clustering and is based on grouping clusters in agglomerative clustering, at each step combining two clusters that contain the closest pair of elements not yet belonging to the same cluster as each other. 38 A Gaussian mixture model is a probabilistic model that assumes all the data points are generated from a mixture of a finite number of Gaussian distributions with unknown parameters. 38 The trained Gaussian mixture model then assigns query data to the cluster yielding the highest posterior probability. 38
This study aims to develop classification models to grade Egyptian cotton lint using images acquired by a low-cost CCD camera. While this method has proved successful in classifying US and Chinese Upland cotton,13,18,26 it has not been evaluated for Egyptian cotton, which has unique characteristics (e.g., fiber length and color) and uses a different grading system. Furthermore, this method has been expanded to include two new image processing techniques that remove the influence of trash on color measurements and extract features that capture the intra-sample variance of the cotton samples. If successful, this solution would directly benefit the local Egyptian cotton industry, which still largely uses manual inspection due to the high cost of other measuring equipment. In addition, because of known errors associated with the manual classification of Egyptian cotton, 11 the use of unsupervised learning to identify likely sources of errors is explored.
The paper is structured as follows. Following the introduction, the second section presents the study methodology, explaining the color vision system utilized as well as the image processing and modeling techniques used. In the Analysis of cotton lint image processing results section, the results of the image processing methods are analyzed to identify trends within the image data and correlations between the features and cotton grade. Then the Classification model results section presents the supervised machine learning models results, which are evaluated in terms of accuracy, recall, and precision to determine which machine learning algorithm is best suited to grade Egyptian cotton lint. In the Evaluation of human error via unsupervised learning section, the result of the unsupervised machine learning technique applied to determine likely sources of human error in labeling the cotton lint samples is presented. Finally, this work concludes in the Future work section by outlining the future work required to progress this method up to technology readiness levels and into a commercial solution for grading Egyptian cotton lint.
Materials and methods
Cotton lint samples
To develop the machine learning models, a dataset of Egyptian cotton lint sample images was collected. Samples from five cultivars, Giza 86, 87, 90, 94, and 96, were collected, which includes cultivars from both long and extra-long Egyptian cotton staple categories. The number refers to the year the cotton strains were artificially hybridized to produce new cotton varieties. Giza 86, 90, and 94 are long stable cultivars and Giza 87 and 96 are extra-long staple cotton cultivars. Giza 86 and 94 are grown in the Nile Delta region and Giza 90 is grown in the Upper Egypt region. The samples were provided by CATGO, Alexandria, Egypt. CATGO is responsible for providing the official certificates for authenticating cotton lint in terms of determining the quality attributes and grade for Egyptian cotton cultivars for cotton ginning companies. Human experts from CATGO labeled the samples used in this study, using the Egyptian cotton grading system outlined in Table 1. To aid communication, the grades have been assigned a value from I for the highest quality grade to IX for the lowest quality grade. Images of all the samples were captured using the color vision system described in the Color vision system section. Example images of the grades for cultivar Giza 86 are presented in Figure 1 and example images from the other cultivars are presented in the Supplementary Information (Figures S1–4).
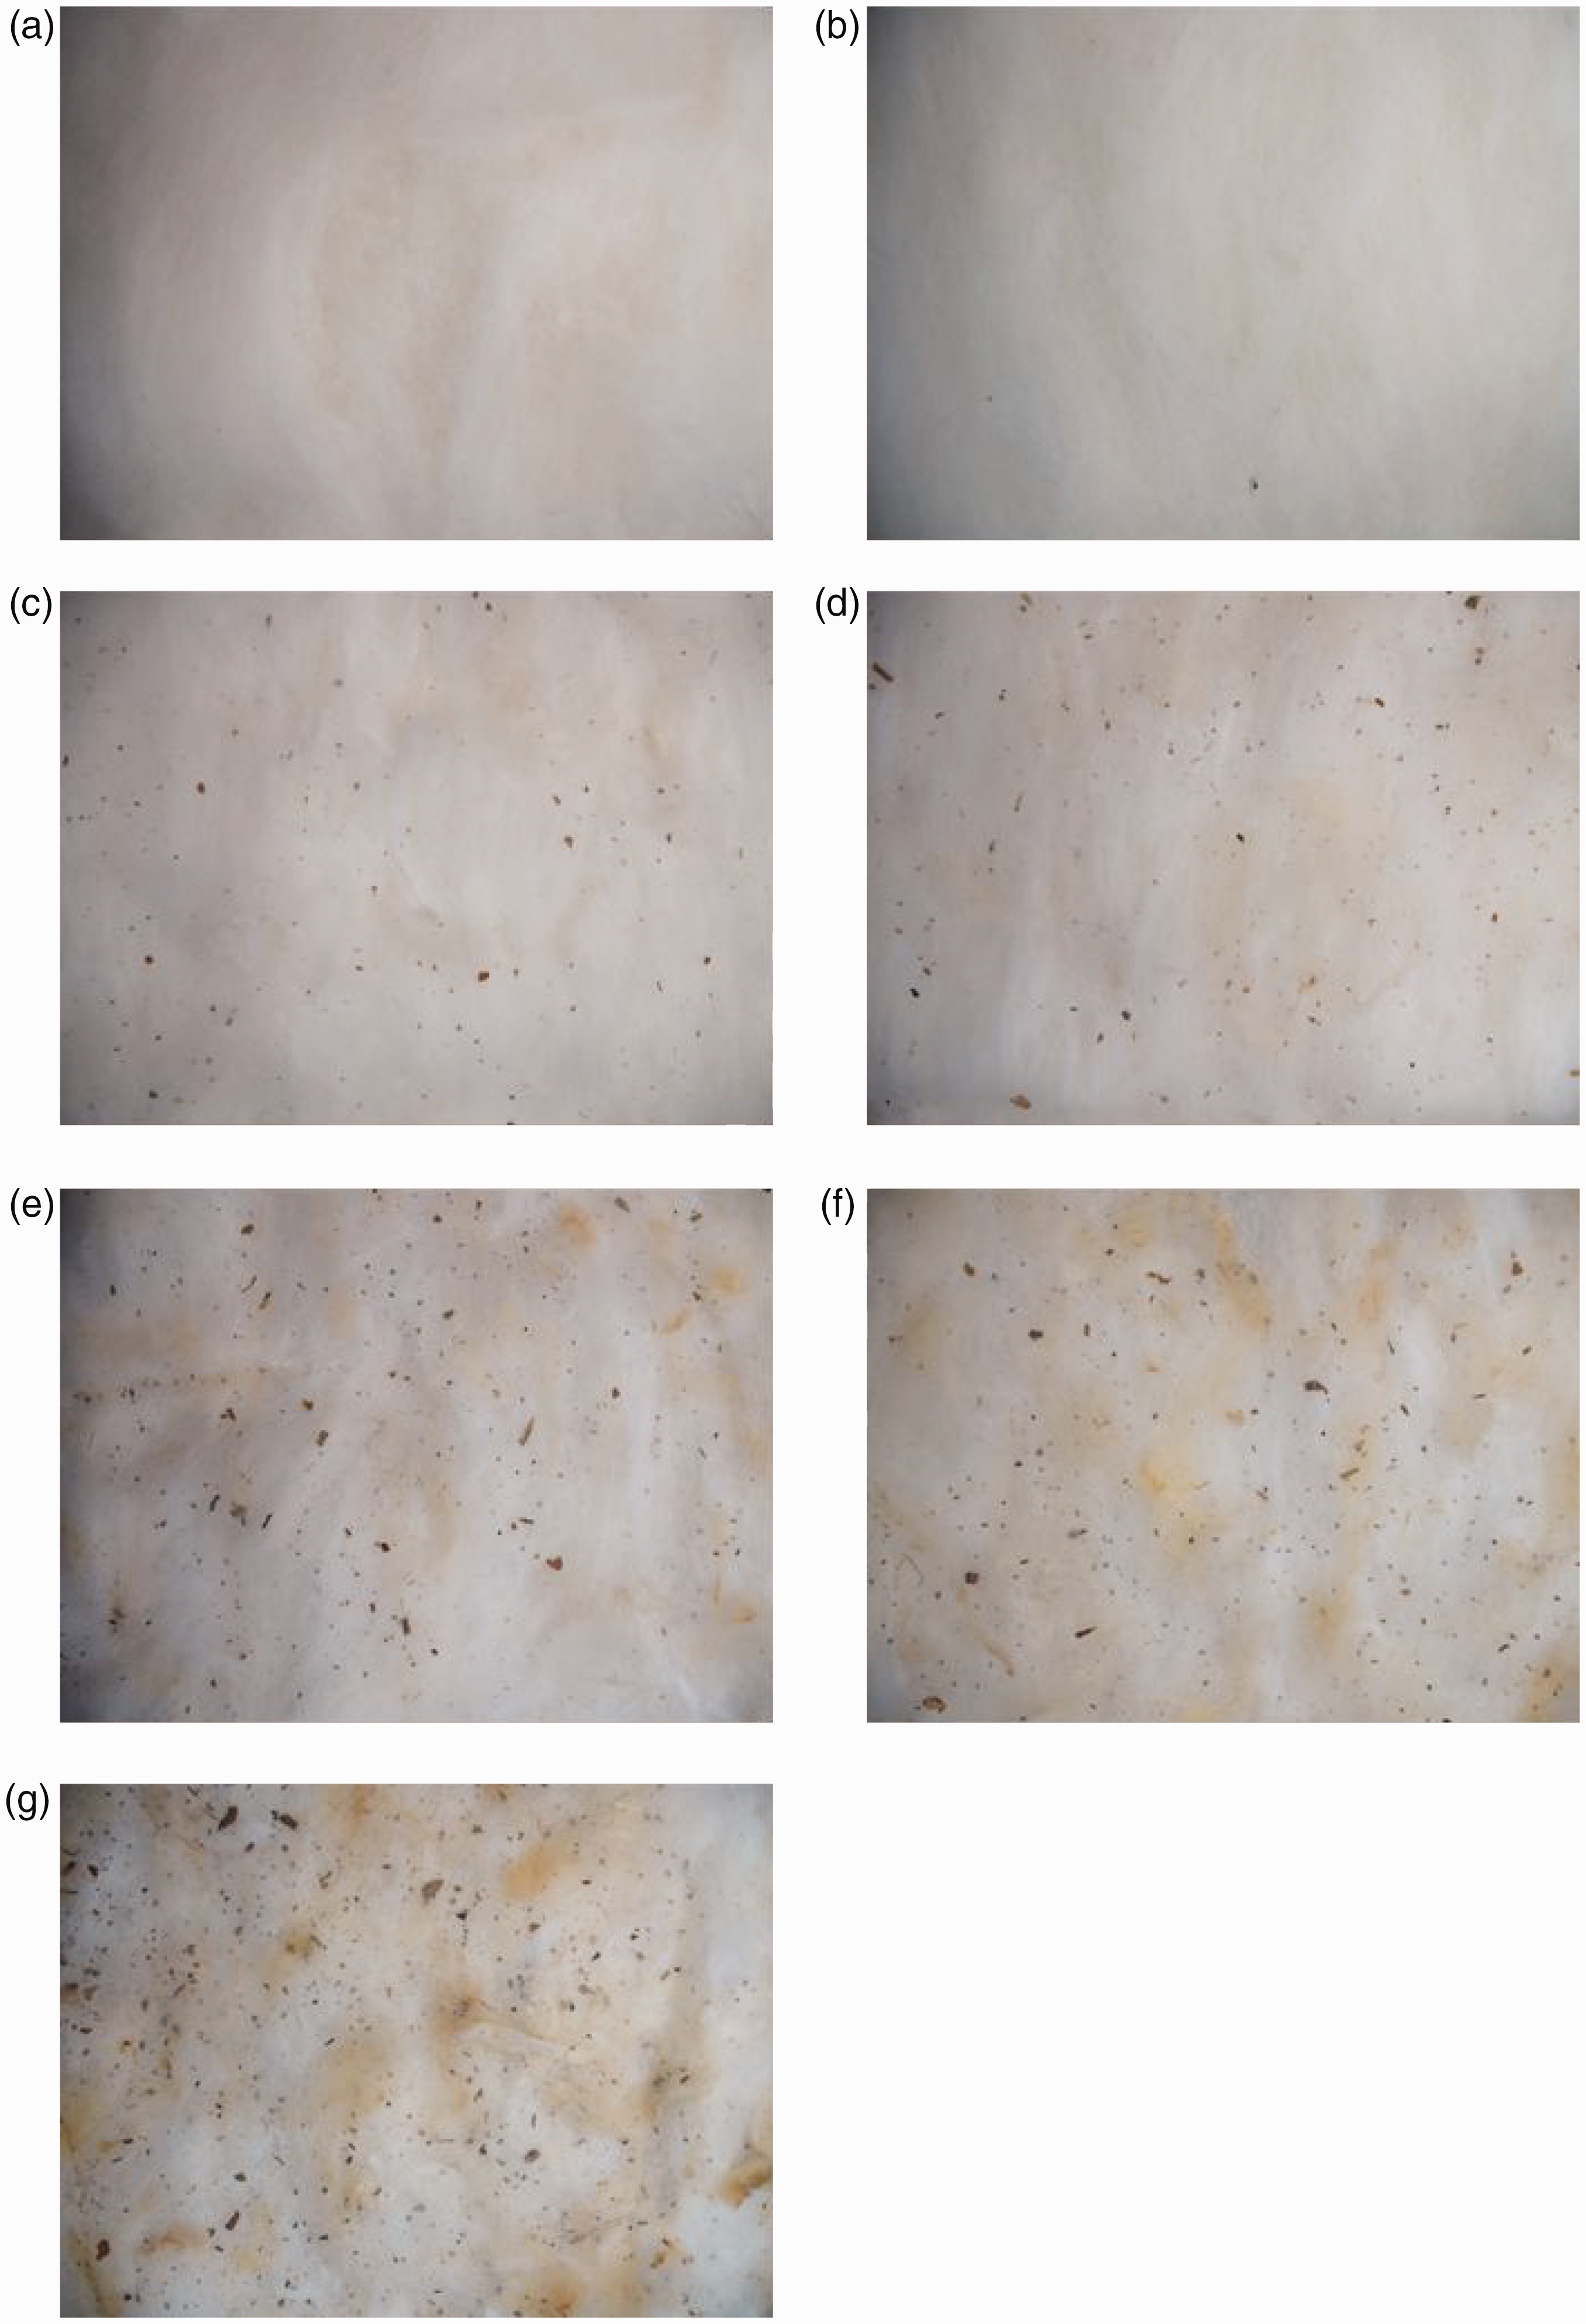
Sample images of each Giza 86 cultivar grade: (a) I; (b) II; (c) III; (d) IV; (e) V; (f) VI and (g) VII. Grades VIII and IX were not present in the data so no images were available.
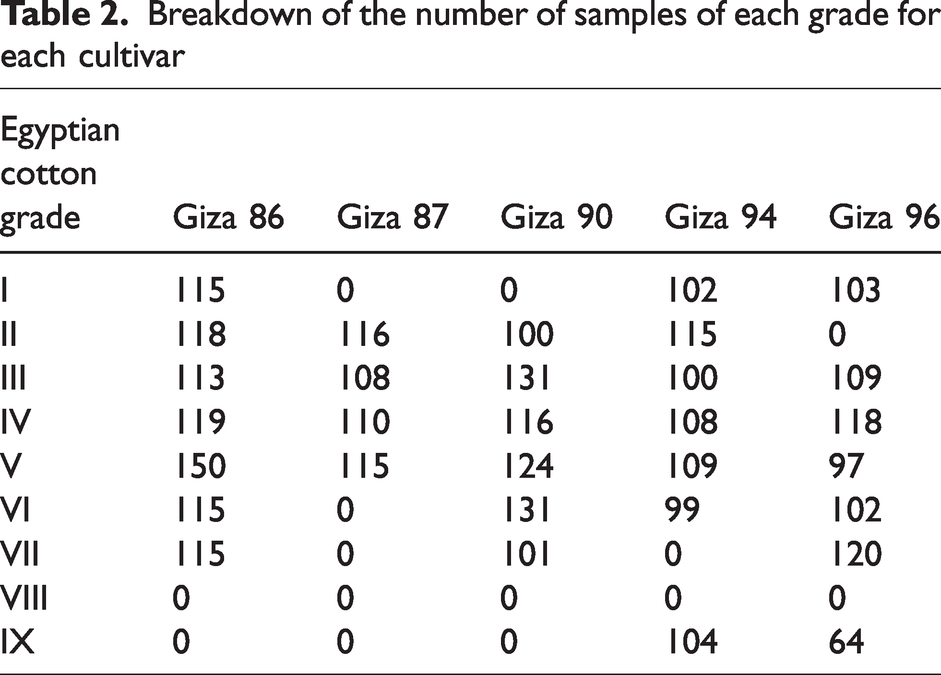
A total of 3447 samples were provided, but unfortunately not all grades were represented in the samples provided. The breakdown of the number of samples of each grade for each cultivar is reported in Table 2.
Breakdown of the number of samples of each grade for each cultivar
Color vision system
The schematic configuration of the color vision system used to acquire cotton lint images in this study is shown in Figure 2. The design is based on existing cotton color vision systems.12–14,22–26 Images were captured using a CCD sensor 8.1 MP Fuji A850 digital camera (FUJIFILM Corporation, Minato-ku, Tokyo, Japan), which stored the images in JPEG format with dimensions of 2248 pixel × 3264 pixel. The CCD sensor was mounted 11 cm vertically above the surface of the samples and the inbuilt autofocus capability of the CCD sensor ensured all images were in focus. A square 25.0 mm × 25.0 mm × 3.85 mm 10 W light-emitting diode (LED) light source (Intelligent Group Solutions Ltd, Thatcham, UK) was mounted 11 cm vertically above the surface of the samples and used to ensure consistent illumination. The average light intensity on the sample surface was 4879 lux, calibrated by a Samsung Galaxy M31 (Samsung Group, Suwon-si, South Korea) 10 times, with the average value reported. To ensure a consistent illumination condition, the camera along with the light source was enclosed in an aluminum box whose dimensions were 54 cm × 40 cm × 40 cm. The inside of the box was colored black to minimize the surface reflection from the sides. Samples of 4 cm thickness were placed directly below the camera on the black surface. Each image was captured with no flash, and the output images were transferred to a PC for analysis using Windows 10 operating software (21H2 10.0.19044.1645, Windows 10, Microsoft Corporation, Redmond, Washington, USA).
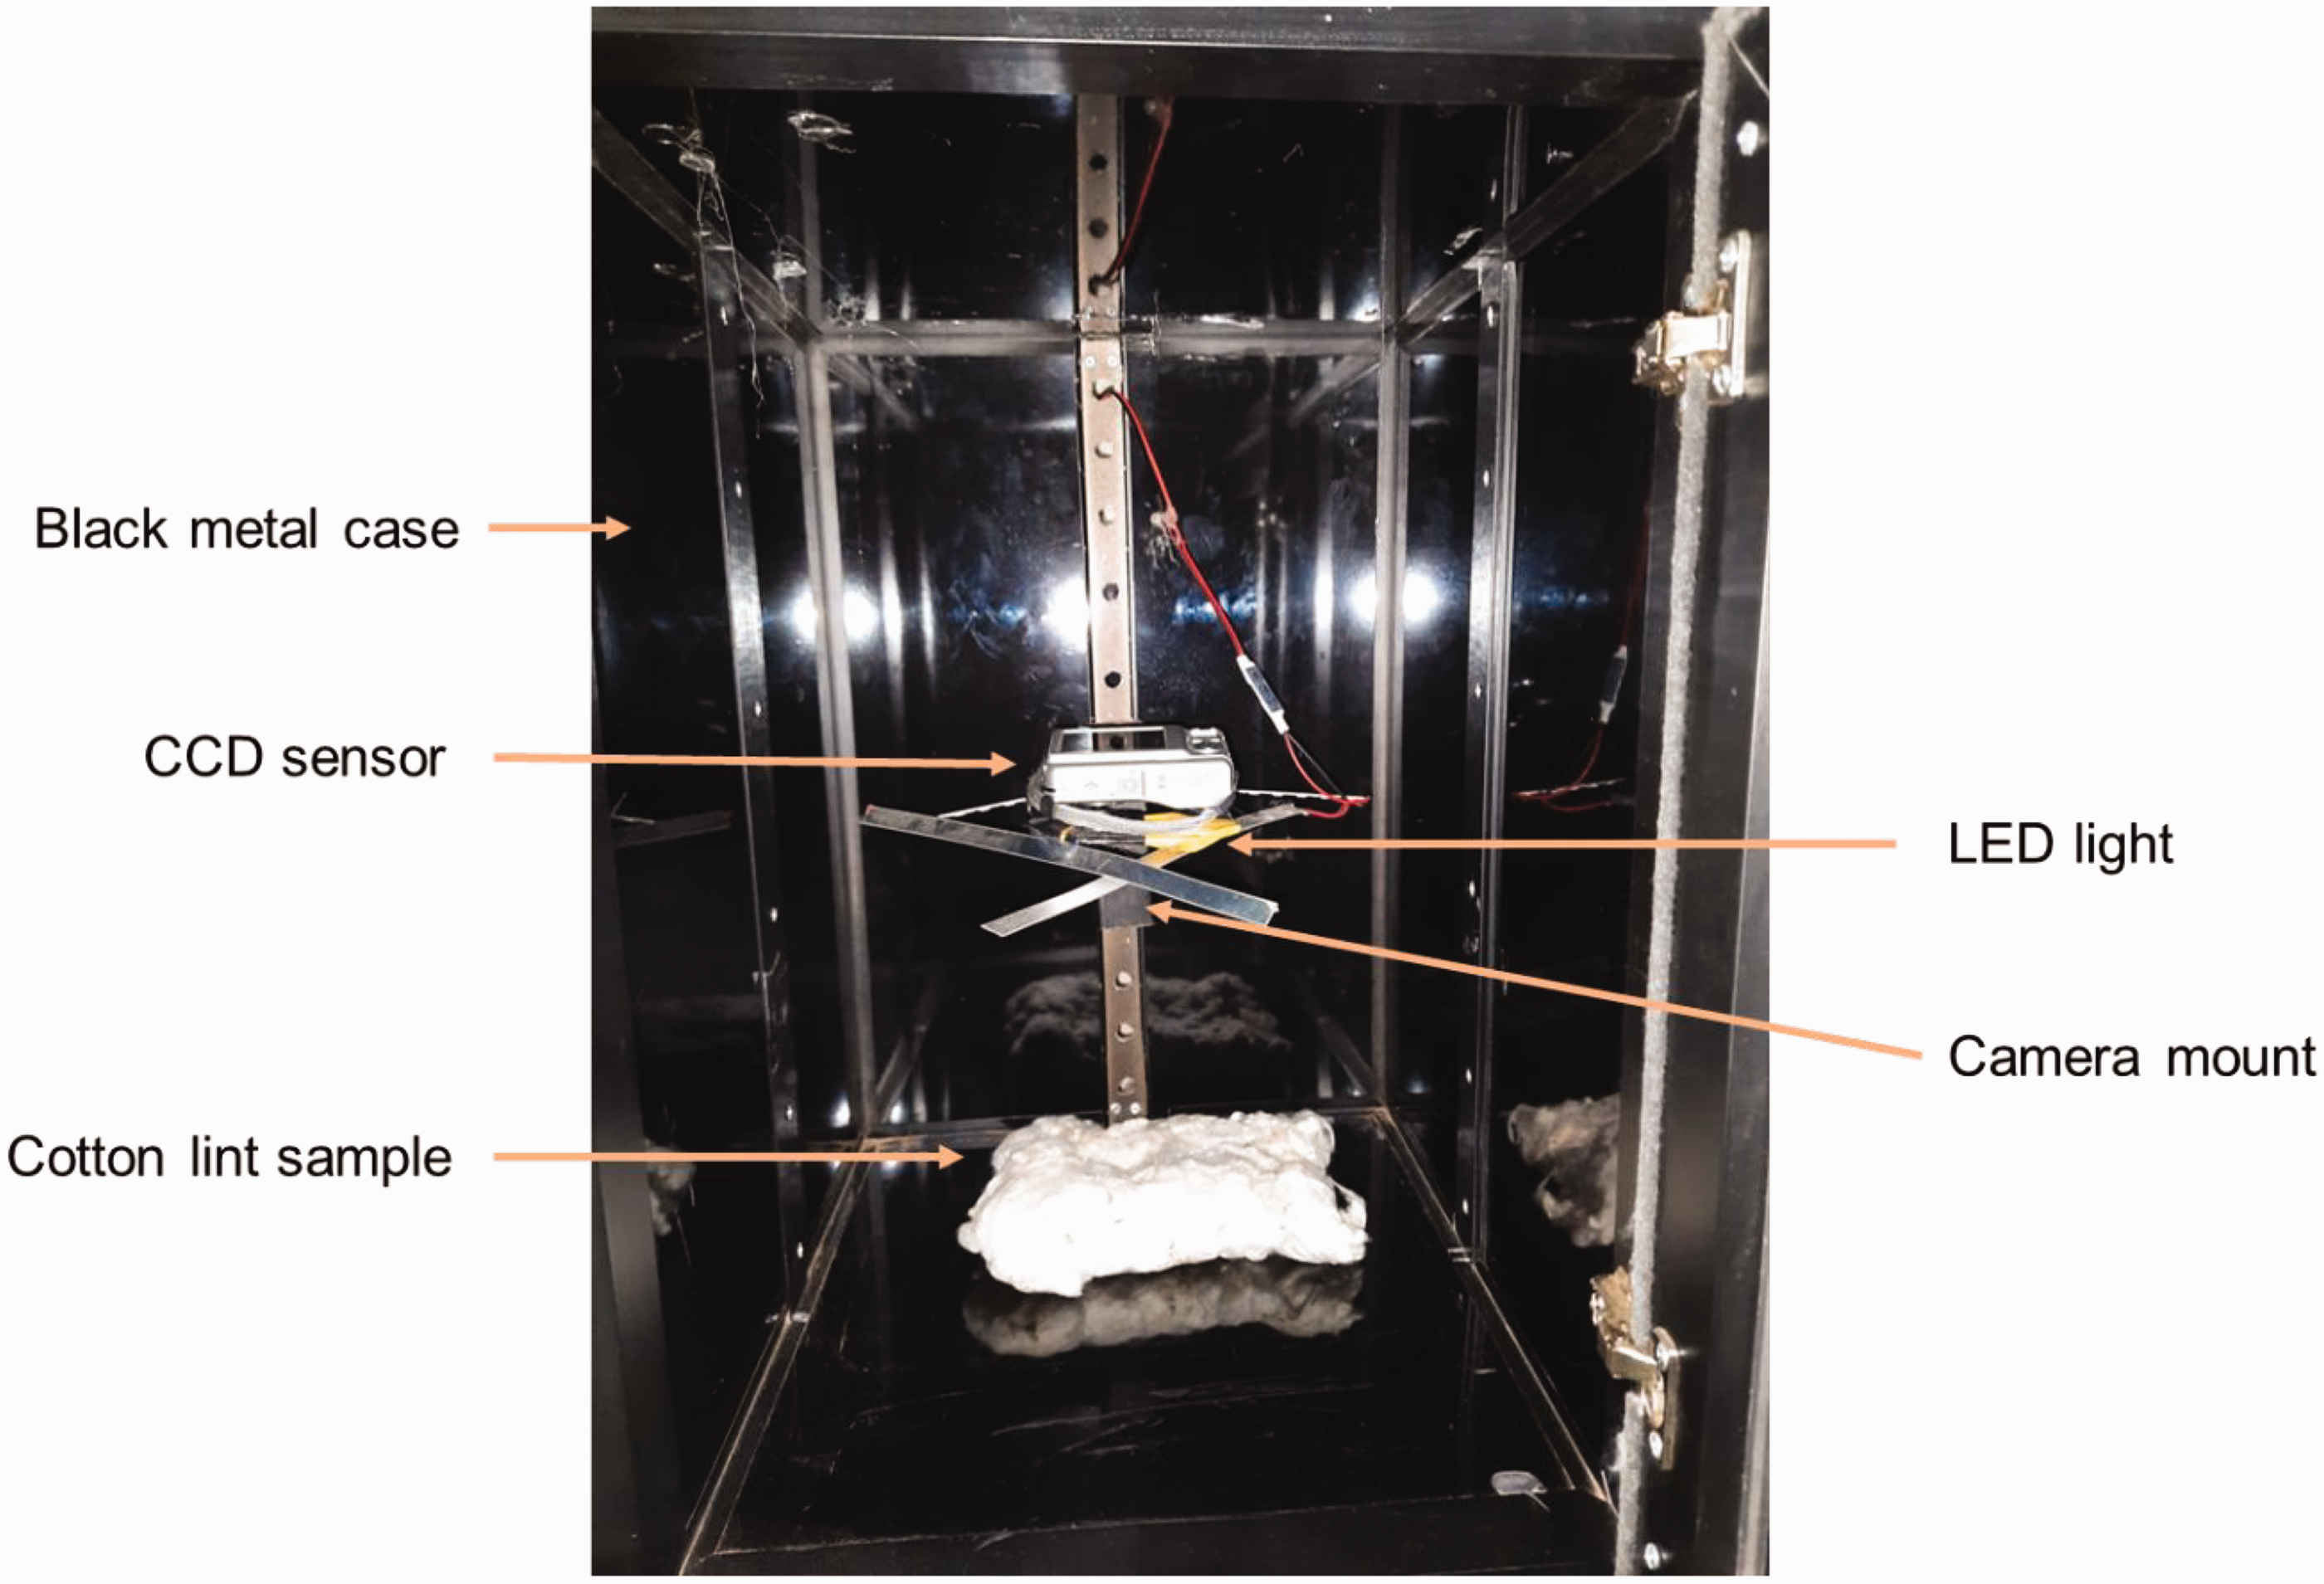
The color vision system used to acquire color images of the cotton lint samples (reflections in the picture are from the high-intensity flash of the camera used to take an image of the system). CCD: charge-coupled device; LED: light-emitting diode.
Image processing methods
Methods outlined in previous image processing of cotton lint21,23 were followed to extract features describing the color of the cotton lint and the percentage of trash present within the samples. Firstly, all the images were cropped from 2448 pixel × 3264 pixel to 2448 pixel × 2965 pixel to eliminate the areas of the sample without uniform light. The percentage of trash detected in the image was then determined following the method outlined by Heng et al.
23
The cropped images were then converted to a grayscale image and then to a binary image using the balanced histogram thresholding method in order to provide a better condition for trash detection.
23
The percentage of trash detected in the image was then calculated using Equation (1)

The color of the cotton was determined following the method outlined by Heng et al. 23 Since the 1940s, the three-dimensional (3D) Hunter color space parameters lightness (L*) and relative to the blue–yellow (b*) have been used to grade cotton color. 23 The third parameter, relative to the green–red (a*), is not used because it is a constant for the US upland cotton. However, previous studies have failed to consider the color difference between US and Egyptian cotton. Therefore, it is reasonable to investigate the potential of using the additional a* parameter to grade Egyptian cotton. The image color space was converted from the original red, green, blue (RGB) color space to International Commission on Illumination (CIE) XYZ color space and then 3D Hunter color space using the equations outlined by Heng et al. 23
Heng et al. 23 found that measuring the color of the whole cotton lint image produces an inaccurate color measurement of the cotton lint due to trash present within the cotton lint image influencing the color measurement. To evaluate whether this holds true for measuring Egyptian cotton lint color, the two-step method of Heng et al. 23 was applied to measure the color values of the “clean” Egyptian cotton lint image. The first step is to identify the pixels in the image that contain trash, using the grayscale and binary method outlined at the start of the Image processing methods section. The cropped image is then masked with the binary image to remove the pixels containing trash particles to create a “clean” cotton lint image. The 3D Hunter color space values may then be extracted from the clean image following the steps outlined in the above paragraph. Cui et al. 21 found that the intra-sample variation of the cotton lint provided valuable information when characterizing cotton samples and impacted the final cotton grade. To evaluate whether the intra-sample variation influences Egyptian cotton lint grading, the method of Cui et al. 21 was followed. This segmented the cotton lint images and extracted the color and trash detected values of each segmented image. The mean and standard deviation of these values were then calculated.
In this work, we evaluated both Heng et al. 23 and Cui et al. 21 cotton lint image processing methods for classifying Egyptian cotton lint grade from the CCD images. A total of four image processing methods were evaluated, outlined in Figure 3. Image processing method one extracts features from “unclean” cotton lint images and image processing method two extracts features from the “clean” cotton lint images following the Heng et al. 23 method. Image processing methods three and four follow the Cui et al. 21 method to extract intra-sample variation features of the “unclean” and “clean” images, respectively. All the image processing methods were conducted using the software MATLAB (R2021a version, Mathworks, Natick, Massachusetts, USA).
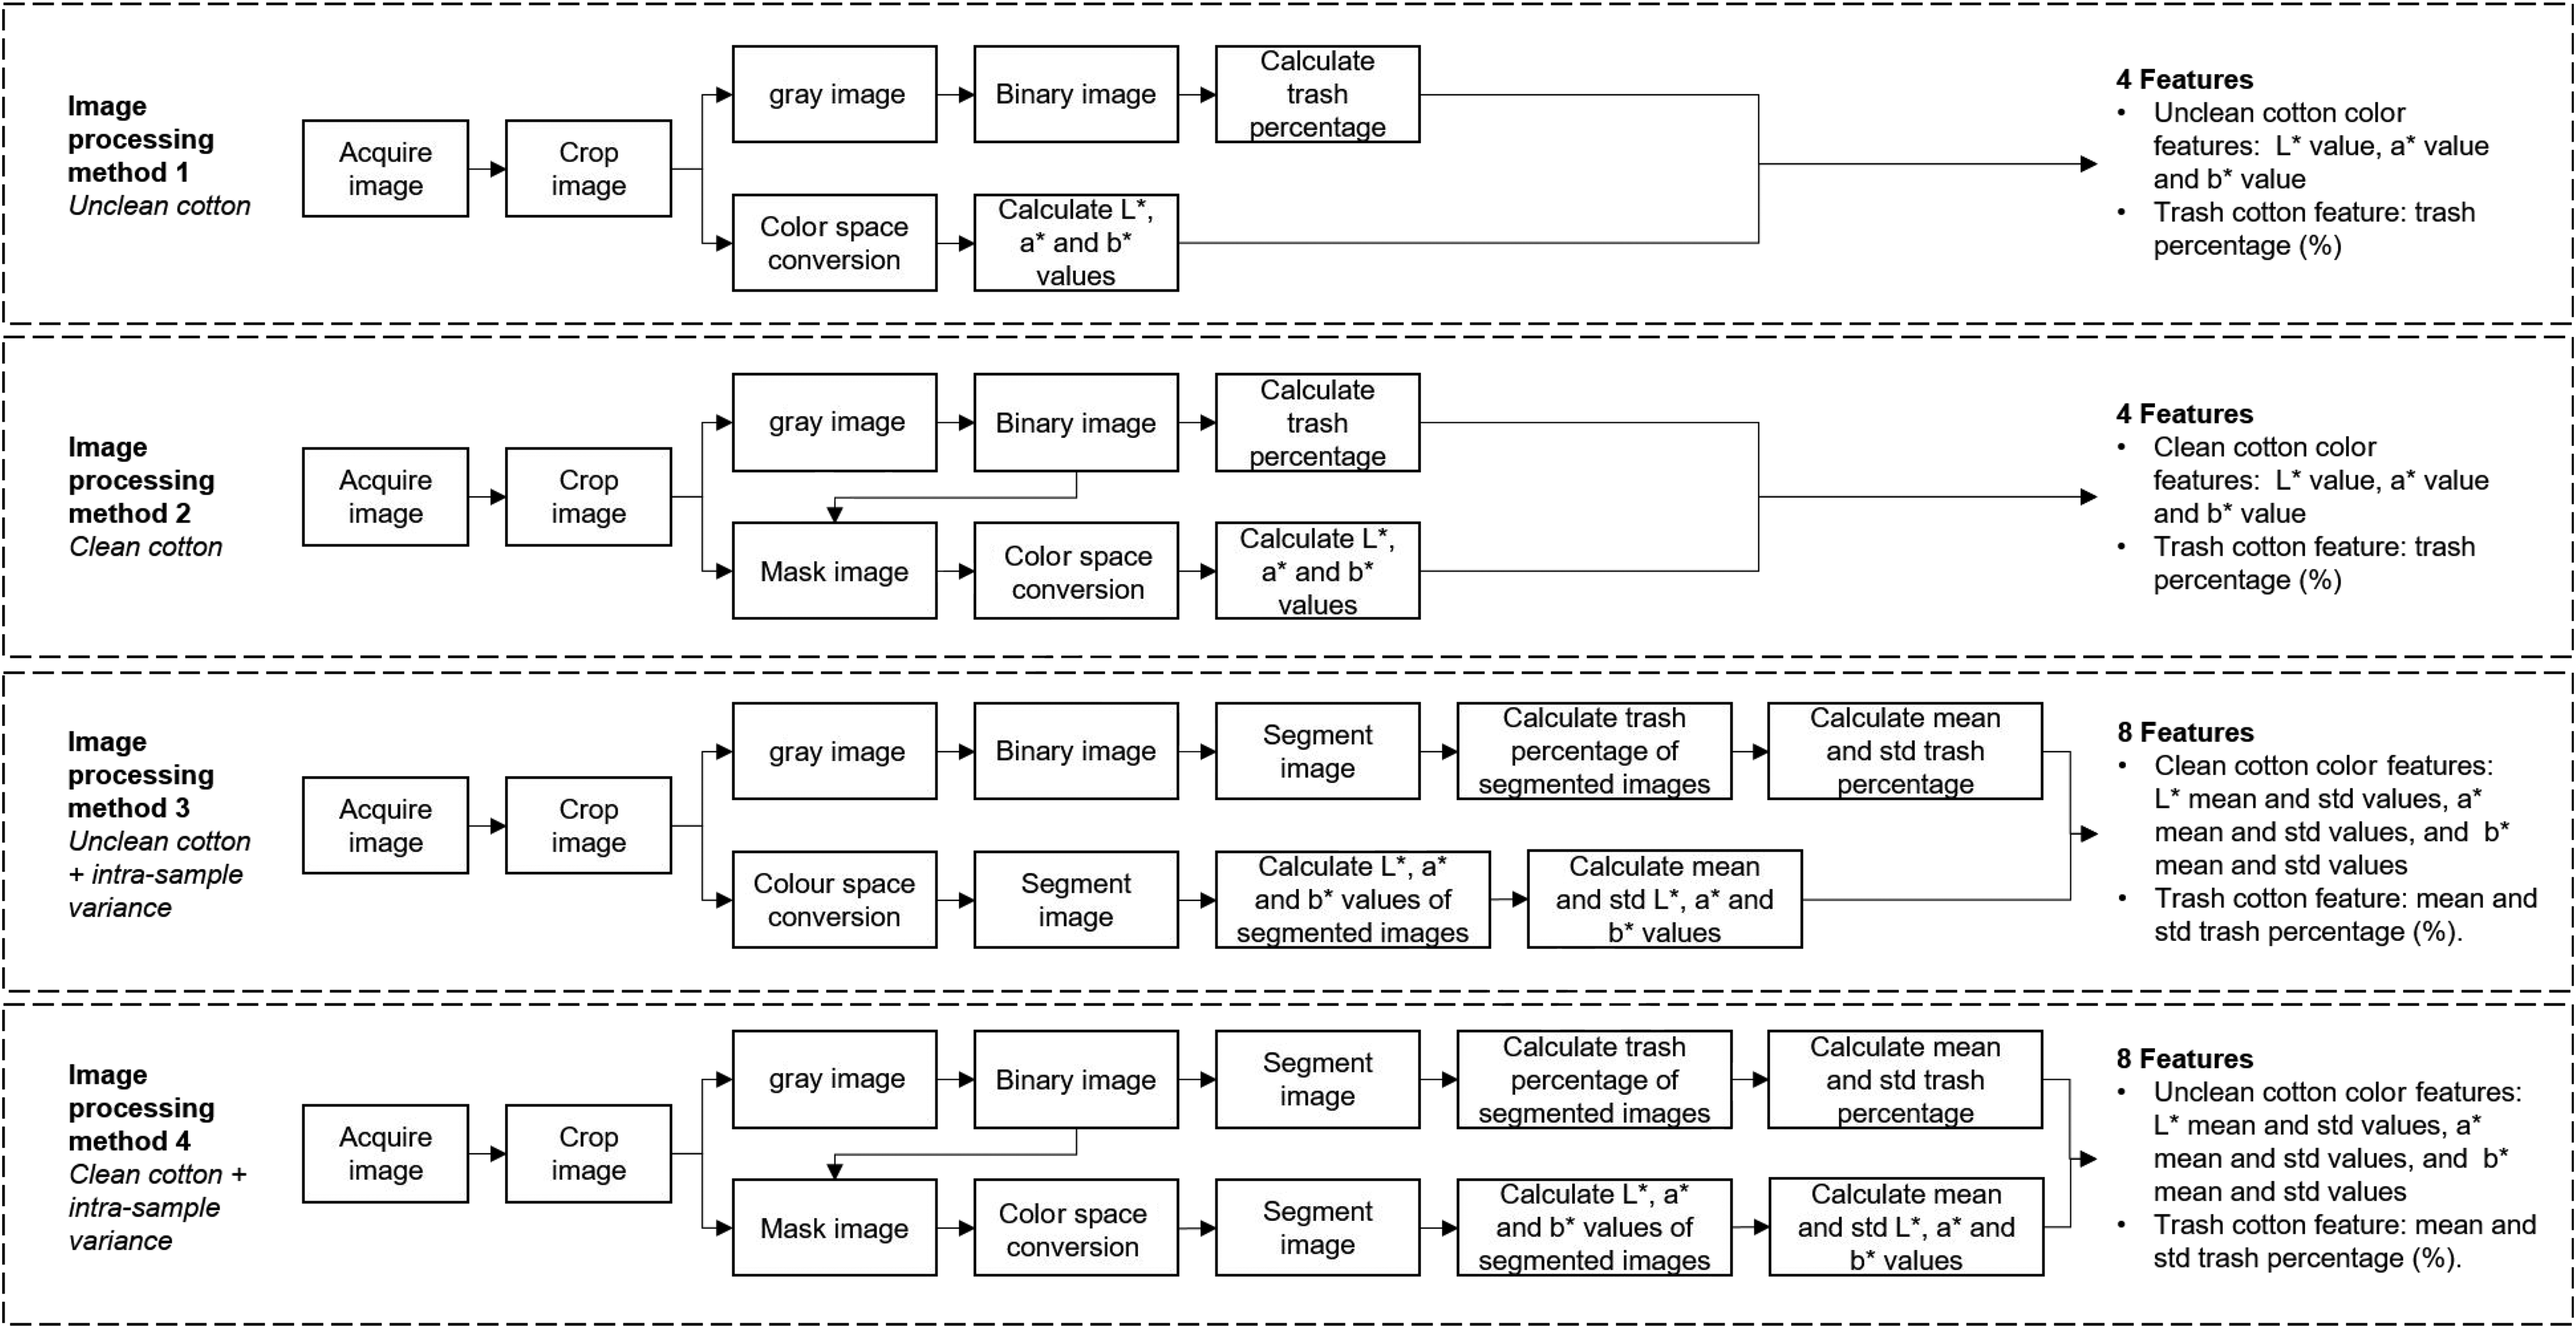
Flow chart of the four cotton lint image processing methods.
Supervised machine learning methods
The supervised machine learning models aim to use cotton lint image data (model input) to predict the Egyptian cotton grade (model output). A flow chart of the process for developing the supervised machine learning models for Egyptian cotton grade classification is presented in Figure 4. The first step was to partition the data into 70% training data and 30% testing data. Stratified random sampling was used to ensure that the training and testing data sets were balanced across the Egyptian cotton grades.
39
The testing data was withheld until the end to evaluate the final models. The training data was normalized to ensure all variables were given equal weight by the classification algorithms. To normalize without any loss of information, the minimax function was applied.
40
The normalization parameters were saved (the minimum and maximum values of each feature) and then used to normalize the testing data. Next, 10-fold stratified cross-validation was used to find the optimal hyperparameters of each machine learning algorithm. A hyperparameter is an adjustable algorithm parameter that must be either manually or automatically tuned in order to obtain a model with optimal performance.
41
Three machine learning algorithms were evaluated, ANNs, SVMs, and RFs. The ANN hyperparameters include the learning rates, number of nodes, number of hidden layers, batch size, and activation function. The SVM hyperparameters include the box constraint, epsilon, kernel function, and polynomial order. The RF hyperparameters include the number of trees, depth of trees, and minimum node size. A random search technique was used to optimize each algorithms’ hyperparameters, where random combinations of the hyperparameters were used to find the best solution for the final model. A random search was used as it has a higher chance of finding the optimal hyperparameters than other methods (e.g., grid search) and uses less computational processing power.
41
Tenfold stratified cross-validation was used to evaluate each combination of hyperparameters to find the optimal set. The model was then retrained using the best hyperparameters and evaluated using the test data. The predictive power of the model was evaluated according to the classification accuracy rate determined using Equation (2). To understand the strengths and weaknesses of the models, the recall and precision values were calculated for each grade using Equations (3) and (4). All the models were developed using the software MATLAB (R2021a version, Mathworks, Natick, Massachusetts, USA)


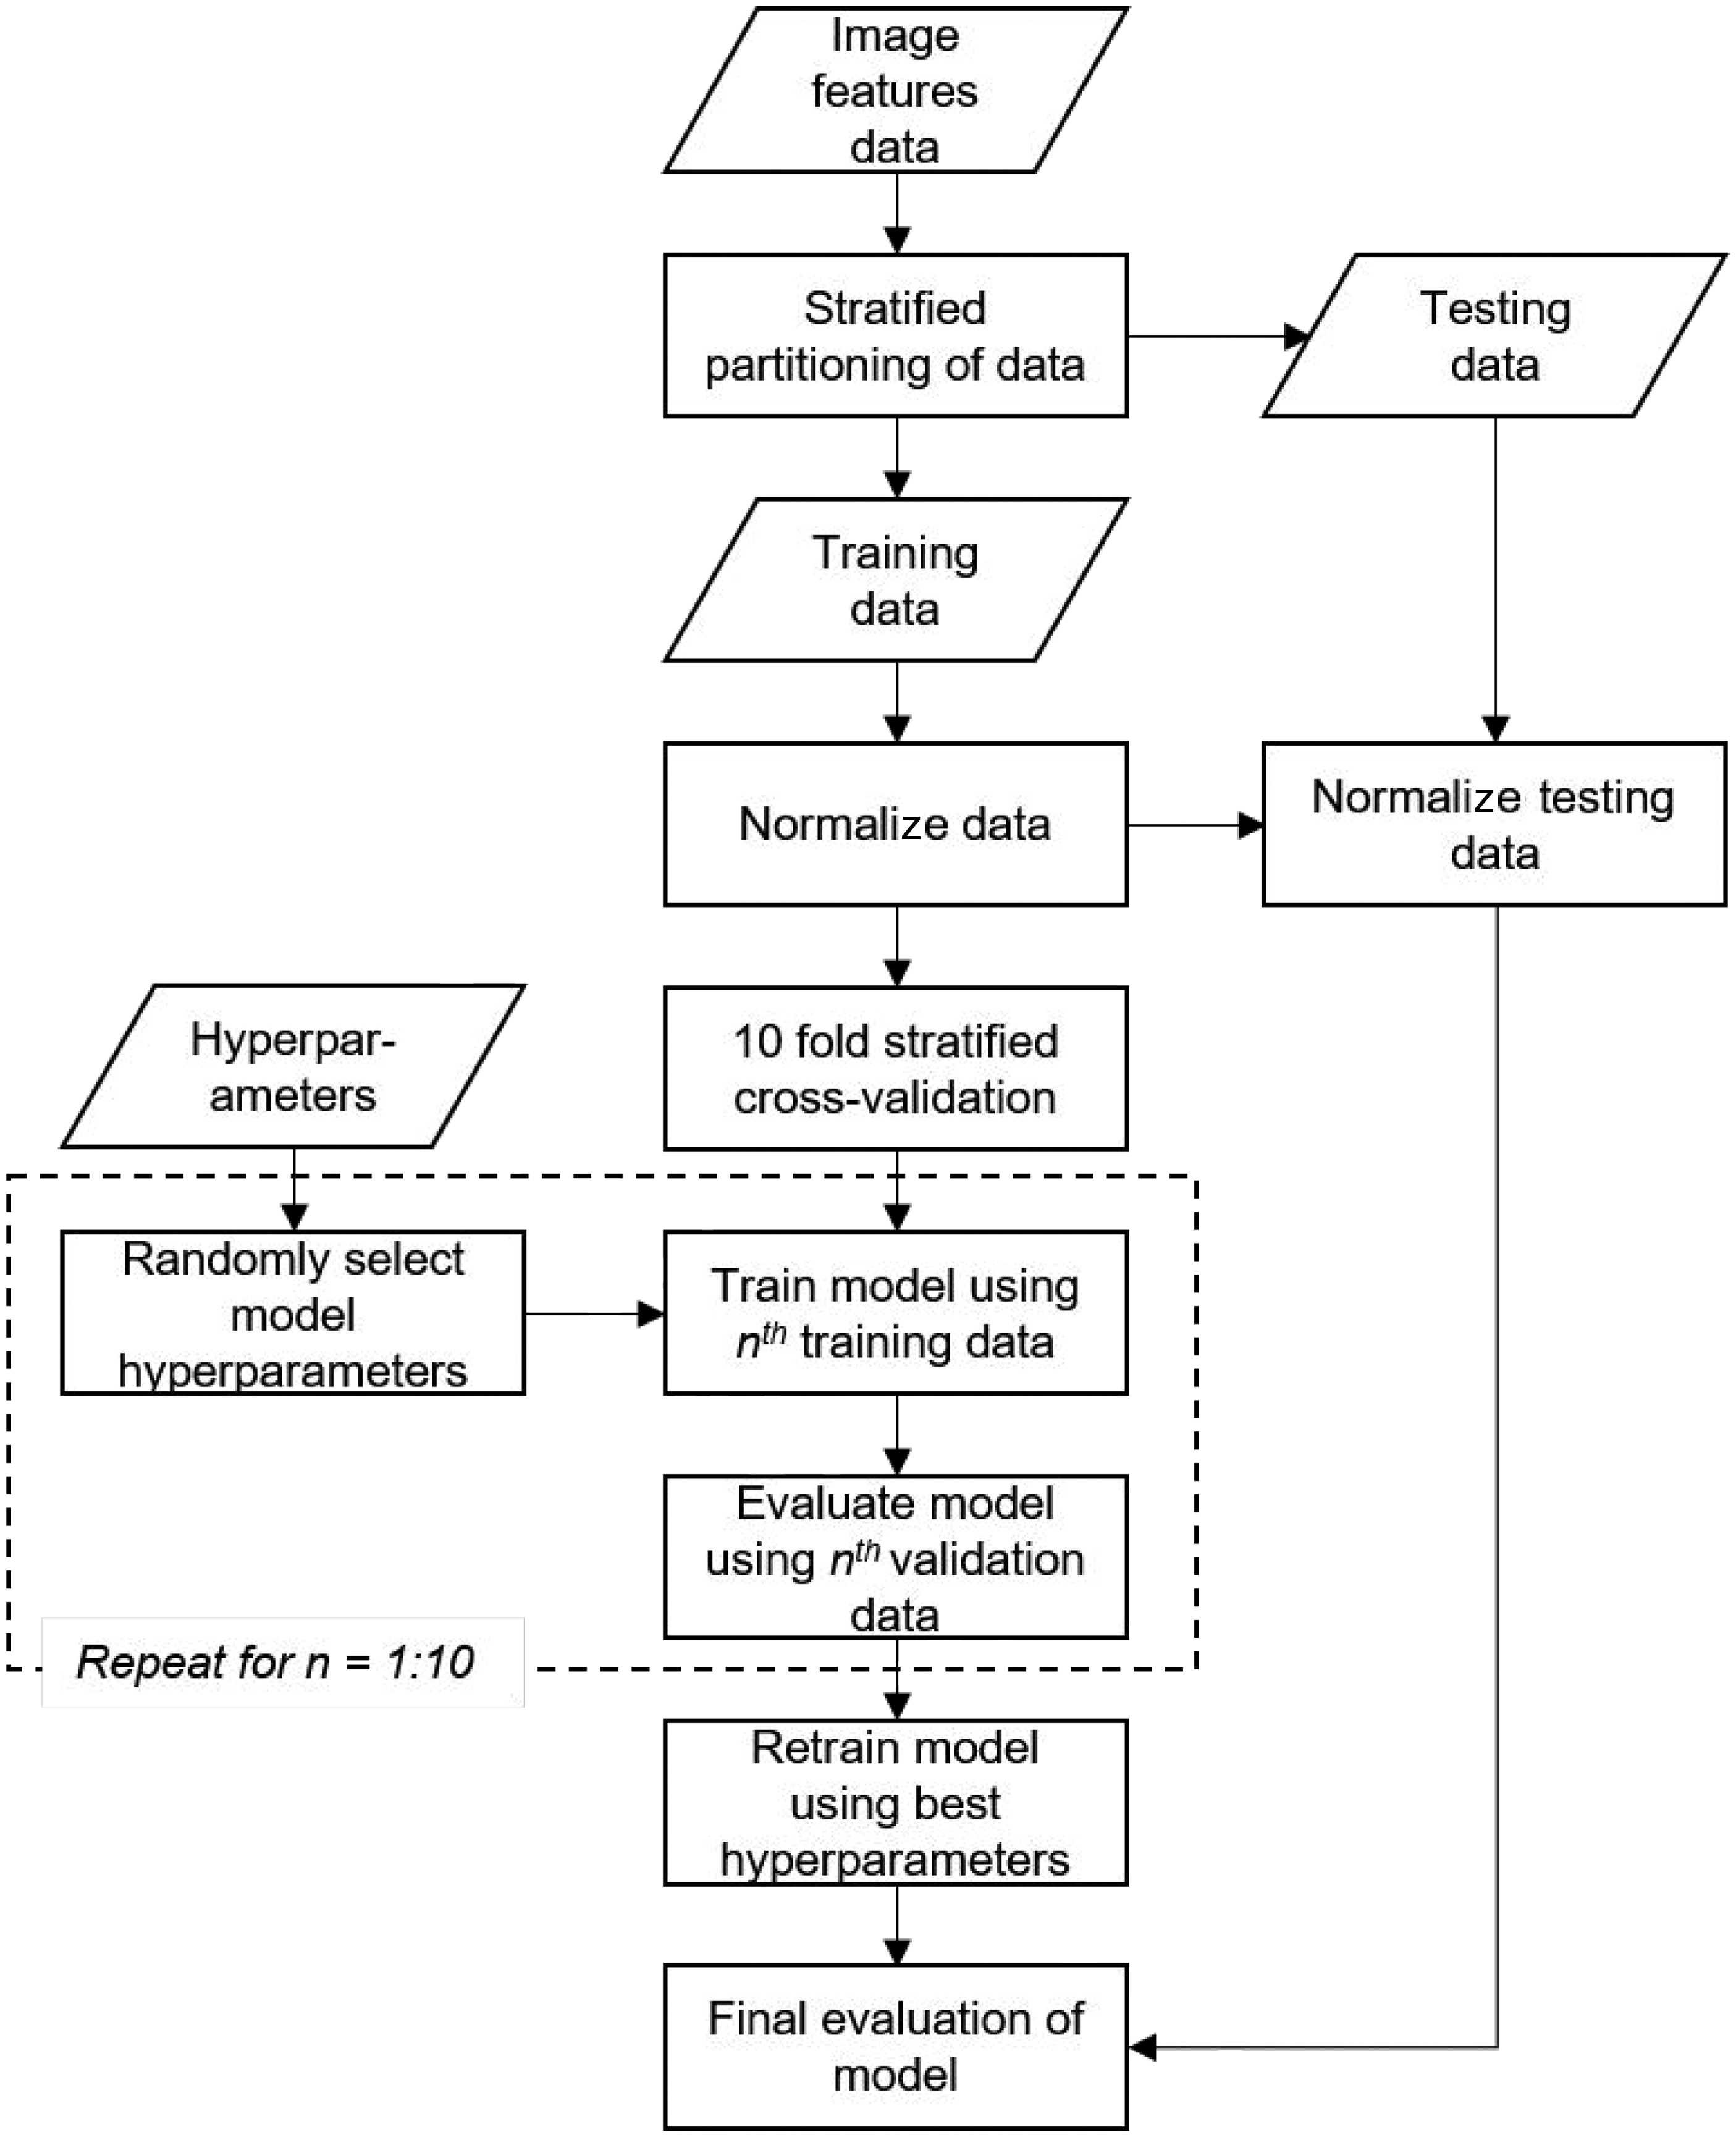
Flow chart of the process to develop the supervised machine learning models.
Unsupervised machine learning methods
The unsupervised machine learning models aim to determine how many classes the data would fit into if labels/grades did not exist. The first step to develop the unsupervised learning models was to normalize the data to ensure all variables were given equal weight by the classification algorithms using the minimax function. 40 The normalized data were then used to train the unsupervised learning algorithms k-means clustering, hierarchical clustering, and Gaussian mixture model. To determine the number of clusters present in the data, each clustering model was repeatedly trained with between one and nine specified clusters. The performance of three clustering algorithms were evaluated by calculating three cluster validity indices, the Calinski–Harabasz index, the Davies–Bouldin index, and the silhouette index, and equations for each are given by Liu et al. 42 The optimal number of clusters maximizes the Calinski–Harabasz and silhouette indices and minimizes the Davies–Bouldin index. 42 All the models were developed using the software MATLAB (R2021a version, Mathworks, Natick, Massachusetts, USA).
Results and discussion
Analysis of cotton lint image processing results
The results of the four image processing methods applied to the Giza 86 cotton lint image data are shown in Figure 5 as boxplots. The boxplots of the image processing methods applied to cultivars Giza 87, 90, 94, and 96 are reported in the Supplementary Information (Figures S5–8). Figures 5(a)–(d) display the boxplots of the color and trash detected features extracted by image processing methods one, “unclean,” and two, “clean,” and Figures 5(e)–(h) display the boxplots of the additional color and trash detected intra-sample variance features extracted by image processing methods three “unclean + intra-sample variance” and four “clean + intra-sample variance.” Regarding the percentage of trash detected feature, Figure 5(d) shows that the percentage of trash detected increases with the cotton grade. This is to be expected, as the presence of trash decreases the cotton lint value because it has a detrimental effect on cotton quality 12 and requires extra processing to remove the trash from the harvested cotton lint. 8 Similarly, Figure 5(b) shows there is a gradual increase of b* as the cotton grade increases. The parameter b* describes the relative degree of blue to yellow within an image, so as the degree of yellow detected in the image increases so does b*. Figure 1 shows that the best quality grades (i.e., I and II) have little to no staining, while the worse grades (i.e., VIII and IX) have patches that are stained a yellow and brown color. Therefore, we would expect the value of b* to increase with the cotton grade, which concurs with previous Egyptian cotton color analysis. 11 Figure 5(a) displays a decrease of L* with the cotton grade, meaning as less light was detected in the image the cotton grade increased. Again, Figure 1 shows that the best quality cotton lint samples have a pure white/creamy color and, as white reflects light, it can be expected that these cotton lint images will contain a higher L*. 43 In Figure 5(b) there appears to be a gradual decrease of a* as the cotton grade increases, but also a large number of outliers clustered below the lower interquartile range for grades I, II, and III. The parameter a* describes the relative degree of green to red within an image. Visual inspection of the images in Figure 1 reveals that neither green nor red colors are obviously present in the cotton lint images, which may explain the ambiguous relationship between a* and the cotton grade and why a* is not normally used to evaluate cotton color. 15 Concerning the intra-sample variation features a*, b*, and percentage of trash detected, Figures 5(f)–(h) show a clear increase in intra-sample variation as the cotton grade increases. The reason for this is that cotton lint uniformity (e.g., consistent cotton color) increases the value of cotton lint 21 ; therefore, as intra-sample variation increases, the value of cotton lint decreases. The exception to this appears to be the intra-sample variation of L*, which does not display a clear relationship with the cotton grade in Figure 5(e). At this stage, it is unclear why this uniform L* is not important for cotton quality; therefore, the Pearson correlation coefficients have been calculated to quantify the relationship between cotton grade and the image processing features to understand their relationship in more detail.
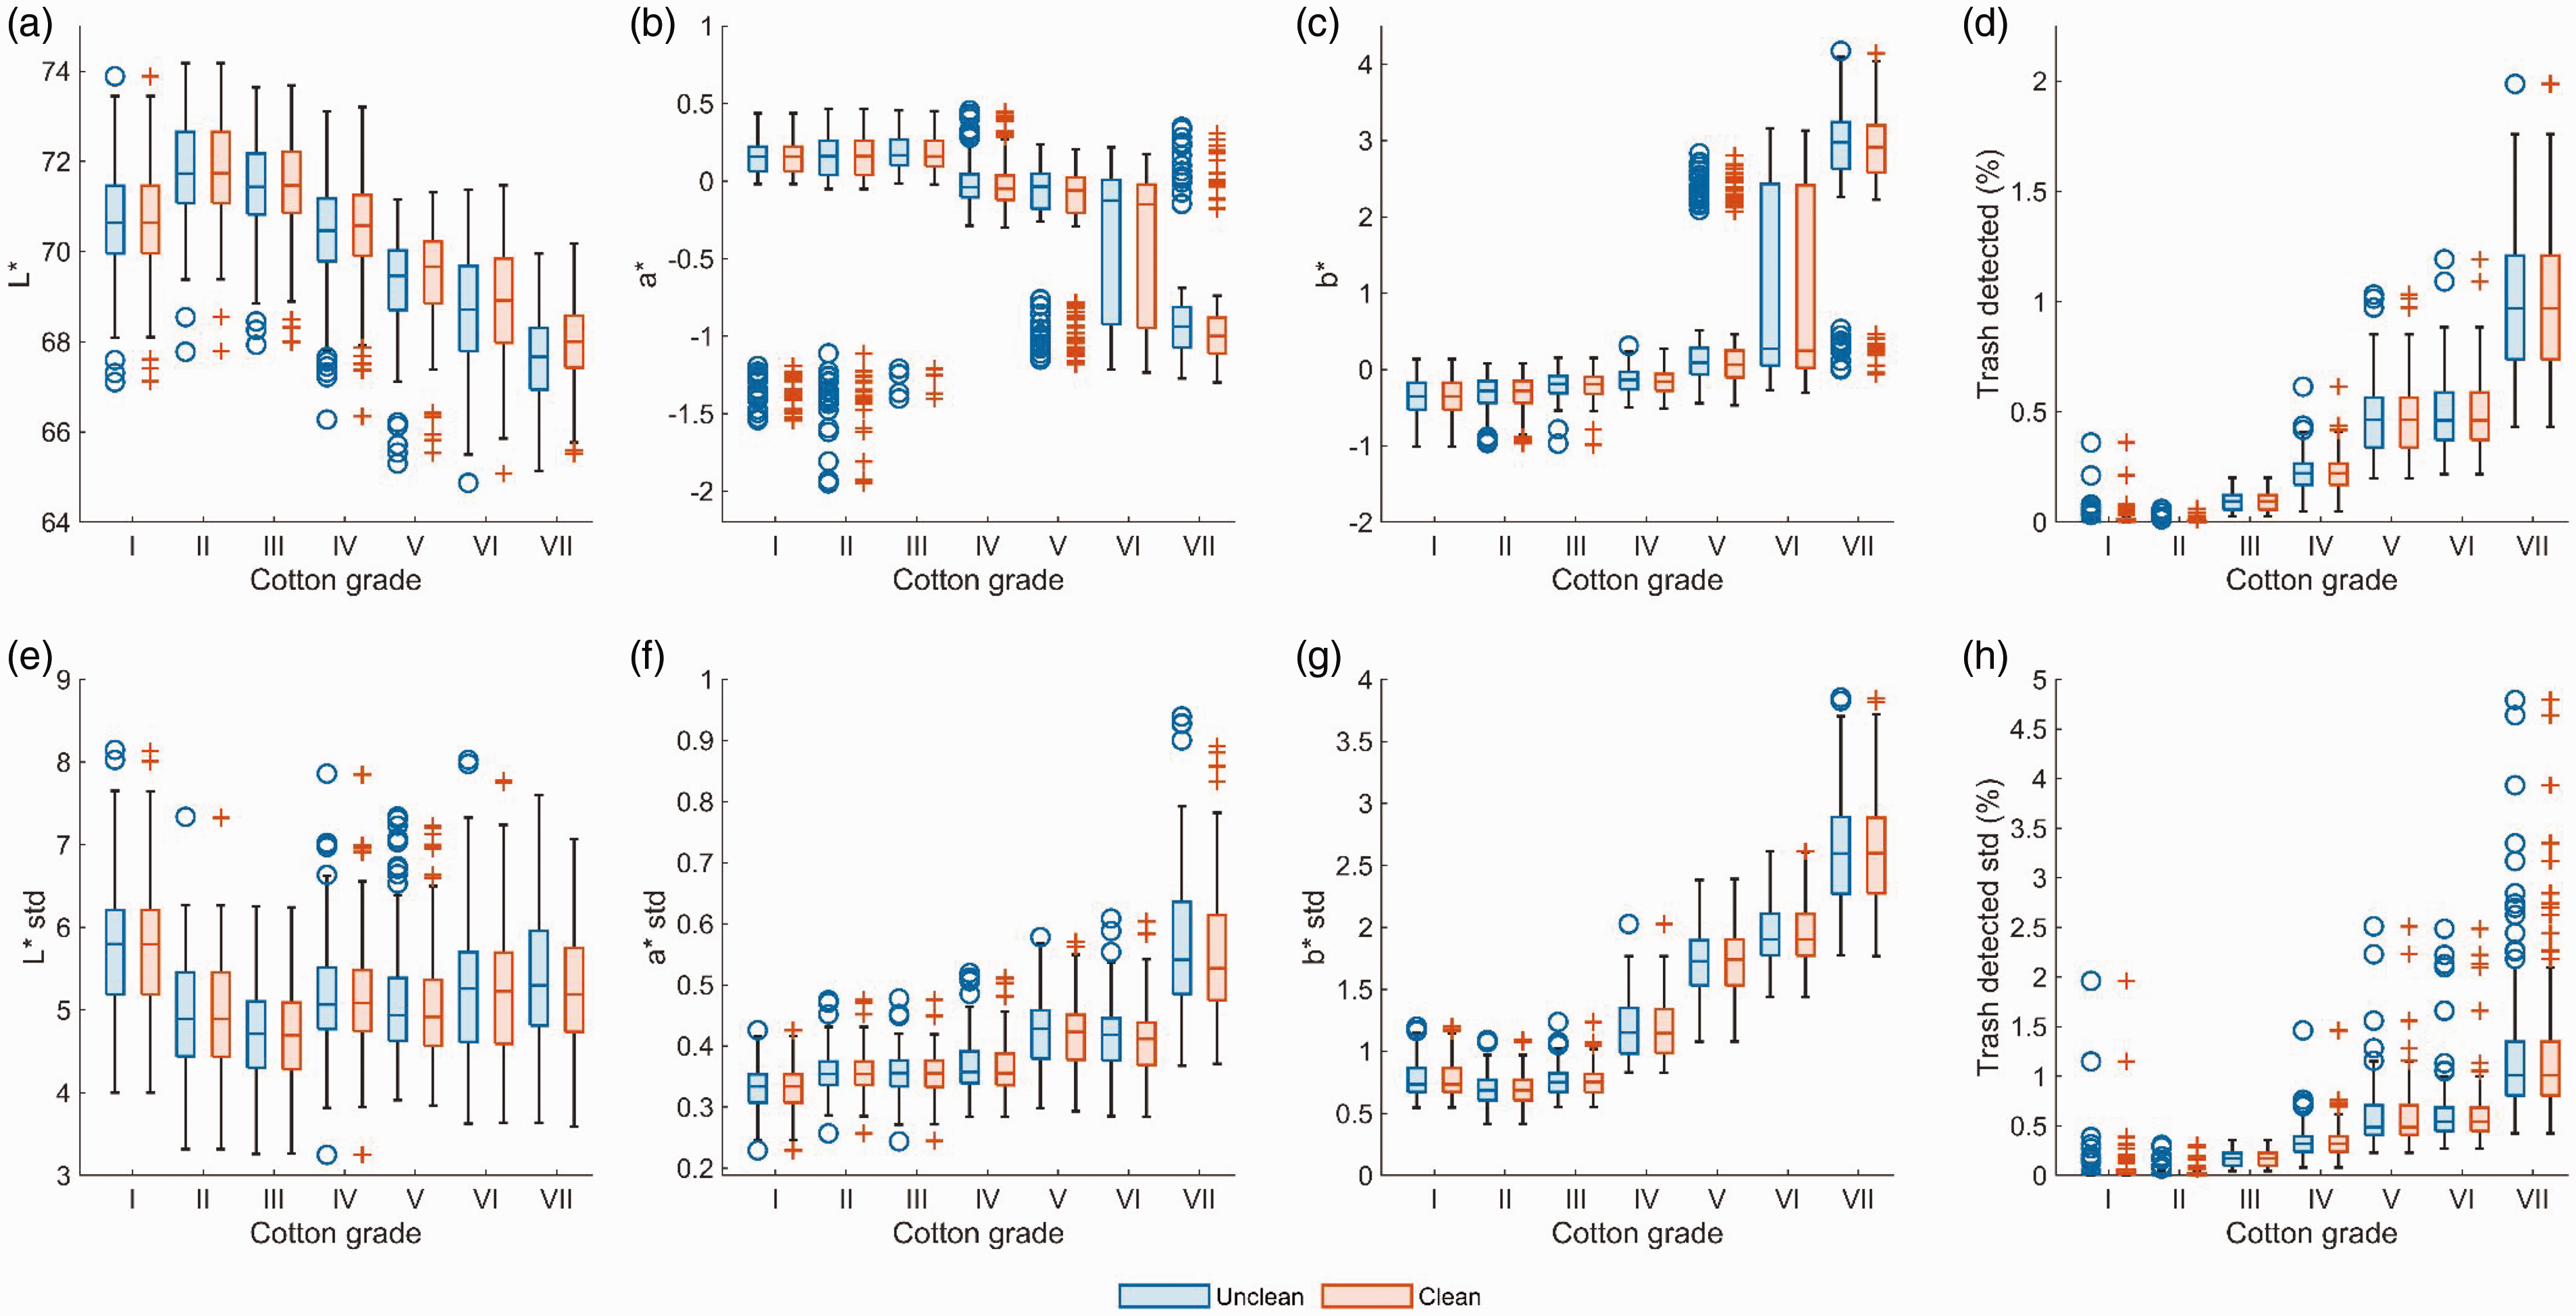
Boxplots showing the three-dimensional Hunter color values (a) lightness, L*, (b) relative to the blue–yellow, b*, (c) relative to the green–red, a*, and (d) the percentage of trash detected data extracted from the Giza 86 cotton lint images between grades I and VII, as well as the intra-sample variance values (e)–(h) for each, respectively. The unclean values (image processing methods one and three) are shown as blue and the clean features (image processing methods one and three) are shown as red. (Color online only.)
The Pearson correlation coefficient (r) between the unclean and clean features and Egyptian cotton grade are reported in Tables 3(a) and (b), respectively. These results indicate that the Egyptian cotton grade has a very strong positive correlation (0.8 < r < 1.0) with the percentage of trash detected. This confirms the observation from Figure 5(d) that the presence of trash deteriorates the cotton quality and the very strong positive correlation agrees with previous correlation analyses of HVI color measurements and Egyptian cotton grades. 11 A strong positive correlation (0.6 < r < 0.79) was also observed between b* and the cotton grade, validating the conclusion from Figure 5(c) that the presence of yellow staining decreases cotton quality. Again, the correlations present within this study’s data agrees with previous studies that have calculated the correlation between b* and the Egyptian cotton grade. 11 Tables 3(a) and (b) show a strong negative correlation (–0.79 < r < –0.6) between L* and the cotton grade, meaning as less light was detected in the image the cotton grade increased. Likewise, Hussein et al. 43 stated that a strong correlation between the lightness and cotton grade meant it is an important color parameter for measuring Egyptian cotton lint quality.Finally, a weak negative correlation (–0.4 < r < 0.1) between a* and the cotton grade was observed. As previously mentioned, the lack of obvious green or red colors present in the Figure 1 cotton lint images may explain the weak correlation observed and be the reason why a* is not conventionally utilized to grade cotton.11,43 Overall, these observed correlations and their associated strengths concur with previous correlation analyses of HVI color measurements and Egyptian cotton grades,11,43 which indicates that CCD image processing analyses can be effectively used to measure Egyptian cotton color.
(a) Pearson correlation coefficient between unclean features (image processing methods one and three) and Egyptian cotton grade for cultivars Giza 86, 87, 90, 94, and 96. When there is a small probability (p-value <0.05) that there is no relationship between the feature and the Egyptian cotton grade, NA result is reported. (b) Pearson correlation coefficient between clean features (image processing methods two and four) and Egyptian cotton grade for cultivars Giza 86, 87, 90, 94, and 96. When there is a small probability (p-value <0.05) that there is no relationship between the feature and Egyptian cotton grade, NA result is reported
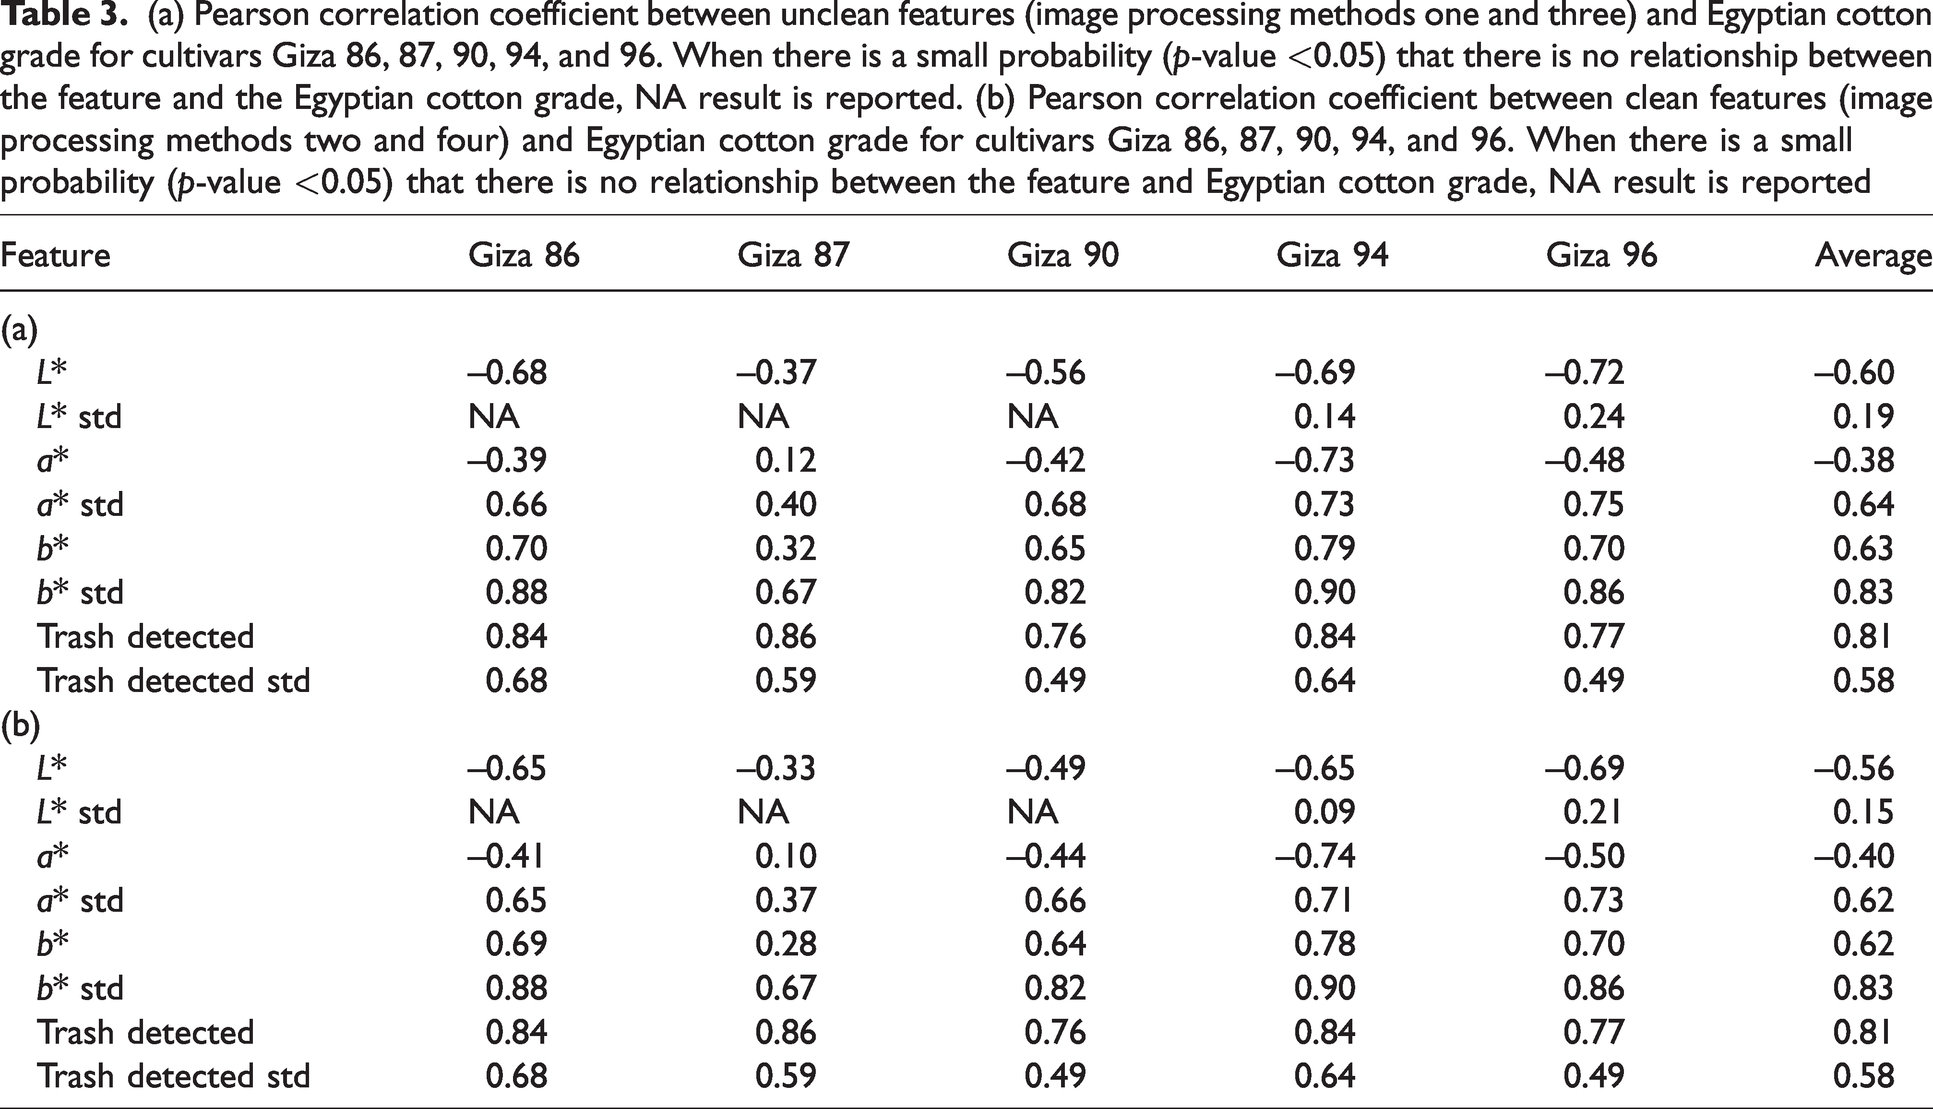
Unlike previous studies, additional features that describe the degree of intra-sample variation were also used in this study to measure Egyptian cotton, as outlined in image processing methods three and four. The intra-sample variance of L* had a very weak (0 < r < 0.19) positive correlation with the Egyptian cotton grade for Giza cultivars 94 and 96 and a greater than 0.05 probability of no relationship with the Egyptian cotton grade for Giza cultivars 86, 87, and 90. This result suggests that intra-sample variance of L* had little to no effect on cotton quality, which challenges previous findings that state the degree of intra-sample variance of L* is needed for characterizing US Upland cotton. 21 The reason for the disagreement may either be due to the difference between Egyptian and US Upland cotton characteristics 11 or because the previous study did not explore the correlation between the intra-sample variance and cotton grade. A strong positive correlation was observed between the cotton grade and the degree of intra-sample variance of a* and b*, meaning as the intra-sample variance of the cotton color increases, the cotton quality decreases. Figure 1 shows that the staining of cotton lint is not uniform and as the cotton quality decreases, the number of stained patches increases. This may explain the strong positive correlation observed and supports the statement that uniform cotton lint properties are desirable for consistent processing and product quality. 21 In addition, this result validates the inclusion of the measurement of a* within this study's proposed methodology, as the strong positive correlation between the Egyptian cotton grade with the degree of intra-sample variance of a* implies the need to include a* measurements going forward when characterizing Egyptian cotton.
Next, the effect of removing the influence of trash on the cotton color measurements is explored. There is a small absolute change in the medians (<0.06) and interquartile ranges (<0.005) between the unclean and clean boxplots in Figure 5, which indicates that the presence of trash had a negligible difference when measuring the Giza 86 cultivar’s color parameters and degree of intra-sample variance of the color parameters. This result was repeated in the other cultivars studied, as shown in the Supplementary Information. Furthermore, the r values reported in Tables 3(a) and (b) for the Egyptian cotton grades and both the unclean and clean features values were very similar (i.e., absolute change r < 0.04). The reason for the negligible difference between unclean and clean color measurements may be attributed to a very low percentage of trash detected within the Egyptian cotton samples; for example, the mean percentage of trash in Giza 86 samples is 0.51%. Therefore, only a very small number of pixels are being removed when cleaning the cotton images before measuring the cotton color. This result disagrees with Heng et al.’s 23 previous conclusion that the presence of trash did significantly influence the L* and a* cotton color measurements. The reason for this may be that the trash detection algorithm was more successful at detecting the trash and removing the trash within the Heng et al. 23 study. Therefore, further work may explore if the use of other trash detection algorithms (e.g., Kang and Kim 24 ) would result in a greater difference between the unclean and clean cotton lint color measurements.
Finally, the interquartile ranges visualized by the boxplots in Figure 5 show an overlap between the Egyptian cotton grades for all color features. This is emphasized for grades I–VI for the color features a* and b* and the intra-sample variance of a*. The overlap between grades indicates that the cotton grade boundaries are not well defined, as reported by a previous study measuring the color of US upland cotton samples from a CCD. 24 The unclear Egyptian cotton grade boundaries justify previous statements that the manual labeling of cotton is a very intricate and complex subject. 11 This highlights the need for a machine learning approach to classify Egyptian cotton lint samples, as machine learning models are able to detect hidden patterns within the data that are not obvious to human classifiers. 34
Classification model results
The testing data accuracy results for the 12 classification models built using permutations of the image processing methods and supervised machine learning algorithms are presented in Table 4. The maximum observed model accuracy for the cultivars Giza 86, 87, 90, 94, and 96 are 82.13%, 90.21%, 83.75%, 89.27%, and 84.87%, respectively. The cultivar fiber length, long or extra-long, appears not to have affected model accuracy, as both Giza 87 (extra-long staple) and Giza 94 (long staple) had similar accuracies, 90.21% and 89.27%, as did Giza 90 (long staple) and Giza 96 (extra-long staple), 83.78% and 84.87%. This is likely due to the color vision system and image processing methods not capturing the fiber lengths within the images. Therefore, the classification models used only the cotton lint color and percentage of trash features as input data, which have a similar relation with cotton quality across cultivars. 11 The range of model accuracies achieved (82.13–90.21%) is comparable to other previously reported accuracy results (88.0–94.0%) that have used image processing and machine learning to classify US upland cotton lint.18,26 Recent work using deep learning to automate image processing achieved an accuracy of 98.9% when classifying the Chinese upland cotton grade. 13 Directly comparing model accuracy results is constrained due to the difference between Egyptian cotton varieties and upland varieties of cotton and the different grading systems used. In addition, 3024 images were used to develop the deep learning model, while on average 690 images were used to develop the classification models within this study.
Supervised machine learning model accuracies (%) performance when evaluated using testing data across 12 models; the best result for each Giza cultivar is highlighted in bold
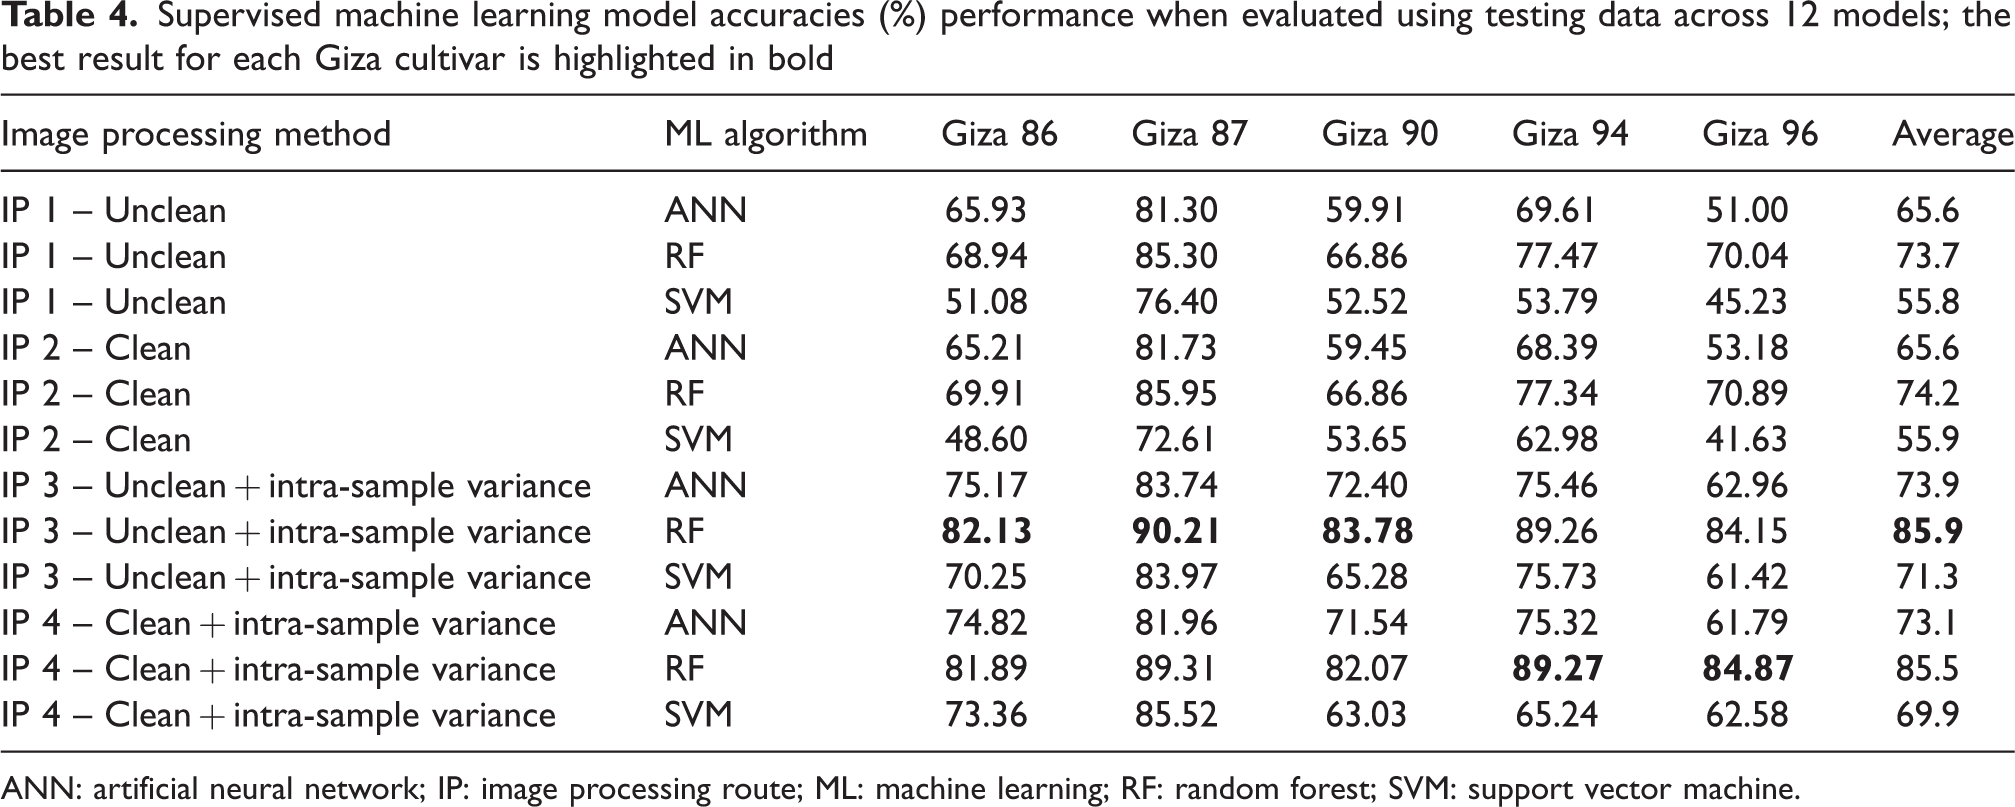
ANN: artificial neural network; IP: image processing route; ML: machine learning; RF: random forest; SVM: support vector machine.
The RF algorithm consistently reported the highest accuracy, irrespective of the image processing method or the Egyptian cotton cultivar. On average, the models built using a RF algorithm achieved the highest average accuracy (79.83%), followed by the ANN (69.54%) and the SVM (63.24%). The majority of previous work used either ANN models 18 or SVM models13,26 when predicting the cotton grade, due to their ability to fit non-linear data. However, the results in Table 4 indicate that RF algorithms are better suited to modeling cotton lint image data. The large number of outliers observed in the cotton lint image data (Figure 5) may be the reason for the RF models' higher accuracy when compared to the ANN and SVM models. RFs are adept at handling outliers, as the tree nodes are determined based on the sample proportions in each split region and not on their absolute values, 37 whereas algorithms like the ANN and SVM need a low number of outliers within the dataset in order to achieve better generalization of the network, as outliers in the dataset hinder the modeling process and produce misleading results. 44
The addition of the intra-sample variance features (image processing methods three and four) resulted in an average increase of 11.5% in the model accuracies, for the first time proving the advantage of including intra-sample variance features when predicting cotton grades. This is because the intra-sample variance features describe how uniform a cotton lint sample is, a desirable cotton characteristic that enables consistent textile processing and product quality. 21 The benefit of cleaning the cotton lint images to remove the influence of trash on the color measurements was not certain. The models developed using unclean features achieved an average accuracy of 71.03%, while the models developed using clean features achieved an average accuracy of 70.70%. In addition, on average there was an additional 0.42 seconds of image processing time associated with cleaning the cotton lint features. The negligible difference in model accuracy between the unclean and clean features is likely due to the small absolute change in color measurements between the two methods, as previously discussed in the Analysis of cotton lint image processing results section. This meant the models were learning from very similar training data, so any difference in model accuracy is primarily from variation in the final model hyperparameters set during the cross-validation tuning. Therefore, because there were no accuracy gains and an increased image processing time associated with cleaning the images, this study concludes that cleaning trash from cotton lint images is not recommended when using machine learning models to classify the Egyptian cotton grade.
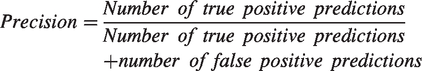
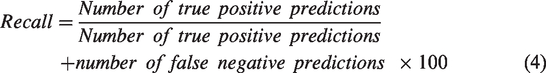
To quantify the capability of the classification models to distinguish between the Giza 86 Egyptian cotton grades, the metrics precision and recall were calculated using the test data and are reported in Table 5. The recall and precision metrics for cultivars Giza 87, 90, 94, and 96 are available in the Supplementary Information. Precision is the fraction of relevant instances among the retrieved instances (i.e., the ability to classify instances correctly), whereas recall is the fraction of relevant instances that were retrieved (i.e., the ability to classify as many instances as possible). Table 5 clearly shows that the precision and recall of each classifier yielded large deviations in results (precision = 26.01–96.02%, recall = 26.44–96.52%). Nevertheless, the results in Table 5, and the Supplementary Information, show that the RF machine learning algorithm obtained the best performance across all grades for each cultivar, with a small number of exceptions (e.g., for the Giza 86 grade VII the model developed using the SVM had the highest precision score, 96.02%). Furthermore, the best results were obtained by models developed using the additional intra-sample variance features, as evidenced by the increase in minimum values of the precision and recall metrics from 28.01% to 54.43% and 26.44% to 46.74%, respectively. In addition, the difference between average precision and recall scores for the models developed using unclean cotton images and clean images was again shown to be minimal, 2.00% and 1.84%, respectively.
Classification performance in terms of the precision and recall metrics for the 12 Giza 86 models on the testing data set; the best result for each Giza cultivar is highlighted in bold
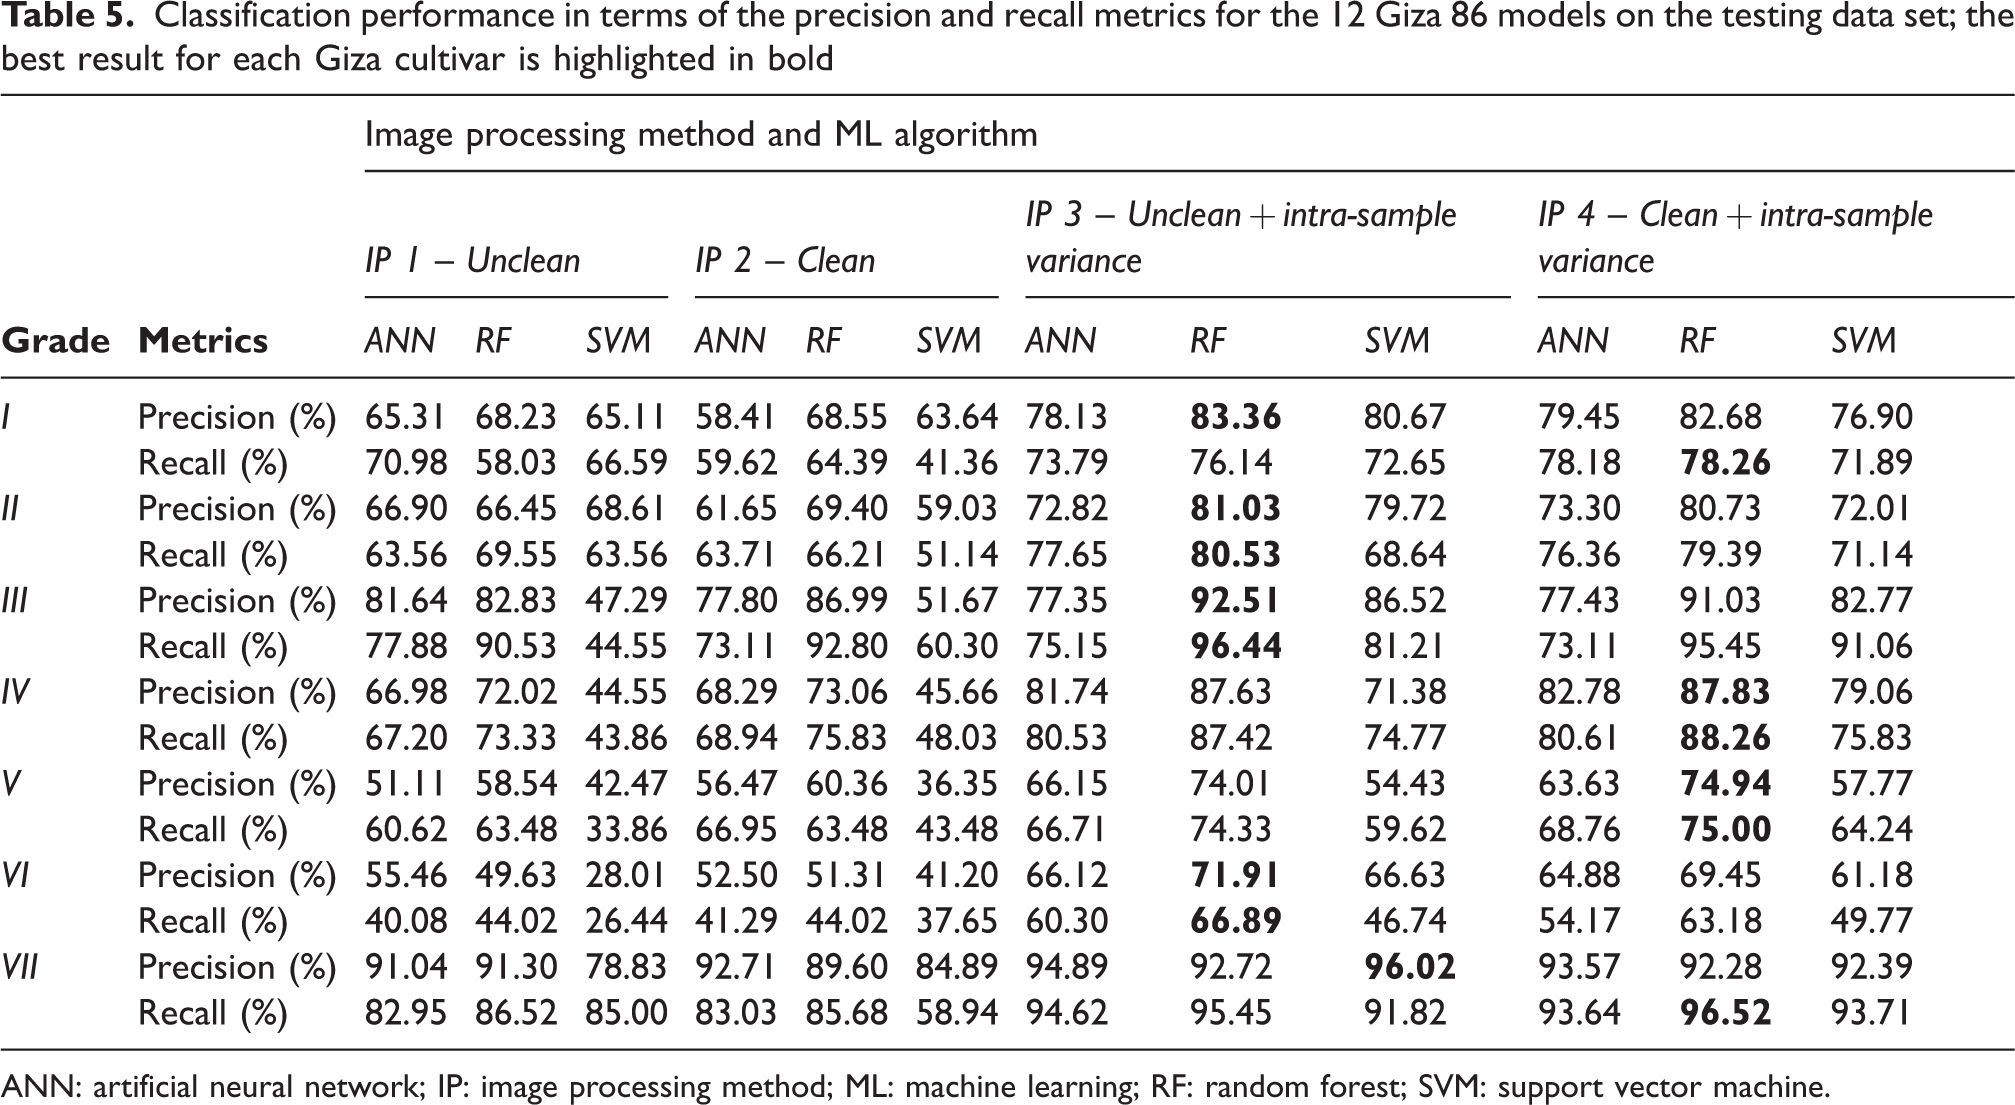
ANN: artificial neural network; IP: image processing method; ML: machine learning; RF: random forest; SVM: support vector machine.
The main source of error for the Giza 86 classification models occurred with the misclassification of cotton samples belonging to grade VI. The best precision value achieved was 71.91%, meaning almost 30% of data predicted as grade VI was incorrect, and the best recall value was 66.89%, meaning the model failed to identify 33.11% of the data belonging to this class. The high precision and recall values of grade VII, 92.72% and 95.45%, respectively, suggest that the errors occurred by misclassifying samples belonging to grade V as grade VI and vice versa. The recall and precision metrics indicate that the models built to predict the Giza 87 grade performed worst when predicting grades IV and V (maximum precision = 84.23–89.03%, maximum recall = 86.36–85.23%) compared to predicting grades II and III (maximum precision = 93.37–99.23%, maximum recall = 96.27–96.67%). The Giza 90 models’ recall and precision metrics revealed that the main source of errors occurred when classifying between grades IV, V, and VI (maximum precision =75.12–76.03%, maximum recall = 69.36–76.32%). The main source of errors for the Giza 94 models arose with the misclassification of the data belonging to grades I and II (maximum precision = 80.11–83.12%, maximum recall = 76.36–85.91%). Finally, recall and precision metrics indicate that the main source of error within the Giza 96 models occurred when misclassifying data belonging to grade IV (maximum precision = 79.47%, maximum recall = 80.68%). Identifying a classification model's main sources of error has been overlooked in previous models built to classify cotton grades,13,18,26 yet is important to understand a model’s true performance.
Evaluation of human error via unsupervised learning
Manual labeling of cotton is a very intricate and complex subject, as it depends upon human perceptions of sight and touch and requires a high degree of precision and power of critical judgment on the part of the grades of a set of samples belonging to a cultivar. 11 Furthermore, manual labeling is subject to human error due to the significant influence of inspection conditions, such as light and human fatigue from long inspection times. 13 The results in the Analysis of cotton lint image processing results section show a significant overlap between the cotton grades and a high number of outliers, which suggests that human error has occurred when labeling the samples in this study. Therefore, unsupervised learning was used to further understand the similarity between cotton grades to detect where human error from manual labeling of cotton samples may have occurred. Three unsupervised machine learning algorithms were evaluated, these were k-mean clustering, hierarchical clustering, and the Gaussian mixture model. The number of clusters provided by the three clustering algorithms in conjunction with the three validity metrics for the different cultivar data sets is provided in Table 6. As can be seen from the table, none of the validity metrics was able to indicate that the number of clusters was equal to the number of Egyptian cotton grades, irrespective of the underlying clustering technique used. This result indicates that some of the grades are indiscernible from one another and are sorted into the same cluster. This concurs with previous research that outlines the challenges when defining Egyptian cotton grades due to overlapping boundaries. 11 Furthermore, it highlights the potential for human error when the boundaries are not well defined between grades. The exception is the Gaussian mixture model when clustering the Giza 87 data, as it identified four clusters within the data that correspond to the actual number of grades represented within the data. This may explain why the Giza 87 supervised machine learning models had the highest accuracy (90.21%).
Number of clusters provided by the three clustering algorithms using the four validity indices for the different cultivar data sets
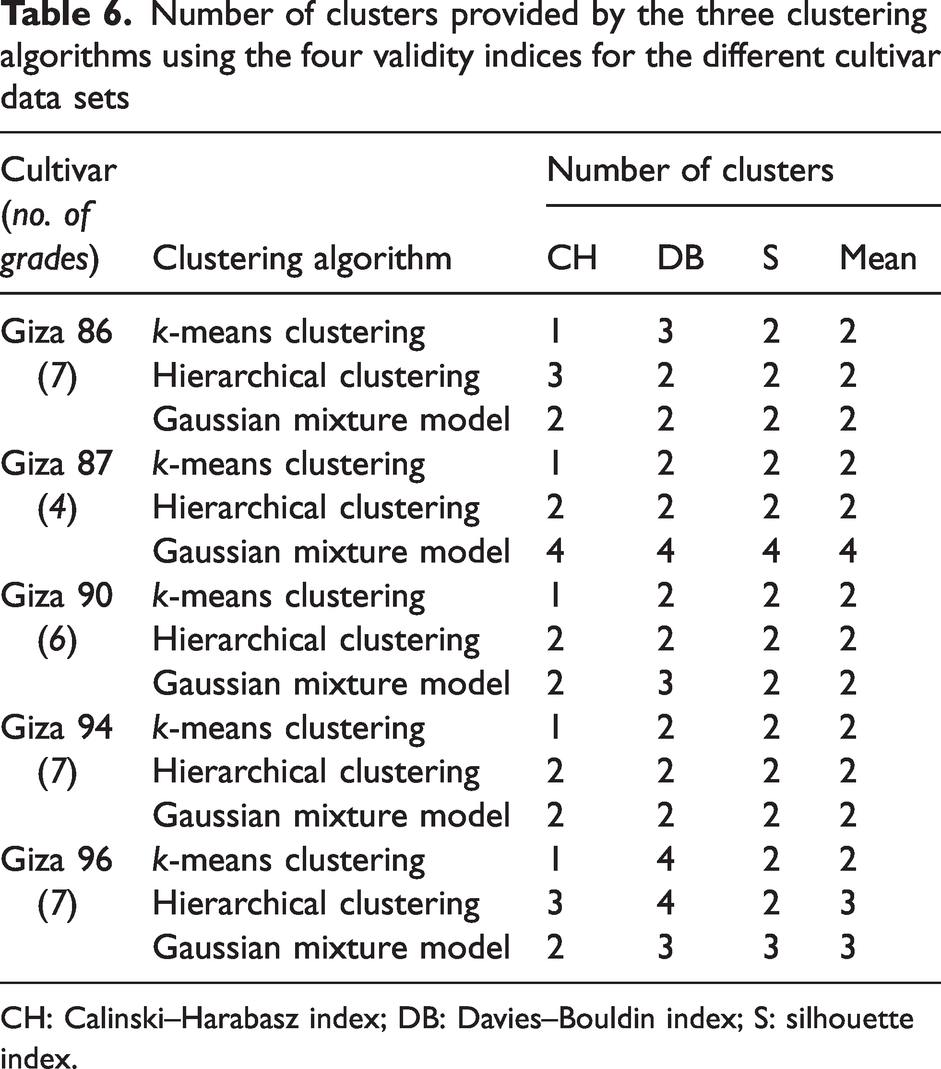
CH: Calinski–Harabasz index; DB: Davies–Bouldin index; S: silhouette index.
To determine which grades were similar, the cluster analysis was performed for each unsupervised learning algorithm using the mean number of clusters recommended by the validity indices (Table 6). The heat maps in Figure 6 visualize how Egyptian cotton data has been split between the clusters defined by the clustering algorithms (1) k-mean clustering, (2) hierarchical clustering, and (3) the Gaussian mixture model. The results of this cluster analysis can be used in two ways to support future labeling of data. Firstly, it can be used to identify data points that are not sorted into the cluster predominantly associated with that grade as likely being mislabeled. Secondly, it can indicate the Egyptian cotton grade boundaries that are difficult to define. For example, the clustering algorithms divided the Giza 86 data into two clusters. Grades I–III were assigned to cluster one and grade VII was assigned to cluster two. This means that there was a similarity between grades I, II, and III that the clustering algorithms could not distinguish between. This may be explained by the low percentage of trash detected within these grades (<0.37%) and similar average b* measurements across these grades (–0.37, –0.33, –0.21, respectively). The Pearson correlation analysis revealed there to be a strong correlation between these features and the cotton grade; therefore, the similarity of trash detected and degree of b* within higher grades can make it harder to measure their quality. 45 Furthermore, disagreement emerged between the different clustering methods as to which clusters the grades IV–VI belonged in. For example, the k-means clustering and Gaussian mixture model identified grade VI as being sorted into cluster one, whereas the hierarchical clustering sorted grade VI into cluster two. The lack of agreement as to which clusters grades IV–VI belong to suggests the boundaries of these grades are hard to define and, therefore, may be prone to a higher degree of human error when labeling.
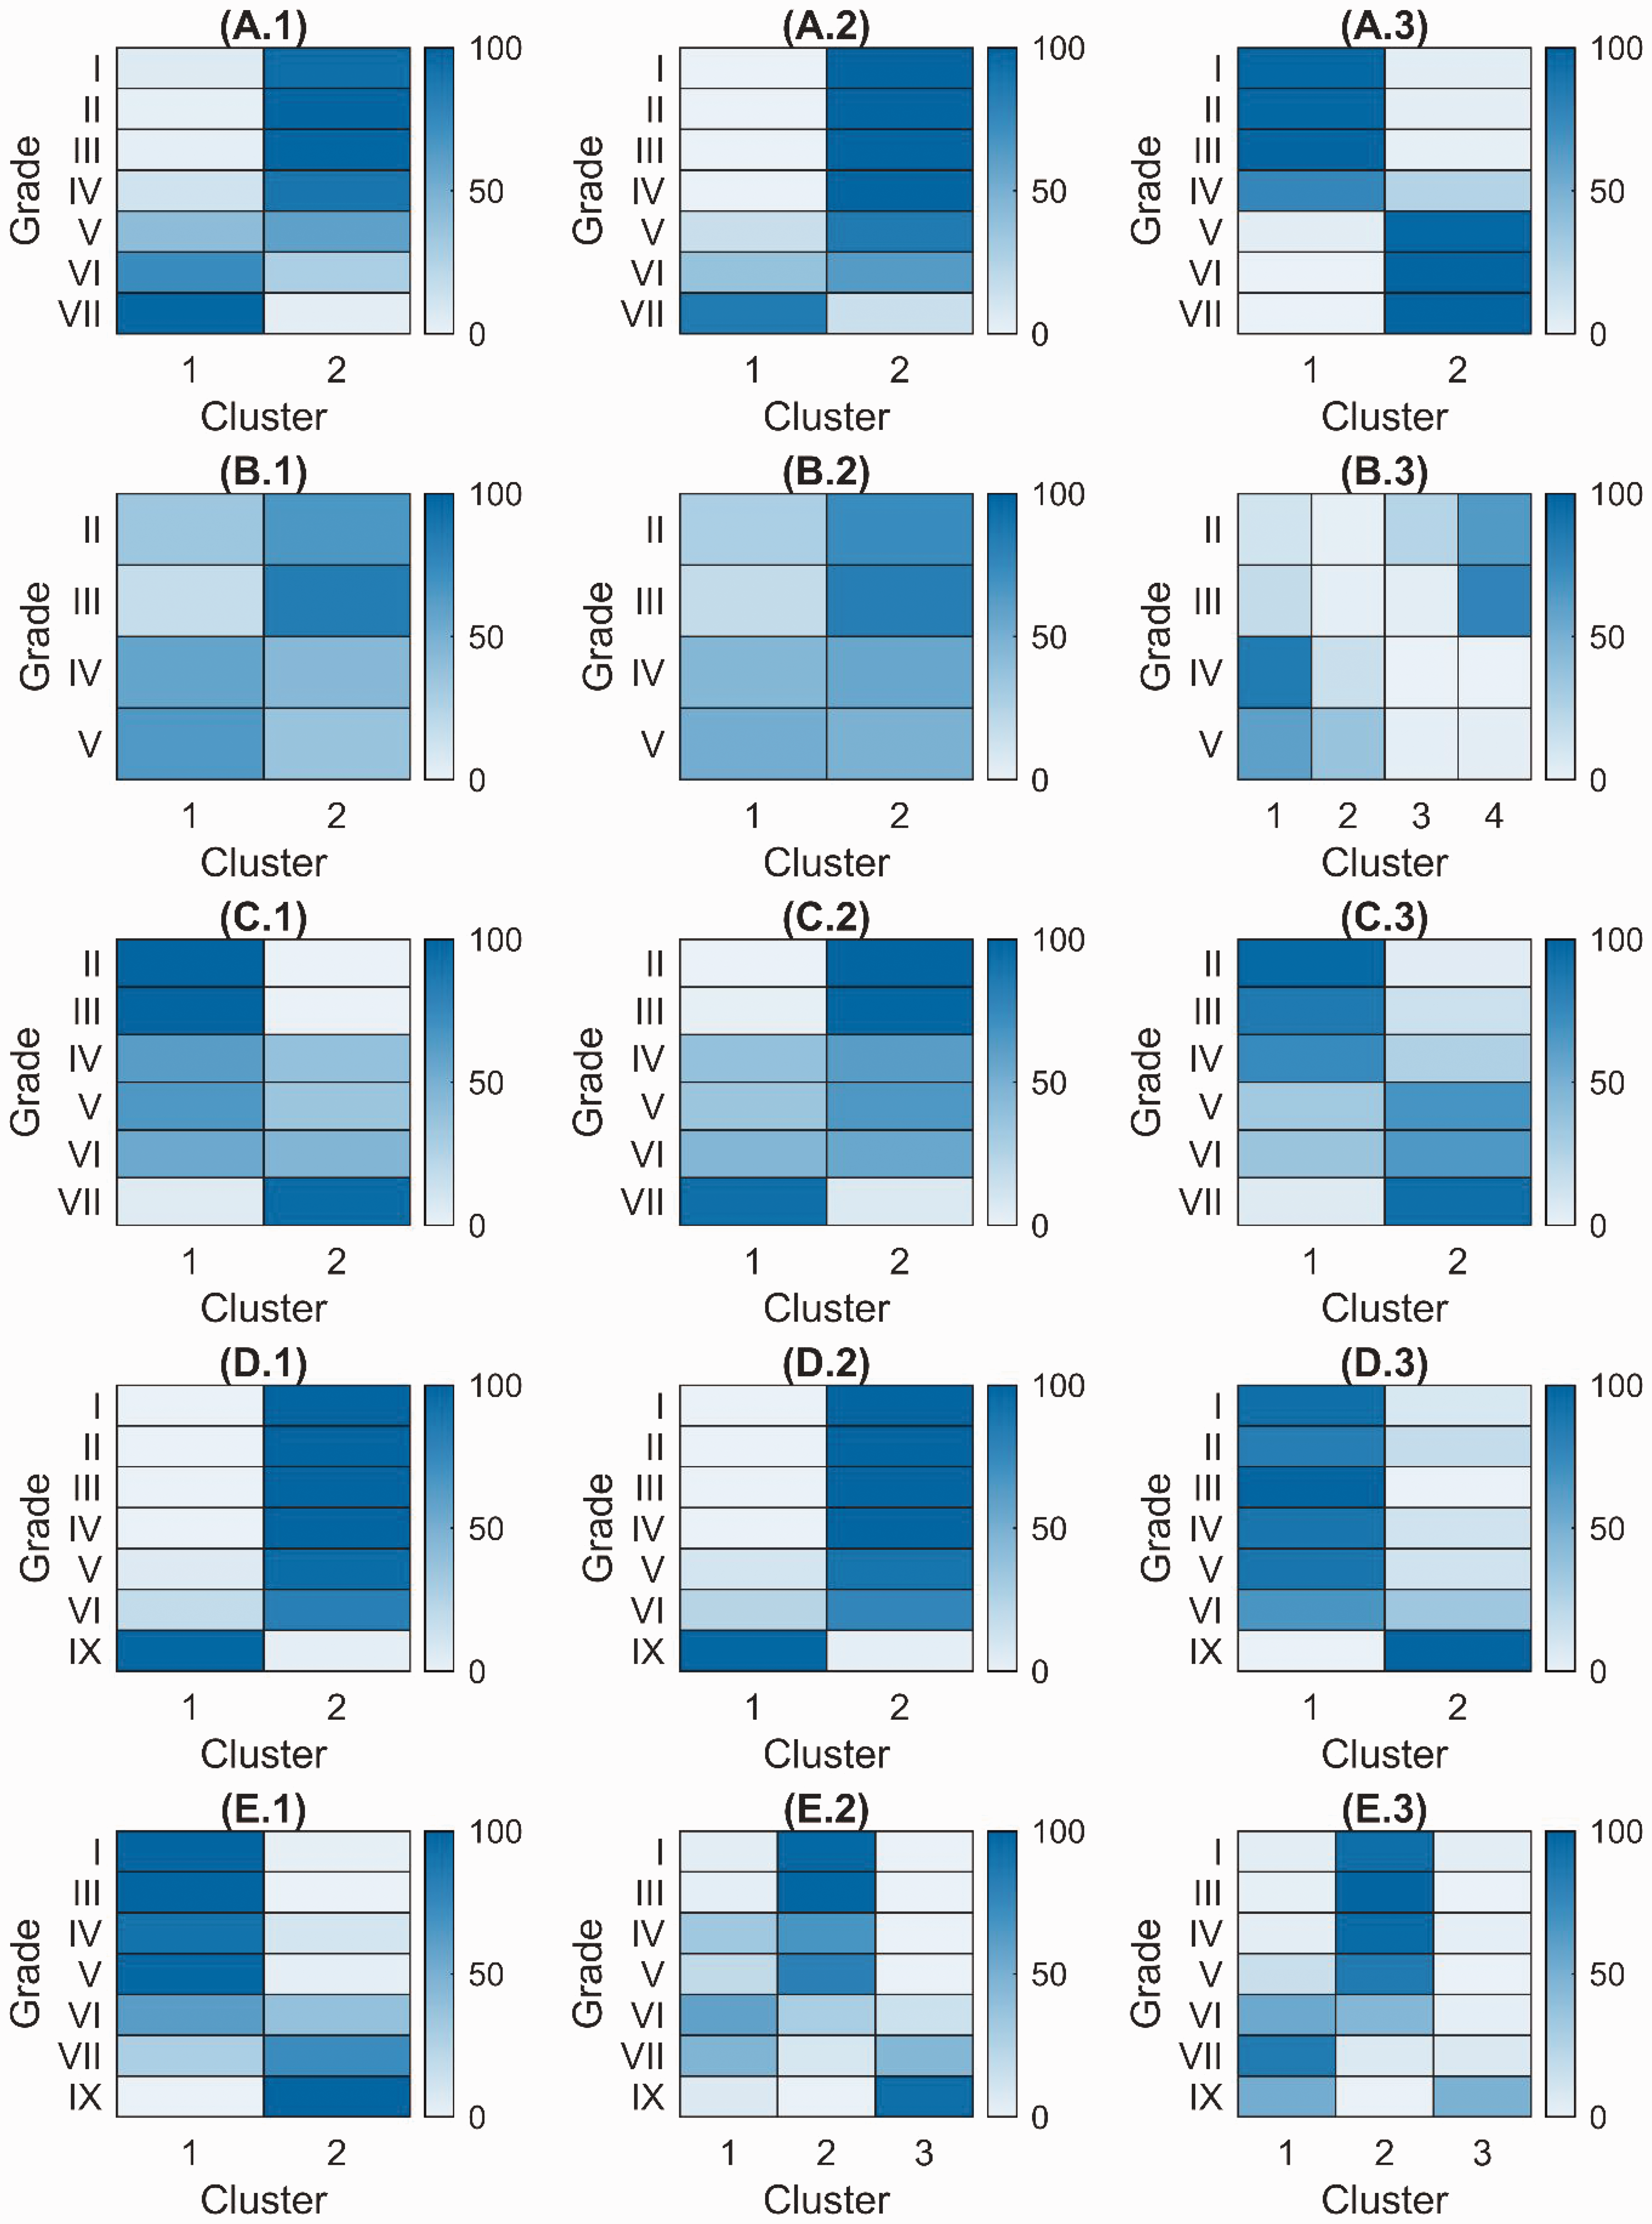
The heat maps showing how the Egyptian cotton lint grade data have been split between the clustering methods (1) k-means clustering, (2) hierarchical clustering, and (3) the Gaussian mixture model for the cultivars (a) Giza 86, (b) Giza 87, (c) Giza 90, (d) Giza 94, and (e) Giza 90.
Future work
This work has demonstrated that image processing combined with machine learning has the potential to improve and address the current inefficiencies when grading Egyptian cotton. These could have a particular impact on small and medium enterprise (SME) cotton processers that cannot afford HVI instrumentation to grade their cotton lint. However, for the method to be commercially viable, future research is required in the following five areas.
Conclusion
The growing, harvesting, and processing of Egyptian cotton is an industry that still uses traditional manual processes; image classification models have the potential to provide increased efficiency, sustainability, and productivity. Currently, cotton lint samples are graded by manual inspection, which has several drawbacks including significant labor requirements, low inspection efficiency, and influence from inspection conditions, such as light. This work showed that classification models, using features extracted from a CCD image, are able to accurately grade the Egyptian cotton lint samples. Three supervised machine learning algorithms were compared and the RF machine learning consistently achieved the highest accuracies when evaluated using testing data (82.13–90.21%). Furthermore, while the addition of features that characterized the intra-sample variance improved the performance of all the models, the removal of trash from the influence of the color measures made a negligible difference. Three unsupervised machine learning algorithms were used to (a) identify data points that have likely been mislabeled and (b) which Egyptian cotton grade boundaries are challenging to define. Finally, five areas of future research are identified to progress the development of the system so that it is fit for commercial use:
collect additional data to describe undefined grades; improve the classification accuracy; reduce the volume of labeled data; transfer learning between cultivars; a framework to share data between cotton processers.
Supplemental Material
sj-pdf-1-trj-10.1177_00405175221145571 - Supplemental material for An image processing and machine learning solution to automate Egyptian cotton lint grading
Supplemental material, sj-pdf-1-trj-10.1177_00405175221145571 for An image processing and machine learning solution to automate Egyptian cotton lint grading by Oliver J Fisher, Ahmed Rady, Aly AA El-Banna, Nicholas J Watson and Haitham H Emaish in Textile Research Journal
Footnotes
The author(s) declared no potential conflicts of interest with respect to the research,authorship,and/or publication of this article.
The author(s) have no conflicts of interest to declare.
Funding
The author(s) disclosed receipt of the following financial support for the research, authorship, and/or publication of this article: This work was supported by the Engineering and Physical Sciences Research Council (EPSRC) [EP/S036113/1], Connected Everything II: Accelerating Digital Manufacturing Research Collaboration and Innovation.
Supplemental material
Supplemental material for this article is available online.
References
Supplementary Material
Please find the following supplemental material available below.
For Open Access articles published under a Creative Commons License, all supplemental material carries the same license as the article it is associated with.
For non-Open Access articles published, all supplemental material carries a non-exclusive license, and permission requests for re-use of supplemental material or any part of supplemental material shall be sent directly to the copyright owner as specified in the copyright notice associated with the article.