
Abstract
In this study, the tensile strength of laminated fabric used as an automotive seat cover was simulated using finite element analysis (FEA). The laminated fabric has three layers and is composed of plain weave fabric and twill 2/2 at different densities, polyurethane foam, and polyamide circular knitted scrim. FEA simulation was carried out on the constructed fabric geometrically using KTEX software. The laminated fabrics were then subjected to axial stress with opposing forces. The laminated fabric is assumed to be linear and elastic in FEA. The simulation outputs were compared with real test results and their graphs. The geometrical construction of laminated fabrics is crucial to obtain beneficial results. The tensile strength results of the simulations agree well with the actual values, although the strain–stress graphs may differ in several zones. The consistency between the actual test results and simulation may provide a model for surface deformation for further studies.
Textile materials are used as covers for the inner parts of automobiles, and there is no space between the covered parts and laminated fabrics. Weaving, knitting, nonwoven, and braiding are the production techniques used to produce cover, carpet, strap, and airbag fabrics with functional and aesthetic properties, for which some characteristics related to comfort have been researched recently. 1 The laminated fabric is a three-dimensionally structured and composite textile material.
The physical performance, chemical properties, strength, and constructional properties of the textile materials were mentioned and identified in the original equipment manufacturer’s (OEM’s) specifications. Issued specifications are determined by end users’ behaviors and safety regulations. Undoubtedly, the priority of these requirements is safety, textile material strength, and abrasion. The fabric should have a specific strength of breaking to obtain properties in the manufacturing, assembly process, and usage period to avoid any damages due to tension and compression in multiple directions during the lifecycle. The behaviors of laminated fabric can be predicted and evaluated by simulations during the fabric design period and the research and development phases, and the optimum quality can be achieved for the first time.
The fabric was adhered to by a flame during the lamination process with foam and a scrim. The laminated fabric consisted of three layers: the face fabric, foam, and scrim. The foam and scrim improve the tensile and tear strength, abrasion, and comfort characteristics, as well as aesthetic appearance.
In the automotive industry, finite element analysis (FEA) is used to simulate components as virtual tests. The simulation steps included geometrical modeling to construct virtual materials and transferring them to FEA via interface software for stress–strain analysis. The geometrical modeling software packages TexGen, WiseTex, Solidwork, TechTex, and RUC were used for the fabrics, and the mechanical behavior was studied using FEA software packages Abaqus, LS-Dyna, and ANSYS. Long et al. 2 studied the geometric modeling of fabric using TexGen, and structural compaction was applied in FEA. Lin et al. 3 studied the compression behavior of fabric that modeled nonlinear and linear elasticity as an orthotropic material in Abaqus software.
The fabric material is classified as nonlinear and anisotropic. Constructional parameters and their variables are determined for geometrical modeling, which affects the mechanical properties. The prediction of mechanical behavior using empirical equations is complicated. Hearle et al. 4 emphasized that the complexity of the mechanical modeling of fabric with mathematical equations, expressions, and three-dimensional (3D) modeling can eliminate the complexity. This study aims to simulate the tensile strength of laminated fabrics under axial loads by FEA and to enlighten those studies on multiaxial loads and the abrasion behavior of fabrics. The objective of the FEA is to determine the optimum material properties, so fewer trials lead to savings in the cost of the raw material and the production costs and time. The possible deformation caused by the end user's behaviors and the guaranteed lifecycle completion of fabric as the part of the vehicle can be predicted. It is possible to observe the compliance of woven fabrics with new and different yarns to customer specifications. Consequently, computer-aided engineering and design are required for new product development. 5 Shen et al. 5 simulated the tensile strength of woven fabrics constructed using polyester monofilaments yarn using FEA. Three-dimensional geometrical modeling was performed based on Pierce’s geometry in the software. FEA analysis was performed on the material properties, and a good agreement was obtained between the experimental results and simulation. The fabric geometry was measured using a microscope and its software, for example, the space between adjacent yarns, etc. This paper uses a method with a microscope for the measurement of the yarn properties in terms of form and filament properties in the yarn form, and fabric construction parameters were calculated with the related equations.
The fabric construction parameters were identified as the density of the warp and weft, yarn diameter, crimp, length, and space between yarns in the geometric models by Pierce 19376, Kemp 195810, and Hearle 197810 for plain fabrics Non-plain fabrics with floating and geometric modeling were studied and improved in a narrow scope by considering Kemp’s race-track model. All previous studies used current geometric modeling software, but some empirical equations of the parameters may be different. Complex two-dimensional (2D) and 3D woven models, such as satin and twill, can be generated with software. Gao and Wang 7 used the finite element method to predict the tensile behavior of nonwoven fabrics based on classical lamination theory. Chen et al. 8 compared the experimental and analytical results of the central slit tear test, where the material was laminated fabric, which had four layers and was adhered to polyurethane (PU) foam.
The deformation of a fabric can be expressed as the displacement of yarns and shape changes of yarns in fabric constructions with external and internal forces. The yarn–crimp interchange should also be considered. 9 Fabric in the maximum stress where the yarns shift and break is the condition of tension deformation. Tensile strength mainly occurs under uniaxial loading, which causes fabric extension, and provides a comparison of the mechanical behaviors of different textile materials. The fabric load–extension curve is split into three sections during the tensile strength graph: the initial region shows the fiber and yarn friction resistance to deformation; the decrimping section has a slight flattening of curves; and the final region shows fiber and yarn extensions and breaks. 10 The Young’s modulus is calculated in the initial region and indicates that the fabric is stiff at a high modulus and soft at a low modulus. 11
Some textile fabric deformations have been studied by researchers using FEA. This work contains some novelties because the textile material is an automotive seat cover fabric laminated via a flame for binding the foam to the fabric and scrim; on the other hand, yarns with two different textures with multifilaments were investigated. In addition, KTEX software has a fabric modeling method via yarns and filaments.
The purpose of this study is the geometric modeling of the face fabric using KTEX software with inputs that are the features of the physical, mechanical, and frictional properties of yarn. Tensile strength tests were performed experimentally in the laboratory, and the simulation was performed using Radioss FEA solver software. This may be the first study of KTEX and Radioss solver applications in the literature. The results of the tests and their graphs were compared. The consistency between the virtual and experimental results could enable the prediction of the mechanical behaviors of fabrics without experimental tests. It provides minimal production and design trials to develop the requested design in the short term.
Experimental details
In this study, the yarn parameters were calculated based on the tensile strength test data, and a geometrical model was obtained using KTEX interface software. Tensile tests of the fabrics were performed experimentally and virtually using FEA. The results of the experimental and simulation studies are compared.
Yarn and filament materials
In the automotive industry, polyester filaments originating from yarn are commonly used as raw materials owing to their processability, abrasion and strength, cleanability to soiling, flammability, colorfastness, fading durability, elongation, and crease behaviors. In addition, they also have low water absorbency, which helps laminating, making polyester ideal for car seat covers. 12 The filaments were continuous, and partially oriented yarns (POYs) were supplied by ANTEX/Spain. Friction and air texture methods were used in the yarn production of Marturfompak International/Turkey to draw to fully oriented yarn.
Two types of yarn were used: 55 tex friction-textured, octolobal cross-sectioned and 110 tex air-texturized, round cross-sectioned yarns, as shown in Figure 1.
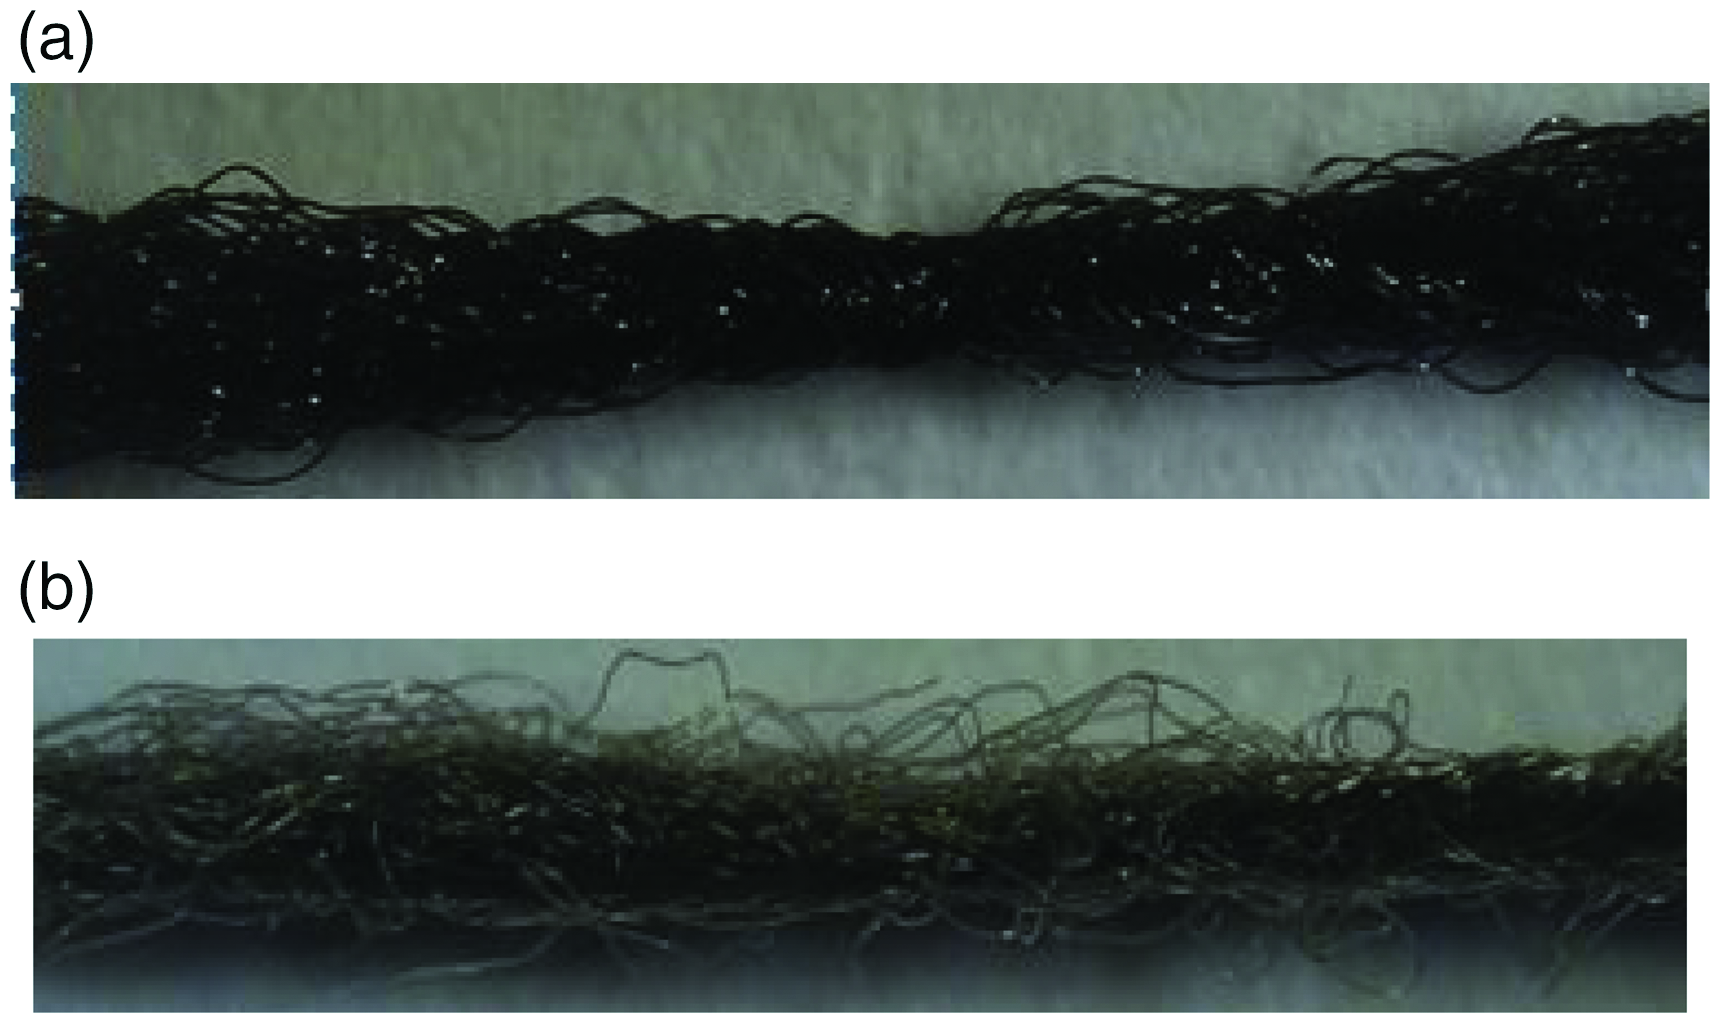
The yarn types: (a) friction texture and (b) air texture.
The geometric modeling inputs were obtained from the yarn and filament parameters. The model convergence to the real one is found at the rate of accuracy of the input parameters.
13
The filament and yarn area and perimeter were measured via image processing using a MOTIC BA-310 MET-T TRIOLCULAR microscope. Figure 2 shows a microscopic image of the filaments. These data enable us to determine the diameters using calculations by
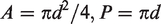
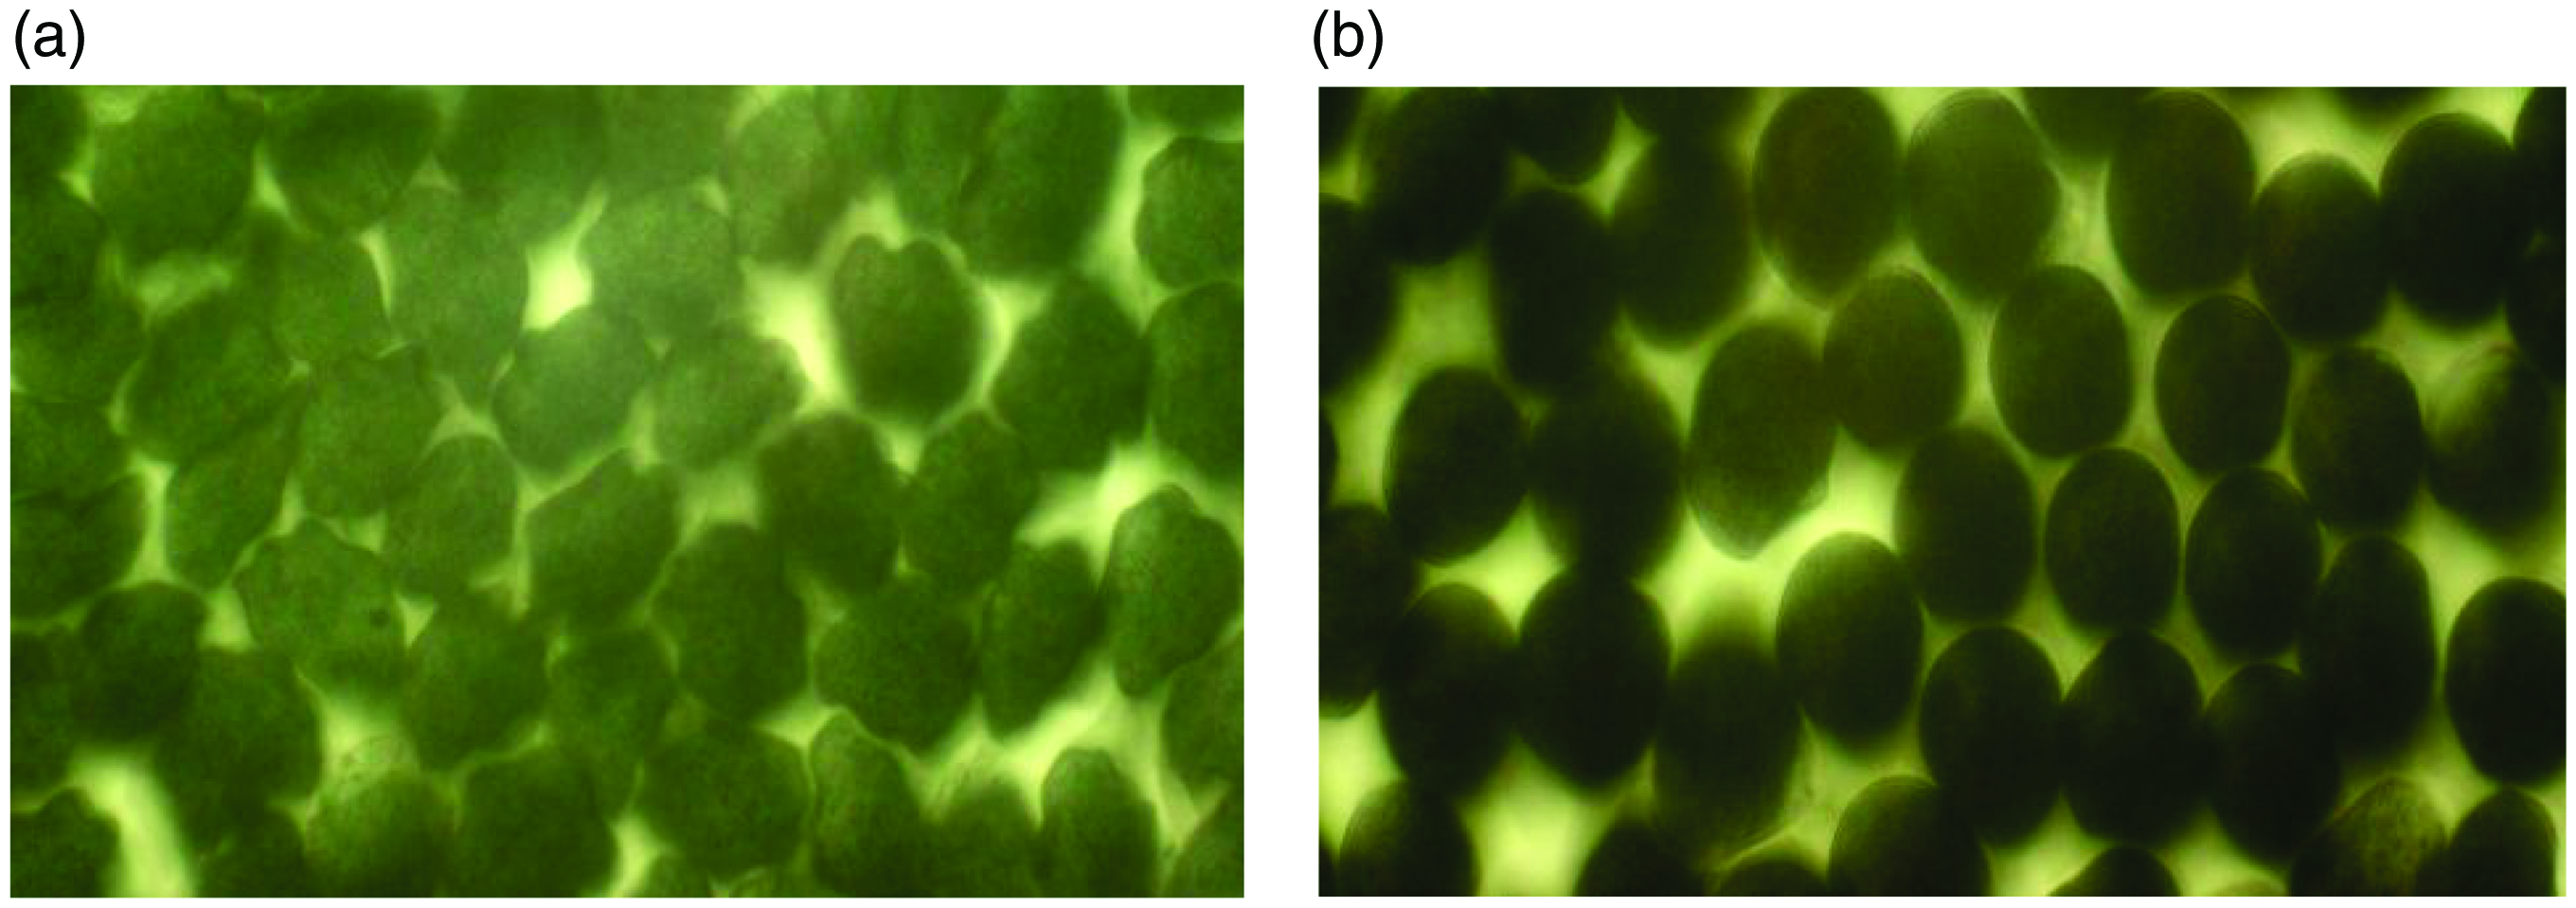
The areas and perimeters measurements of filaments: (a) octolobal cross-section and (b) round shaped filament.
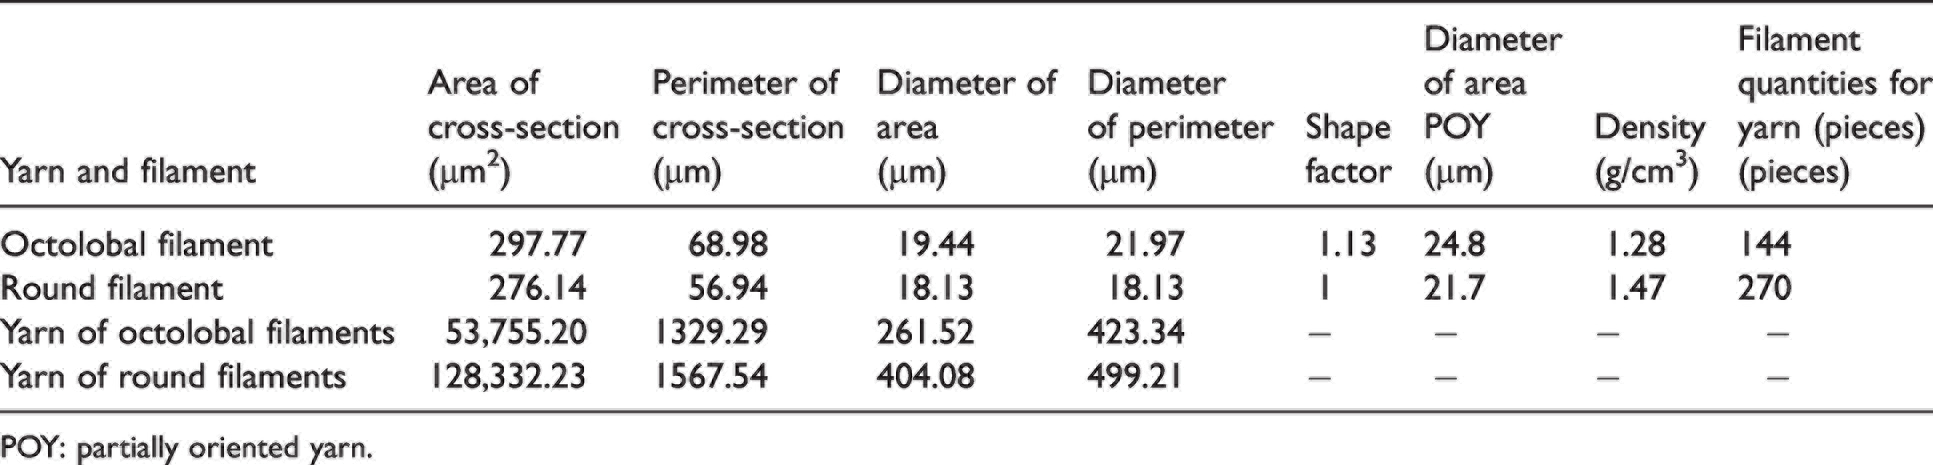
The notations d, A, and P are the diameter, area, and perimeter, respectively, and are indicated in Table 1, with the shape factor (k) determining the circularity deviation degree of the fiber cross-section. 14 In the condition that k = P/(π d) is equal to 1, the cross-section of the yarn or filaments is round. The shape factor provides significant information about the yarn cross-section in fabric construction in the geometric modeling phase. The shape factor is higher than 1 because of the number of filaments that surround the centered filaments, and an elliptical shape is observed.
The area and the perimeters of filaments and yarns and their diameters, filament densities, and quantities
POY: partially oriented yarn.
Table 1 includes the number of filaments and the filament density, which was calculated with

The notations c, A, and ρ are the linear density of yarn, the sum of the total filament area, and the filament density, respectively.
The tensile properties were tested according to DIN EN ISO 2062. The yarns were tested with a gauge length of 500 mm, test speed of 500 mm/min and 0.5 cN/tex pre-load condition. The test equipment is an USTER TENSOKID 1998 Model 2.5 kN, which provides all data for the graph in Figure 3 and enables the calculation of the Young’s modulus E by the following equation

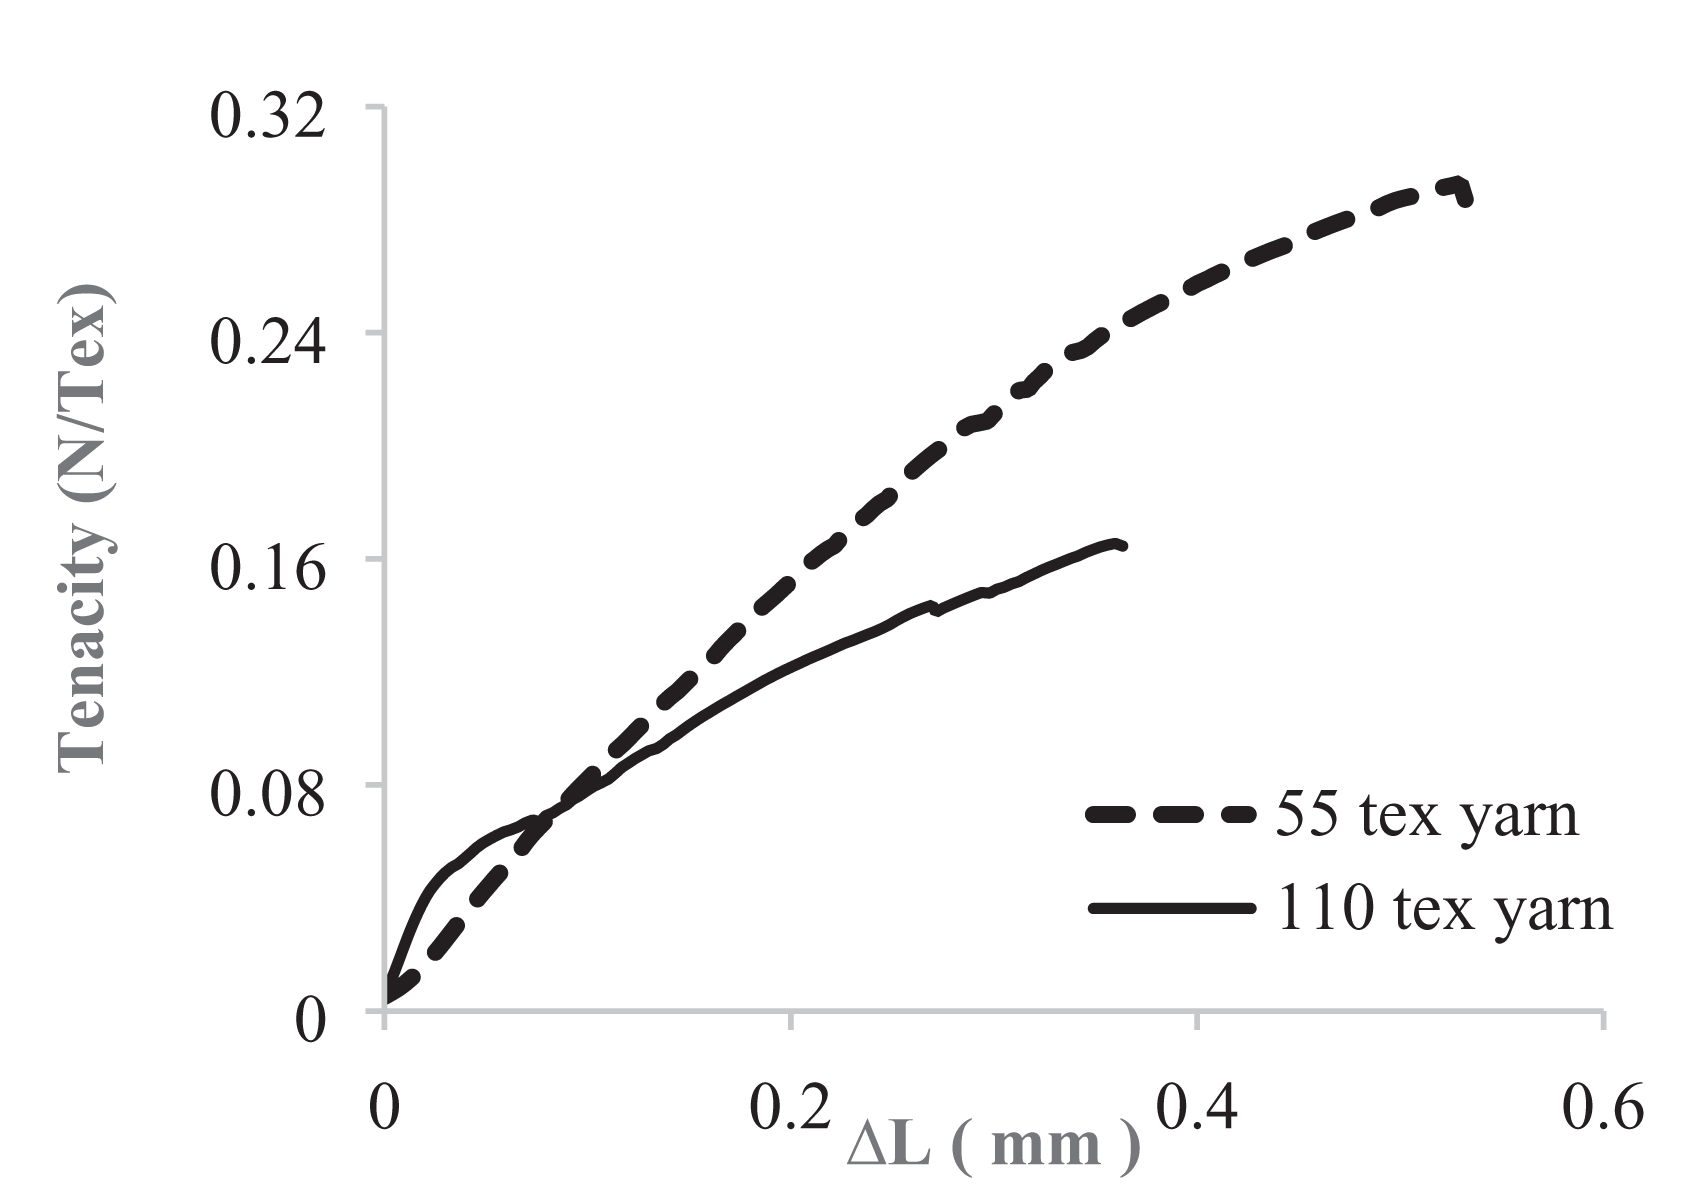
Yarn tenacity–strain test graph. The test specification is DIN EN ISO 2062.
The tenacity–strain curves reflect mechanical behaviors; it is easy to compare the yarns using graphs. The curve shapes in Figures 3 are different in the elastic zone owing to the yarn texturizing methods; however, both are nonlinear.
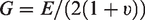
The other mechanical property is the shear modulus, which can be obtained with the equation
15
Poisson’s ratio is a material constant that is determined from experiments, where the lateral strain ε
y
is proportional to the axial strain ε
x
and can be written as
17

It should be predicted between –1 and 1/2. The Poisson’s ratio for continuous materials is below 0.5 and was calculated from the longitudinal strain and transverse strain obtained from the measured diameter. The diameter was measured during the tensile strength test by using a digital micrometer.
18
In this study, the Poisson’s ratio was calculated transversely considering the deviation between POY filament diameter and the filament diameter of the yarn, which was measured with a microscope under stable conditions. The texturizing machine drew the raw material from the partially oriented POY to the yarn as a fully oriented product. The drawing process reduced the filament diameter. The draw ratio applied in the process was 72% for 55 tex friction-textured yarn and 68% for 110 tex air-textured yarn, which were the longitudinal elongation ratios. Consequently, the diameter (on area) difference between the filament of POY and the filament of the yarn, as indicated in Table 1, can be calculated as the proportion of 21.6% for 55 tex and 16.4% for 110 tex. The proportion of elongation between the longitudinal and transverse direction was applied to the longitudinal elongation results of the tensile test to estimate △Ldiameter. The equations is

Yarn mechanical properties

The Young’s modulus is called the elasticity modulus, and provides information about the elastic behavior of a material. The comparison between the yarns of 55 and 110 tex shows that the 110 tex yarn has a more elastic feature that can impact the simulation results in the vicinity of the virtual model, which was established based on the linear and elastic behavior.
The friction coefficient, which is the input for the FEA simulation, is specified by the test according to the ASTM D 3412 standard, which is called the twisted strand method and results in 0.82 for 55 tex friction-textured yarn and 0.83 for 110 tex air-texturized yarn.
Fabric geometry
In general, the definition is fabric constructed of yarns as the warp and weft intersections at 90° and parallel to each other at 180° as the ideal form, except under special conditions. Intersections of unidimensional yarn as the warp and weft transform fabrics to two dimensions and are consequently weaved in numerous patterns. The friction of the filaments establishes the formation of the thread and fabric.
Twill and plain weaves are frequently used as upholstery in vehicles. Plain fabric with air-texturized yarn and twill 2/2 with friction-textured yarn were modeled geometrically. The fabric faces are shown in Figure 4. Zheng et al. 19 worked out plain and various twill patterns for geometric modeling and indicated that the twill weave structure is less uniform than the plain.
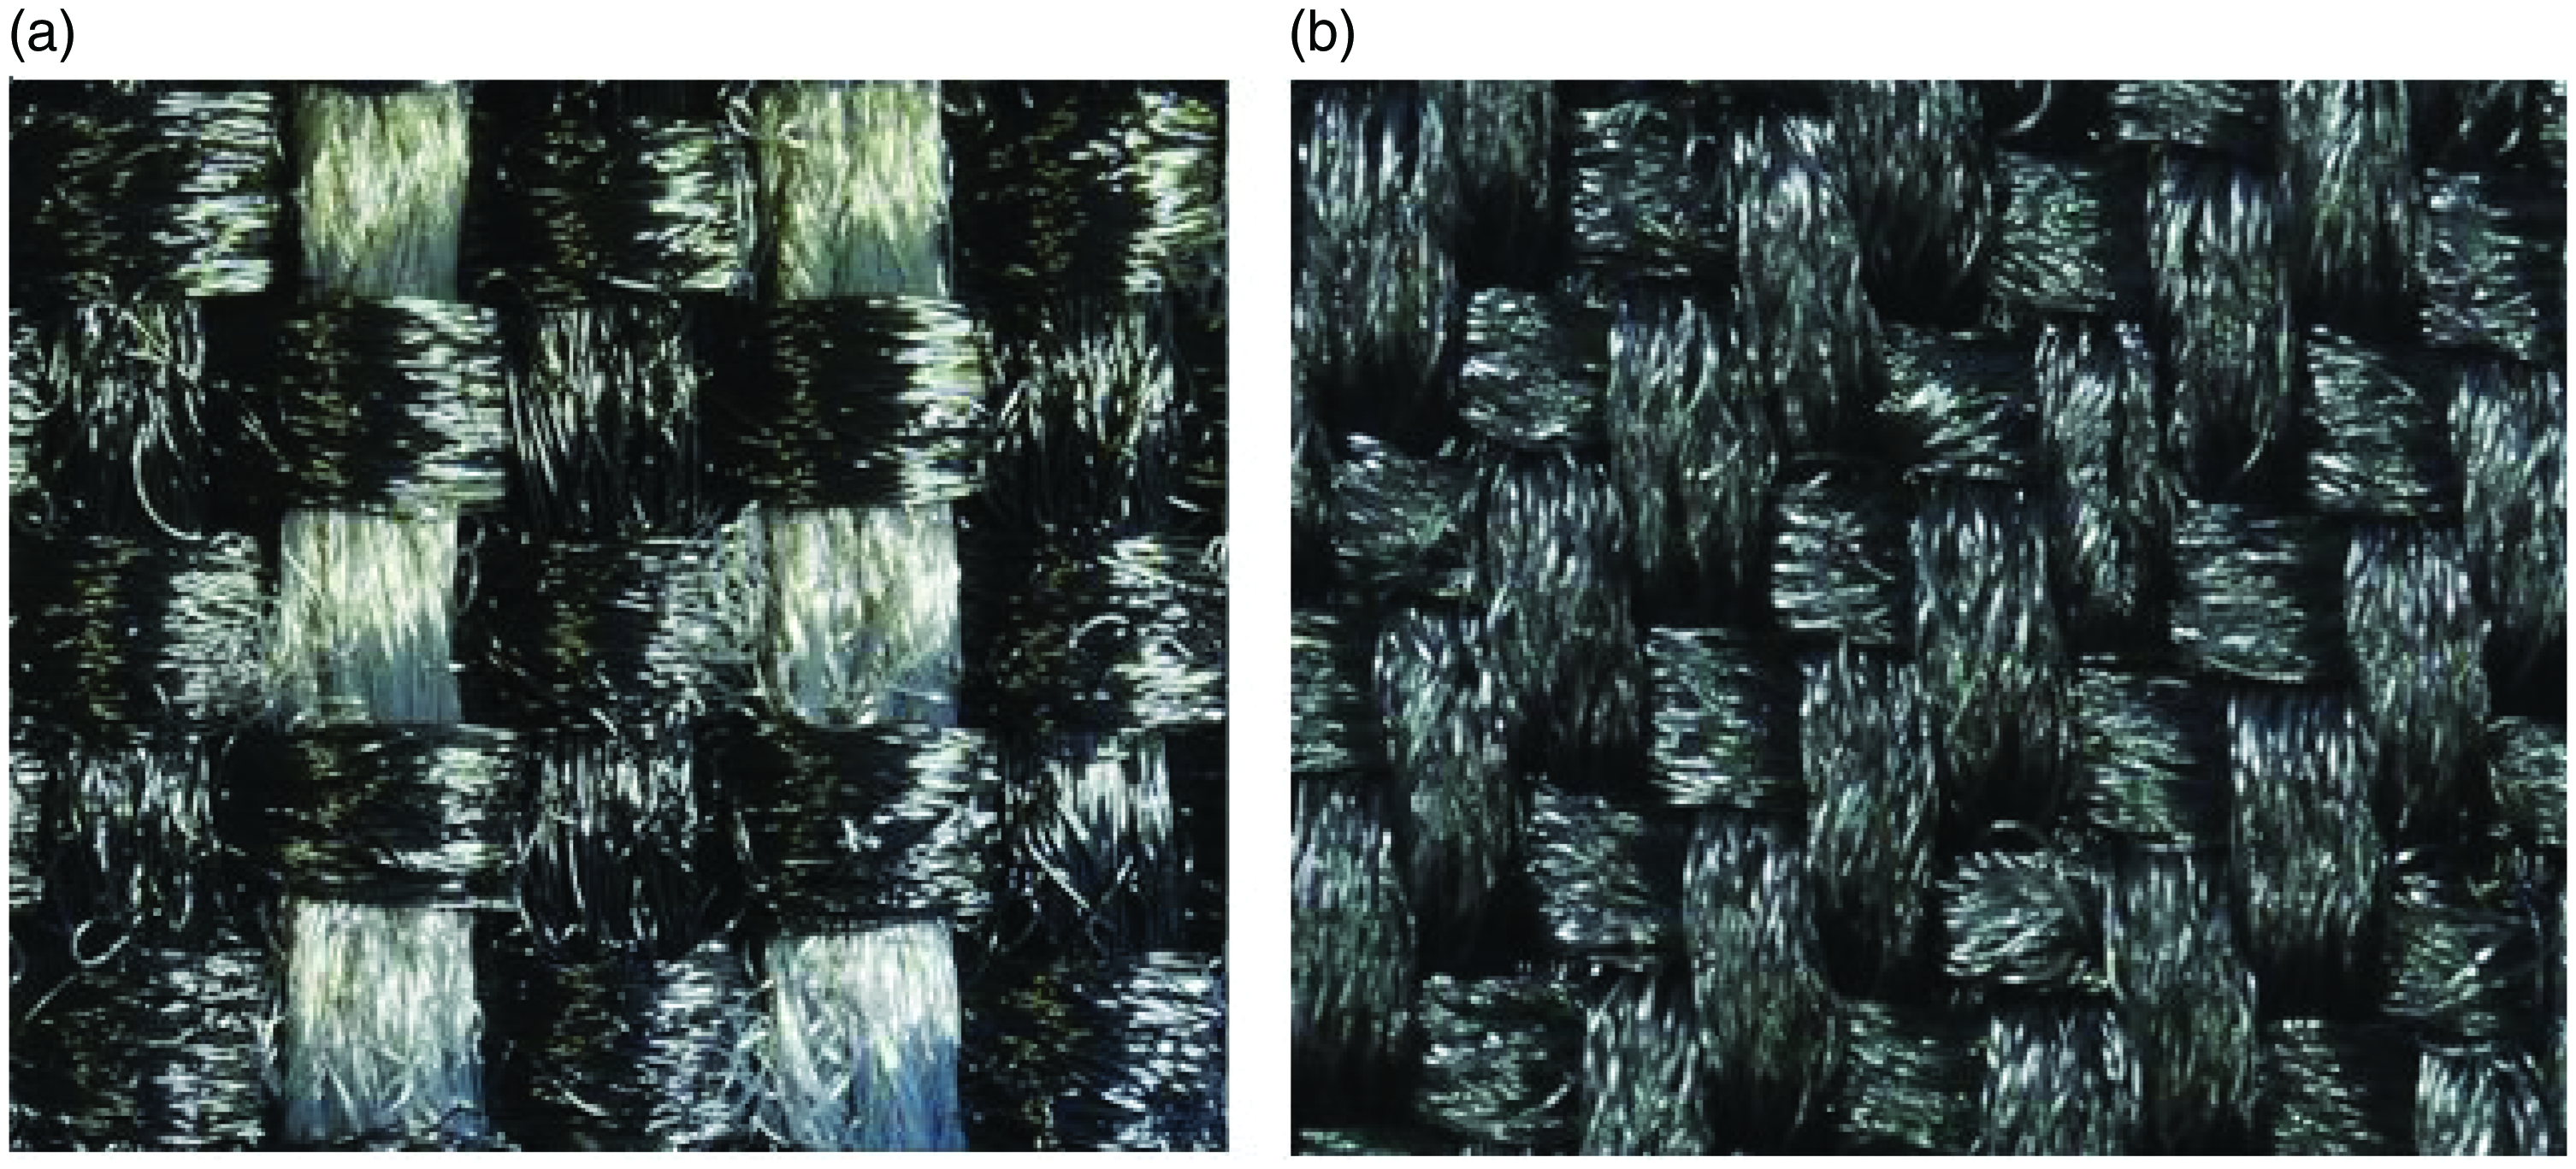
The appearance of the face of fabrics: (a) the plain fabric and (b) the twill 2/2 fabric.
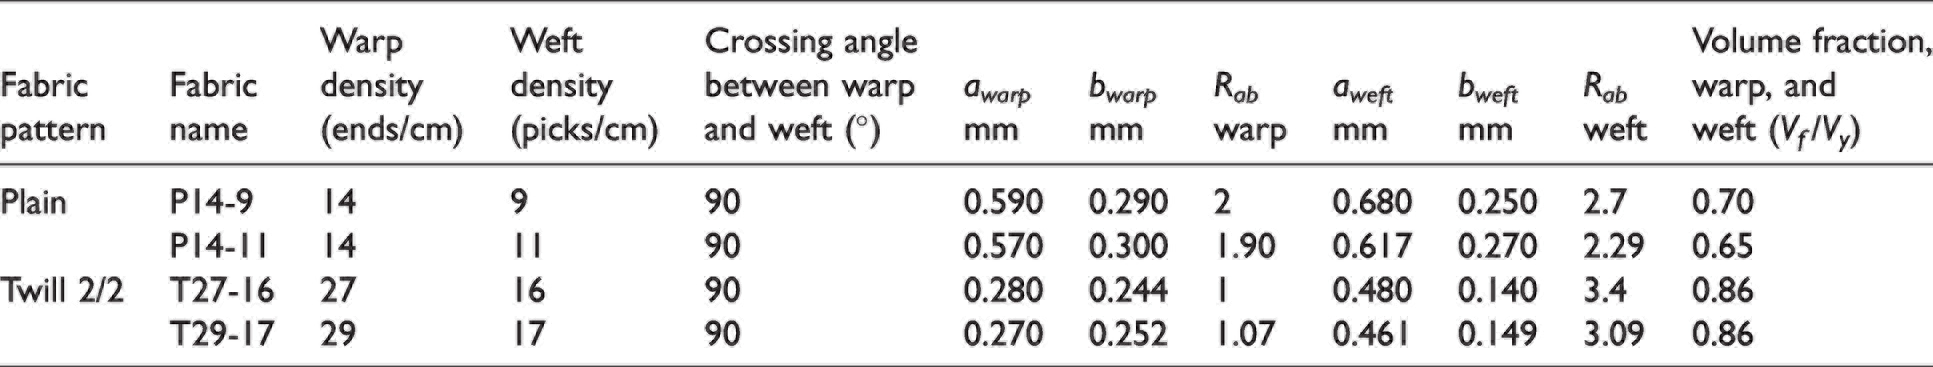
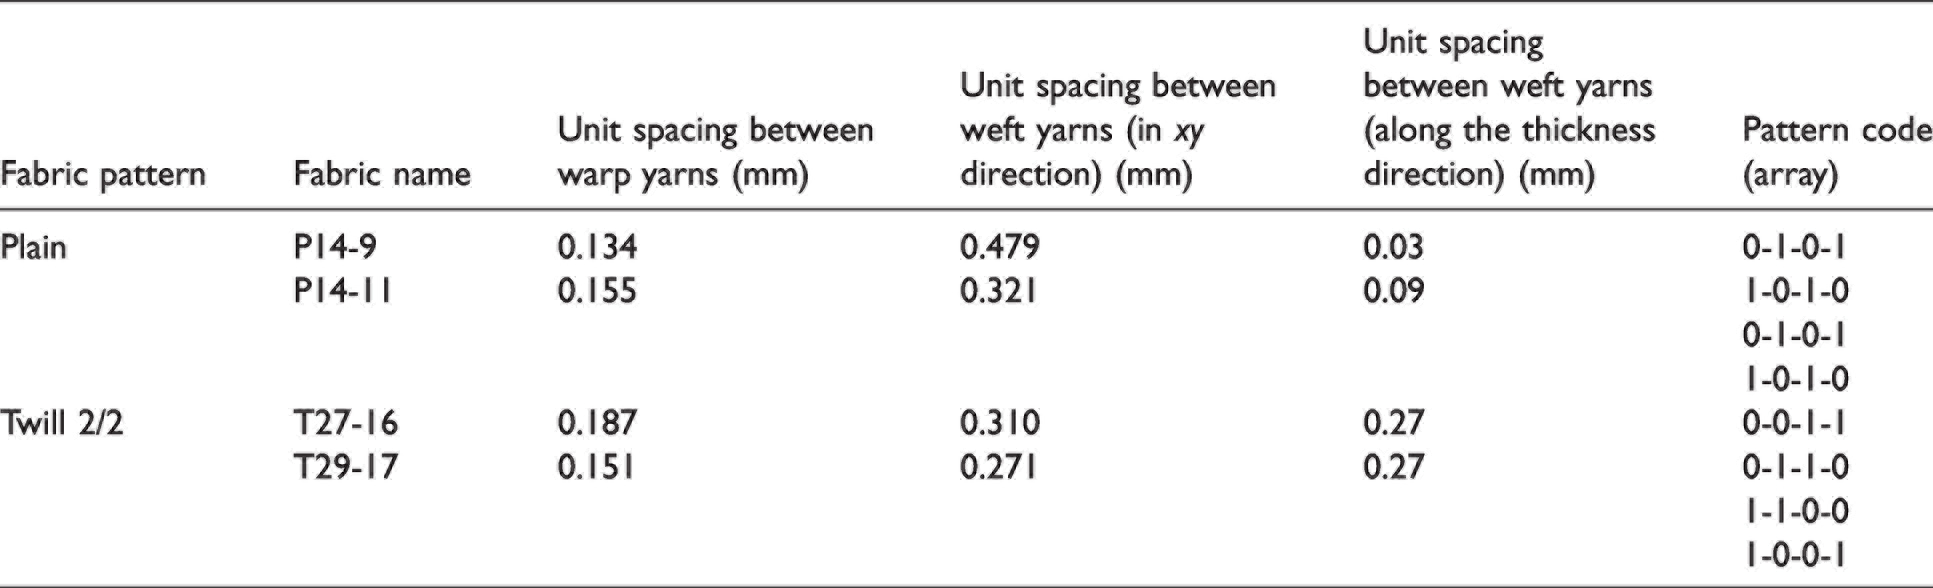
The warp and weft densities of the fabrics, which are the finished materials and their cross-angles, are shown in Table 3. Two different densities of the plain fabric and two different densities of the twill 2/2 fabric were studied.
The minor and major diameters of filaments, flattening ratio, and volume fraction inside fabric construction
The yarn cross-section in fabric construction is elliptical. The diameter was defined with two items as major (indicated with “a”) and minor (indicated with “b”) in the case of elliptical geometry in Figure 5 for both weave patterns.
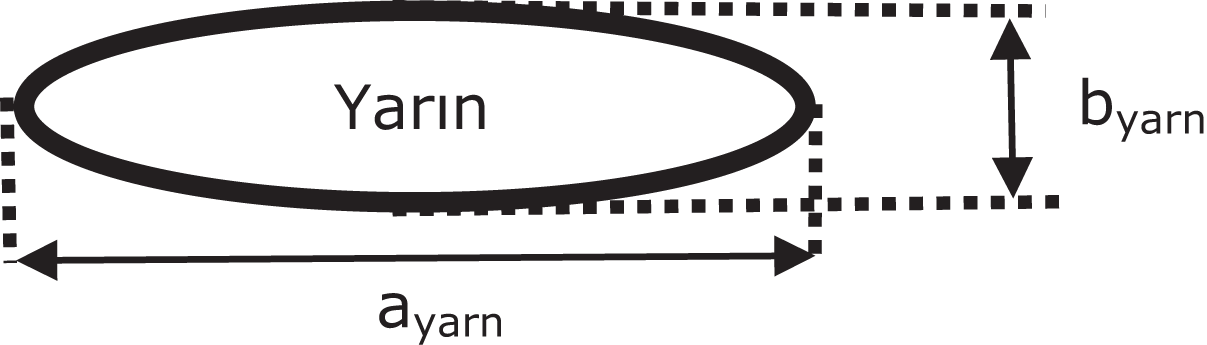
Yarn geometry in fabric construction, with minor and major diameters indicated.
Hence, the elliptical geometry of the yarns results in a flattening ratio that is indicated as Rab and is equal to ayarn/byarn. The subscripts of yarn for “a” and “b” are transformed into the warp and weft, and the calculated volume fractions are presented in Table 4.
The spacing of yarns and pattern codes
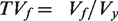
The yarn volume fraction ratio, denoted as TVf, can be calculated by
The yarn quantity in the direction of the warp and weft in 10 mm is referred to as the yarn density and restricts ayarn. The sum of the major diameters of the warp and weft yarns should be equal to 10 mm with the total space among the yarns, which means that the spacing between the yarns depends on the yarn density. KTEX regulates the spacing between two weft yarns, as shown in Figure 6, which should be equal to or higher than the minor diameter of the warp, as shown in the following equation 20
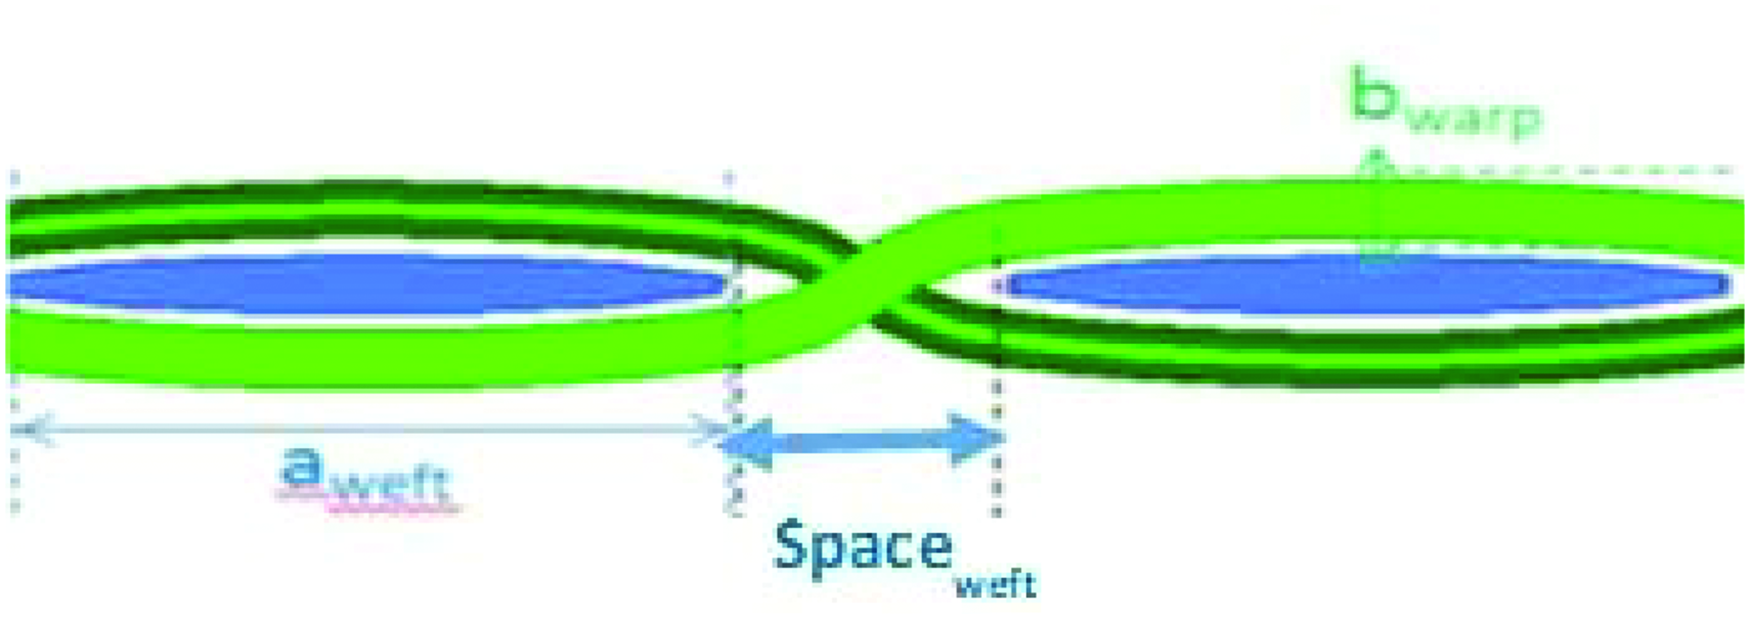
KTEX geometric model of the woven fabric.
Weft density * (aweft + unit spacing between
weft yarns) = 10 mm,
unit spacing of between weft yarns ≥ bwarp
Vertically, the yarn minor diameter is a significant parameter for determining the thickness of the weave, as the dimension is affected by yarn crimps, which are influenced by the volume fraction and density of the warp and weft.
Geometric modeling of weave with yarn
The KTEX software calculates the macroscopic mechanical properties of the woven composite. It has been developed by CEDREM, the graphic interface is coded in Tcl/Tk, and the calculation of the equivalent mechanical properties is coded in the C language. 20 Studying other complex weaves and knits is possible, for example, satin and interlock. The inputs without spacing between the yarns are presented in the previous section. Table 4 contains the spacing of yarns and the pattern code (array) as inputs for KTEX. The interlacement map contains “0,” which indicates warp yarn over weft yarn, and “1,” which indicates the reverse condition.
KTEX assumes two hypotheses, one of which is to consider the yarn cross-sections as elliptical, and the second considers the ratio of minor and major as depending only on the material. 20 The running software generates 12 output files with a graphic interface for processing in the FEA software. Figure 7 shows the weave structures of the plain and twill 2/2.
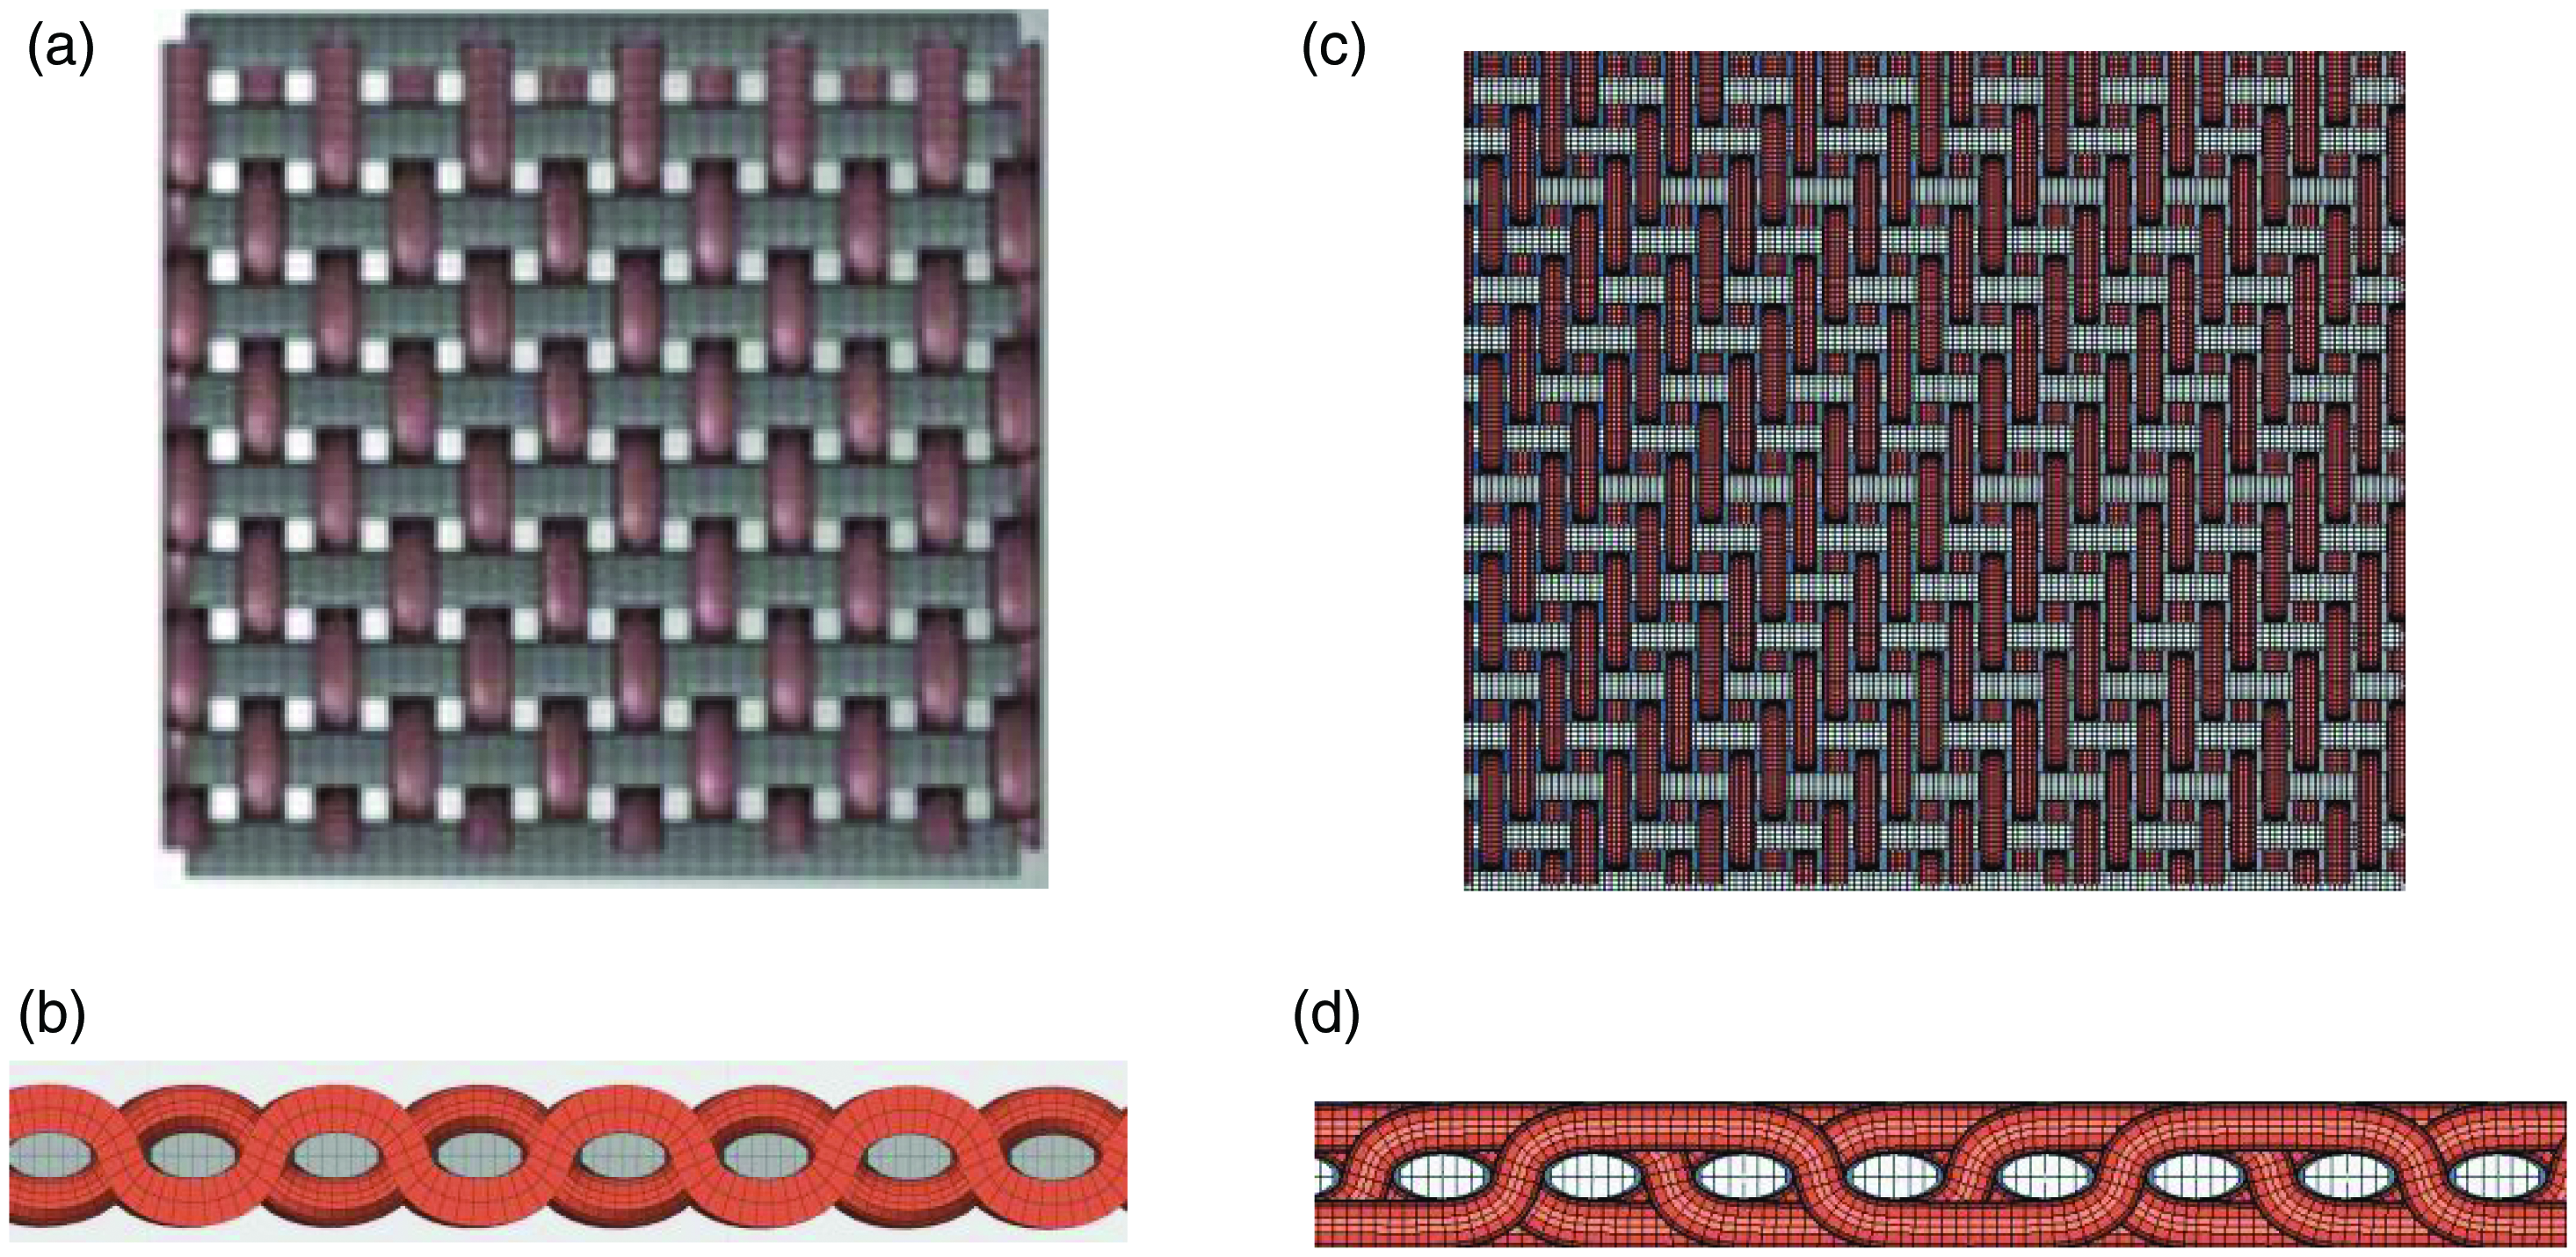
KTEX geometrical models of plain and twill 2/2: (a) plain weave pattern; (b) twill 2/2 weave pattern; (c) cross-section of the thickness direction for the plain weave and (d) cross-section of the thickness direction for the twill 2/2 weave.
With all the input files, the material properties of the two weaves in the form of a unit cell were set at the interface. The solid orthotropic material cards in MAT LAW12 were generated for the solid elements. MAT LAW 12 describes 3D composite materials that are solid as elastic orthotropic before the Tsai–Wu criterion is reached, and then the material becomes nonlinear.
21
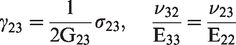
The material cards were composed in the x, y, and z directions of the woven fabric to identify the Poisson’s ratio (ν), shear modulus (G), elasticity modulus (E), and stress (σ) – strain (ε) relations in the elastic phase using the following equations:
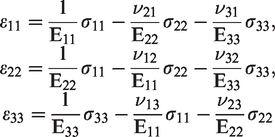
Distortions (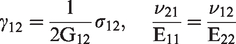
Laminated fabric modeling with subcomponents in finite element analysis
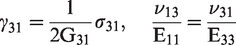
The model frame of the yarn cross-section was chosen as the 3D meshing with eight hexahedral nodes, and the filament material was considered to be linear orthotropic in the material card. The tensile tests for yarn were performed axially in FEA at a constant velocity, and the real and simulation tests of yarn graphics are shown in Figure 8. The elongation rate of the breaking point for yarn was determined as a failure limit for the FEA analysis of laminated fabric.
The force–strain test graphs of real and finite element analysis (FEA) results: (a) 55 tex, friction-texturized yarn for the twill 2/2 pattern and (b) 110 tex air-texturized yarn for the plain fabric.
The FEA model of the woven fabric is the output of KTEX in the form of a unit cell and was enlarged in Altair Hypermesh software to construct the real sample size, which was subjected to axial forces in a tensile test.
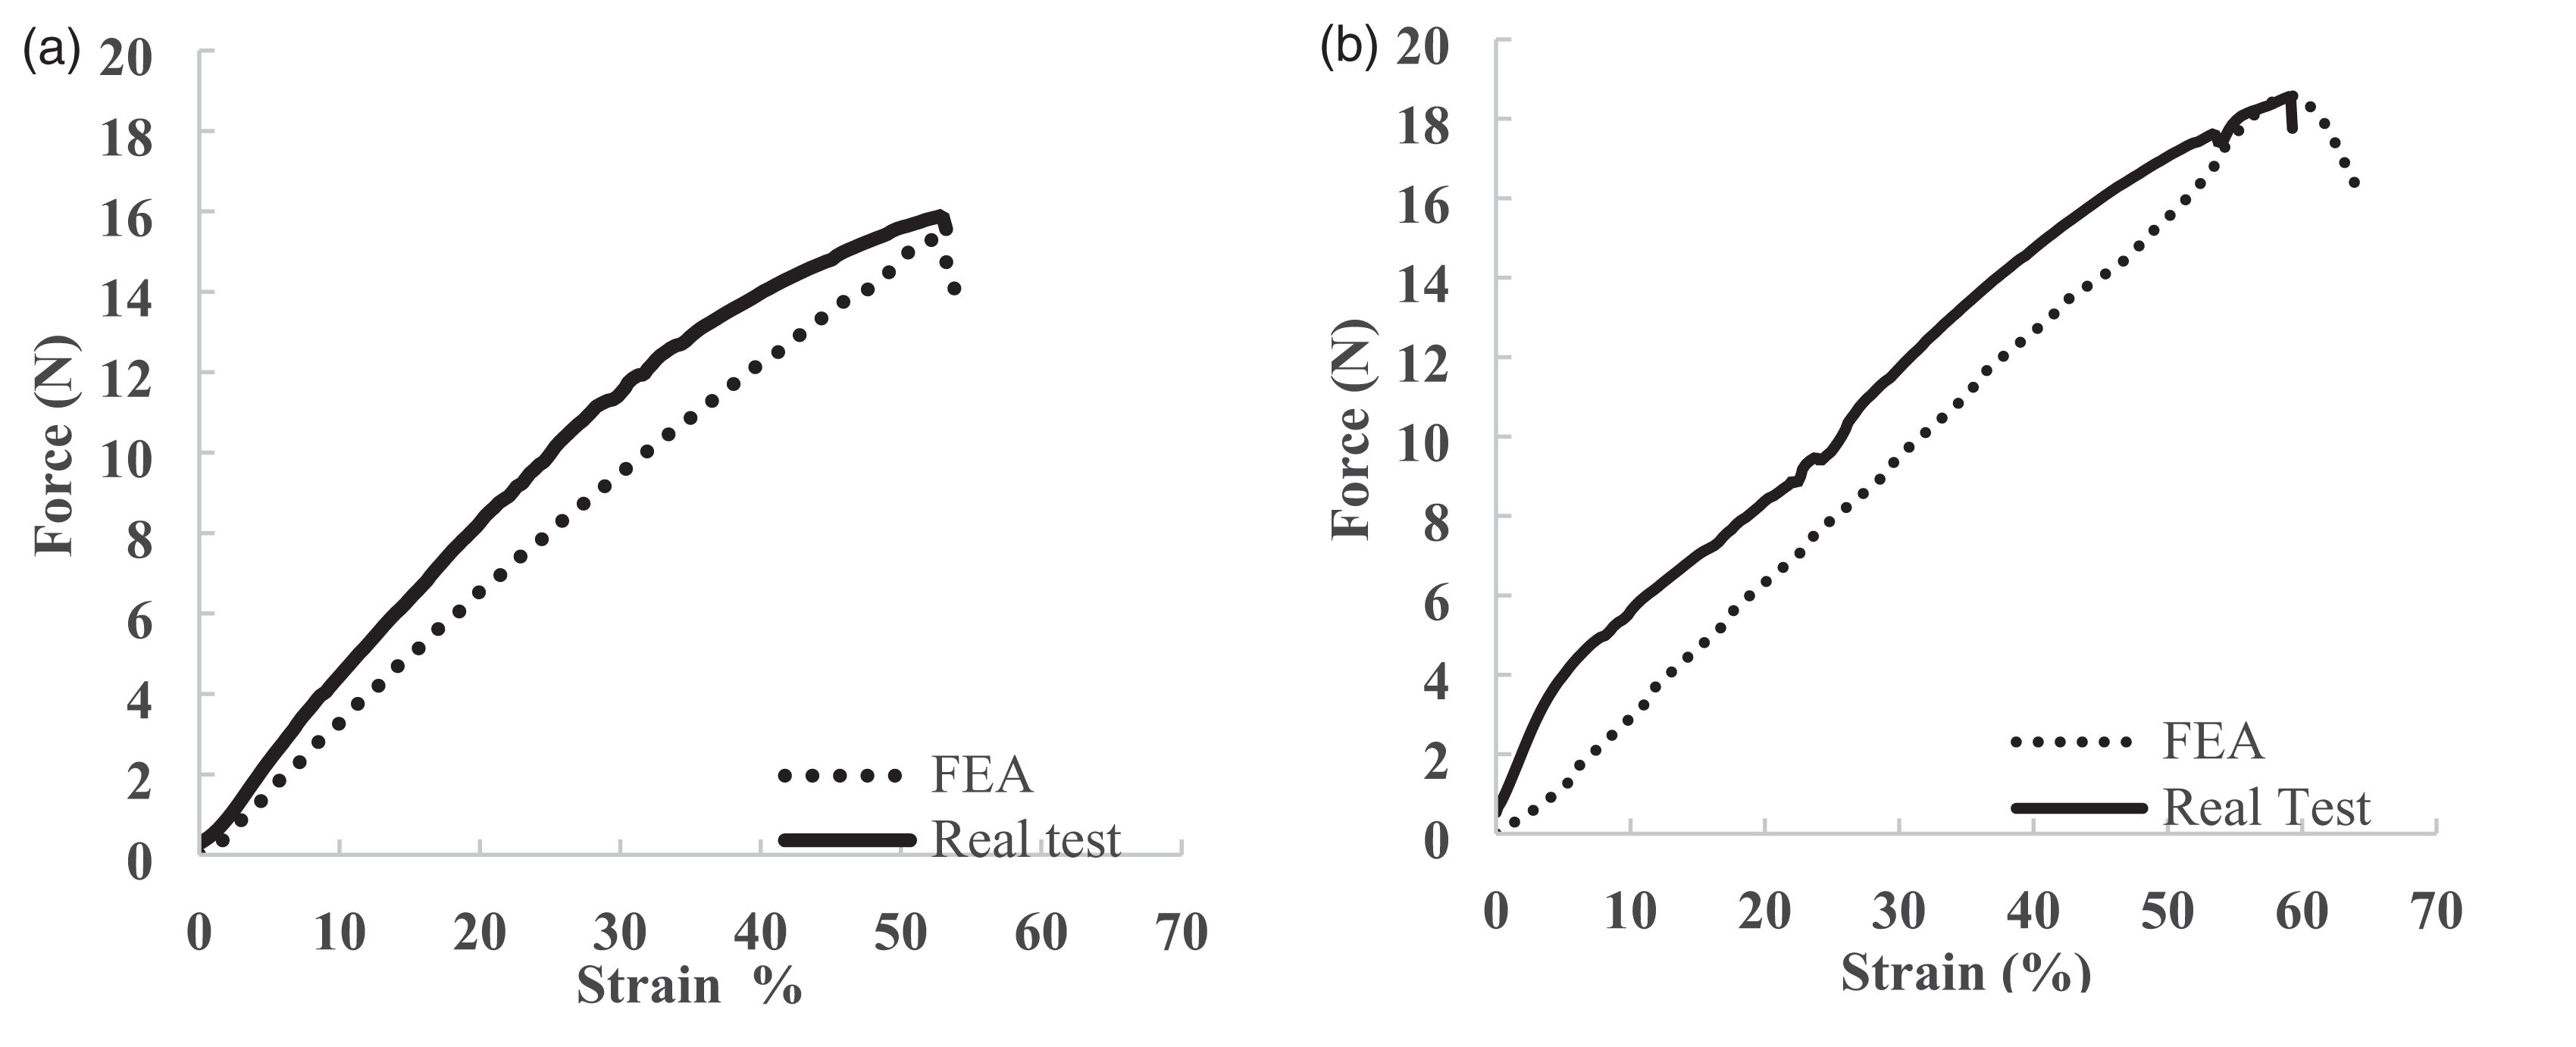
The woven fabric is the top layer of the laminated fabric with a flame so as to adhere to PU foam, which is called the middle layer, and the polyamide (PA) circular knitted scrim, which is the bottom layer that adheres to the foam to build composite material in real and FEA models, as shown in Figure 9. The woven fabric and foam were modeled in 3D form with eight hexahedral nodes of solid elements, and a tied contact was established between the fabric and foam. The scrim FEA model was formed of 2D shell elements and the adhesion model was applied as bonded to the foam. The FEA entities the elements are 1.476.163 for fabric, 319.500 for foam, and 53.250 for scrim.
The real and finite element analysis (FEA) model of the laminated plain weave with foam and scrim: (a) the real laminated fabric cross-section; (b) FEA model of laminated fabric and (c) the real laminated fabric third layer (scrim).
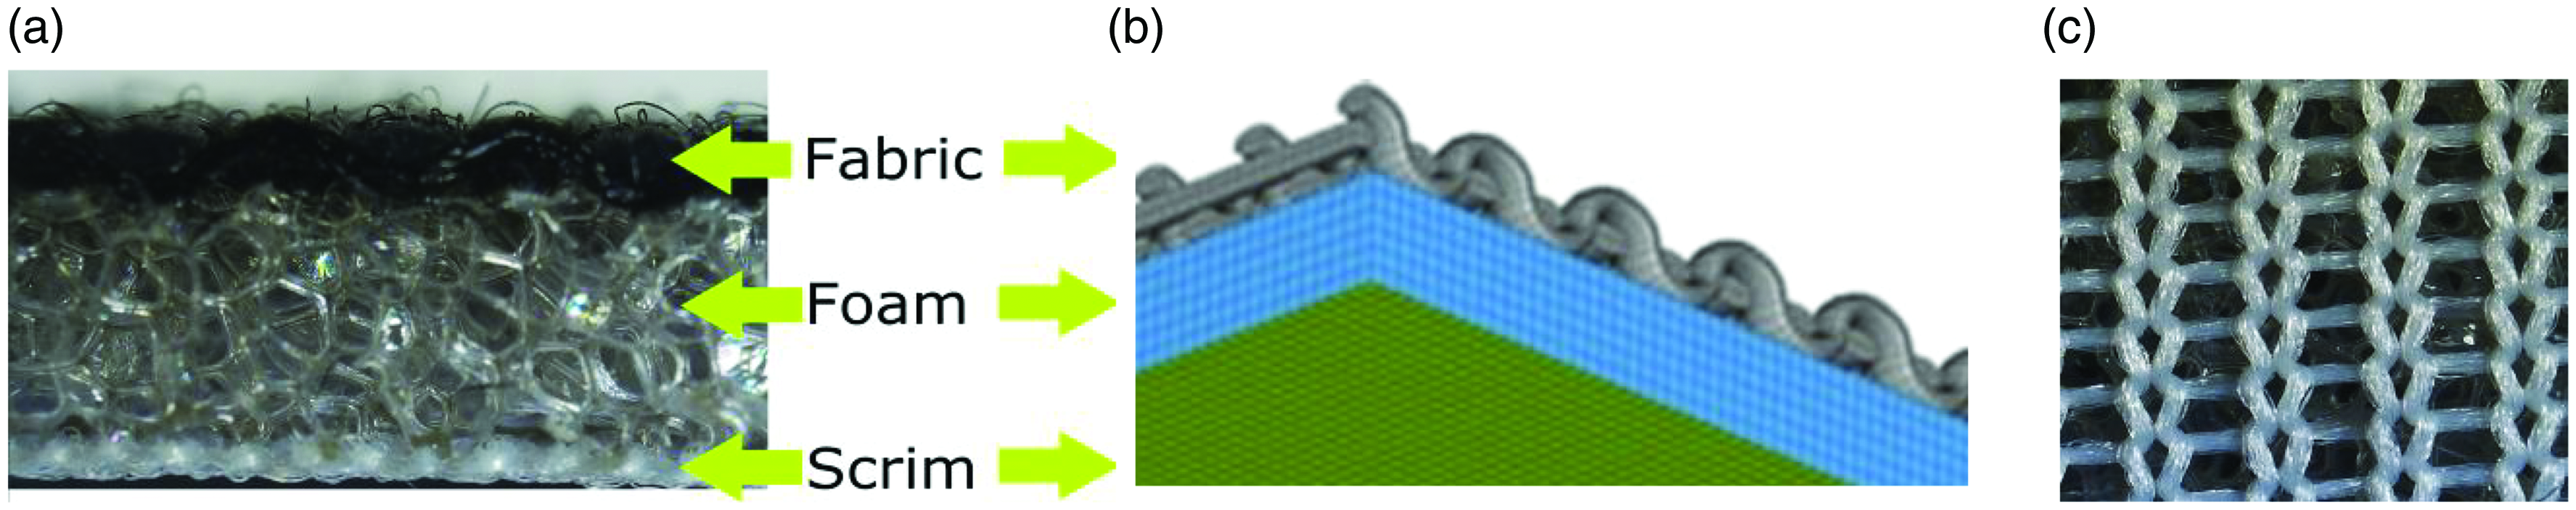
Scrim and foam support the face fabrics to improve the mechanical properties and provide dimensional stability. The scrim and foam were individually tested with the tensile strength standard TSL 2105G-4.1.1-Method A, and the statistical averages of the stress–strain data, which were repeated 10 times, are shown in Figures 10(a) and (b), respectively, and were uploaded for FEA to represent the mechanical properties, as shown in Table 5. The axial forces in the test were applied to the scrim and foam lengthwise in the same direction as the warp of the laminated fabric. The maximum stress value of the breaks was mentioned as the limit of break and identified separately in the failure cards of the subcomponents. The foam and scrim material cards were identified in the Altair Radioss MAT/LAW1 ELAST as linearly elastic in the FEA. The elastic material property was also selected from the failure card. The assumption of linear behavior established for the scrim and foam is influenced by the laminated fabric mechanical behavior in the real test graph, which was observed to be similar to linear.
The stress–strain graph of the real (a) scrim and (b) foam.
The mechanical properties of the scrim and foam

The friction coefficient between the warp and weft at the crossover and adjacent points was the input for the FEA model to bring in the tendency of yarns interlacing. The friction between filaments and yarns is one of the issues that has a significant effect on the tensile deformation of the fabric. In the FEA model, the Altair Radioss INTER/TYPE7 multi-usage impact interface was identified for the contact type between the warp and weft elements, and it modeled the contact between a master surface and a group of slave nodes, and contained Coloumb static friction laws. 22 The spacing for the contact rule among the yarns was 0.004 mm. Under these conditions, while the distance of spacing between slave nodes and the master surface by considering the penalty formulation is lower than 0.004 mm, the stiffness spring will be activated automatically. The INTER/TYPE 7 was run symmetrically to avoid contact penetration.
Tensile strength analysis in finite element analysis
The properties of laminated fabric as a textile material are anisotropic and nonlinear, which means they are deformable under low stress. The non-homogenous feature brings complexity to the modeling and simulation. In the FEA analysis, the laminated fabric was modeled as elastic, linear, and orthotropic.
The FEA model of the laminated fabric was symmetric in proportion to one quarter in the virtual test, the FEA test sample size was 75 mm × 25 mm, and the symmetry boundary conditions were applied in the x and y directions to construct the test sample (size 150 mm × 50 mm), as shown in Figure 11.
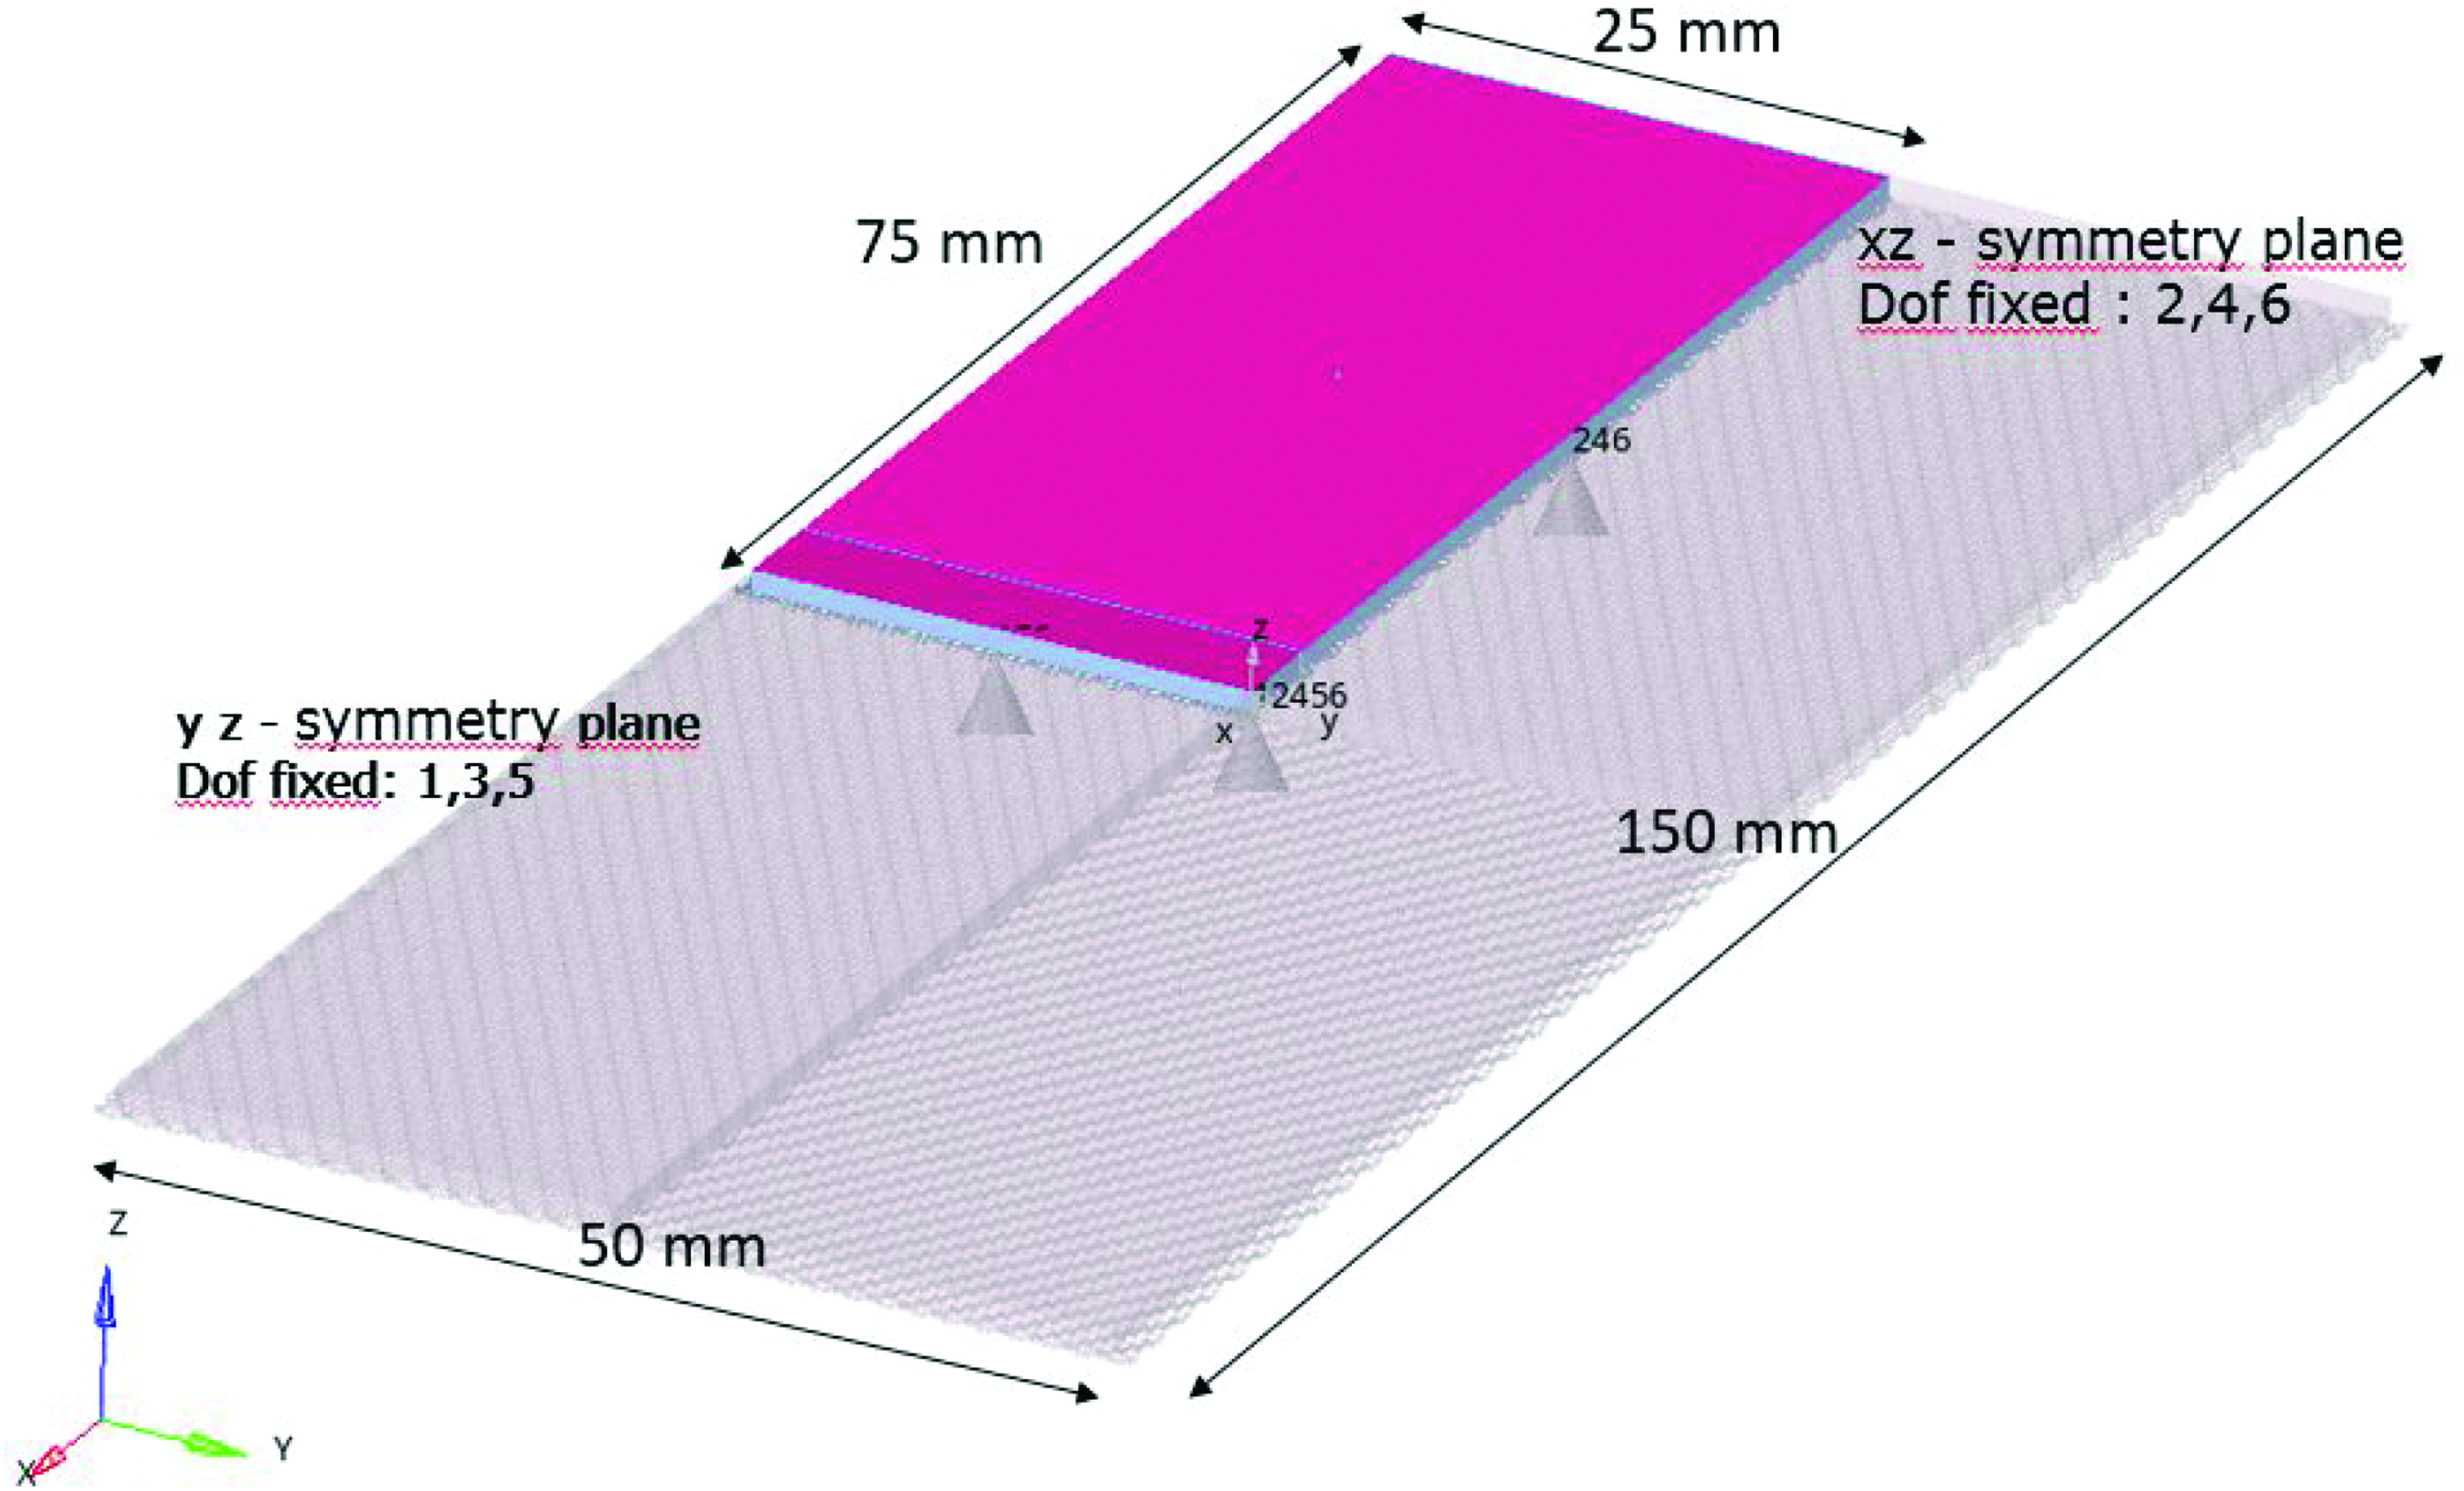
Finite element analysis sample size and the symmetry boundary conditions.
The tensile strength test was TSL 2105G-4.1.1-Method A, which includes 1.96 N pre-stress, 200 mm/min crosshead speed applied to a 50 mm × 200 mm sample in the axial direction, and gauge length of 150 mm. The actual test was performed using ZWICK/ROELL Z005, 2007 Model 5 kN test equipment, in which the numerical data of the breaking force were quantified and the force–elongation curves were obtained. The test method was defined in FEA and applied to the real test conditions, except for the test velocity, which was 120 mm/min instead of 200 mm/min to provide a short-term test because the axial load analysis is quasi-static in FEA, which is why the test velocity was increased.
The fabric is subjected to tensions in all stages of production. The tensions lead to the yarns being arranged evenly in the weave structure and compacted to gain the formation of the fabric. Virtual studies require a compaction step to be more realistic in the warp and weft directions, as well as the thickness. In this study, compaction was initiated simultaneously with the FEA test.
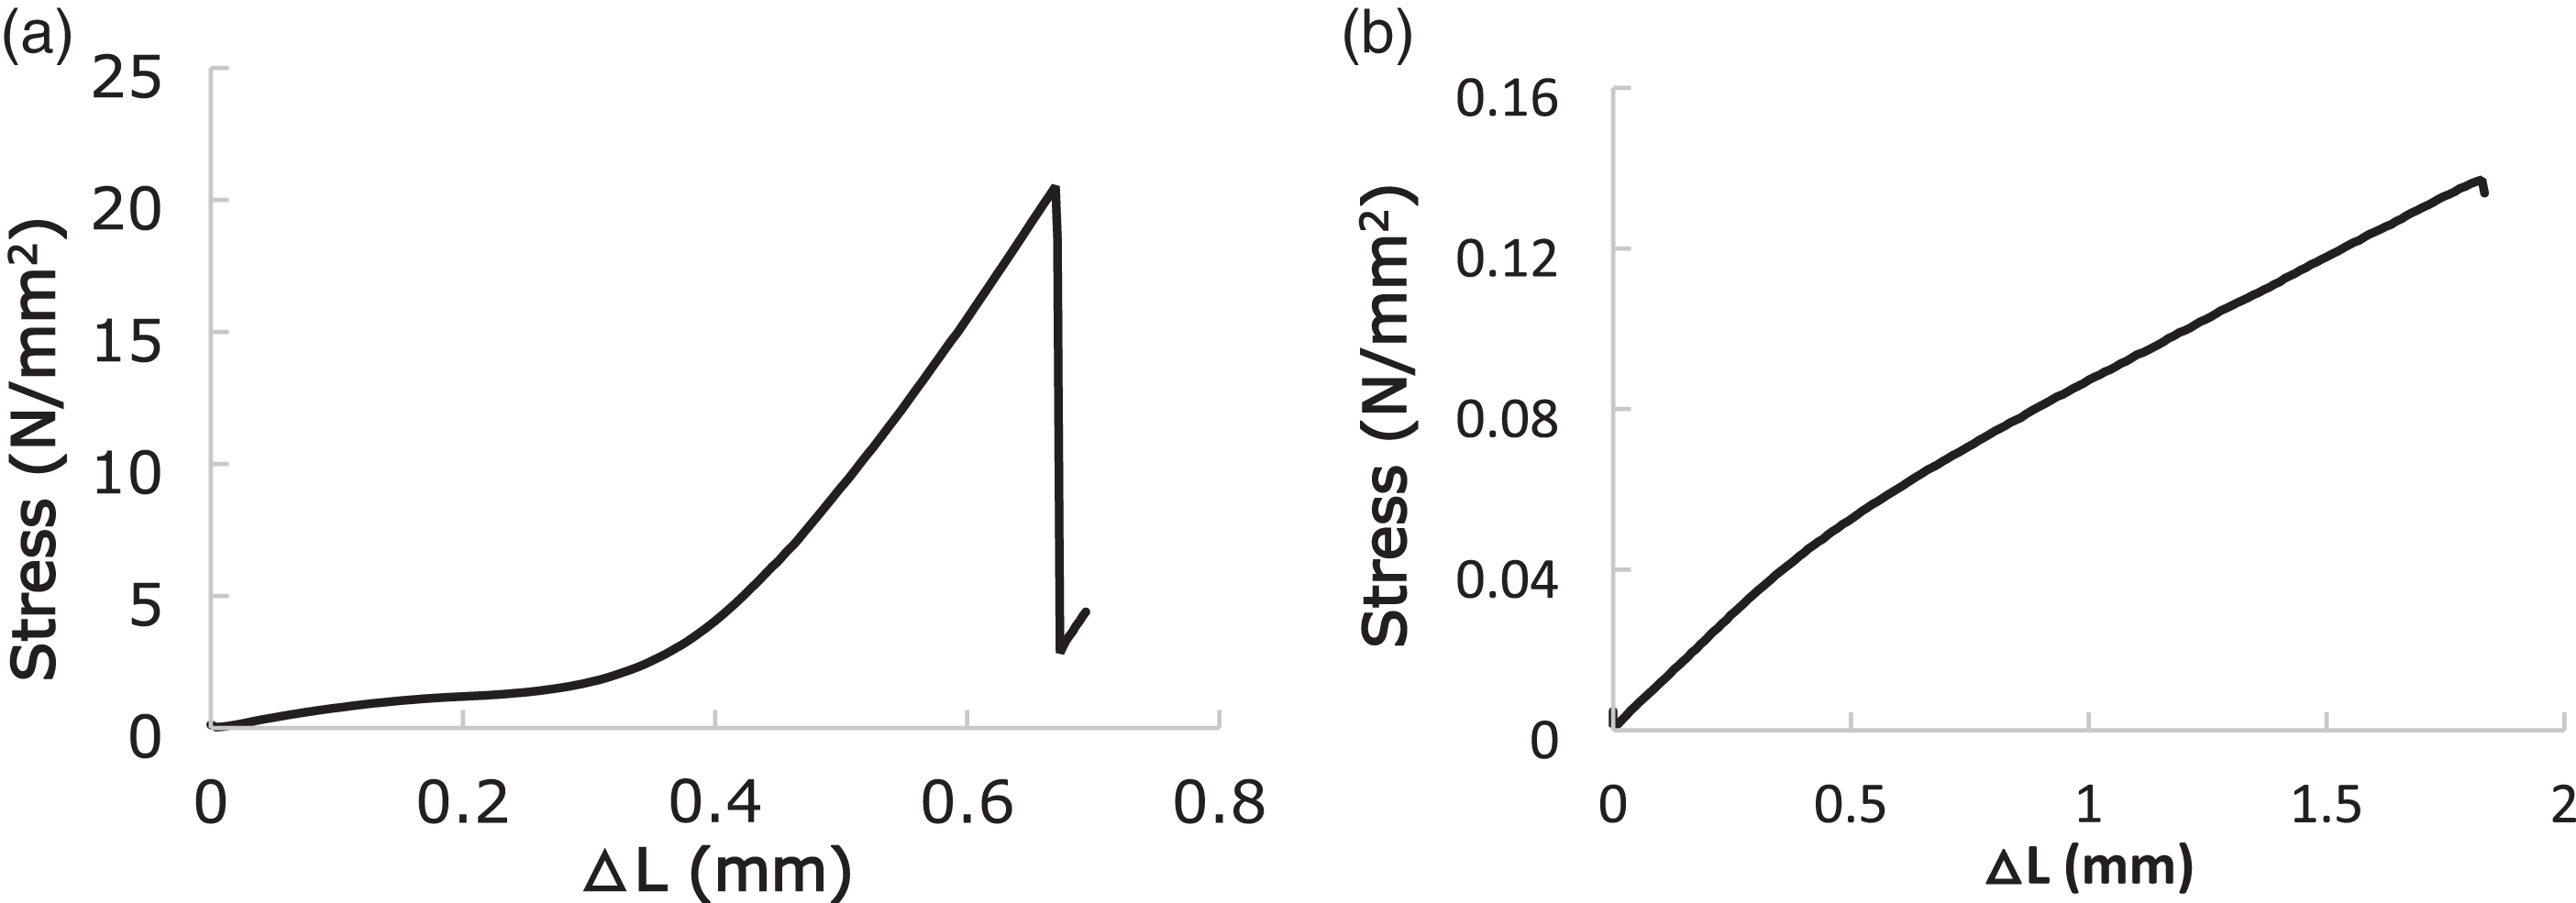
The results of the actual and virtual tests are compared in Figure 12. The curves of the FEA model were nearly parallel to the curves of the real test data, although the initial curves were incompatible, and the virtual curves exhibited some fluctuations.
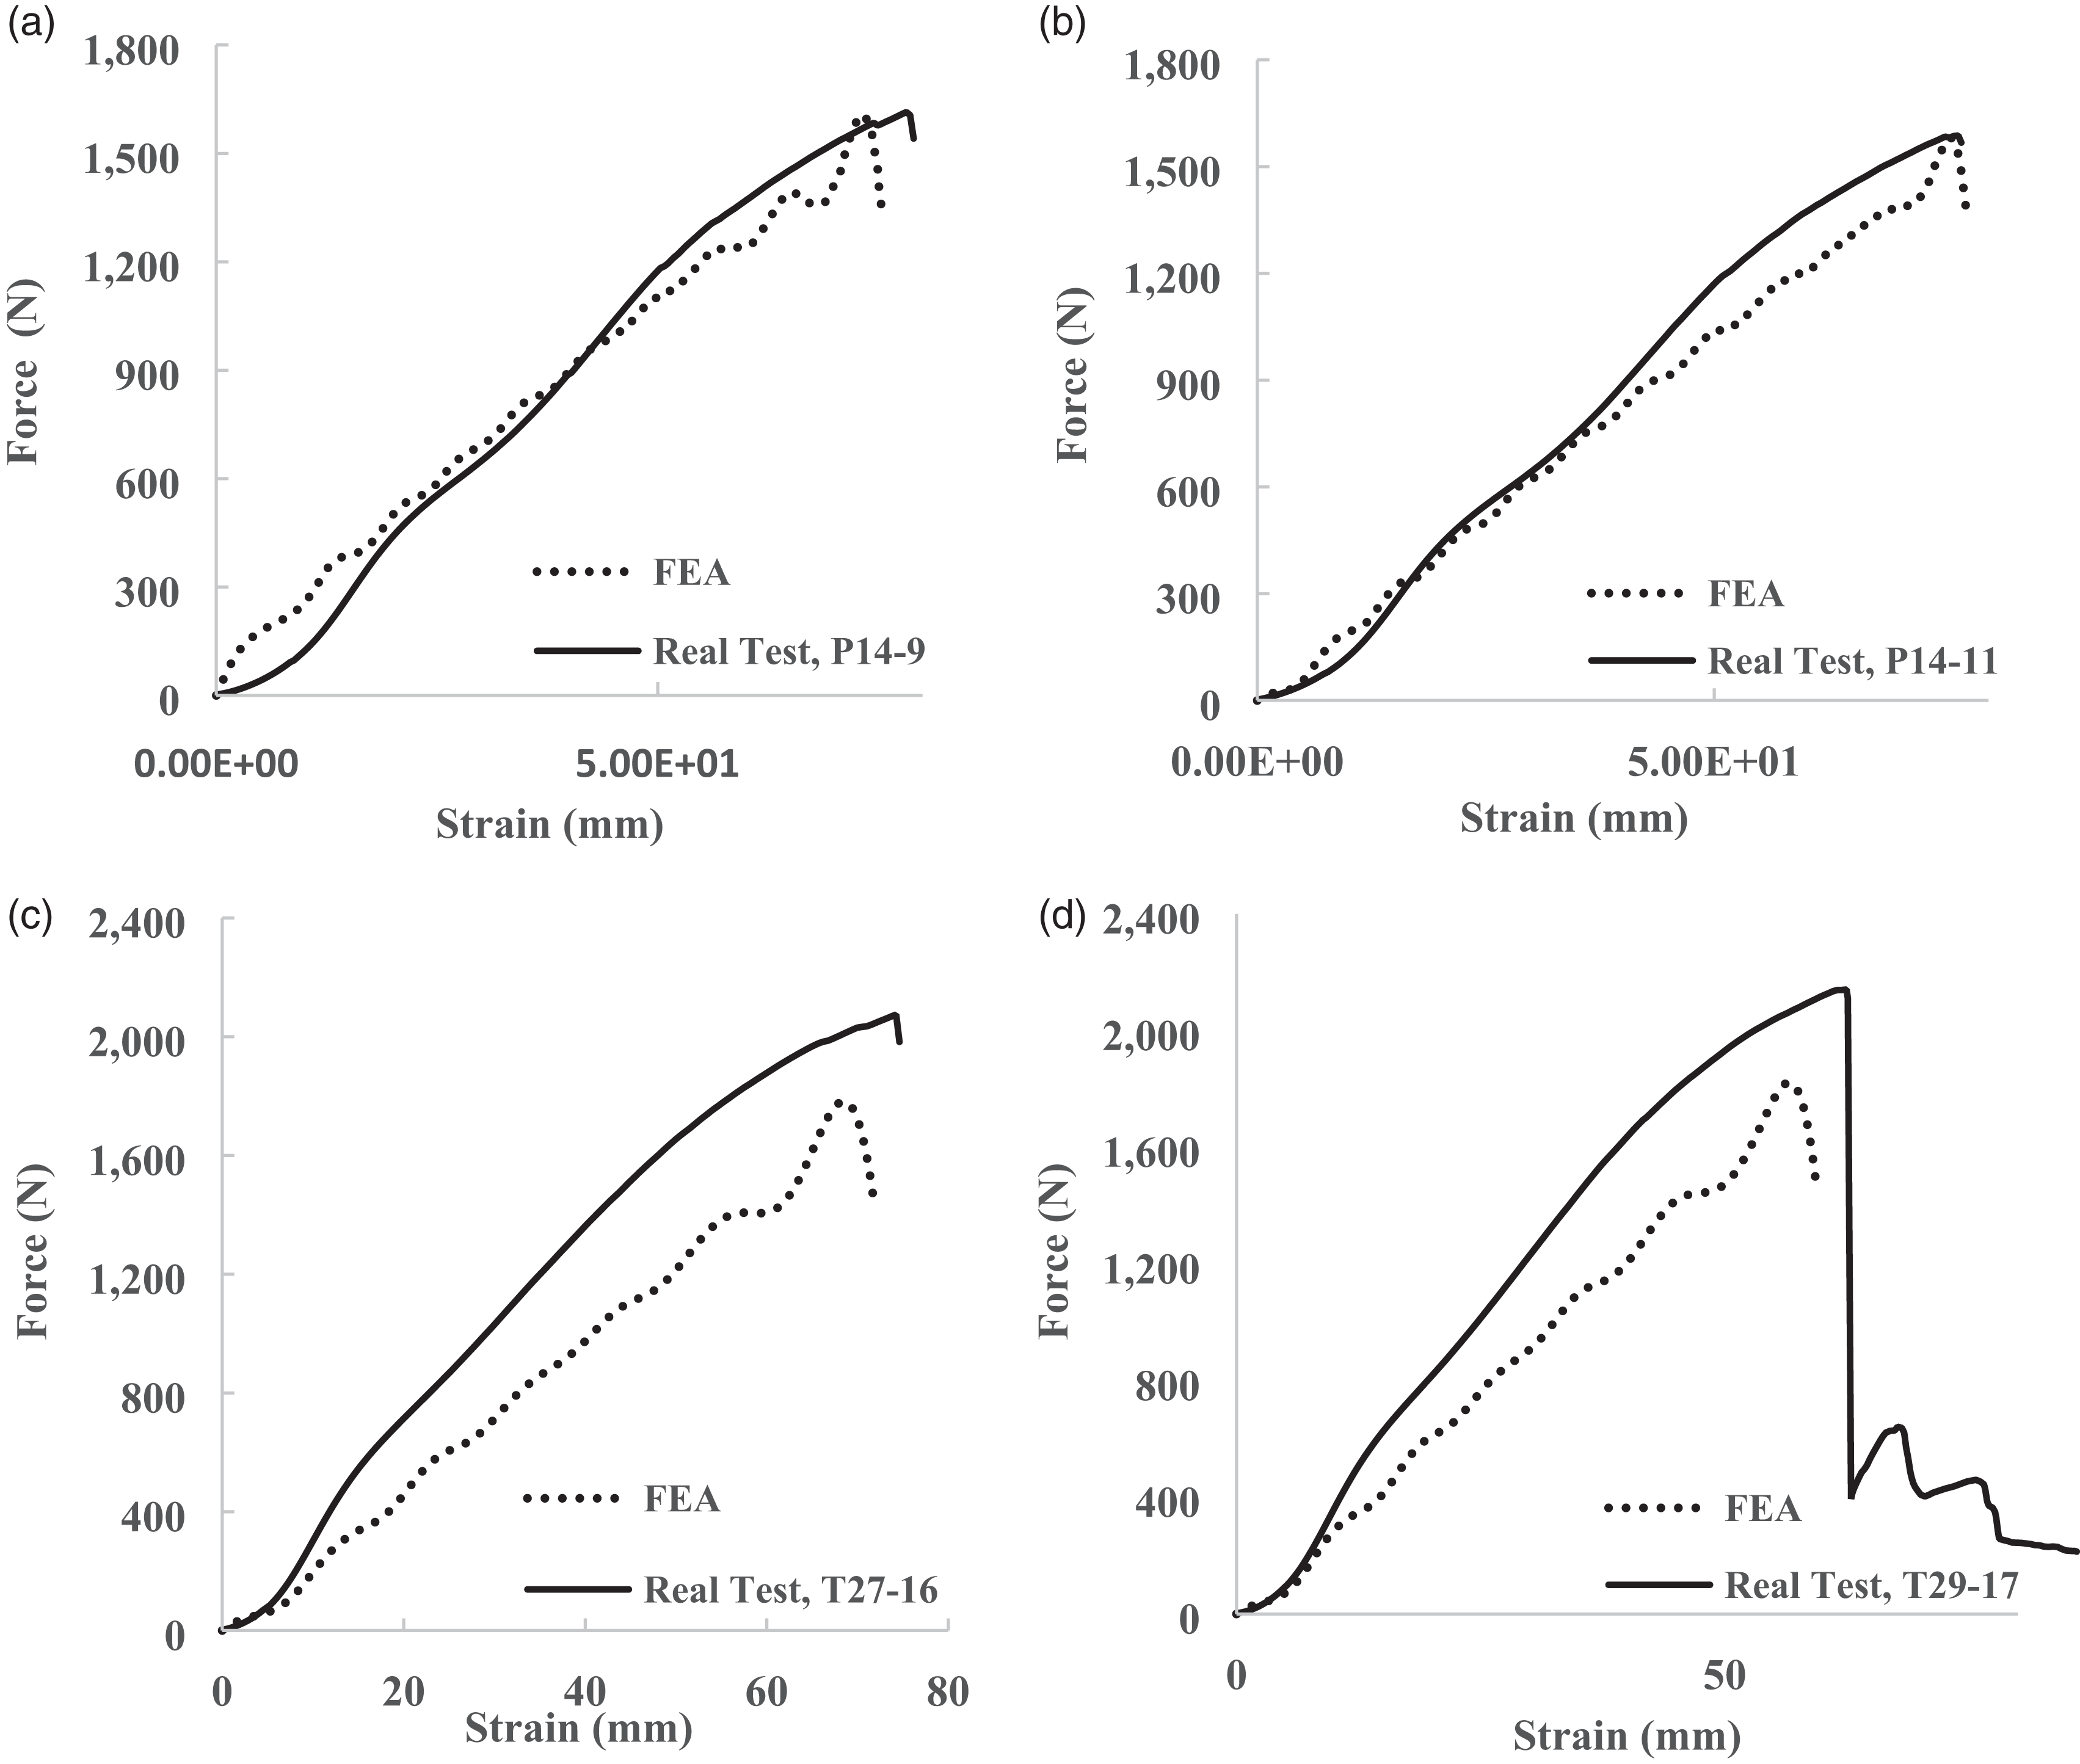
The force–strain graphs of laminated fabric: (a) laminated plain fabric, P14-9; (b) laminated plain fabric, P14-11; (c) laminated twill 2/2 fabric, T27-16 and (d) laminated twill 2/2 fabric, P29-17. FEA: finite element analysis.
The FEA data of the P14-9 laminated fabric exhibited the best conformity with the real test. The intersections of P14-9 were less than those of P14-11. A similar situation was obtained for twill 2/2, the densities of which were T27-16 and T29-17. The deviation is less at T27-16 than at T29-17 due to the number of yarns with friction and the higher number of intersections.
On the other hand, the FEA data of the laminated plain fabric FEA data is in better agreement with the experimental data for the laminated twill 2/2 fabric. However, the same test speed was used. The mechanical properties of the fabric were mainly affected by the mechanical properties of the yarn. The yarn-breaking mechanical behavior is affected by the fiber type and shape of the fiber cross-section, 23 which influences the friction between the fibers and yarns. The round cross-shaped fibers indicate that the yarns have greater uniformity based on the FEA analysis results.
From a similar point of view, the fabric weave structure as twill 2/2 has the floating of yarns into the structure, as shown in Table 4, as pattern codes, and this is called a diagonal weave. In contrast, the plain weave has straightness and is more uniform than twill 2/2. The uniformity of the materials increases the accuracy of the simulation.
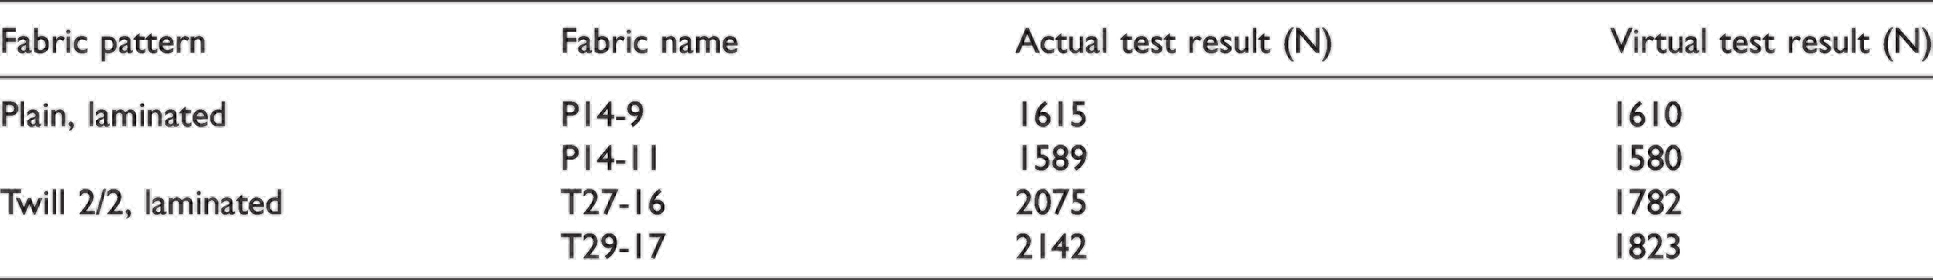
The breaking force in the warp direction of the virtual test results is lower than that of the actual test for plain and twill 2/2 fabric laminated for both densities for each pattern. Table 6 lists the maximum breaking force (N) results for the actual and virtual tests.
The maximum breaking force results of actual and virtual tests
The relative error of the breaking force can be expressed as
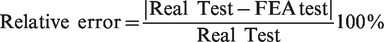
The average relative errors that were calculated according to the breaking force are 0.4% for laminated plain fabric and 14.5% for laminated twill 2/2 fabric.
The correlation coefficient was calculated for the comparison of all force–strain data using the Pearson correlation in Minitab within 95% CI. The results were 0.998 for P14-9 and P14-11, 0.995 for T27-16, and 0.978 for T29-17. There is a linear correlation between FEA data and actual data, confirmed by the hypothesis test, which resulted in 0 for the P-value.
Figure 13 shows (a) the test area of stress, (b) the breaking area on the sample during the testing, and (c) the breaking line that occurred in the middle of both actual specimens, which is similar to that in the virtual test.
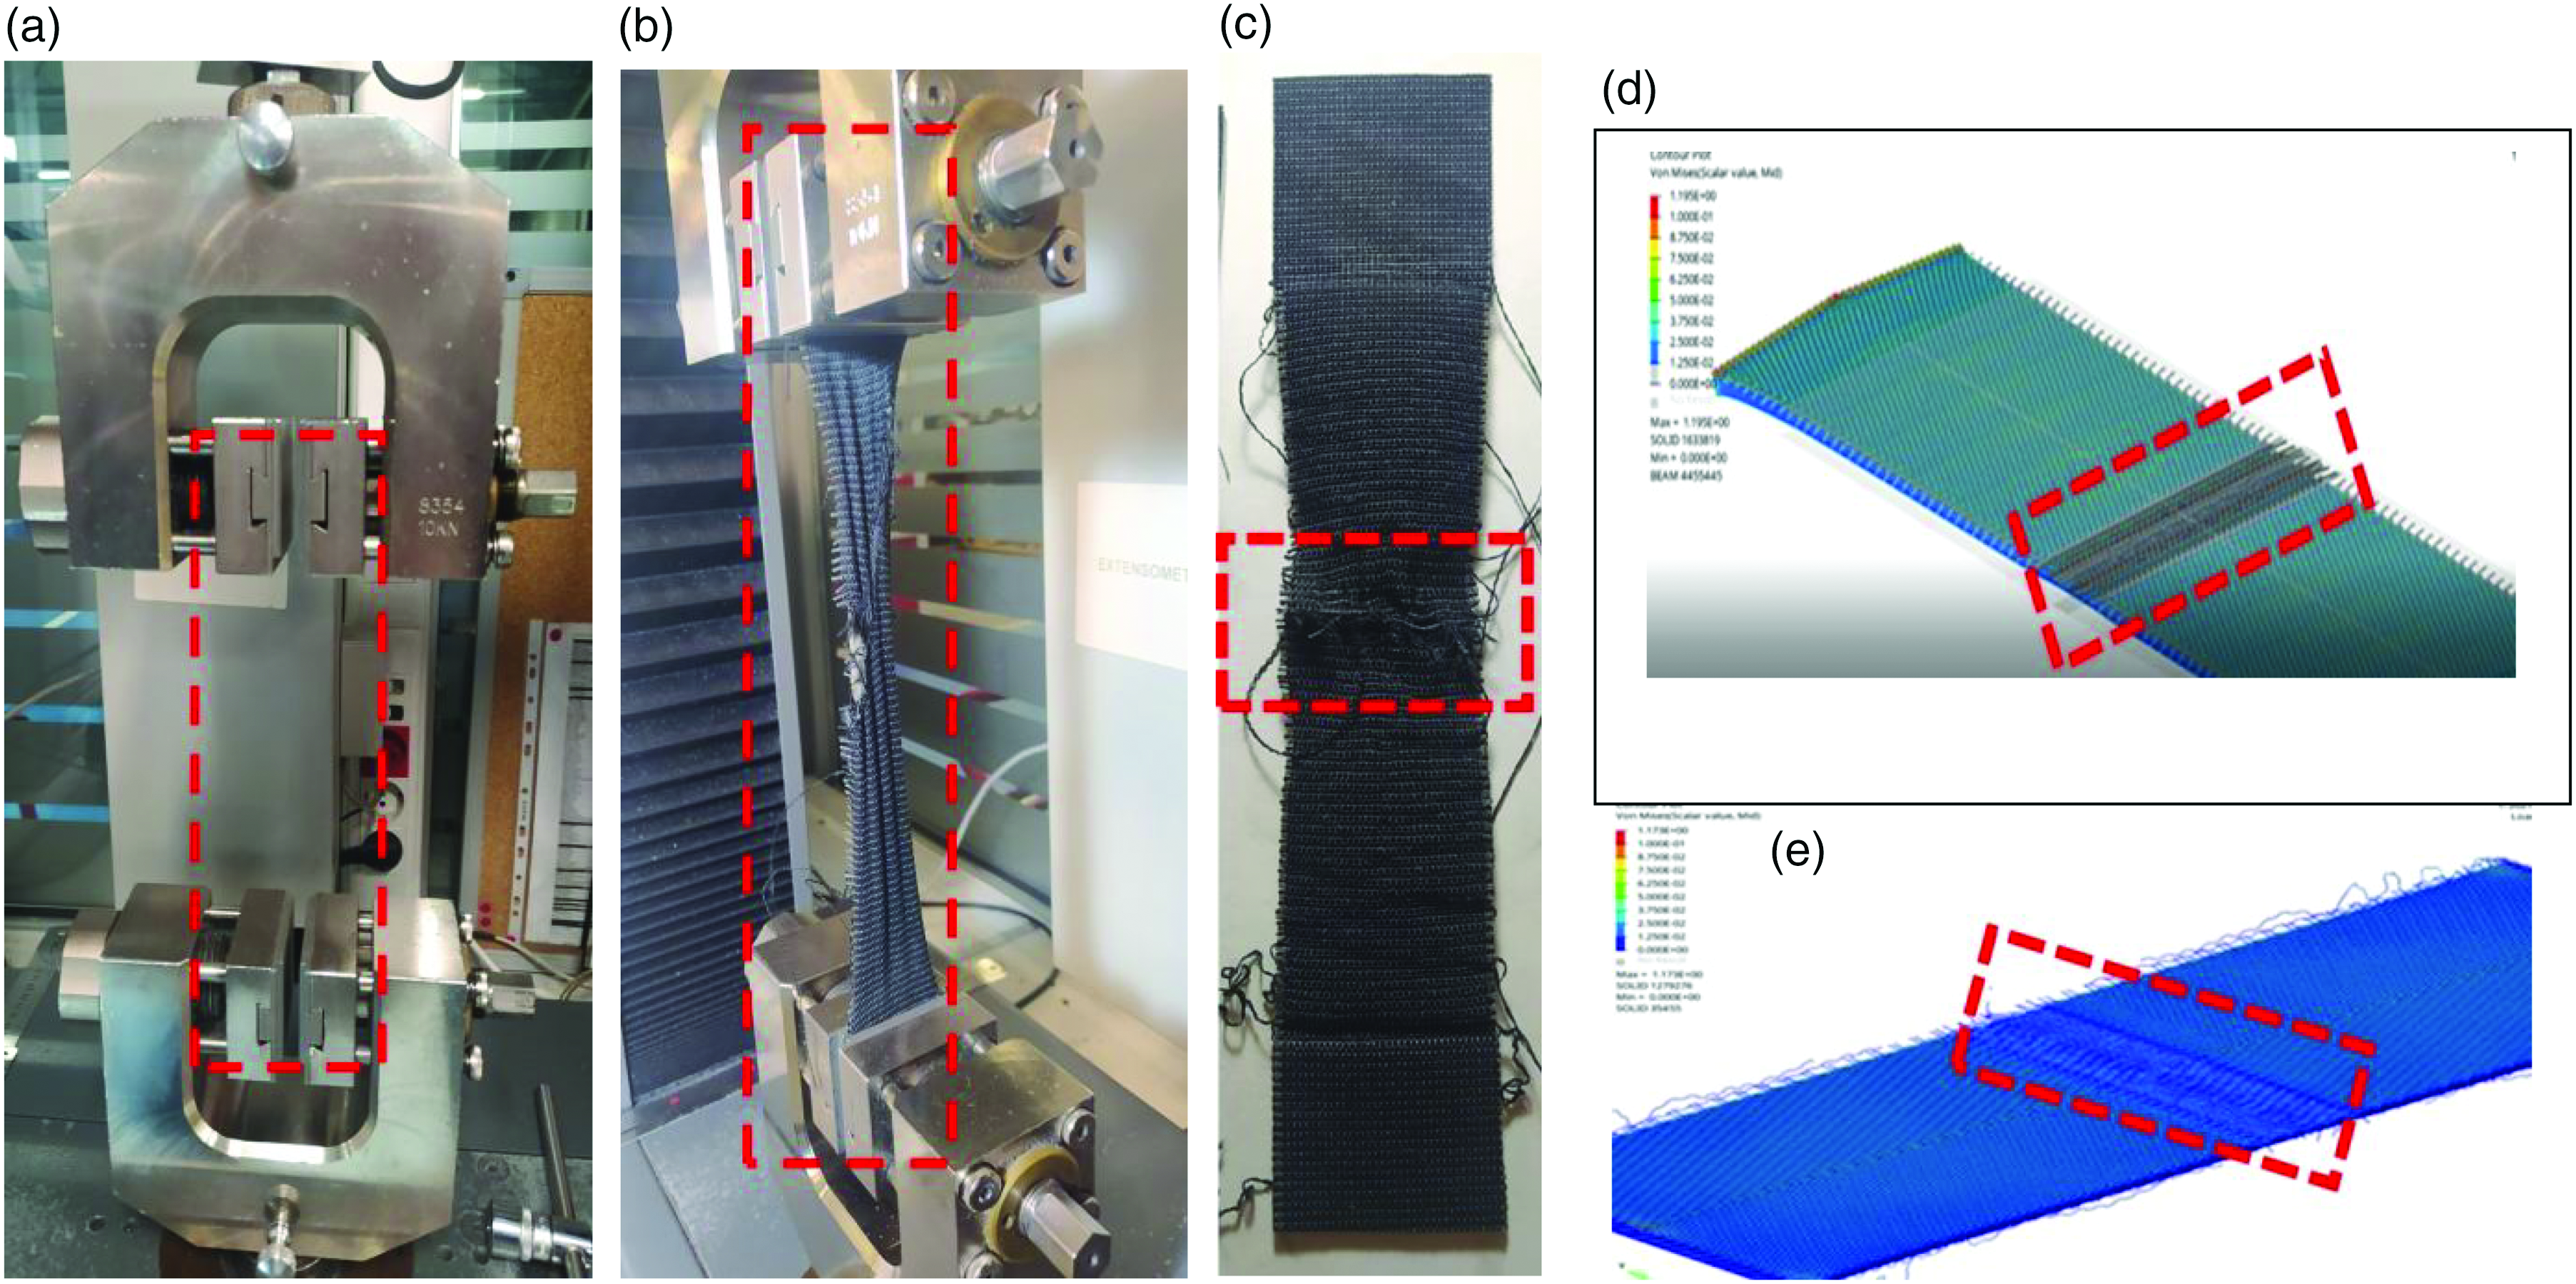
(a) ZWICK tensile strength tester sample area, (b) deformation behavior of laminated fabric under axial loading, (c) the breaking morphology of the actual specimen for plain fabric, (d) the breaking line of the virtual specimen for laminated twill 2/2 fabric, T27-16, and (e) the breaking line of the virtual specimen for laminated plain fabric, P14-9.
The deformation morphology can differ due to the acting direction of the forces and their magnitudes, the complexity of the weave, and the yarn types.
Conclusion
A virtual model of the laminated fabric with mechanical properties was simulated using FEA and compared with the actual laminated fabric along the warp for validation. The geometrical model is based on the yarn characteristics, which are measured and then calculated. The plain and twill 2/2 were weave patterns with two types of yarn density that have been structured in KTEX so as to observe the accuracy of the model. The plain and twill 2/2 fabrics were laminated in FEA with foam and scrim as layers via applying adhesion and bonding. The models of the laminated fabrics were tested using FEA and in real conditions with the produced laminated fabrics.
Laminated fabric is a nonlinear, viscoelastic, and anisotropic material that is used as a textile material. To simplify the simulation, the virtual laminated fabric was modeled as linear, elastic, and isotropic. Therefore, the simulation graphs and results partially deviated from the actual values. These deviations can be clarified by more studies for a specific weave.
The simulation outputs were in good agreement with the experimental results. The virtual test results were lower than the actual values for both fabric and density. The results of the laminated plain fabric are very similar according to those of the twill 2/2 fabric in the case of uniformity of the plain weave.
Meanwhile, different warp and weft densities were simulated to recognize the effect of fabric geometry on the simulation results. A higher density leads to an increase in the intersections, and the relative deviation is higher between the actual and virtual results. Jamming of yarns in fabric because of density reduces the space between adjacent yarns, and the friction of the yarn parallel and at crossover points induces deviation in simulation studies.
The test speed difference between virtual and actual conditions has a greater effect on twill 2/2, which has octolobal cross-sectioned filaments. Yarn cross-section type and texture methods can be factors that result in smoother fabric structures.
Actual and virtual test graphs were read to determine the mechanical behaviors of the laminated fabrics. The initial curves of the actual test differed from those of the virtual test owing to the compaction step. The test speed difference can affect the simulation validity. The lower test speed in the FEA can reduce the curve fluctuations.
Two different weaving densities were used for both weaves to verify the effect of geometric modeling on the mechanical behavior of the fabric. The fabric with higher warp and weft densities was stronger than that with lower densities for both tests.
Fabric construction properties, such as the weave structure, filament cross-section, yarn diameter, yarn texturizing methods, and the density of the warp and weft, are significant constituents in terms of simulation efficiency.
The tensile strength simulation and its result can lead to the simulation of deformation modes, such as tearing and abrasion tests.
Footnotes
Declaration of conflicting interests
The author(s) received no financial support for the research, authorship, and/or publication of this article.
Funding
The author(s) disclosed receipt of the following financial support for the research, authorship, and/or publication of this article: This work was supported by Tubitak Turkey under project number: 1001, “Investigation of woven fabric deformation in car seat cover form” (STZ.2015). All work was conducted in collaboration with Marturfompak International.