
Abstract
A common method to fabricate net-shaped three-dimensional (3D) woven preforms for composite T-joints is to weave flat 3D preforms via a standard weaving machine with variation in binder yarn path and then separate the preform in the form of a bifurcation. Folding introduces fiber architecture deformation at the 3D woven bifurcation area. In this paper, a geometric modeling approach is proposed to represent the realistic fiber architecture, as a preprocessor for finite element analyses to predict composite structural performance. Supported by X-ray micro-computed tomography (µCT), three important deformation mechanisms are observed including yarn stack shifting, cross-section bending, and cross-section flattening resulting from the folding process. Furthermore, a set of mathematical formulae for simulation of the deformations in the junction region are developed and satisfactory agreement is observed when compared with μCT scan results.
Three-dimensional (3D) woven composites are reinforced by 3D woven preforms containing yarns in x, y, and z directions. 3D woven preforms, specifically for composite applications, are generally classified into orthogonal, through-the-thickness angle interlock, and layer-to-layer angle interlock patterns. Design and manufacturing of emerging multi-axis 3D woven preforms incorporating bias yarn layers has also been proposed but the development is still at an early stage for applications. 1 3D woven composites have drawn great attention in recent decades for their advantages such as higher through-thickness properties that can help to overcome the problem of delamination encountered by two-dimensional (2D) laminates. 1 The exploration of 3D reinforced composites has also been extended to load-bearing profiles like T-, I-, and Pi-shaped joints. There are three basic ways to manufacture 3D reinforced composite joints with woven preforms. The first method is to use 2D woven fabric lay-ups, reinforcing the through-thickness direction with stitching or Z-pinning.2,3 The second way is to weave flat 3D preforms via a standard weaving machine with variation of binder yarn path to form locally unreinforced planes (bifurcations) and then fold the preforms into the desired shape.4–7 The third way is to fabricate the preform directly into a complex 3D shape through a specially developed 3D weaving loom.8–10 Although composites reinforced by the first method can offer better damage tolerance in terms of delamination than 2D laminated joints subjected to equivalent loads,2,11 they can be less competitive in in-plane properties because of geometric defects or fiber damage caused by retrospectively inserting through-thickness reinforcements. 12 In addition, due to the high investment and innovation needed for developing a special 3D loom for the third kind of preform, 3D preforms woven by a conventional loom are popular for current composite T-joints.
However, deformation is likely to occur when folding a flat woven preform into a 3D shape. Because the internal architecture of a woven preform is complex, its variability in geometry can directly affect material properties such as permeability and formability.13,14 At the micro-scale, the fiber misalignment in fiber bundles was also found to have an influence on many aspects of composite behaviour.
15
Previous studies have also shown that reinforcement geometry plays an important role in determining the composite’s mechanical properties, as two types of 3D woven composite T-joints with only weave variation at the 3D woven bifurcation area (in which the formed resin pocket is usually referred to as the “noodle”) were tested under the same tensile loading case but very different load–displacement responses were observed (Figure 1(a)).
16
Thus, in order to closely predict the properties of composite T-joints reinforced by a flat woven 3D preform, it is necessary to model the fiber architecture as realistically as possible.
(a) Load–displacement curves for the two types of 3D woven composite T-joints in comparison with an equivalent 2D twill woven T-joint.
16
(b) Schematic woven structures for the T-joints showing weave variation at the junction (dashed line area), with binders omitted.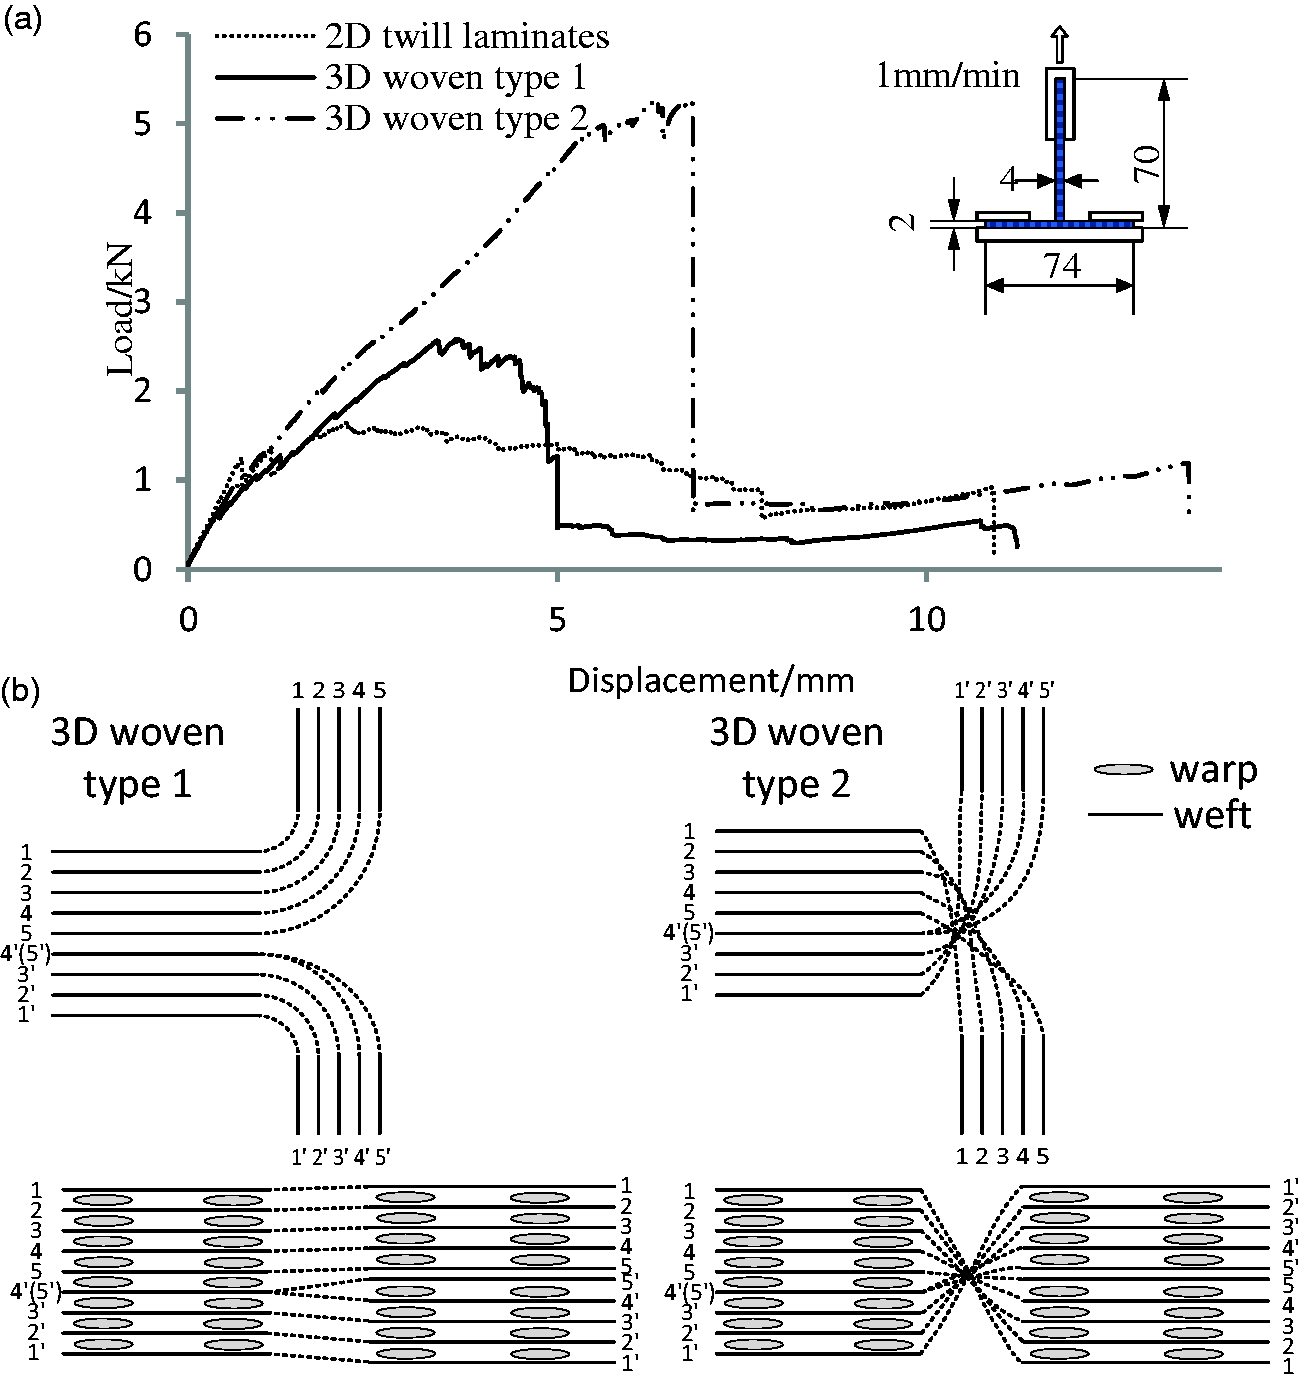
Characterizing the realistic fiber architecture of 3D woven composites is difficult because of the complexity of the internal geometry, but this can benefit from the use of X-ray micro-computed tomography (μCT).17,18 Some general frameworks for geometric modeling of woven preforms with respect to characterization of yarn path, crimp, and cross-section shape have been provided in the literature.19–22 Furthermore, compaction-induced yarn crimp and cross-section shape change were studied with a number of models;23,24 however, as they are based on beam theory, numerically solved by the finite element method, they are computationally intensive. Some mathematical methods were also proposed to model yarn cross-section shape under compression. An energy-based method used to characterize yarn deformation in compression was developed by Lomov and Verpoest, 25 but the method asks for a measurement of the mechanical properties of yarns in bending and compression. Chen et al. modeled yarn cross-section deformation of both single and multi-layer woven preforms under compaction at the mesoscopic level based on the assumption that yarn width deformation is negligible compared with the deformation of yarn thickness.26,27 The model is not applicable when yarn width change is significant, for instance for a yarn subjected to bending load. Cornelissen and Akkerman observed yarn cross-section flattening in a cantilever experiment of yarns bending under their own weight. 28 They concluded that cross-section flattening would affect the yarn wflexural rigidity by one order of magnitude but they were not able to derive a trend from the experiment. However, yarn cross-section deformation in bending is significant as observed in this study via μCT analysis and an effective model is needed to capture this feature.
This paper focuses on the geometric modeling of 3D woven preform deformation caused by folding a flat woven preform into a T-piece, which is a typical fabrication process for composite T-joints. Through the μCT analysis of a compacted preform, three important deformation mechanisms specifically for this type of preform were observed, namely yarn stack shifting, cross-section bending and cross-section flattening resulting from the folding process. These features have been geometrically modeled and the models have been validated against μCT analysis data of a 3D woven T-joint preform.
Material characterization
The example preform reinforcing the composite T-joints is a 3D orthogonal weave provided by Sigmatex, UK, based on Hexcel IM7 12K carbon fiber, which is woven flat on a Jacquard machine and folded into a T shape. 3D orthogonal weaves are 3D structures containing straight warp and weft yarns in the x, y directions and binders (also called “warp weavers”) that interlace with other yarns, at times, orientated in the through-thickness direction, providing high stiffness under tensile loading due to low yarn waviness. 10 The preform consists of eight layers of warp yarns and nine layers of weft yarns in the web, and four layers of warp yarns and five layers of weft yarns in the flange. A schematic woven structure for this preform before and after bifurcation is shown as “3D woven type 1” in Figure 1(b).
To characterize the intrinsic geometric features of this type of preform for composite T-joints, the dry preform was compacted into a T-shape acrylic fixture and analyzed via μCT, as shown in Figure 2. The web section of the preform was firstly fitted in the fixture before bifurcation of the flange section, thus no deformation in the web is likely to be expected from preform bifurcation and the part of the preform contacting the fixture corner would conform to its radius of curvature. The GE phoenix v|tome|x m machine used a current of 240 μA and a voltage of 120 kV to achieve the imaging resolution of 30 µm per pixel in scanning. The compaction leads to an average fiber volume fraction of 45% which is calculated based on the preform areal weight with 4 mm thickness in the web and 2 mm in the flange. The preform has two geometric changes in its left-hand side: one is that the warp yarns at the junction (curved region) are in twice the filament count as those in the web; the other is a weft layer in the web (numbered as 4'(5') in Figure 2) is formed of twofold weft yarns as used in other layers and separated into two layers (layer 4' and 5') at the flange, for the purpose of yarn layer balance in the flange. Meanwhile, the flange part of the preform was woven with warp yarns of 24k filament count.
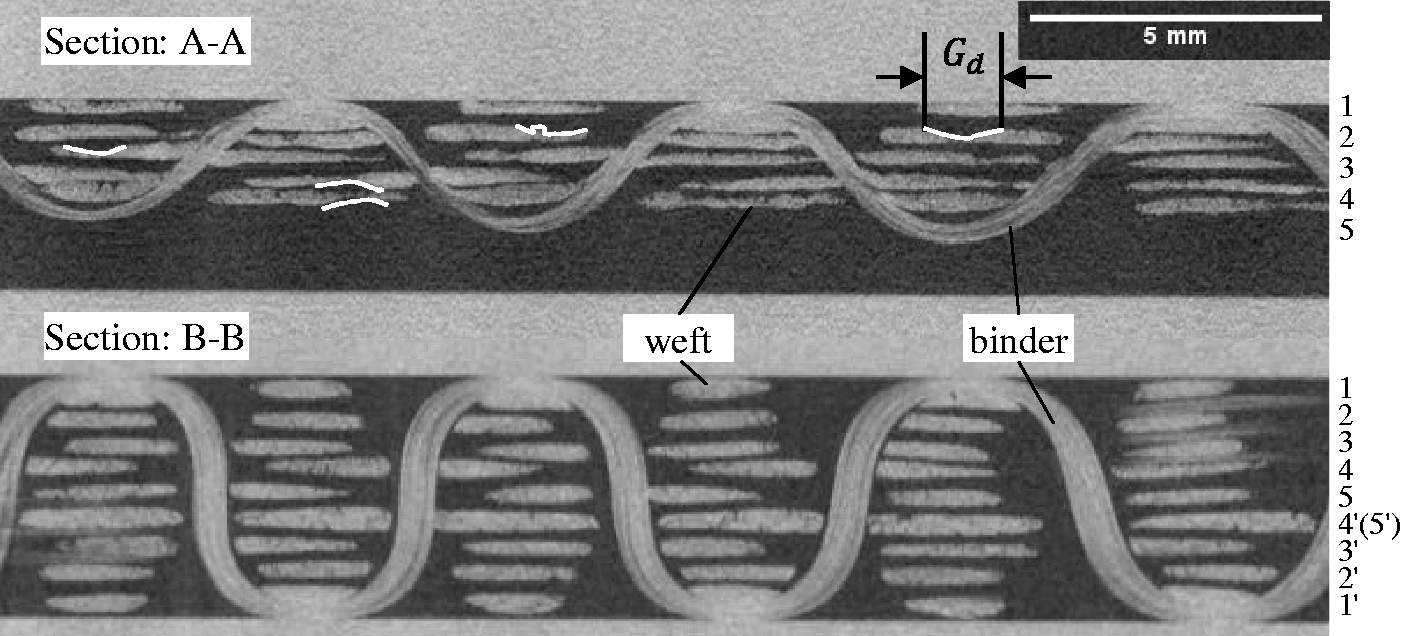
μCT scan of the preform: (a) preform visualized via volume rendering from μCT showing the yarn directions; (b) schematic 3D orthogonal weave pattern (created by TexGen); (c) μCT section view of the preform with the numbers showing the numbering of weft layers.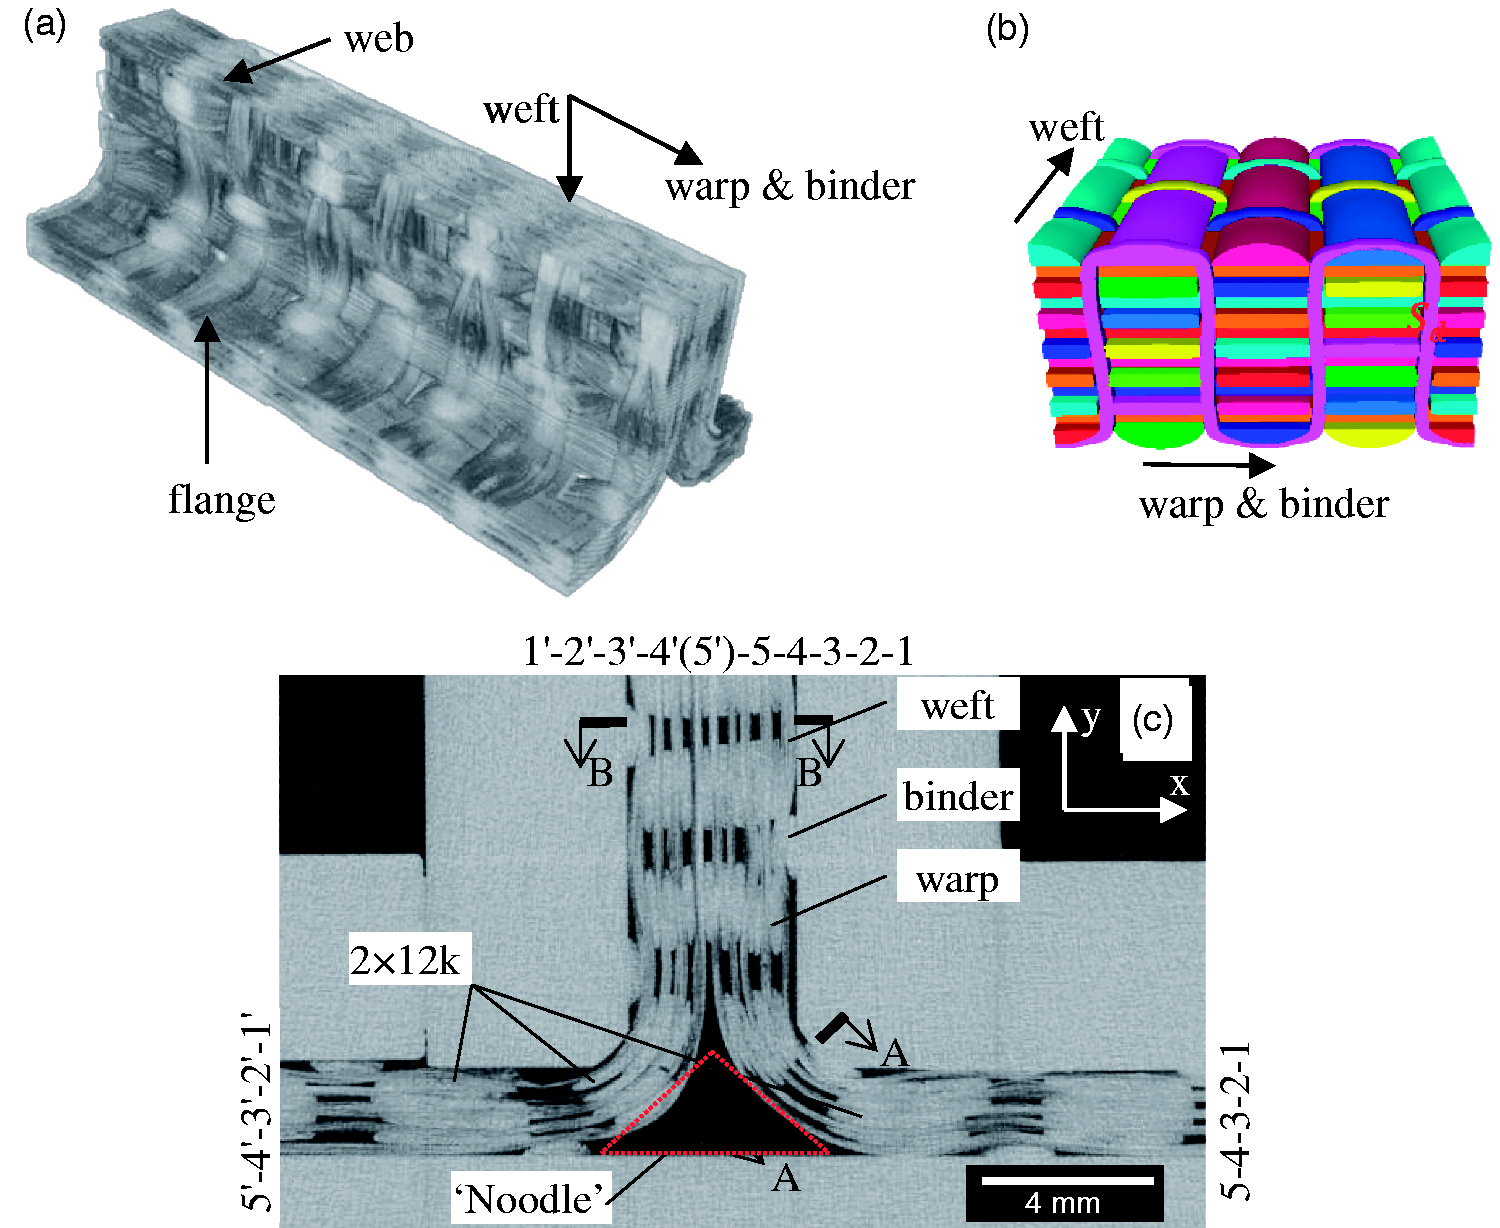
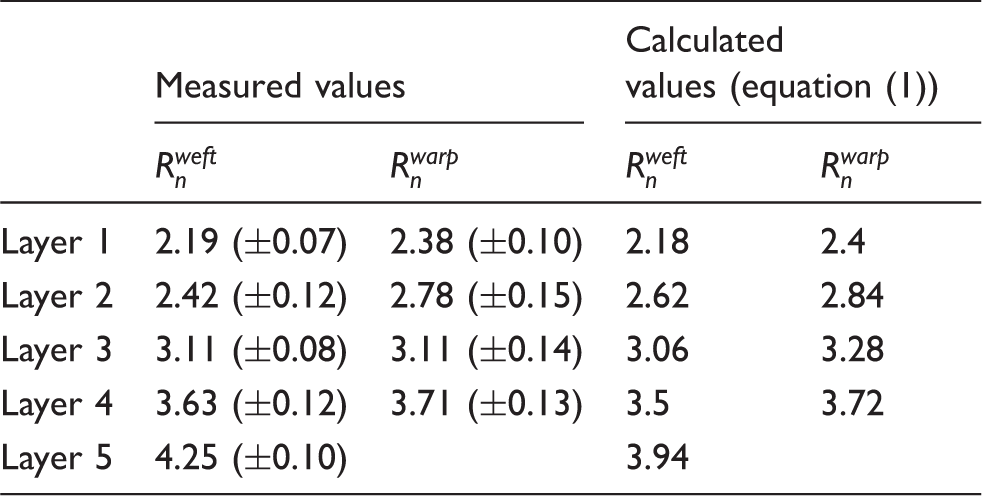
Measured geometric parameters of the 3D woven preform through μCT.
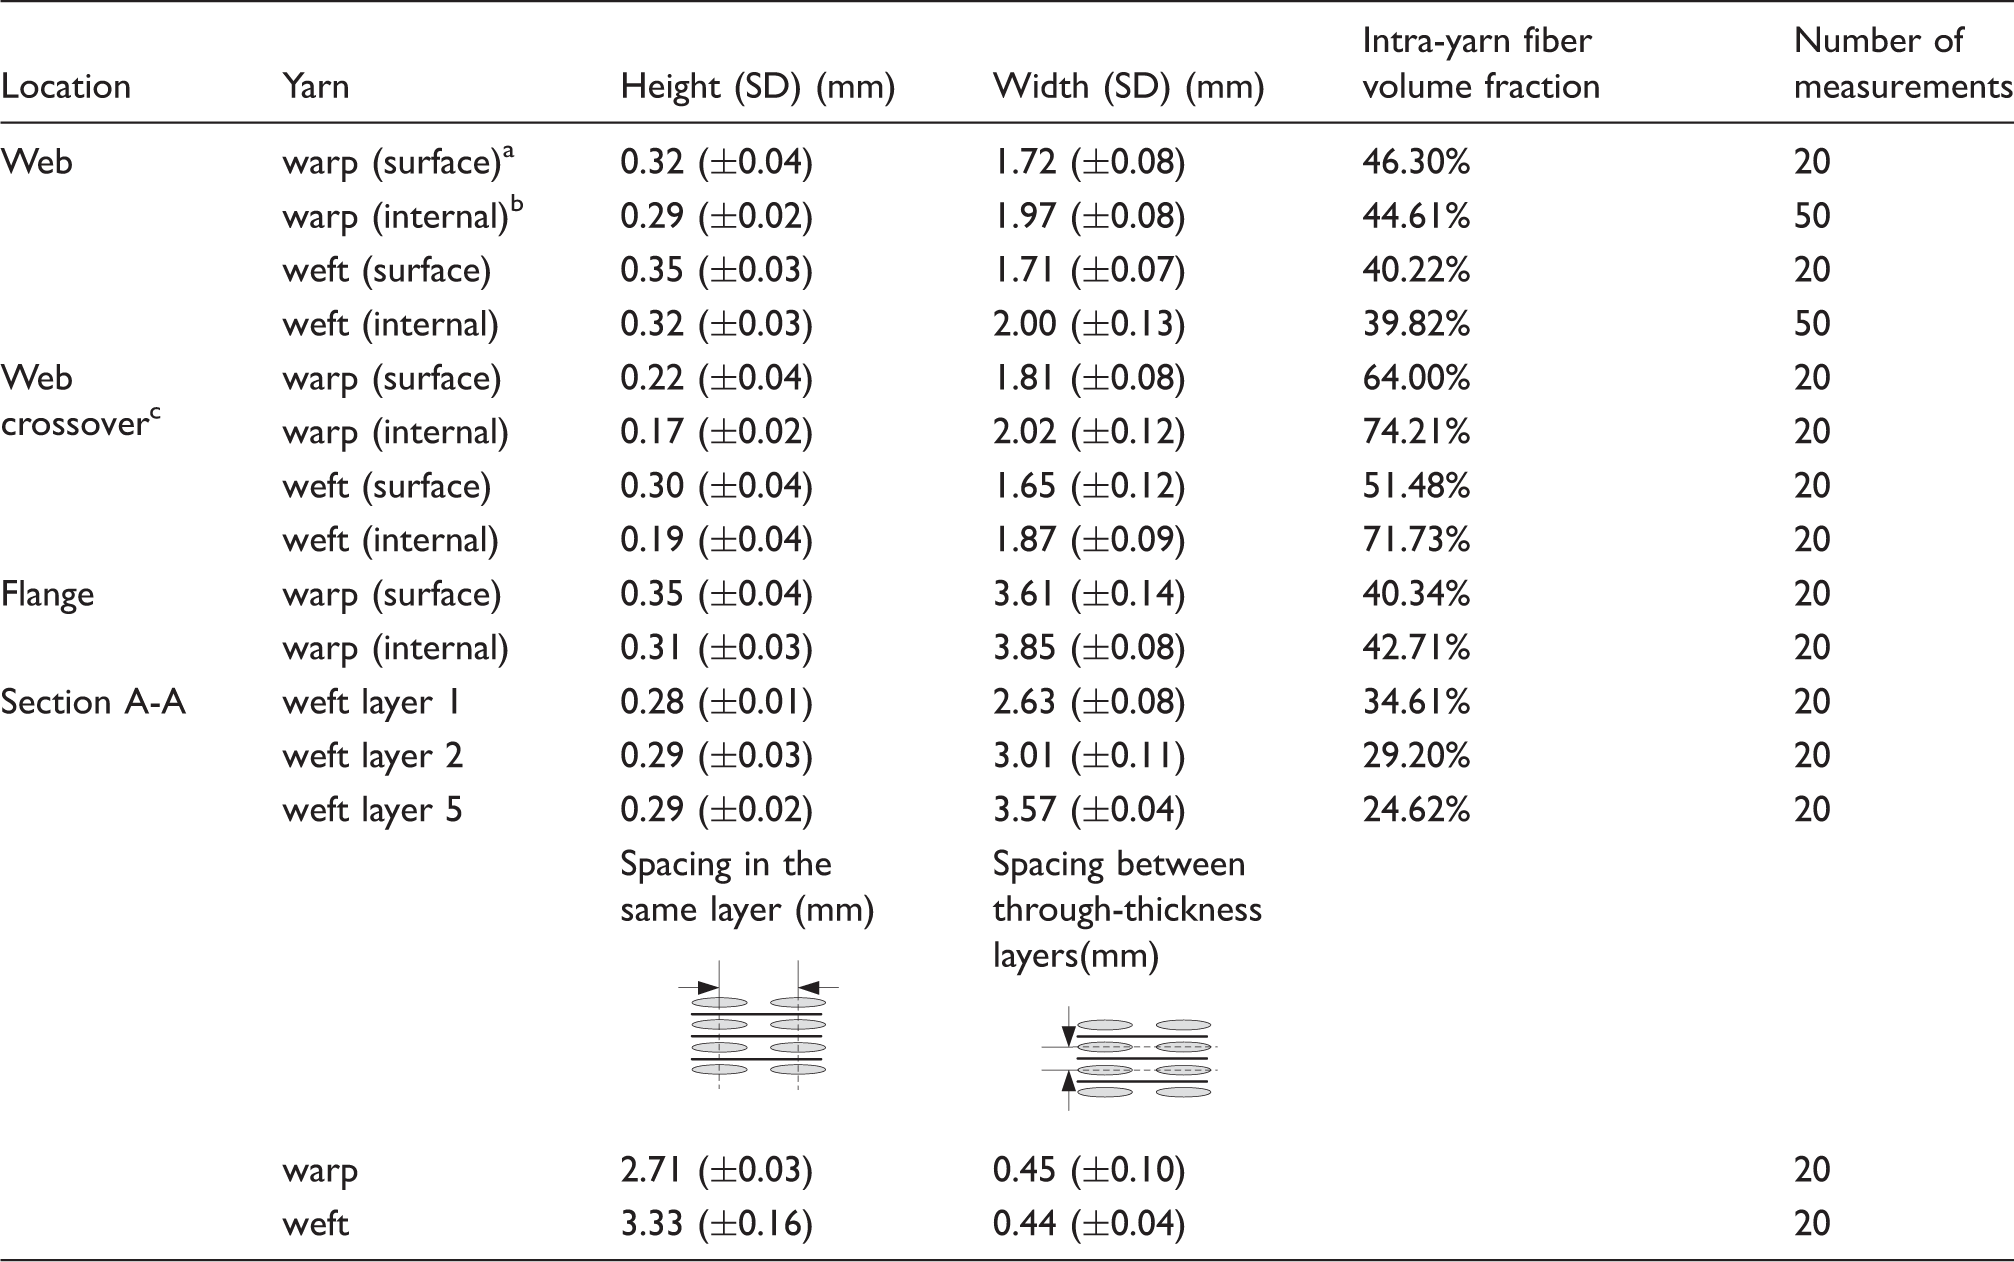
Surface yarns are those on the layers next to compaction fixture surfaces.
Internal yarns are all other yarns except surface yarns.
Crossover refers to the locations where warp and weft yarns intersect.
Warp yarn shift
The first distinctive deformation is the shift of the warp yarn stack at the junction, in the direction orthogonal to the yarn length direction. The warp yarns within the same stack are aligned vertically with each other before folding the preform, but their relative position is shifted after folding due to the rigid body transformation at the junction. However, the warp yarn shift could be suppressed by the surrounding binder yarns.
The shift begins in the warp yarn stack at the bend as marked in Figure 3, and is followed by the next 1–2 stacks in the flange. It is noted from the μCT scan that this phenomenon is most evident in the noodle area, and the level of shift reduces in the following stacks of warp yarns in the flange. To quantify the shift of the warp yarn stack, shift in the bend can be represented by angle shift Warp yarn shift quantification at the junction (weft yarns not shown); numbers show the numbering of warp layers. μCT images showing weft yarn flattening (A-A: flattened; B-B: non-flattened); serrated cross-section shapes are marked in Section A-A.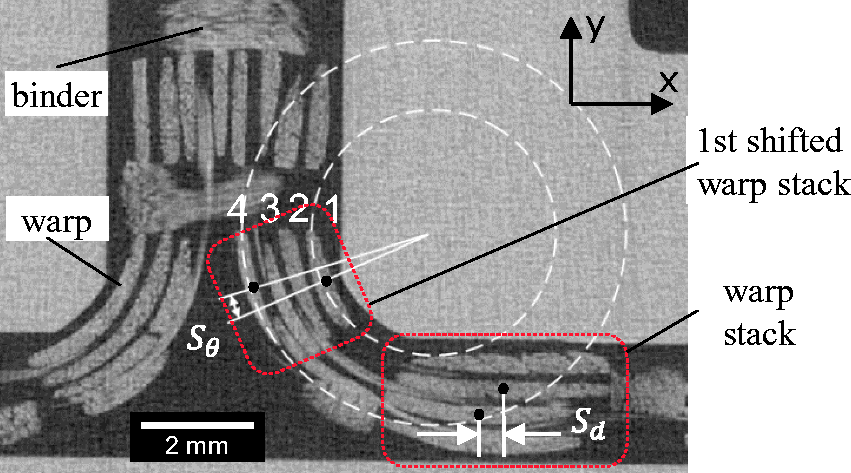
Warp yarn cross-section bending
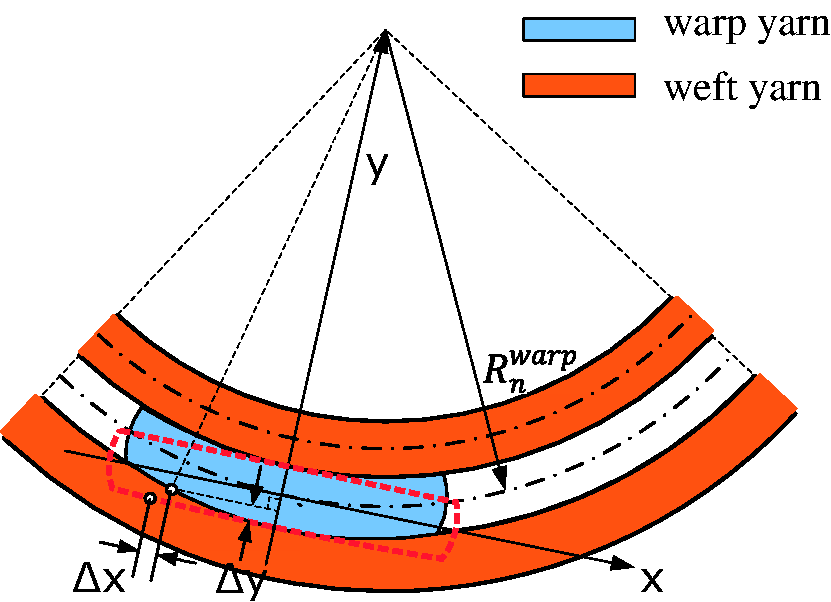
Bent cross-sections of warp yarns were observed at the junction. As shown in Figure 3, each warp yarn bends about the centerline (or center-plane) of its cross-section uniformly along its length direction and its shape complies with the curvature of the adjacent weft yarn layers. For this 90° folded preform, the centerline of each weft layer in the bend follows the path of a quarter of the circumference of a circle. As a result, the centerlines of bent warp yarn cross-sections could be approximated with circular paths of different radii. The measured radii of curvature of centerlines of bent warp cross-sections ( Schematic view of warp yarn shift due to rigid body transformation. Schematic view of warp yarn cross-section bending. Measured and calculated radii of curvature of centerlines of bent warp yarn cross-sections and weft yarn layers, here subscript n is the yarn layer number (mm; 5 measurements)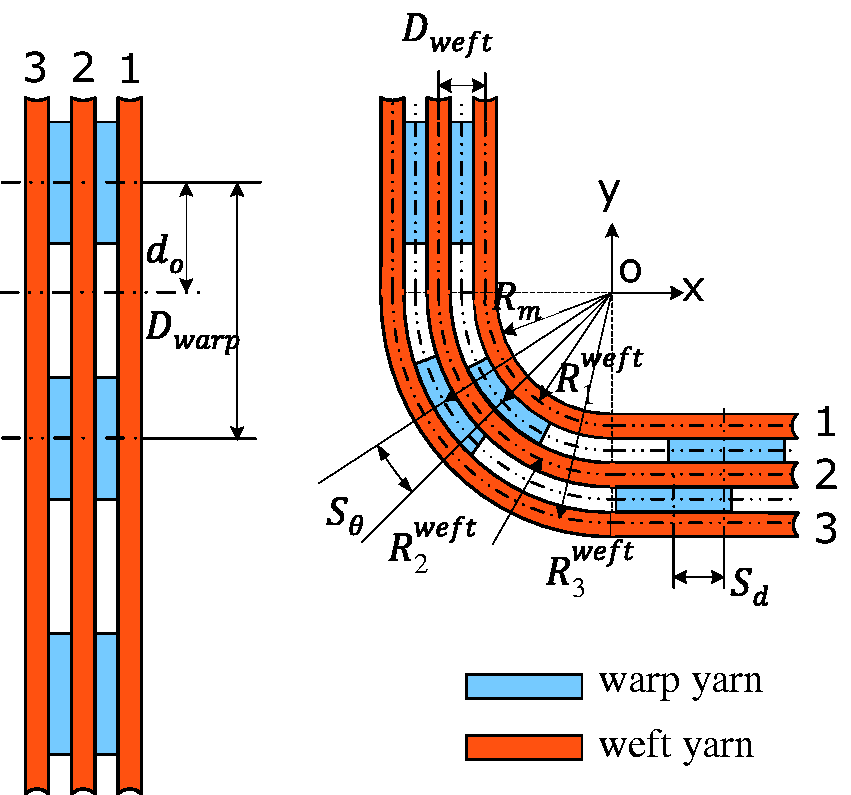
Weft yarn cross-section flattening
In Figure 4, section view A-A of Figure 2 shows the cross-sections of weft yarns at the middle of the bend arc, while section B-B denotes cross-sections of weft yarns in the flat region. It is obvious that the cross-sections of weft yarns at section A-A are significantly flattened, i.e. an increase in yarn width and decease in yarn height, especially for those not sitting in the peak or trough of the binder yarn path since here yarn flattening is not constrained by binders. The cross-section data of flattened weft yarns without binder constraint at position A-A were measured from the μCT scan and results are listed in Table 1. The layer sequence of weft yarns in section A-A is numbered as Figure 2 shows. From further observation of μCT images, the most slender cross-section of weft yarn occurs at position A-A in Figure 2, from where it transitions symmetrically back to the dimension of the yarn cross-section in the flat part of the preform. It is also observed that the length of yarn width transition varies for yarns on different layers, but all the flattened yarns are of almost same height, as shown in Table 1.
Meanwhile, a number of gaps in yarn cross-sections at section A-A were observed, which caused serrated cross-section shapes in most of the weft yarns, as marked in Figure 4. A number of different slices near section A-A indicate this phenomenon and therefore it is unlikely to be an artefact of the μCT scan. The position of each gap appears random as observed and the cross-sectional gap is simply quantified by its maximum width that is named gap distance Gd. The value of Gd is no more than 1.5 mm from several measurements. The flattening and cross-sectional gaps of weft yarns at the bend partly result from fiber migration when the preform is folded. 15
Geometric modeling
Warp yarn shifting
The warp yarn shift is inevitable due to the rigid body transformation at the junction. Each warp yarn has a different radius of curvature of cross-sectional centerline to the fillet origin O. As illustrated in Figure 5, half of a flat piece of 3D woven preform (left) is folded to a 90° angle (right). 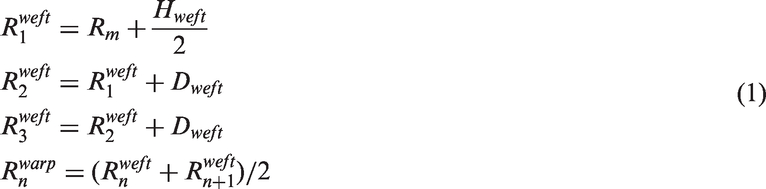
Assuming there is no yarn sliding, angle shit 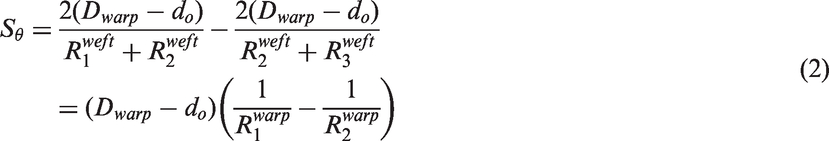
Also, the displacement shift Sd in adjacent layers for the following stacks of weft yarns can be described as

Warp yarn cross-section bending
Yarn cross-section shapes have been approximated by a number of researchers by elliptical, power elliptical, and lenticular shapes which can be defined by parametric equations in two dimensions.
19
Therefore, it is convenient to model the cross-section deformation by a parameterized transformation that can apply to every current parametric cross-section shape rather than defining a new description for a curved cross-section. The cross-section of one warp yarn is presented in Figure 6 prior to and after deformation, where x and y represent the original yarn width and yarn height directions, and the origin is at the yarn center. Accordingly the x and y coordinates of the original cross-section (the dashed line in Figure 6) can be defined by

It is assumed that the bent shape is a result of a simple conformation of the major axis from the axis x to the arc in radius 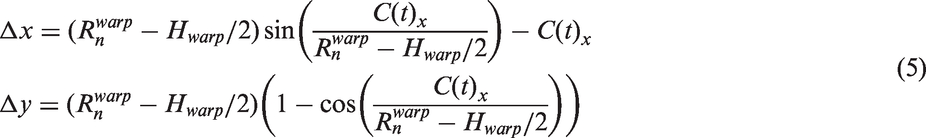
Usually the value of 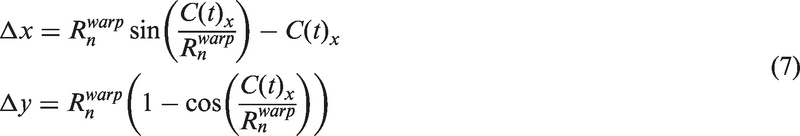
Weft yarn cross-section flattening
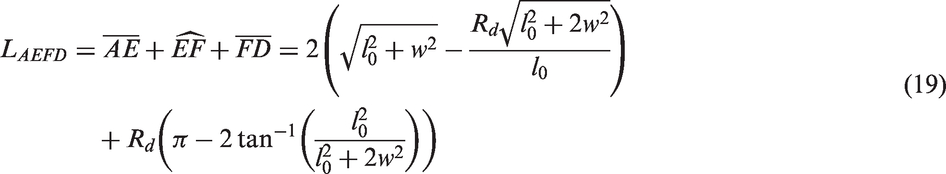
As shown in Figure 5 for half of a T-joint, each weft yarn is under a bending load. An idealized fiber distribution in the weft yarn would consist of parallel layers with concentric arcs whose arc lengths are dependent on each layer’s radial position. For illustration, Figure 7 represents a multi-filament yarn by inner, middle, and outer fibers/layers.
Idealized fiber arrangement in a 90° bent yarn.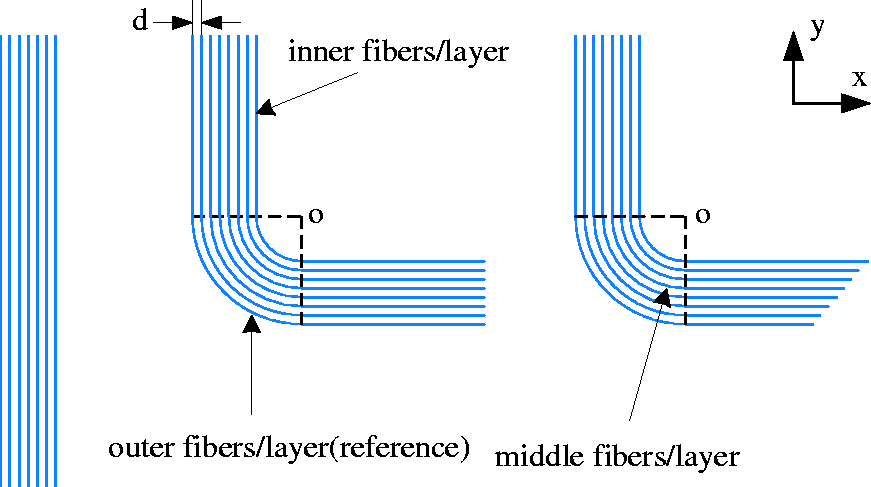
The model assumes that a fiber with high stiffness, such as carbon or glass fiber, has negligible axial deformation in a bent yarn. After folding a straight yarn (Figure 7(a)), it is clear that the assumed fiber arrangement in Figure 7(b) would lead to a fiber length difference which would not be realistic, in order to satisfy the boundary condition that a fiber bundle is undisturbed beyond the bending location. Meanwhile, Figure 7(c) shows another scenario where a fiber bundle with constant length complies with a 90o bend resulting in fiber ends at a sheared angle, which contradicts the real boundary condition. Therefore, to maintain constant fiber length at a localized 90° bend, fibers tend to migrate and rearrange resulting in a flattened yarn cross-section, as observed in Figure 4.
Taking the outermost layer of fibers in Figure 7(b) as a reference line for fiber movement, the rest of the fibers have to migrate to maintain their lengths. The positions of fibers except the reference ones in Figure 7(b) are considered as base positions for the movement. Hence the length differences between fiber on a specific fiber layer and fiber on the reference layer can be expressed as

There are two possible mechanisms for a fiber to migrate that maintains fiber length at a bending corner. One mechanism is to move in the yarn height direction, referred to as in-plane migration (i.e. in the x–y plane shown in Figure 8). The other way is to move in the yarn width direction, referred to as out-of-plane migration (z direction in Figure 9). In-plane fiber migration will result in a reduction of yarn height while out-of-plane migration will increase the yarn width.
Schematic view of in-plane fiber migration. Schematic view of out-of-plane fiber migration.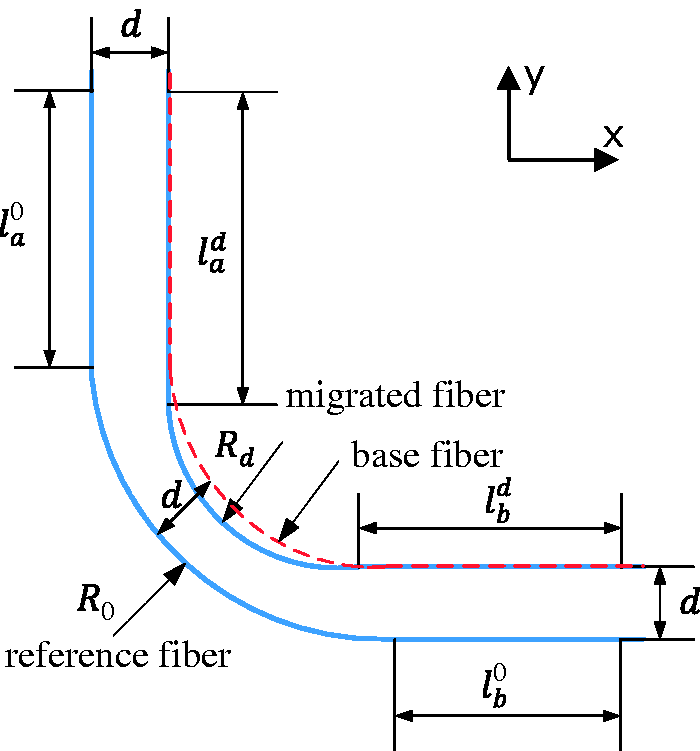
In-plane fiber migration
A reference fiber and a fiber on a neighboring layer before and after migration are shown in Figure 8. The fiber loci in the bend can be approximated by circular paths as shown in Figure 3, thus in this model each single fiber path is described by one quadrant and two tangential straight lines, such as R0, 

If a proportion α of the above defined arc length difference as shown in equation (8) is compensated by in-plane fiber migration, the arc length difference between migrated and base fibers is 
Hence, the in-plane path of a migrated fiber at distance d away from the reference fiber is described by
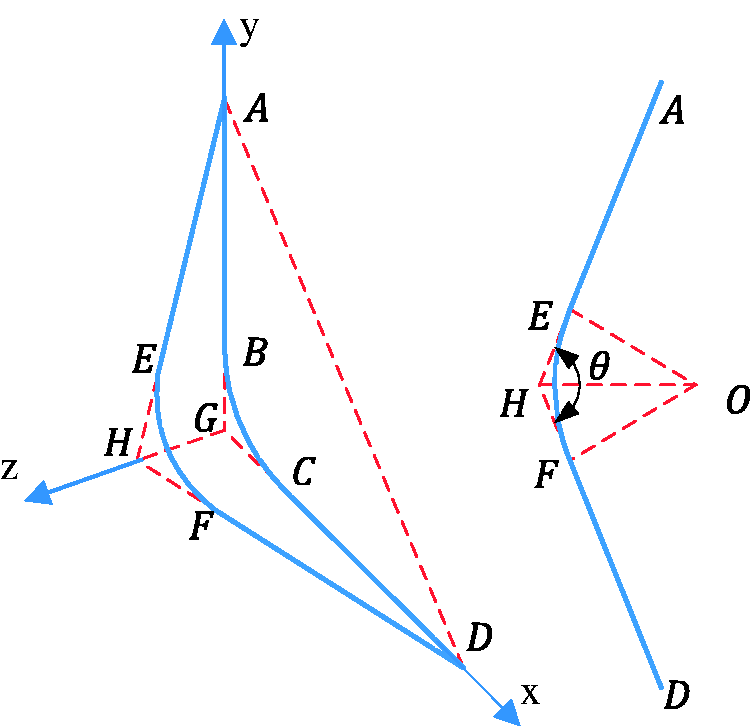
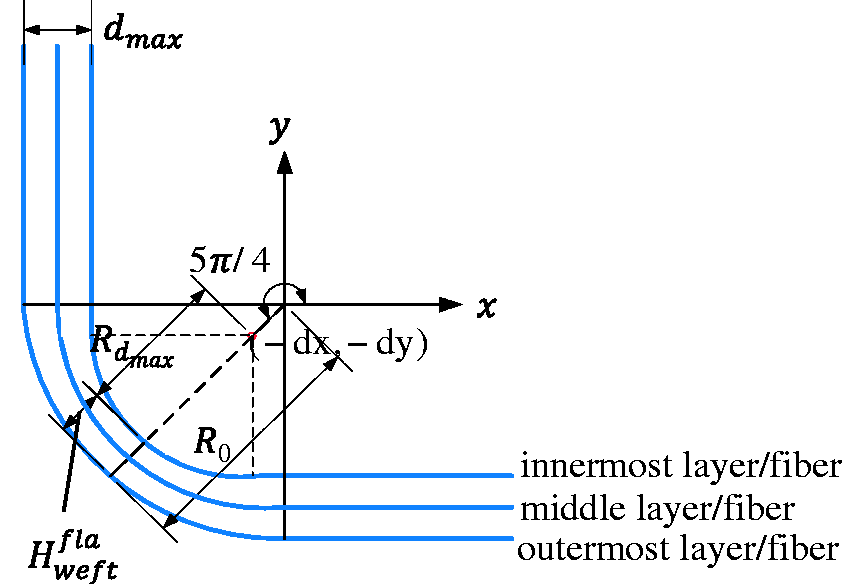
Out-of-plane fiber migration
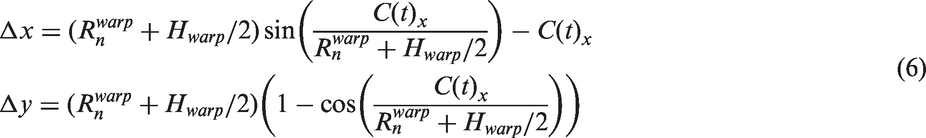
Since a proportion α of the defined fiber length difference is compensated by in-plane fiber rearrangement, the rest of the length difference, i.e. (1 − α) of the whole length difference, has to be compensated by out-of-plane fiber migration to meet the assumption that the folding process would not increase the arc length of each fiber within a 90° bent yarn. In theory fibers can migrate in both directions across the yarn width.
In Figure 9, LABCD is the arc of a fiber which had in-plane but no out-of-plane migration so that its arc length is given by

To calculate the arc length of a post-migration fiber LAEFD, it is assumed that its radius of curvature is still the same as LABCD. 
Also, in 
Hence, equation (14) is given by

From trigonometry we can say that

Hence, in 
The arc length of migrated fiber LAEFD is
Thus, the relation between fiber arc length differences caused by out-of-plane fiber migration can be represented by

Substituting equations (13) and (19) into equation (20), the displacement for out-of-plane migration w can be obtained for a fiber at a distance d away from the reference fiber.
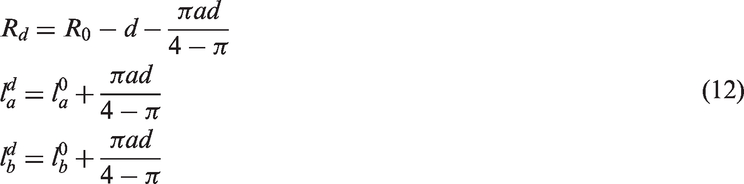
Yarn cross-section
The process of fiber migration resulting from bending is complex, as each single fiber may have a different value of α for its in-plane and out-of-plane migrations. Ideally, if all fibers on the same layer move with the same α and direction for out-of-plane migration, the cross-section of a weft yarn, assuming a square array for fiber packing, at Section A-A in Figure 2 would have a parallelogram shape as shown in Figure 10(b), where Figure 10(a) is the fiber arrangement before flattening with its left-hand layer as reference for in-plane migration (Figure 8). Since there are thousands of fibers in a single yarn, a large number of fibers presumably might migrate uniformly in the above way, i.e. without a change to their initial relative spatial sequence, as shown for the fibers represented by black dots in Figure 10(c) which remain in their ideal positions as in Figure 10(b). Meanwhile, a few fibers, not following the above ideal migration law, can penetrate into a position out of their own layers through more in-plane migration once out-of-plane migration of fibers on prior layers makes a space, as indicated by grey dots in Figure 10(c), which can cause a random serrated cross-section shape as observed in Figure 4. Additionally, a second possible cross-section shape is shown in Figure 10(d) if it is assumed fibers move with the same α but in both directions for out-of-plane migration. Hereafter the first large group of fibers following the pre-migration relative spatial sequence are named ideally migrated fibers, and the second small group are called randomly migrated fibers. Under this assumption, the values of α for the ideally migrated fibers are supposed to be identically denoted by Schematic cross-section of fiber arrangement for a weft yarn showing fiber migration mechanisms: (a) pre-migration, square packing fiber arrangement; (b) post-migration, idealized migration; (c) and (d) post-migration, possible realistic migration accounting for serrated cross-section shape. Yarn in-plane section view (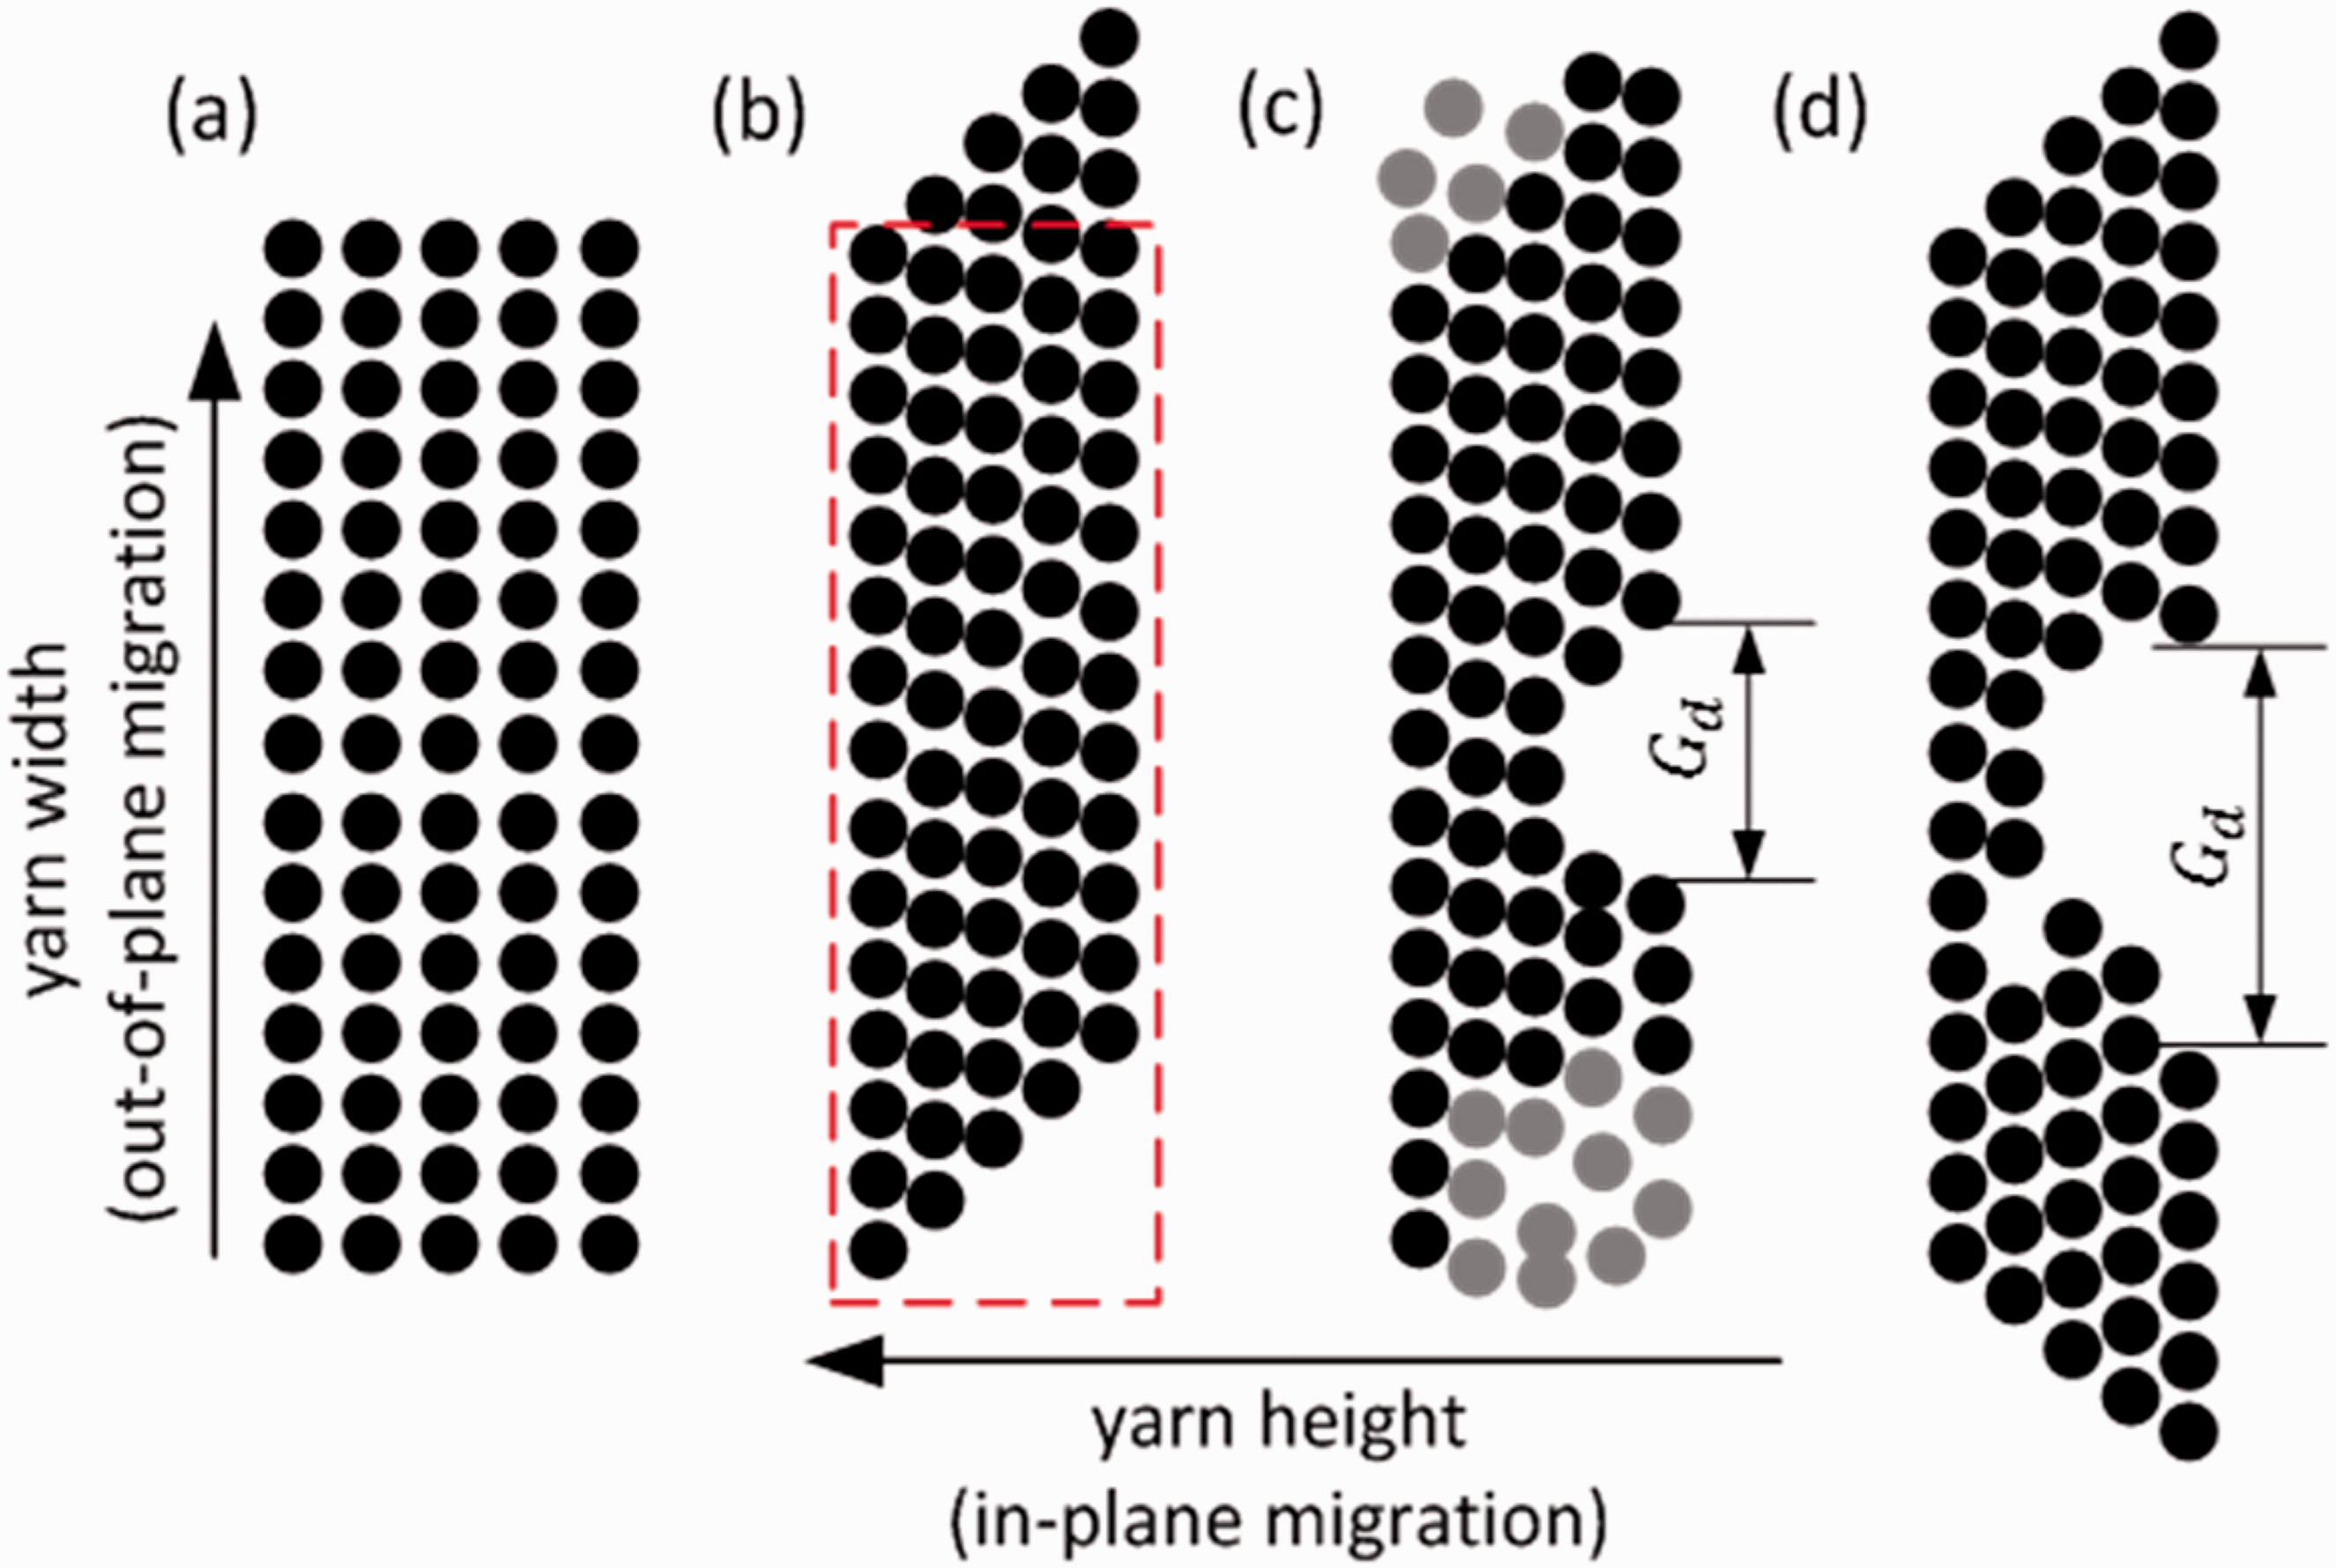
If the flattened yarn height (at Section A-A in Figure 2) can be measured from a μCT scan, the value of 

The yarn width is determined by the fibers that had out-of-plane migration. Irrespective of randomly migrated fibers and considering all fibers to be ideal ones migrating in the yarn width direction with an identical 
where df is the fiber diameter and nf is the number of total fiber layers along the yarn height direction before flattening; wk is the displacement of out-of-plane migration for a fiber on layer k.
In reality, ideally migrated and randomly migrated fibers coexist in a bent yarn so that a flattened cross-section can be near to rectangular with the observed gap (Figure 4) rather than a parallelogram (Figure 10 (b)) if all fibers are considered ideally migrated fibers. Some of the fibers, namely randomly migrated fibers, in the yarn extension do not have to move that much in the yarn width direction because there is enough space ahead of them to accommodate in-plane migration in the yarn height direction, in the meantime the bending force will prioritize in-plane migration. Therefore a rectangular cross-section is likely to be formed, and a rough prediction of weft yarn width extension 
However, it is not possible that different fibers on the same layer can move in both directions simultaneously for out-of-plane migration as shown in Figure 10(d), because the measured Gd is much smaller than double the value of maximum wk as calculated in the following section. Hence the predicted flattened yarn width can be expressed as

Validation
Three proposed models for warp yarn shifting, cross-section bending, and weft yarn cross-section flattening were compared to experimental data from the standard orthogonal weave region of the preform as listed in Table 1.
Warp yarn shifting
The value of Rm is 2 mm which equals the radius at the junction of the acrylic fixture contacting the preform. Based on equation (1), the radii of curvature of centerlines for warp cross-sections and weft yarns on different yarn layers can be obtained as listed in Table 2, which shows good agreement with the measured values.
Warp yarn shift measured and predicted results (10 measurements)
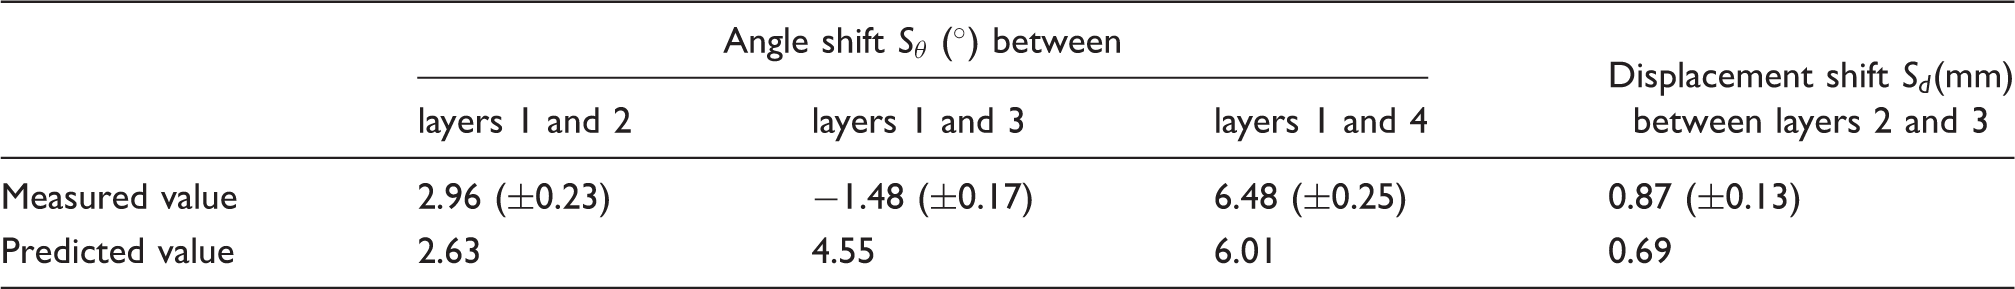
It is noticed that the measured angle shit between layer 1 and 3 is negative, which means the warp yarn on layer 3 has slid to the flange while folding. Also it is the same with displacement shit for yarns on layer 1 and 4 in the next warp stack.
Warp yarn stack shift can be observed but the trend does not always agree closely with the model since binder yarns influence the movement of warp yarns as well as yarn sliding induced by the weaving process.
Warp yarn cross-section bending
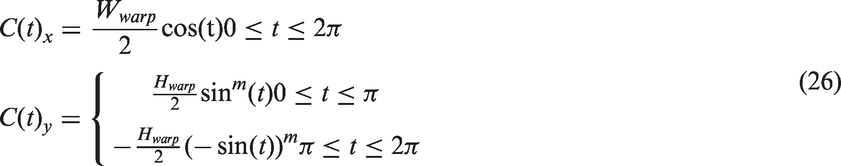
A bent cross-section shape can be obtained by the transformation defined in equation (7) on the basis of an original parameterized cross-section description. Figure 12(a) is based on an elliptical cross-section and its radius of curvature of centerline is 3 mm; Figure 12(b) is transformed from a super-ellipse (equation (26)) with m = 0.4 where radius of curvature of centerline of bent yarn cross-section is 2.4 mm.
Transformation of bent yarn cross-section shapes: dashed lines for original shapes and solid lines for bent shapes. (a) elliptical cross-section, (b) super-elliptical cross-section.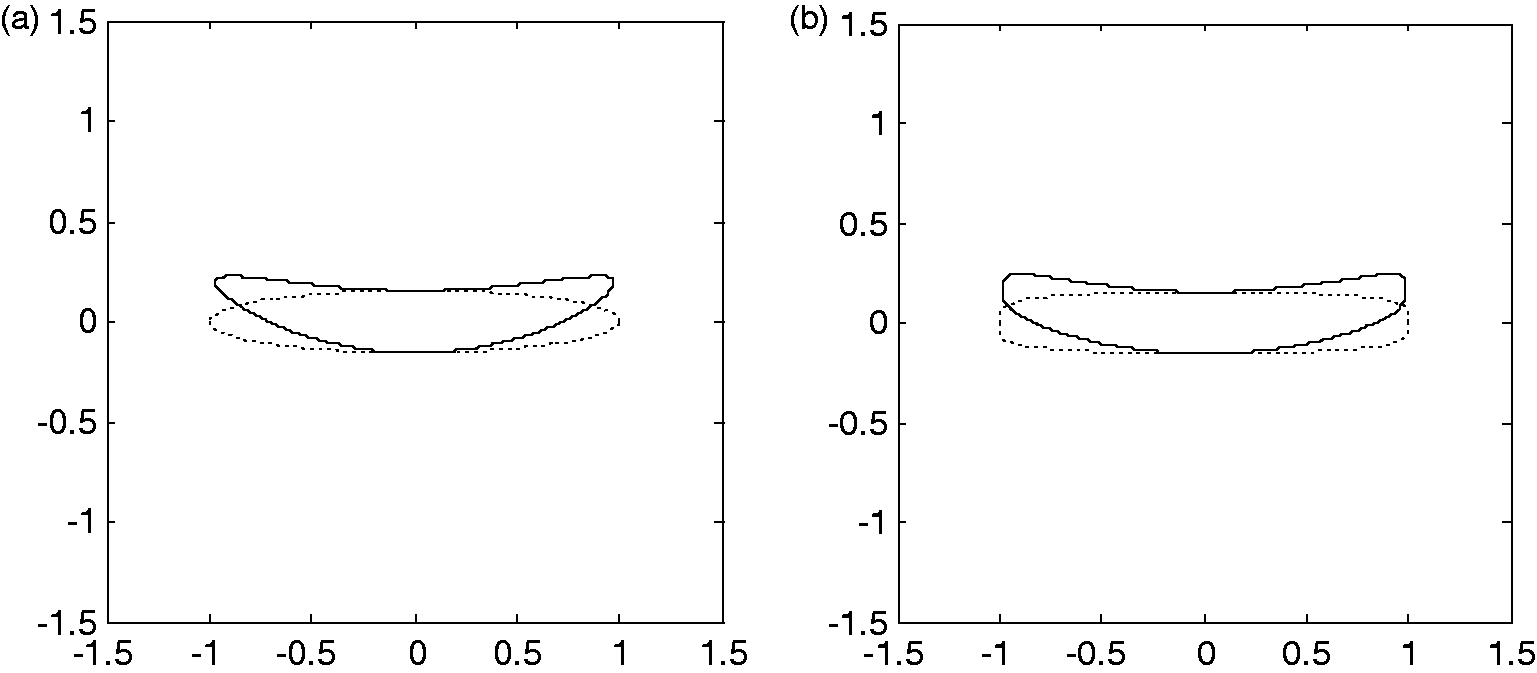
It is observed that a real warp cross-section shape for this preform in the flat region can be better approximated with a super-ellipse than an ellipse, thus validation of warp yarn bending is based on the cross-section function for super-ellipse (m = 0.4) with yarn height and width measured from the unbent region in the web, where equation (4) can be expressed as
Then the bent cross-sections for different radii of curvature can be plotted and compared with real yarns, as shown in Figure 13. The modeled cross-section gives good agreement with realistic bent cross-section shapes.
Model produced cross-section shapes in comparison with real yarns.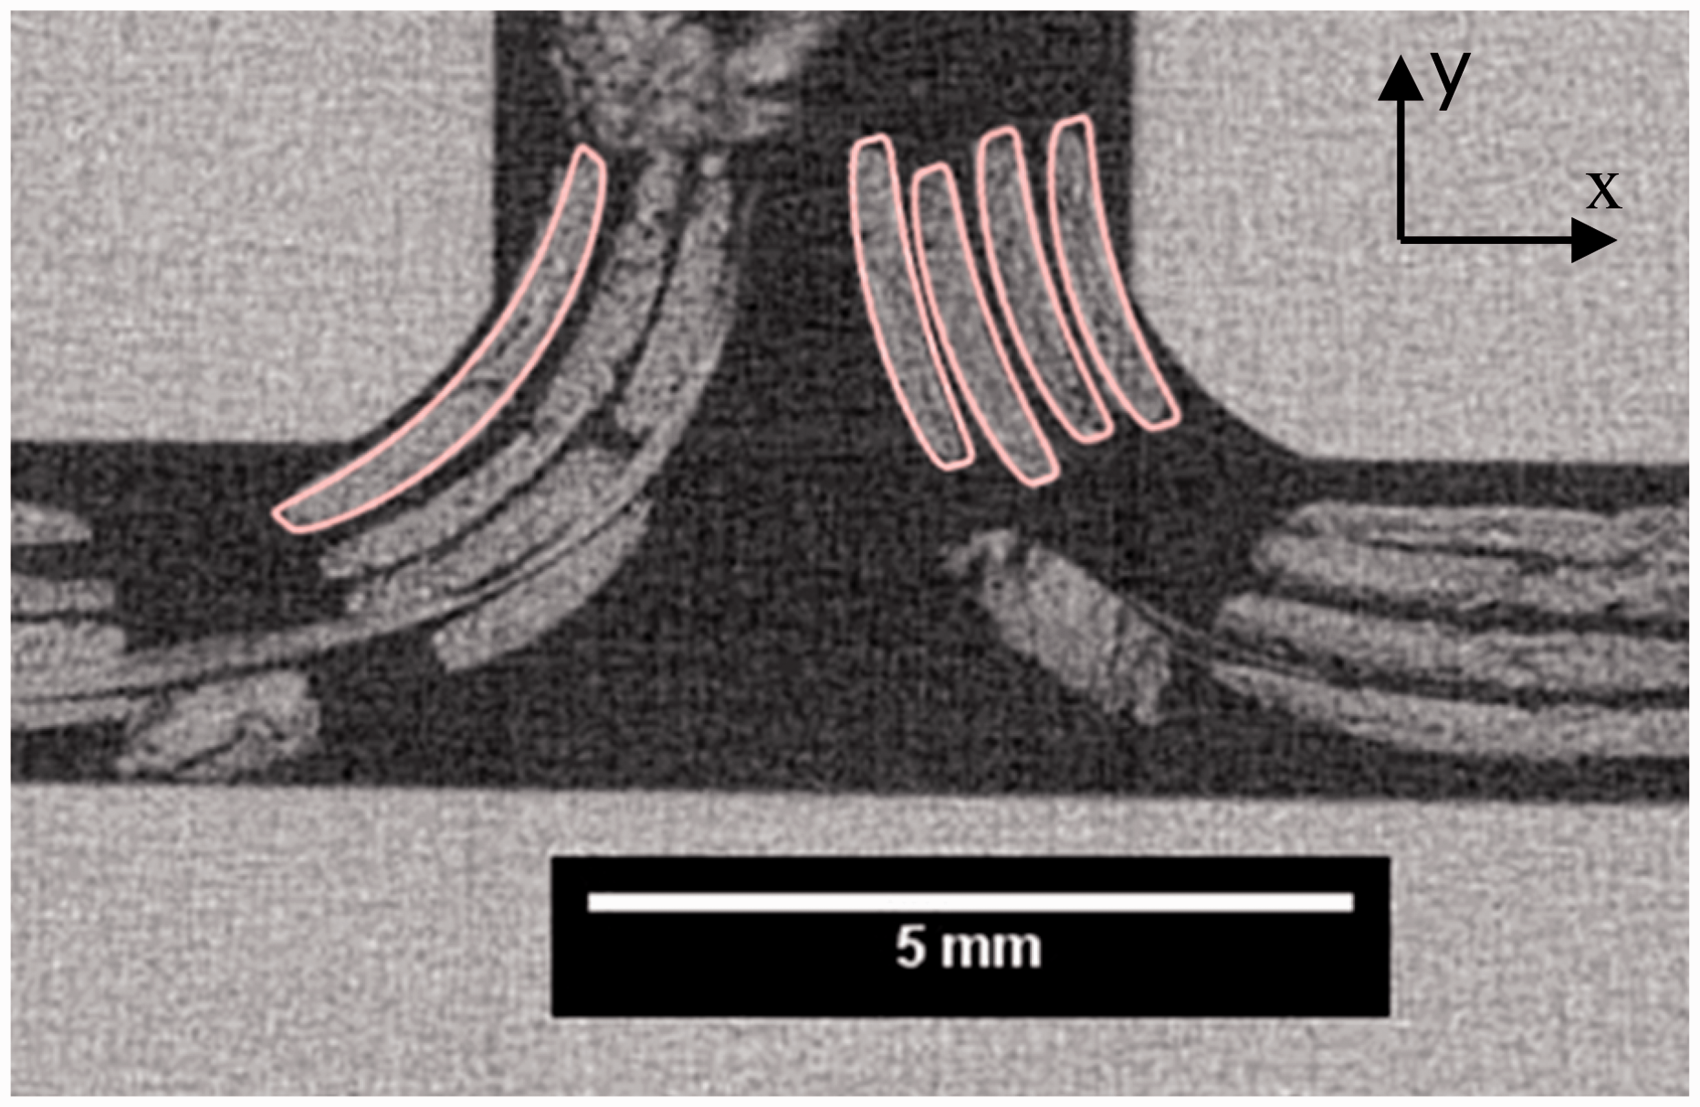
Weft yarn cross-section flattening
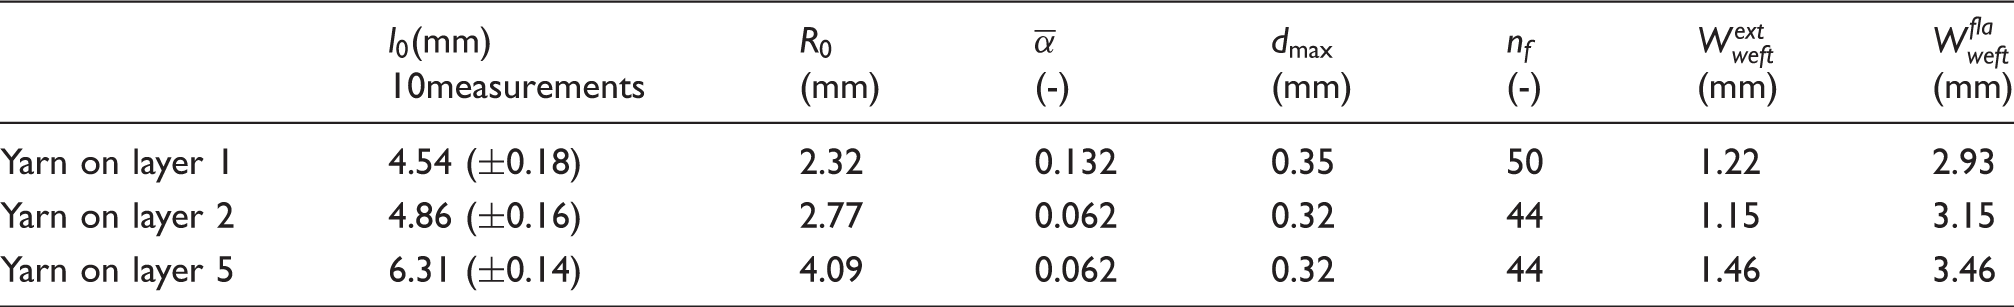
Validation of cross-section flattening was carried out for yarns on three different layers in order to cover the full radius of curvature values which are the most essential parameters in yarn bending. The three layers selected are layers 1, 2, and 5 in section A-A of Figure 4. Weft yarn cross-section transition length l0 is obtained from measurement for each layer, and radius of curvature of the reference fiber R0 is derived based on calculated radius of curvature yarn centerline and flattened yarn height.
The total number of fiber layers along the yarn height direction before flattening nf (equation (23)) is estimated based on yarn dimensions before flattening and filament count as well as the assumption that the cross-section was a rectangular shape with square fiber packing. Based on the flattened yarn height, Relative displacement for fiber out-of-plane migration. Parameters for the yarn flattening prediction model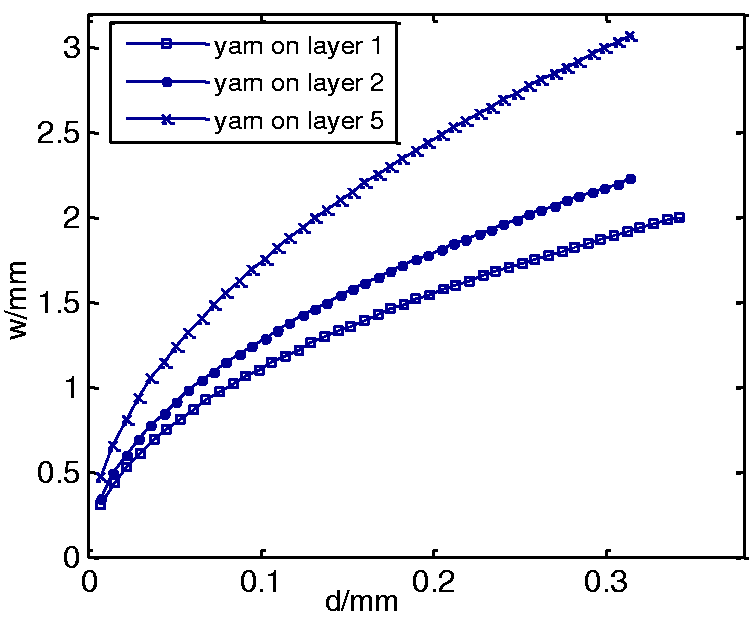
Furthermore, the measured yarn width and predicted yarn width for the flattened weft yarns are compared in Figure 15 and reasonable agreement is observed.
Comparison of measured and predicted yarn width for weft yarns.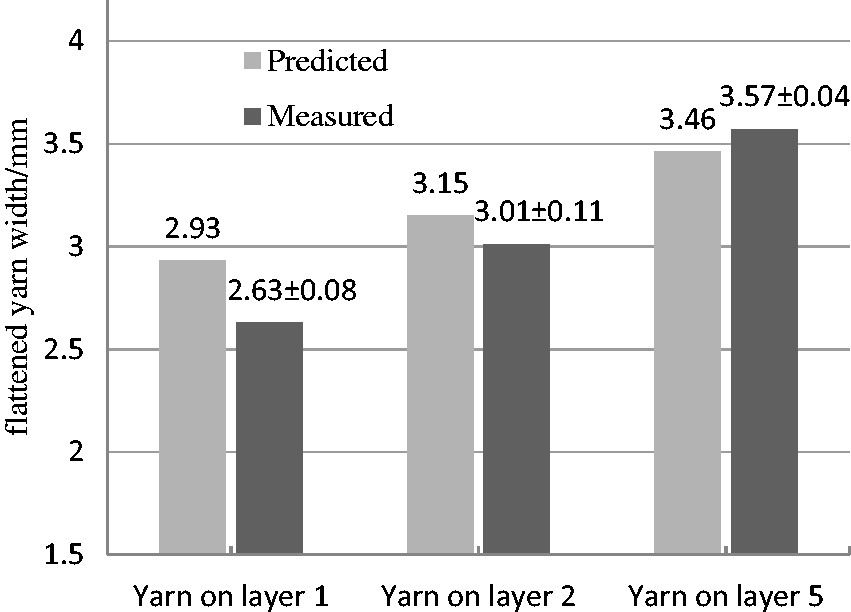
Although the prediction accuracy is good, the model is semi-empirical based on the input parameters of flattened yarn height and cross-section transition length. However, it is interesting that all the flattened weft yarns with different radii of curvature have nearly the same height while the length over which cross-section transitions occur seems to increase linearly with radius of curvature in bending, both of which are merit further investigation.
Conclusions
To characterize the relationship between the fiber architecture and composite mechanical performance, a numerical simulation requires a realistic geometric model as input. In this study, three geometric features, yarn shifting, cross-section bending, and flattening, caused by the bifurcation of a 3D flat woven preform for composite T-joints were identified by μCT analysis and approximated analytically. A simple model based on rigid body movement was used to approximate warp yarn shifting but the experimentally observed trend does not always agree closely with the model. The model would benefit from considering the influence of binder yarns on movement of warp yarns as well as yarn sliding induced by the weaving process but this would complicate the model significantly. Yarn cross-section bending was modeled by a transformation of the existing parameterized description of cross-section shape instead of proposing a new shape function, and good agreement was obtained when compared with μCT results. Lastly, weft yarn flattening was described in detail and a semi-empirical model was developed to predict the flattened yarn width and satisfactory agreement with experiments was observed. However, it is worthwhile to further study the preform compaction behavior and form a fully predictive model for yarn flattening.
Footnotes
Declaration of conflicting interests
The authors declared no potential conflicts of interest with respect to the research, authorship, and/or publication of this article.
Funding
The authors disclosed receipt of the following financial support for the research, authorship, and/or publication of this article: This work was supported by the Engineering and Physical Sciences Research Council (EPSRC), United Kingdom (Grant Number EP/IO33513/1), through the EPSRC Centre for Innovative Manufacturing in Composites.