
Abstract
3D woven fiber/epoxy composites as structural components have attracted great attention in the industrial and civil fields due to high resistance to debonding or delamination. Structural components are often subjected to the conditions of cyclic loading, which detrimentally affect the service-life and damage tolerance. In this research, the fatigue properties of 3D woven fiber/epoxy structural composites were discussed, where 3D woven fabrics were embedded in epoxy matrix to enhance their mechanical properties. 3D woven fabrics were classified by the geometrical structures of repeat vertical and inclined units. Based on the testing method, the fatigue properties of corresponding composites have been reviewed. The influence of the internal and external parameters on the fatigue properties were investigated by using various observation methods, and the failure modes were also analyzed. The theorical prediction models were reviewed according to testing method, and future trends and challenges were discussed. The critical review can provide valuable ideas and guidance for future fatigue studies in 3D woven composites.
Introduction
Three-dimensional (3D) textile structural composites possess more improved out-of-plane properties than corresponding two-dimensional (2D) composites due to through-the-thickness reinforcements [1]. The added third-directional fibers can provide additional stiffness and strength along the thickness direction [2]. 3D textile structural composites are various owing to the different processing of reinforcements, such as weaving, braiding and stitching [2–4]. 3D woven structural composites have attracted the special attention because of their advantages in terms of high specific strength, high fracture tolerance, delamination resistance capability, and ability to fabricate components with complex geometries [5]. In practical production, the reinforcements of 3D woven composites can be manufactured by using the standard 2D loom with only a few modifications, which greatly saves manufacturing costs [6]. By adjusting the quantity and material types of warp yarns, weft yarns and binder yarns, 3D woven composites preform can be produced to meet the special requirements of industry [7–9].
The discrepancy of fabric architectures affects the mechanical properties of the corresponding composites, many researches have been reported in recent years [10–13]. The reinforcements of 3D woven composites can be mainly divided into two categories, angle interlock fabrics and orthogonal woven fabrics [14]. According to the arrangements of binder yarns, each category could be further divided into layer-to-layer and through-the-thickness [15]. The topological relationship of four typical fabrics were displayed in Figure 1, and the sketches of fabrics were also proposed. The yarn systems in 3D woven fabrics are mainly along length (warp yarns), width (weft yarns) and through-the-thickness (binder yarns) directions, the quantity and arrangements of these yarn systems finally deduce the geometric structures [16–19]. Different types of 3D woven fabrics could be produced by adding or deducting the corresponding yarns [20]. The research works were mainly focused on one typical fabrics and corresponding composites, and the mechanical properties were fully analyzed.

The relationship of four typical woven fabrics.
Fatigue damage is one of the main failure modes of composite components, which is affected by various factors such as stress level, parameters of component materials, structural features and working environment [21]. The researches of composite fatigue mainly refer to the fatigue damage mechanism, fatigue characteristics (strength, stiffness change with time and its failure law), life prediction and fatigue design of composite components under alternating load. 3D woven composites experience fatigue in several ways, including cyclic stress fatigue, acoustic fatigue and thermal fatigue. Cyclic stress is the most common type of fatigue, and occurs by repeated elastic loading of the material [22]. Many researches experimentally investigated the cyclic stress fatigue properties of 3D woven composites, and the fatigue life for different stress levels, the damage evolution and the post-fatigue residual mechanical properties were studied.
Numerical study has become a tool for predicting the fatigue properties of textile composites [23]. The fatigue criteria of composites, such as crack initiation, propagation, failure and damage accumulation, mainly caused by the failure modes formed by their internal interactions. The effect of 3D weaving and consolidation on carbon fiber tows, fabrics, and composites was discussed [24]. The influence of fiber architecture on the mechanical properties of 3D woven composites were also investigated [25]. Due to the variety of reinforcement architectures, the fatigue tests limited the investigation of 3D woven composites. The mechanical properties of 3D woven composites were conducted based on geometrical models [26–28], mechanical models [29], finite element models [30–33], and multi-scale models [1,34–36]. Repeat unit was used to predict the mechanical properties [37]. Fatigue life prediction model is established based on fabric models, and the appropriate fabric model could simplify the calculation and increase efficiency [38]. The classification method of fabric models was proposed to describe the deformation mechanisms and predict the influence of fabric structures on mechanical properties [39]. Continuum macro-scale fabric models, approaches to generate the initial configuration of discrete 3D woven fabric models, and discrete fabric models were discussed in reference [14]. Based on the proposed models, many researchers have established the numerical models and methods to predict the fatigue life of 3D woven composites under different failure criterion. Fatigue life prediction and the evolution of composite fatigue damage were two main branches in the research of fatigue properties.
In this research, the fatigue properties of 3D woven fiber/epoxy structural composites are reviewed in testing and modelling strategies. 3D woven fabrics are classified by the geometrical structures of repeat unit. Two typical 3D woven composites, including 3D vertical and inclined woven composites, will be defined. Then, the fatigue properties of 3D woven composites under the cyclic loading will comment based on the testing method. According to the cyclic loading, including tension-tension (T-T), tension-compression (T-C) and compression-compression (C-C), and three-point bending (T-B), the experimental investigations are conducted by using various observation methods. The influence of the internal and external parameters on the fatigue properties are investigated, and the failure modes are also analyzed. Finally, the theorical prediction models are reviewed according to the cyclic loading, and future trends and challenges are discussed.
Geometrical structure of reinforcement
3D woven fiber/epoxy composites are composed of reinforcement and resin matrix, in which the fibers bear the most of the load during the processing. The diversity of 3D woven fabric determines the different performance of the corresponding composites. The orientation of fibers in fabrics, the fiber volume fraction and component materials were relative to the influence of the performance of counterpart after curing process. Figure 1 displayed a general category of 3D woven composites, and many reports have been proposed to analyze the influence of geometrical structure on the mechanical properties [40]. However, the various parameters of weave process lead to the diversity of 3D woven fabrics. It is limited to the category shown in Figure 1. Owing to the high symmetry properties of fabrics, repeat unit was used to represent the properties of 3D woven composites [2]. The classification and properties of 3D woven fabrics were also discussed in reference [2,41,42]. The investigations mainly consider the geometrical structure of fabrics, but not the mechanical properties.
Two main investigation, including the influence of binder yarns [43,44] and interlocking patterns [12] on the properties, were conducted. The results indicated that the effect of these two typical patterns showed the high difference. For binder yarns, the ratio of the Z- to Y-yarns/layer was proposed to study the contribution of binder yarns. Four levels, named 1:1, 2:3, 1:3, and 0:1, were adopted to analyze the proportion of binder yarns [43]. Also, Digital Image Correlation (DIC) and Acoustic Emission (AE) were involved to find the characteristics of binder yarns [44]. For enhanced out-of-plane properties, delamination resistance, and damage tolerance, 3D woven fabrics could increase the proportion of binder yarns when designing composites. For interlocking patterns, the effect on their mechanical properties was evaluated [12]. Three different types of interlock patterns, named warp interlock, weft interlock and bidirectional interlock, were adopted to manufacture the corresponding composites. To obtain the finally composites, the processes of resin transfer molding (RTM), vacuum assisted resin transfer molding (VARTM), and vacuum assisted resin infusion (VARI) were considered for high performance composite components. The mechanical properties of composites were analyzed with four different characterization techniques: tensile, impact, flexural, and dynamic mechanical analysis. The composites with different interlock patterns presented the different mechanical properties.
In this research, two categories of 3D woven fabrics are developed to optimize the application. One is 3D vertical woven fabrics, and the other is 3D inclined woven fabrics. As shown in Figure 2, the repeat units and two kinds of corresponding 3D woven fabrics were displayed. For 3D vertical woven fabrics, the repeat vertical unit occupied the whole inner part. The yarns in vertical unit consisted of three-directional yarns, set as x-, y- and z-directional yarns. Only these typical yarns in 3D vertical woven composites. Topological design in terms of Cartesian [7], three designs of a 3-by-3 weave [25], and imperfect orthogonal materials [45] are all belong to 3D vertical woven fabrics. The corresponding composites with vertical units exhibit the similar mechanical properties. For 3D inclined woven fabrics, the inclined yarns are existed in the repeat unit, and one or more of vertical yarns are contained. The various repeat units were reported in the past research, and the structural instability was mainly caused by the inclined yarns. Based on the architecture of reinforcement, the influence on the mechanical properties were studied. 3D crimps fabrics [46], shallow-straight and shallow-bend woven fabrics [47], fabrics with or without binder yarns [14], were proposed to study the effects on the mechanical properties of corresponding composites. Further on, novel 3D woven fabrics, such as bidirectional angle interlock fabrics [48] and fabrics based on group P4mm [49], were developed to improvement the performance and meet application requirement.

The repeat units and corresponding woven fabrics.
3D vertical woven composites are reinforced by 3D vertical woven fabrics, and only perpendicular yarn systems exist in the repeat unit. It showed better tensile behavior as compared to 3D inclined woven composites due to the presence of less crimp along the load direction. 3D inclined woven composites are various due to the geometrical structures of 3D inclined woven fabrics, and the proportions of inclined yarns influence the mechanical properties. 3D inclined woven composites displayed the highest capacity of energy dissipation in the high crimp directions. These two typical composites basically contained 3D woven fabrics studied at present. In the following study of fatigue properties of 3D woven composites, this category is introduced to review the research results.
Fatigue testing method
For 3D woven composites, a variety of fatigue tests can be done because of the different parameters, which main contained: (1) the amplitude control (stress or strain), (2) the testing frequency, (3) the loading direction (axial, bending, bi-axial), (4) the load ratio (tension/tension, tension/compression, compression/compression) [50]. There are numbers of parameters that affect the result of fatigue tests. They can be classified in two categories: parameters that are inherent to the material used, and parameters that are related with external influence. The internal parameters include types of resin and fibers, geometry of reinforcement, and the volume fraction of components. The external parameters contain the load effect, average stress, notch effect and environmental impact, etc. It is beneficial to improve the fatigue properties of 3D woven composite materials by analyzing the influence of internal and external parameters.
However, there is only limited information on the fatigue properties of 3D woven composites. The most of researches were mainly focused on the fatigue properties under T-T, C-C and T-B loads. In this section the fatigue properties of 3D woven composites have been determined for several cyclic stress conditions. Considering the effect of the geometric structures of reinforcement on the fatigue properties, the aforementioned classification of 3D woven composites is introduced to review the research status. Under each fatigue test method, the fatigue properties of 3D fiber/epoxy woven composites are reviewed, and the comparison study of two or more typical composites is also discussed.
Tension-tension fatigue
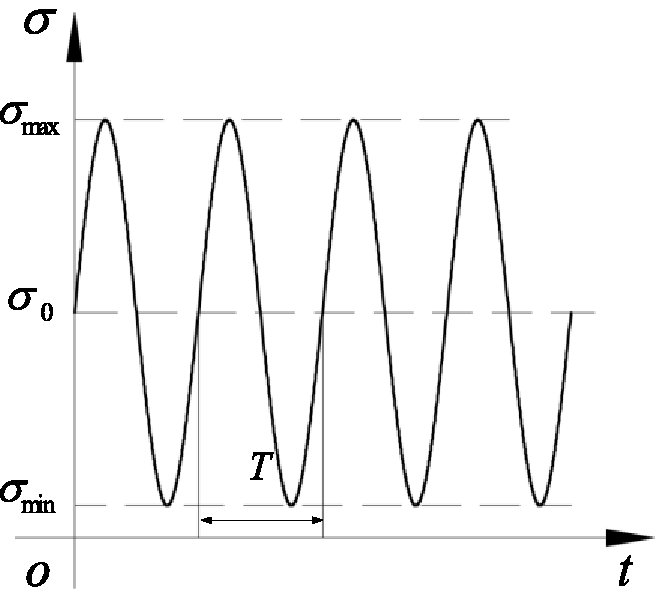
The uniaxial tension-tension fatigue test is the most widely used fatigue test, and the standard test methods of polymer matrix composite materials have been standardized in ASTM, GB/T and ISO [51–53]. For the fatigue tests of fiber/epoxy composites, the loading conditions are usually regular alternating loads. Figure 3 showed an example of a sine waveform with constant-amplitude and constant-frequency, and the explanations of the keys were also illustrated. The fatigue tests, which the maximum and minimum values of applied stress or strain were both under the tensile state, called tension-tension fatigue tests.
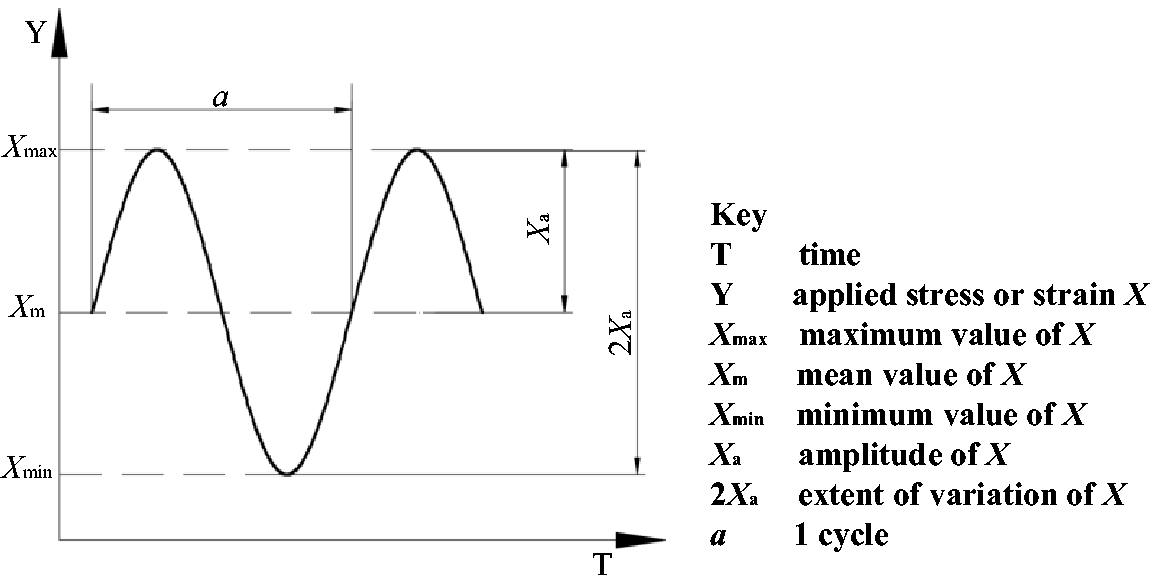
Example of sine waveform cycle [52].
3D vertical woven composites
The strain-controlled and stress-controlled processes are both used to investigate the tension-tension fatigue properties of 3D vertical woven composites. The investigations of 3D vertical woven composites were mainly focused on 3D through-the-thickness orthogonal woven composites (3DOWC). There are few reports on the fatigue properties of other types of 3D vertical woven composites.
Under the strain-controlled process, the experimental study on the mechanical response and damage evolution process were conducted [54]. According to the local damage distribution and characteristics of the specimens under a certain period load under different strain levels, the fatigue damage mechanism of the specimens was analyzed. The results indicated that the hysteresis loops were obviously under the initial loading. As the number of loading cycles increases, the area of hysteresis loops decreased and tended to be stable. It showed that the constant strain-controlled cyclic loading reduced the energy absorption of the specimens, enlarge the damage accumulation, and degraded the stiffness gradually. The initial mechanical properties were also discussed within the limits of N ≤ 50 (N was the number of cycles), and the maximum value of the initial tensile modulus and maximum stress were appeared when N equaled 5. Moreover, the damage mechanism of the specimens was also deduced. For the inner layer area of the specimens, the damage was mainly concentrated in the fiber bundles (warp, weft and binder yarn) infiltrated with resin, and the pure resin area filled in the gap of the fiber bundles. The damage was more obvious in the intersection area of 3D yarn system, mainly caused by the difference of mechanical parameters such as modulus, Poisson's ratio, temperature and thermal expansion coefficient.
Under the stress-controlled process, the maximum and minimum stress of fatigue tests are both tensile stresses. Figure 4 displayed the variation of the residual strength and stiffness of 3DOWC under the tensile fatigue loading [55]. The parameters of the specimens contained the fiber volume fraction of 52%, with roughly 17.6% fiber proportion in the thickness direction. All fatigue tests were performed at a loading frequency of 10 Hz and at a stress ratio of R=Xmin/Xmax= 0.1. Three stress levels of ultimate tensile stress (UTS) were selected. It could be seen that greater applied stress levels induced more total damage than lower stress levels. At the same stress level, increasing the number of load cycles decreased the residual strength and stiffness of specimens. It indicated that the higher the number of load cycles, the greater the difference of the fatigue residual strength and stiffness. Also, the comparative investigation of fatigue life of 2D laminated composites and 3DOWC indicated that 3DOWC possessed the higher fatigue residual strength and modulus, and the decrease in the fatigue sensitivity is possible due to through-the-thickness reinforcements.

Variation of the residual strength and stiffness under the tensile fatigue loading [55].
3DOWC are composed of three typical yarn systems, including warp yarns, weft yarns and binder yarns. Owing to the different volume fractions and categories of each yarn system, the tension-tension fatigue response in the principal directions are complicated. Many researches discussed the influence of the yarn system on the fatigue properties and on the damage initiation and development during cyclic loading.
Rudov-Clark and Mouritz investigated the tensile fatigue and delaminate properties of 3DOWC that contained different volume fractions of binder yarns [56]. As shown in Figure 5, the effect of volume percent of binder yarns on the fatigue life curve and the residual fatigue strength were displayed. The dimension of the rectangular specimens was 200 × 25 × 3.8 mm. R = 0.6 and loading frequency of 2 Hz was used in fatigue tests. Figure 5(a) presented the S-N curves of specimens with 0%, 0.3%, 0.5% and 1.1% binder yarns. It obviously showed that the number of cycles decreased with increasing binder yarn fraction. Figure 5(b) showed that the residual fatigue strength (measured after 106 load cycles) also drops with increasing binder yarn fraction. Both the fatigue life and strength of specimens decreased with increasing binder yarn fraction, which revealed that binder yarn fraction had an adverse effect on T-T fatigue properties for 3DOWC. The reduction to the fatigue properties of this typical composites was attributed to pre-existing defects and damage caused by the binder yarns. Observed using optical microscopy, the cracking of the polymer matrix surrounding the binder yarns was found to initiate fatigue damage in the specimens. It was also found that the crimp of the binder yarns might affect the fatigue properties.

Effect of the volume fraction of binder yarns on (a) the fatigue life curve and.
Carvelli et al. presented the description of T-T fatigue tests of E-glass fiber/epoxy 3DOWC in weft and warp directions, including the damage development [57]. The dimension of the rectangular specimens was 250 × 25 × 2.58 mm, and aluminum tabs were glued in the grip zones. To avoid the influence of tab zones and grip pressure, a fatigue test was considered ‘‘valid” if the specimen broke at a distance greater than 2 cm from the tabs. As shown in Figure 6, the number of cycles to failure in weft direction were larger than in warp direction for all of the applied stress levels. Vertical lines indicated average fatigue life under T-T cyclic loading with the ratio R = 0.1. According to the observation of using backlit technique, the absence of crimp and irregular ply nesting makes a strong positive effect on the fatigue behavior in the weft-directional loading case. 3DOWC was not affected by delamination under fatigue loading conditions.
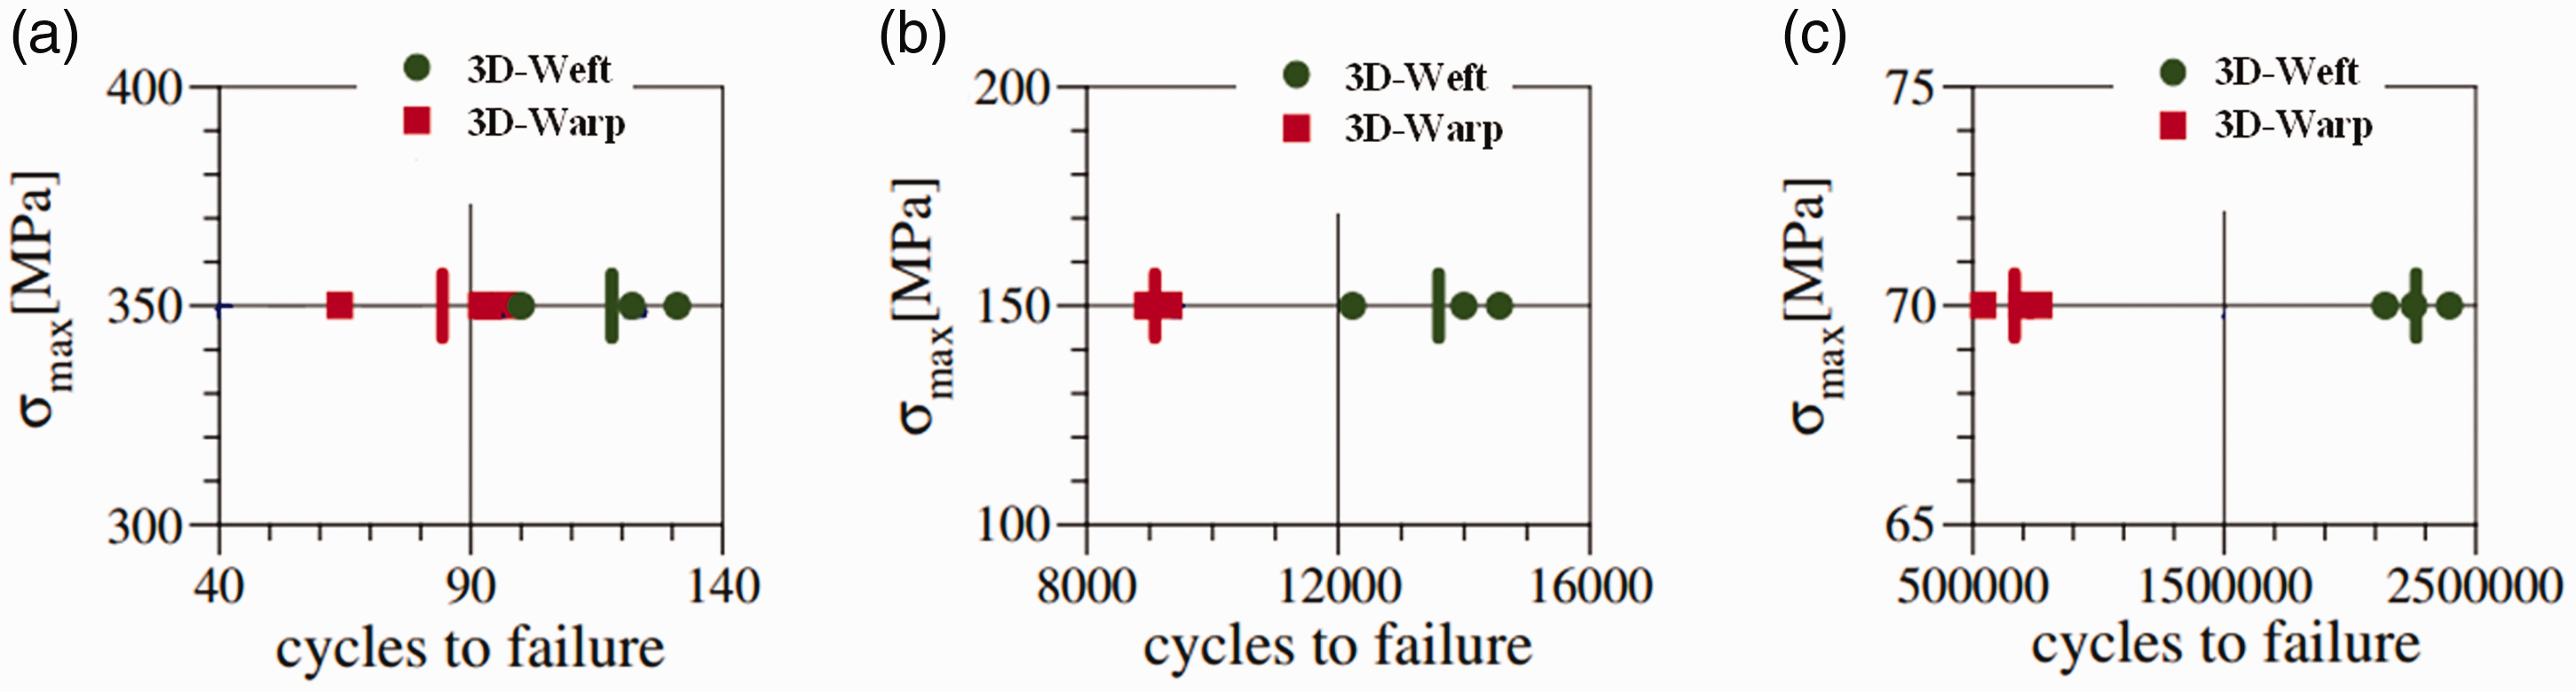
Comparison of the fatigue life at different maximum stress levels:.
Karahan et al. also conducted an experimental study of the in-plan T-T fatigue properties of carbon fiber/epoxy 3DOWC in warp and weft direction with R = 0.1 and 6 Hz loading frequency [58]. The effective length was average 170 mm between aluminum end tabs, and the width and thickness were 24.3 mm and 2.75 mm separately. For equal maximum cycle stress level, the fatigue life under warp-directional loading appeared about three times shorter than that under weft-directional loading. Corresponding to 30,00,000 cycle life, the range of the maximum cycle stress was the same (between 412 and 450 MPa), for both loading directions. It indicated that this stress range was above the static damage initiation threshold and the first static damage threshold. The second static damage threshold fell within this range.
As shown in Figure 7, the changes of the slope in load-displacement curve during cyclic loading were displayed, which represented the variation of the specimen stiffness. It could be concluded that the change of modulus before the final stage of fatigue failure did not exceed 5% of the ‘‘virgin’’ modulus of untested specimens.

Change of the normalized slope of the curve ‘‘force vs. displacement of the grips’’ with increasing number of cycles: (a) weft-directional tests; (b) warp-directional tests [58].
The variations of post-fatigue static modulus, strength and ultimate strain were also pronounced under 1,00,000 cycle, 5,00,000 cycle and 10,00,000 cycle fatigue loading with 450 MPa maximum cycle stress. Figure 8 showed the effect of prior fatigue tensile loading on the post-fatigue tensile static strength and ultimate strain in the weft and warp directions. It was impossible to find a mechanistic explanation to all these controversial effects. Further on, the damage development was also observed in both two directions. The results indicated that a combination of transversal cracks in the fiber bundles, boundary debonding cracks at the surfaces of fiber bundles transverse to the loading direction, and local debonding cracks parallel to the specimen facings. It was found that the crack pattern repeats in each unit cell of the specimens. The next damage development stage included increasing openings and lengths of the cracks, followed by the onset of splitting cracks among individual fibers which leaded to the ultimate failure.

Strengths (a) and ultimate elongation (b) measured in the tensile quasi-static tests without and with prior fatigue loading [58].
Compared with other typical composites with binder yarns, it was found that the increased volume content of z-reinforcement decreased the fatigue life of 3D woven, stitched and z-pinned composites [59]. The mechanism of fatigue damage indicated that the z-reinforcement were detrimental to the tensile fatigue life. The results showed that the reduction to the fatigue properties was due to microstructural damage to the composite caused by the insertion of the z-reinforcement. For 3D woven and stitched composites, debonding of the z-reinforcement and the development of cracks within the z-reinforcement itself were believed responsible for the large reduction to the fatigue lives. For z-pinned composites, breakage and damage to the load-bearing fibers by the z-pins were responsible for the reduction to the fatigue life.
The influence of carbon/aramid hybrid fibers on the T-T fatigue properties of the composite was also analyzed [60]. Using aramid fiber as binder yarns of this typical carbon fiber composites, it was effective to further improve the fatigue life of specimens. When carbon fiber and aramid fiber were mixed in the load direction, the in-plane strength and stiffness of the specimens were reduced, as well as the fatigue life.
Fatigue tests were performed by applying a cyclic interlaminar load to thin 3DOWC specimens at a frequency of 10 Hz and R = 0.1 [61]. The specimens were rectangular-shaped coupons measuring 220 mm long and 25 mm wide. The effect of binder yarns on the model I delamination fatigue properties of 3D woven composites with thin fabrics were experimentally determined. The results proved that 3D woven composites can increase the no-growth fatigue strain limit, and the improvement increased with the binder fraction. The steep inclined angle of binder yarns affected the crack bridging traction load, strain energy absorption and failure mechanism. With the traction load being lower but the traction energy being much higher than an orthogonal yarn. The results revealed that the fatigue resistance increased progressively with the volume content of binder yarns. Also, the mode I and mode II interlaminar fatigue properties of the hybrid composites (carbon fibers/EMAA filaments) were discussed [62]. The fatigue resistance of this 3D hybrid composite was compared with 3D textile composites containing only one of the two binder yarns. Compared to the unmodified laminate, the hybrid binder yarns increased the mode I and mode II interlaminar fatigue resistance by ∼800% and ∼200%, respectively, while simultaneously providing the in-situ healing of fatigue-induced cracks. The improvement to the fatigue crack growth resistance of the 3D hybrid textile composite was much greater under mode I compared to mode II interlaminar cyclic loading.
The tension-tension fatigue properties of this typical composites measured for both on-axis (0/90) and off-axis (±45) fiber orientations at elevated temperature (Tright = 329 °C) in laboratory air [63]. For the 0/90 fiber orientation, the fatigue run-out of 2 × 10⁵ cycles was achieved at 64% UTS. For the ±45 fiber orientation, the fatigue run-out stress was 52–55% UTS for the specimens. It was found that the off-axis loading would result in diminished load carrying capability and fatigue properties of the composites under tension-tension cycle loading. The binder yarns increased the delamination resistance of the specimens. The results revealed that extensive matrix cracking, fiber bundles rupture and pull-out were the main failure mode, and no ply delamination. The fatigue durability was reduced by the presence of the binder fibers. Moreover, the fatigue properties of two unitized composites comprising a polymer matrix composite and a ceramic matrix composite were studied at elevated temperature [64]. The results indicated that the composite was subject to combined tensile and bending stresses during T-T fatigue tests. Non-homogeneous deformation and accelerated damage growth ensue, fatigue durability was degraded. It was recognized that fatigue damage mechanisms in the unitized composites were complex.
3D inclined woven composites
The researches of fatigue properties of 3D inclined woven composites were mainly discussed the composites with angle-interlock structures (3DAWC). The T-T fatigue properties of 3D inclined woven composites were investigated by using the acoustic emission (AE) technique, light microscopy and micro-CT under the sinusoidal wave-form cyclic loading with the frequency of 5 Hz and the stress ratio R = 0.1 [65]. Three stress levels (40%, 50%, 60%) were selected for the fatigue tests.
The S-N curve, load-extension curves, damage index and maximum extension vs. percent life curves were shown in Figure 9. The S-N curves, as shown in Figure 9(a), indicated that the number of cycles to failure decreased as the applied stress level increased. Figure 9(b) displayed the load-extension hysteresis loops to evaluate the progression of damage during fatigue loading. It revealed that extension increased when the number of cycles increased, which was attributed to progressive and cumulative fatigue damage. The enveloped area of each cyclic loop increased as the fatigue test proceeded, indicating that the damage and energy dissipation within the composite increased. Damage index curves were given in Figure 9(c) to illustrate the mechanical degradation of the specimens. Damage index have been defined in terms of elastic modulus, value range between 0 and 1. As shown in Figure 9(c) and (d), three distinct stages of progressive fatigue damage were characterized, and the characteristic damage modes were elaborated. AE detection and interrupted tests were used to characterize the three stages of progressive fatigue damage. The results indicated that Stage I (initial 10% of fatigue life) was characterized by rapid damage accumulation including matrix cracking, while Stage II (10–80% of fatigue life) featured a more gradual and steady increase in damage including interface debonding and yarn cracking, and Stage III (80–100% of fatigue life) showed rapid damage accumulation and failure with yarn breakage. Furthermore, it was found that stress concentrations arose at regions of maximum yarn curvature where weft yarns cross warp yarns. The fabric architecture affected crack initiation and growth under T-T fatigue conditions.
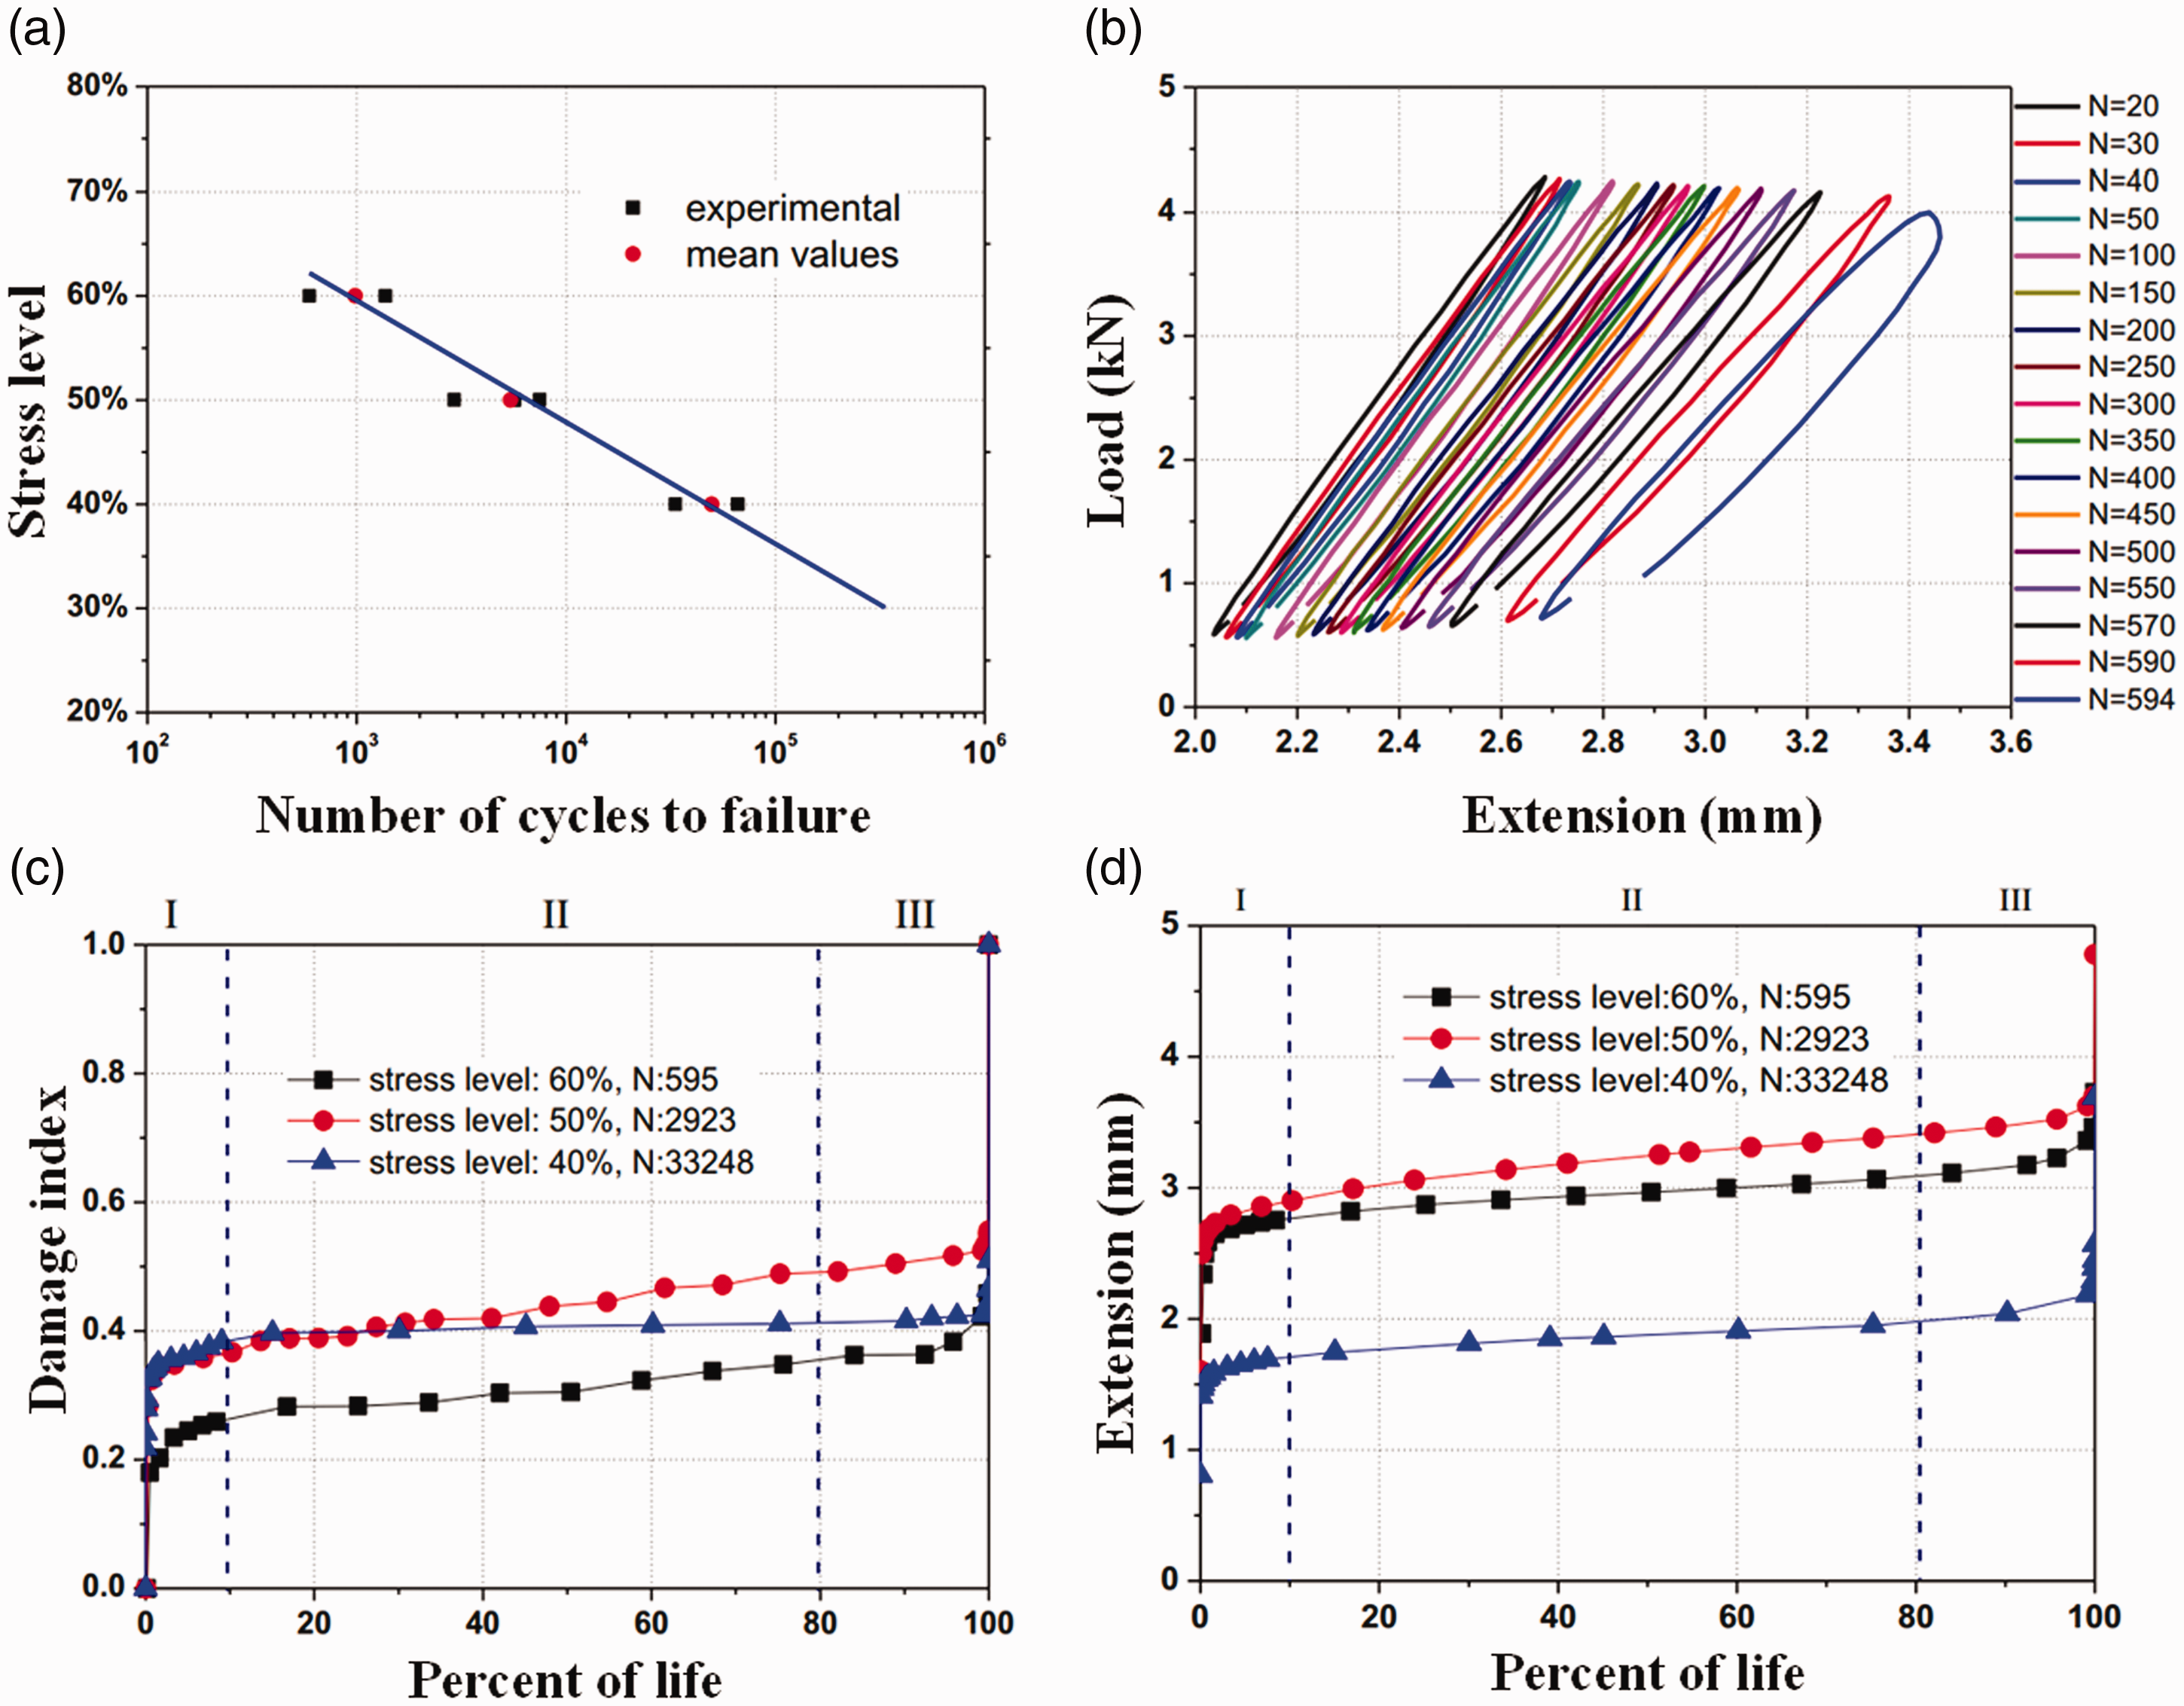
Typical curves of fatigue degradation (a) S-N curve; (b) Load-extension hysteresis loops; (c) damage index as a function of percentage of life; (d) maximum extension curves for three stress levels [65].
Tsai et al. studied the T-T fatigue properties and damage processes by comparing unnotched and notched three-layer and five-layer composites with 3D vertical woven fabrics [66]. As shown in Figure 10, the normalized S-N curves of these four typical specimens were displayed. The three-layer specimens showed the higher sensitivity and lower fatigue limit strength than five-layer specimens for both the unnotched and notched specimens. The drilled hole did not affect the fatigue sensitivity of these specimens. The damage process for the unnotched specimens was summarized and divided into five stages. The stage (1) and (2) were the initial damage stages occurring within about one tenth of the fatigue life. The stage (3) and (4) were the critical damage stages from about one tenth of the fatigue life to the near failure of the specimen. The stage (5) was the final stage. It described as follows: (1) transverse surface cracks occurred and grew into the warp yarns. (2) transverse matrix cracks were generated in the warp yarns due to strain concentration. (3) primary debonding between the warp and weft yarns, and weft fiber breaking. (4) The debonding grew and propagated along the interface between the matrix and the weft yarn, and it might deflect into the matrix as well. In addition, the weft fiber breaking increased. (5) The damage accumulation localized and induced rupture of the specimen.

Normalized S-N curves of three-layer and five-layer plates [66].
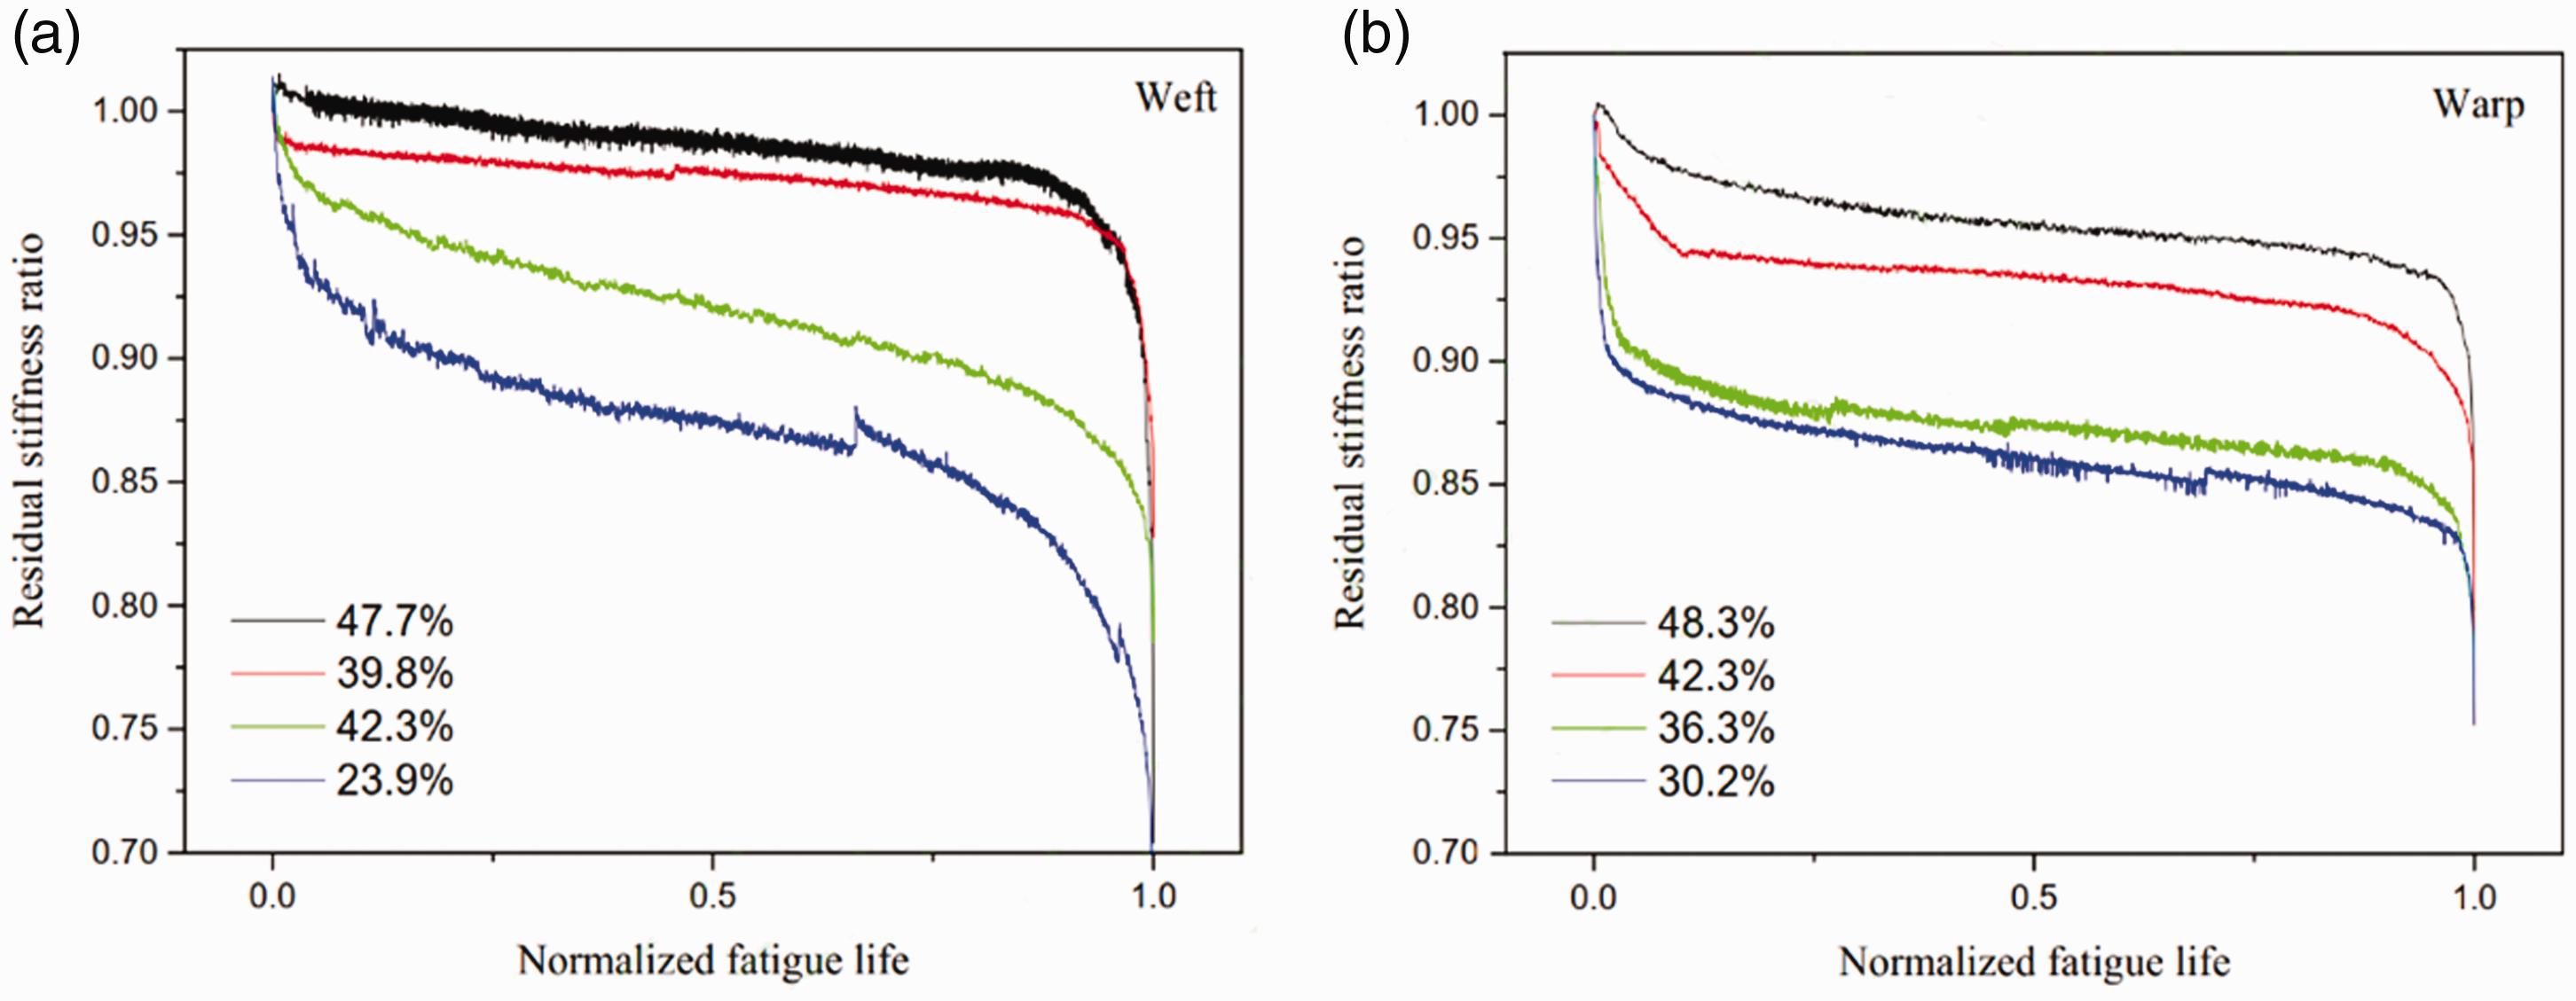
Temperature has significant effect on the fatigue properties of 3D woven composites. To further understand the fatigue properties of 3D woven composites at various temperature, T-T fatigue tests of 3DAWC at ambient (AT) and un-ambient temperature (UAT) were conducted [67]. The dimension of specimens was 300 mm × 25mm. The fatigue tests were run at a stress ration R = 0.1, a frequency of 10 Hz in compliance with test standard ASTM D3479 [51]. The normalized stress-life-temperature curves of this typical composites were illustrated in Figure 11(a), the residual stiffness E(n)/E(0) as a function of the normalized fatigue life n/Nf was illustrated in Figure 11(b). The results suggested that the fatigue properties of the specimens obviously correlated with temperatures.

Curves at various temperature (a) Normalized stress vs. cycles; (b) Normalized stiffness vs. fatigue life (cycles) under maximum applied stress of 80% UTS [67].
The hysteresis loops and residual strength were recorded, shown in Figures 12 and 13, in order to developed the fatigue characteristics and damage mechanism. Figure 12 showed that the shift of hysteresis loops occurred at different temperatures and stress levels, which revealed an elongation of warp deformation under the cycle load. The right shift of hysteresis loop and the extent of tilting were related to the soften of matrix and micro-damage. Under the temperature of 20 °C and 180 °C, the high temperature is easier to occur the matrix softening and micro-damage. Compared the stress level 70% and 80%, the decrease of tilt at a lower stress level was obviously lower than that at a higher stress level at the same temperatures.

Hysteresis loops from fatigue testing for various temperature and stress levels [67].
Residual strength curves of specimens at (a) AT and (b) 180 °C [67].
The residual strength curves were shown in Figure 13. The residual stiffness showed a linear drop trend and the residual strength could be enhanced after certain cycles at 180 °C. Results showed that the fatigue life of this material at UAT had a sudden increase phenomenon, alongside an abnormal behavior existing in residual strength. The UAT specimen experienced 106 cycles, and the mechanical properties were strengthened. The results attributed to the reduction of inclination angle of warps induced by easy-to-deformation pure matrix at UAT. Moreover, the fatigue failure locations were mostly located on the intersection of warp and weft yarns, which was similar with the static fracture locations.
Comparative study
The fatigue properties of 3DOWC and 3DAWC were characterized through a set of T-T fatigue open-hole tests using a thermal camera [68]. Most of the fatigue damage initiated and propagated relatively rapidly within the first 105 cycles and slowed down afterwards. 3D vertical composites showed more damage sites and more rapid damage growth than 3D inclined composites. The orthogonal composites had larger surface damage area than the angle interlock weave. The post-fatigue residual strength of both specimens showed less than 10% difference from the averaged open-hole tensile strength. The fatigue specimens were loaded with maximum stress of about 60% of the ultimate failure stress and no complete fracture occurred after 5 × 10⁶ cycles. Overall, 3DAWC showed higher open-hole static strength and exhibited fewer damage sites during T-T fatigue open-hole tests than 3DOWC.
The T-T fatigue properties of two different 3D vertical woven composites were also discussed. A comparison of the fatigue properties of 3D woven composites with through-the-thickness angle interlock and layer-to-layer orthogonal fabric architectures loaded parallel to the warp yarns [69]. Transverse cracks soon became uniformly distributed in weft yarns, and a higher crack density was found in through-the-thickness angle interlock composites. Transverse cracking initiated in the fiber rich regions of weft yarns rather than the resin rich regions. According to the delamination in the failed specimens, debonding between the binder yarns and surrounding material was the predominant damage mechanism of layer-to-layer orthogonal woven composites. The results showed that the transverse cracks have a strong influence on stiffness and fatigue properties in both two woven structures. It was found that the matrix cracks interact with the transverse cracks in both woven structures.
Tension-compression and compression-compression fatigue
The T-C fatigued tests of 3DAWC were conducted [70,71]. Figure 14 showed the hysteresis loops of this typical composites for a specific cycle. There were no significant changes in property evolution under the cycle period 104, and the trend initiated at 104. Finally, the stiffness reduction apparently occurred when the cycle period reached 105. The variable curves of residual stiffness ratio were also obtained to describe the property evolution during the fatigue tests.

Hysteresis loops of one T-C fatigue test [71].
As shown in Figure 15, the ratio of residual stiffness of T-C fatigue specimens was influenced by the stress level, and the curves could be divided into three main stages. In the initial stage, the stiffness of the specimen decreased rapidly, and then enter the second stage. In the second stage, both the residual stiffness ratios in weft and warp tend to a slow and stable stage. In the last stage, the stiffness decreased rapidly again after reaching a certain proportion of the fatigue life, until the fracture failure. With the decrease of the stress level, the proportion of the second stage became smaller, while the proportion of other stages became larger.
Residual stiffness ratio of T-C fatigue specimens [71].
Three stages of the fatigue damage process mainly contained the failure of matrix, transverse crack propagation inside the yarns and the fracture of yarns occur in sequence. The major failure modes, including the crush and debonding of matrix, the avulsion and the fracture of yarn, were observed under an optical microscope. Drawing the test data in the double logarithmic coordinate system, the fitting S-N curves of T-C fatigue were obtained, as shown in Figure 16, and the curves showed high linearity and low dispersion both in weft and warp directions.

S-N curves of T-C fatigue for composites [71].
The C-C fatigue properties of 3D woven composites with layer-to-layer angle-interlock, through-thickness angle-interlock and through-thickness orthogonal fabrics were investigated by experiments [72]. From the observation of section specimens, the results indicated that the fatigue process was the accumulation of damage within individual yarns. It was found that kink band formation was the principle mechanism of fatigue failure, and the failures of three typical composites were influenced by the same geometrical flaws in monotonic loading. Figure 17(a) showed a kink band in a stuffer of a specimen with through-the-thickness angle interlock woven fabrics. The schematic of the tow configuration associated with the stuffer misalignment around the site of the kink band were displayed in Figure 17(b). The damage was most rapid where the misalignment of the yarns was greatest, suggesting that it was driven by axial shear stress in yarns.

(a) A kink band in a stuffer of a specimen of through-the-thickness angle-interlock woven composites. (b) Schematic of the tow configuration associated with the stuffer misalignment around the site of the kink band [72].
Bending fatigue
The regular alternating loads are used as the loading conditions to test the bending fatigue properties of composites. As shown in Figure 18, the ratio of maximum stress σmax and minimum stress σmin could be calculated, and stress ratio R=
Sinusoidal load under bending fatigue test.
The bending fatigue tests were conducted at different stress levels, and have been reported in recent years. At present, the fatigue researches of 3D woven composites are mainly focused on three-point bending fatigue tests. The S-N curves, bending stress-deflection curves and residual strength of the composite specimens were also obtained to describe the bending fatigue properties of 3D woven composites. S-N curve is an important factor to describe the bending fatigue properties of 3D woven composites. Stress level is the ratio of σmax and σu (Maximum stress under quasi-static bending). The number of times that the specimen can withstand alternating stress cycles is the fatigue life of materials. For the description of stiffness degradation, bending stress-deflection curves were obtained in the experiment. Due to the damage of 3D woven composites during the bending fatigue tests, the irrecoverable deformations were generated to form the hysteresis loop. Calculated the stiffness of each loop, and the variation curves of the residual stiffness could be obtained. That is to say, the changes of bending modulus in fatigue tests could be presented. The stiffness of 3D woven composites degraded under the bending fatigue load, and the degradation of material performance is also reflected in the change of the maximum and minimum deflections of the material during the fatigue load.
3D vertical woven composites
As shown in Figure 19, four typical curves were displayed to describe the normal 3D through-the-thickness orthogonal E-glass fiber/Epoxy composites [73]. Figure 19(a) showed the S-N curve, which was obtained by fitting the test data according to the equation. It could be obtained that the bending fatigue limit was around 35%. The fatigue damage cannot occur under 35% stress level. The fitted curve indicated that the dispersion degree was increasing with decrease of the stress level. The description of stiffness degradation was adopted an example of specimens under 60% stress level, and with 22,821 cycle numbers. The bending stress-deflection curve, showed in Figure 19(b), was the variation of hysteresis loops. The area of hysteresis loop increased with the increasing number of cycles. The elastic modulus of specimens after certain cycle loading could be calculated, and the change of modulus were displayed in Figure 19(c). The variation of residual stiffness exerted three-stage changes. In stage I, the stiffness declined rapidly owing to the cracks burgeon in epoxy. In stage II, the cracks spread among the component of composites, especially at the interface between fibers and resin. In stage III, the stiffness dropped sharply until the last damage. The reason was that the fiber broken occurred after reach 97% of the fatigue life. The load bearing capacity of specimens was reduced, and the amplitude of variation was increased. The variations of the maximum deflection and minimum deflection were also exhibited three-stage, as shown in Figure 19(d).

Four typical curves of 3 D through-the-thickness orthogonal E-glass fiber/Epoxy composites [73].
To investigate further, acoustic emission (AE) detector was introduced to illustrate the fatigue stress level of 3D orthogonal glass woven composites [74]. Under the condition of three-point bending fatigue load, the characterizations of three-stage failure process and crack propagation behavior were observed and clarified. The results indicated that the critical load levels were 50% and 90%. The S-N curves and stress-strain curves along 0° and 90° directions were obtained in Figure 20. Figure 20(a) and (c) were the S-N curve and stress-strain curve along 0° direction, separately. Corresponding (b) and (d) were the curves along 90° direction. It observed that the fatigue life of the specimen in 90° direction could sustain longer than that in 0° direction under the same stress level. This is largely due to the internal geometric structure of reinforcement. The stress-strain curves, as shown in Figure 20(c) and (d) under 70% stress level, concluded that the fatigue damage attributes to the accumulated failure of the specimen. The area of the hysteresis loop and the stiffness degradations in the different directions also presented the three-stage changes, and the residual strength of specimens were measured. The detailed failure process was analyzed using the AE detector, which were significant to guide the application of this typical composites.

Fatigue curves of 3DOWC: (a) S-N curve in 0°, (b) S-N curve in 90°, (c) Stress-strain curve in 0°. (d) Stress-train curve in 90° [74].
The fatigue properties of ultra-thick 3D through-the-thickness orthogonal hybrid composites were investigated [75]. The warp and weft yarns are E-glass fibers (2400Tex), and binder yarns are aramid fibers (110Tex). The fatigue residual strength and stiffness were evaluated under three-point bending fatigue tests. The degradations of strength and stiffness were also presented three-stage changes. The relationship between deflection and cycle load was discussed both in warp and weft direction. Due to the high fiber volume fraction and high stiffness, the fatigue properties in weft direction were better than that in warp direction.
To enhance the fatigue properties of 3DOWC, interfacial modification was proposed to modified the properties of reinforcement [76]. The modification improves the binding force between fiber and resin. Comparing the modified and unmodified specimens, the bending fatigue properties in 0° and 90° were both improved after the modified process, and the capability of resistance to fatigue deformation increased.
The fatigue flexural properties of 3D orthogonal carbon/glass fibers hybrid composites were investigated, showed better mechanical properties than traditional composites reinforced with one kind of fibers [77]. The fatigue properties of the 3D orthogonal carbon/glass fibers hybrid composite were superior to the laminated carbon/glass fibers hybrid composite since binder yarns were beneficial to resist the interface failure. Furthermore, the stress levels contributed to the variations of the failure modes of the composites under three-point bending fatigue loading.
3D inclined woven composites
The three-point bending fatigue tests of 3DAWC were conducted under the different bending stress levels [78–80]. The specimens were constituted by glass fiber tows and polyester resin. The fiber volume fraction of the specimens was approximately 54%. The tests were conducted with the frequency of 2 Hz and the stress ratio R = 0.1. Five stress levels (80%, 75%, 70%, 65%, and 60%) were adopted in the tests. As shown in Figure 21, the bending fatigue properties were generally discussed based on the S-N curves, stress-deflection curves, bending modulus-cycles curves and deflection-cycles curves.

The curves of the 3DAWC: (a) S-N curves, (b) stress-deflection curves, (c) bending modulus-cycles curves and (d) deflection-cycles curves [79].
The S-N curves found that the fatigue life decreases with the increase in the stress level, and the specimens did not fail at over 5 × 10⁵ cycles under the stress level of 60%. As shown in Figure 21(a), a linear fitting equation was introduced to fit the curves according to the 11 valid results. With the increase of stress level, the fatigue life presented the downward trends. Figure 21(b) displayed the bending stress-deflection curves under the stress level of 70%. Two distinct regions (region A and region B) were emerged, which caused by the large variation of deflection. There was no significant degradation in the mechanical properties of specimens before region A. The progressive damage accumulated after region A (70000, 90000), which became more apparent especially at region B. The initial stiffness gradually decreased with increase in testing cycles, which characterized the progressive fatigue damage of the specimens. As shown in Figure 21(c), the bending modulus degradation were displayed during fatigue loading. It indicated that the mechanical properties of specimens degraded gradually, but dropped abruptly when the testing cycle was very close to the ultimate fatigue damage. The deflection-cycles curves were also used to describe the fatigue damage mechanisms, and the variation tendency showed the certain regularity. Figure 21(d) showed that the maximum and minimum deflection of specimens increased continuously with the number of cycle load. The rapid of fatigue damage accumulation became significant at point 1 and point 2, and the ultimate failure occurred after point 2.
Moreover, the fatigue failure modes of 3DAWC were also discussed based on various observations. It was found that the integrated construction structure could resist the delamination under high-cycle fatigue loading. The cracks propagation and breakages of the warp yarns that run through the thickness direction of the specimens dominated the fatigue failure. The resin cracks and resin-yarn interface debonding were the secondary factors for determining the fatigue properties. The results revealed that the main fatigue damage mechanisms included the progressive resin cracking, yarns transverse cracking, resin-yarn interface debonding, and yarns breakages. Three-stage cumulative fatigue damage properties were investigated. In the first stage, the cracks in resin began to germinate. The resin-yarns interface debonding and yarns cracks initiation were both occurred in the second stage. In the third stage, the propagation of yarns cracks was accumulated until failure.
The low-cyclic bending fatigue properties of 3DAWC were also analyzed in experiment [81]. The stress distribution was discussed, and the stress mainly concentrated in the middle load-carrying part. The top and bottom surfaces of specimens suffered the more compressive stress and tensile stress. Compared with the other components in specimens, warp yarns in the area near the top layers of the central load-carrying regions absorbed more energy, which played the key role during fatigue loading. The crack propagates mainly along the interface between warp yarns and resin, hardly along the interface between weft yarns and resin. Both the material damage and crack propagation were concentrated on the top and bottom surfaces of the center load-carrying areas, which were defined as stress concentration areas.
Comparative study
The failure characteristics of 3D woven composites under bending fatigue loading were closely related to the geometric structural properties, and the special structure determined the specific failure mode. Compared with 3DOWC, 3D woven composites with layer-to-layer angle interlock reinforcement hold longer period of fatigue life under the specific stress levels [82]. As shown in Figure 22(a), the S-N curves were obtained to demonstrate the comparison of fatigue life under various stress levels. The average number of failure cycles corresponding to different stress levels was given in logarithmic form to reflect the trend of fatigue life of composite specimens. It indicated that the fatigue life decreased with the increase of stress level. Moreover, the average number of cycles of 3D layer-to-layer angle interlock composites was significantly greater than 3DOWC at the corresponding stress level, and 3DAWC showed the better fatigue resistance. It could be deduced that the bending fatigue properties of 3DAWC is better than 3DOWC due to the high crimp of binder yarns. The binder yarns with high crimp displayed the highest capacity of energy dissipation.

(a) S-N curves; (b) D-N curves [82].
The three-stage cumulative damage evolution was the main damage mechanisms of both types of composites under bending fatigue loading. The fatigue damage index (D) was defined in the term of elastic modulus. Figure 22(b) displayed the damage indexes versus number of cycles (D-N) curves to characterize the three-stage cumulative fatigue damage evolution. Both stage I and III were shorter than stage II, which corresponded to the bending modulus degradation during cycling loads. For different stages, the damage modes were analyzed. It was found that the resin cracking, interface debonding, and yarns cracking and breakages were the main damage modes. Furthermore, the ultimate damage morphologies were compared to deduce the structural effects of the composites under three-point bending cyclic loading condition. The differences in the distributions and sizes of damage regions were mainly due to the existence of non-crimp yarns along the longitudinal direction (load-carrying direction). The damage was mainly concentrated in the region where weft yarns crossed over the warp yarns.
Modelling strategies for fatigue life prediction
The fatigue life prediction theory of composites can be divided into two categories: S-N curves theory and fatigue cumulative damage theory. Two kinds of fatigue life prediction models were proposed based on the theory. The models of fatigue cumulative damage mainly contained residual strength model, residual stiffness model, fatigue modulus model, dissipation energy model, and fatigue progressive damage model and other nonlinear fatigue cumulative damage models.
A simple model was proposed for predicting the fatigue life of 3D fiber/epoxy composites. The fatigue life of 3D composites was proportional to the fatigue life of corresponding 2D composites. But the model was not reliable in predicting the fatigue life of 3D composites in all cases, and the limitation was obviously [83]. For 3D woven fiber/epoxy composites, the models of fatigue life prediction were mostly reported based on the testing results. In this section, the modeling strategies of 3D woven fiber/epoxy composites were reviewed according to the different cyclic loading.
Tension-tension fatigue
The residual strength and stiffness models were used to predict the T-T fatigue properties of 3D woven fiber/epoxy composites.
The T-T fatigue properties and damage mechanism of 3DOWC were analyzed by using the multi-scale geometry model and material model [54]. To reduce the simulation time, the resin matrix used the nonlinear viscoelastic material model to characterize its stiffness decline with time in micro- and meso- unit. The Switch rule of materials under loading-unloading conditions tracked the maximum historical stress expansion sphere of the material. The isotropic and transversely isotropic material models were used for fiber and yarns, respectively. The crack generation mechanism and damage evolution laws were studied by using the crack model (Smear crack). As shown in Figure 23, the comparation of degradation in inner, surface and whole units were described, and the predicting results of models were compared with the experimental values. Under cyclic loading, the tensile modulus and stress peak of the inner area (inner units) and the surface area (surface units) of the specimens decreased gradually as shown in Figure 23(a). Compared with the whole specimen (whole units), the mechanical properties of the inner area (inner units) dominated the main mechanical properties. The comparison of the whole units and the experimental data showed that the results of whole units could effectively predict the tensile modulus, the peak stress and the mechanical properties of the specimen after a certain number of cycles. It was also displayed the decline of the tensile modulus and the peak stress with the increase of the number of cycles. Figure 23(b) presented the similar characteristics as obtained in Figure 23(a). There was no crack formation in binder yarns, and the stress decay was mainly caused by the stress relaxation of resin matrix in the surrounding area, which was consistent with the test results.

Degradation of mechanical properties of specimens under cyclic loading: (a)
A model was established to evaluate the T-T fatigue properties of 3DAWC [84]. The traditional finite element analysis (FEA) was used to evaluate the stiffness reduction and energy release rate due to crack propagation. Then, stiffness and strength degradation were integrated within a hybrid FEA model. An iterative loading procedure was adopted to apply load and distribute stresses on a unit of this typical composites for each fatigue load cycle, and crack initiation and propagation were monitored. The results obtained from the analytical model were compared to experimental data as shown in Figure 24. The S-N curves of two typical 3DAWC were and showed a good agreement. Solid lines represented the S-N curves predicted by the fatigue model, and the dark points are the experimental data. It could be deduced that the proposed fatigue model was able to predict the fatigue of 3DAWC with a good degree of accuracy. As the thickness of 3DAWC increased, the number of inner weft layers with high crimp to the surface layers with low crimp increased, and the nonlinear nature of 3DAWC were more obviously.
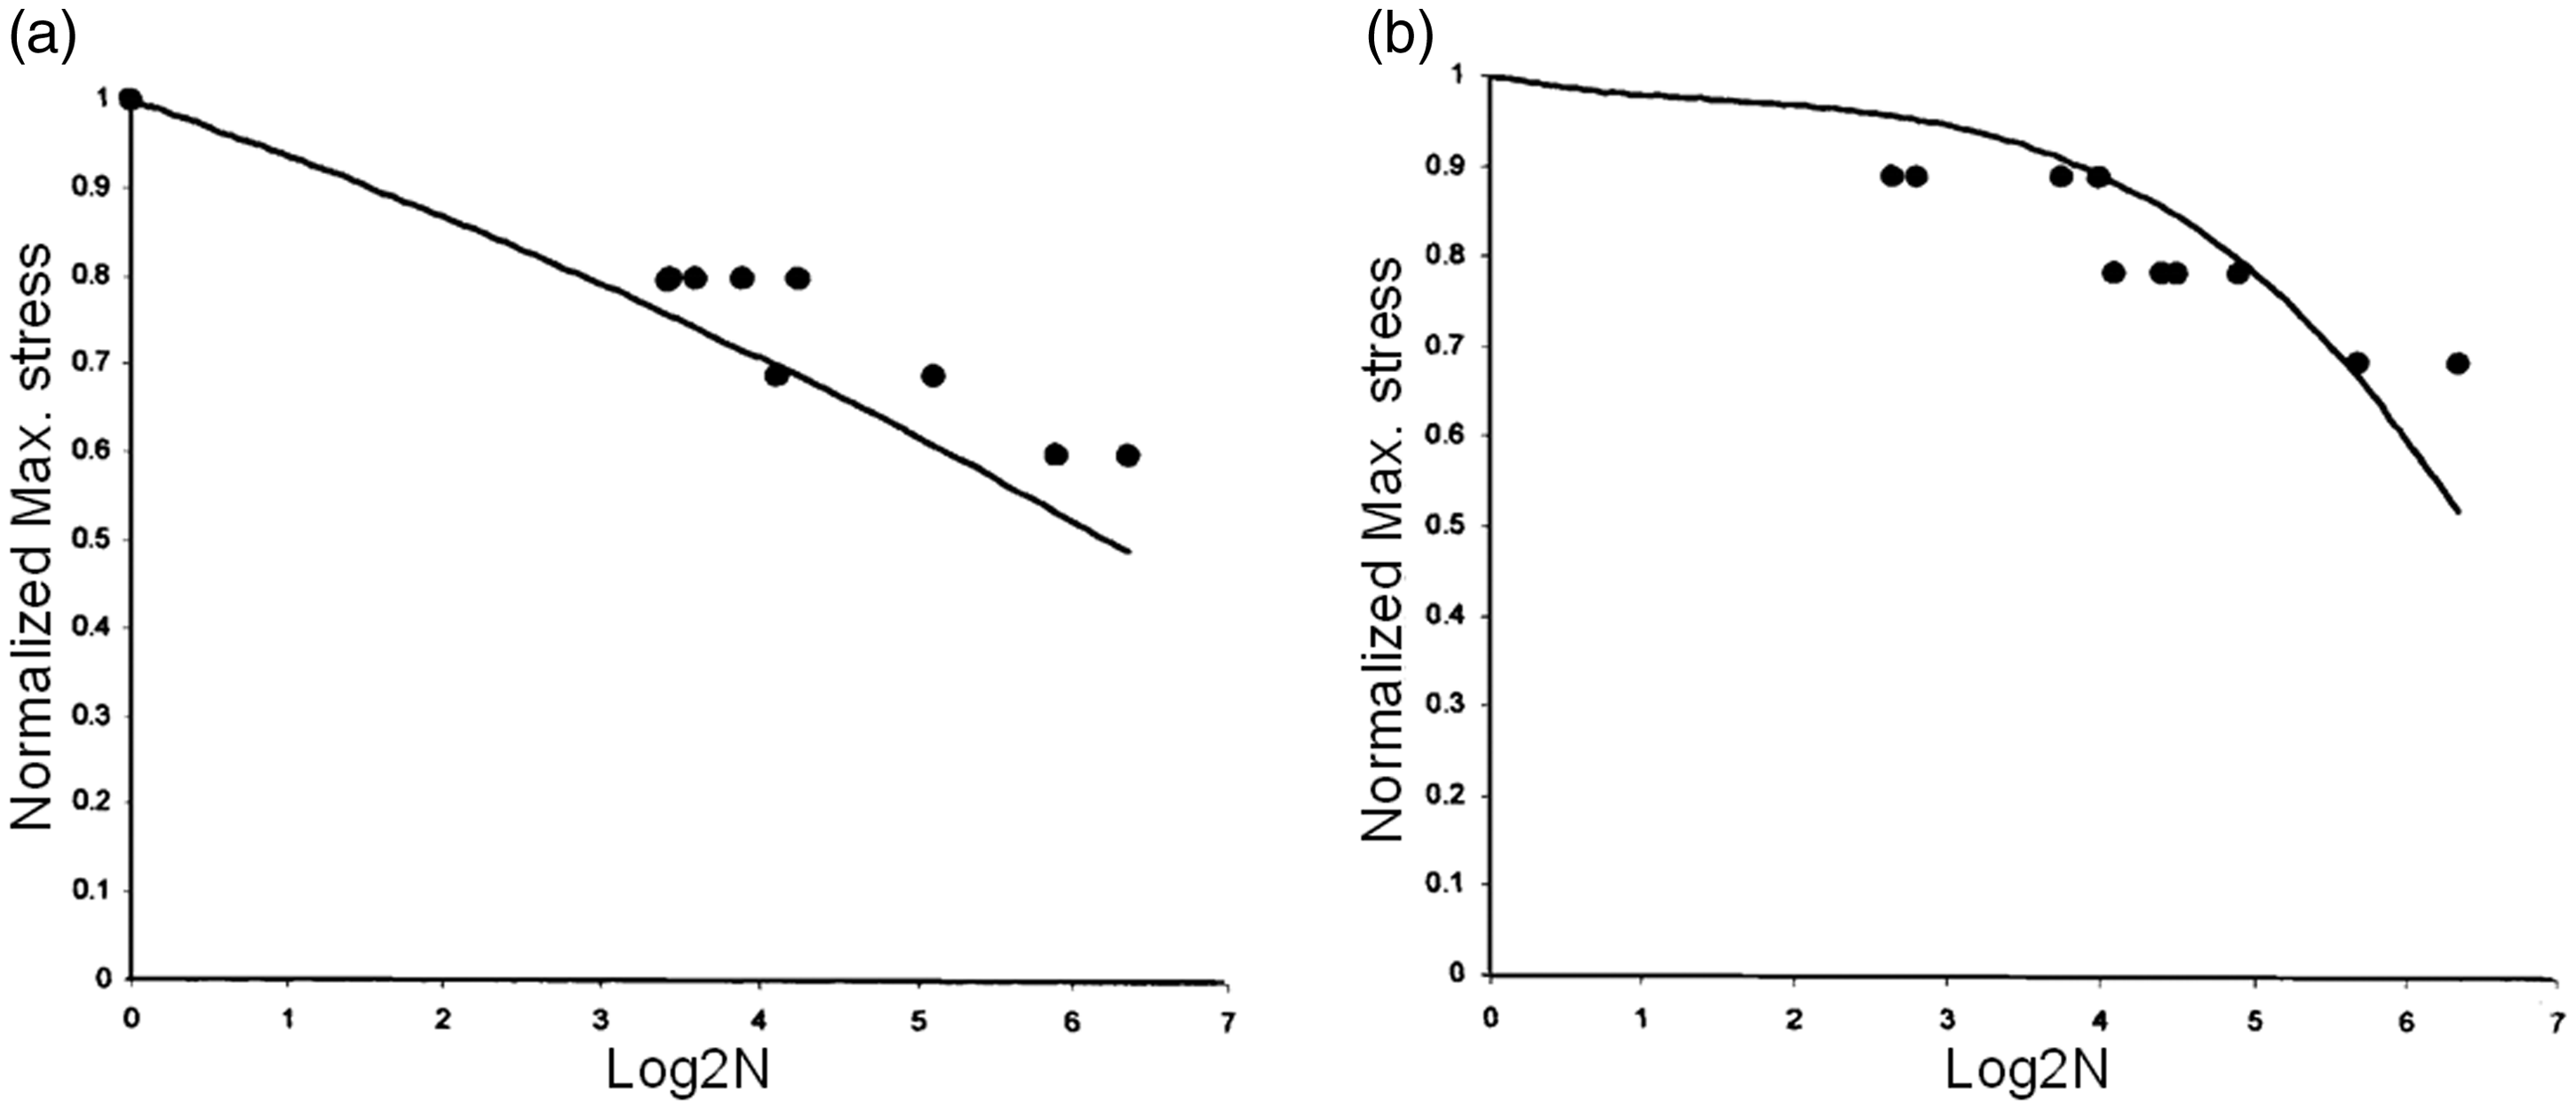
Comparison between experimental work and model prediction for 3DAWC: (a) Two warp layers; (b) Four warp layers [84].
Based on the theory of stiffness reduction, the process of fatigue damage evolution of 3D woven composites was simulated by the finite element method. The meso model of residual stiffness under alternating load was established, and the degradation method of material mechanical properties under fatigue cumulative damage was determined. The fatigue residual stiffness model and fatigue failure criterion of the material are embedded in the user subroutine, and the fatigue cumulative damage process is simulated by finite element stress analysis [85].
The fatigue life prediction method of 3DAWC was proposed [86]. This method mainly includes three parts: Based on the unit-cell model, stress analysis of composites was performed by 3D finite element technology. The modified 3D Hashin fatigue failure criterion and Mises criterion were introduced as the fatigue failure criterion of yarns and resin matrix. The stiffness property sudden degradation rules were adopted to describe the failure properties. The degradation models of residual stiffness and residual strength considering the influence of fiber volume fraction were used to describe the performance of materials before failure.
The effectiveness of the fatigue life prediction method was verified by comparing the fatigue life prediction value with the test value. The results showed that the T-T fatigue life increased with the increase of the fiber volume fraction in warp direction, and less affected in weft direction.
3DAWC could be regarded as laminates with warp yarn layers and weft yarn layers under tension load. The T-T fatigue life prediction method, based on the fatigue life prediction of unidirectional laminate, was presented by using Miner theory of linear fatigue damage accumulation and considering the stress redistribution caused the degradation of stiffness in the process of fatigue loading [87].
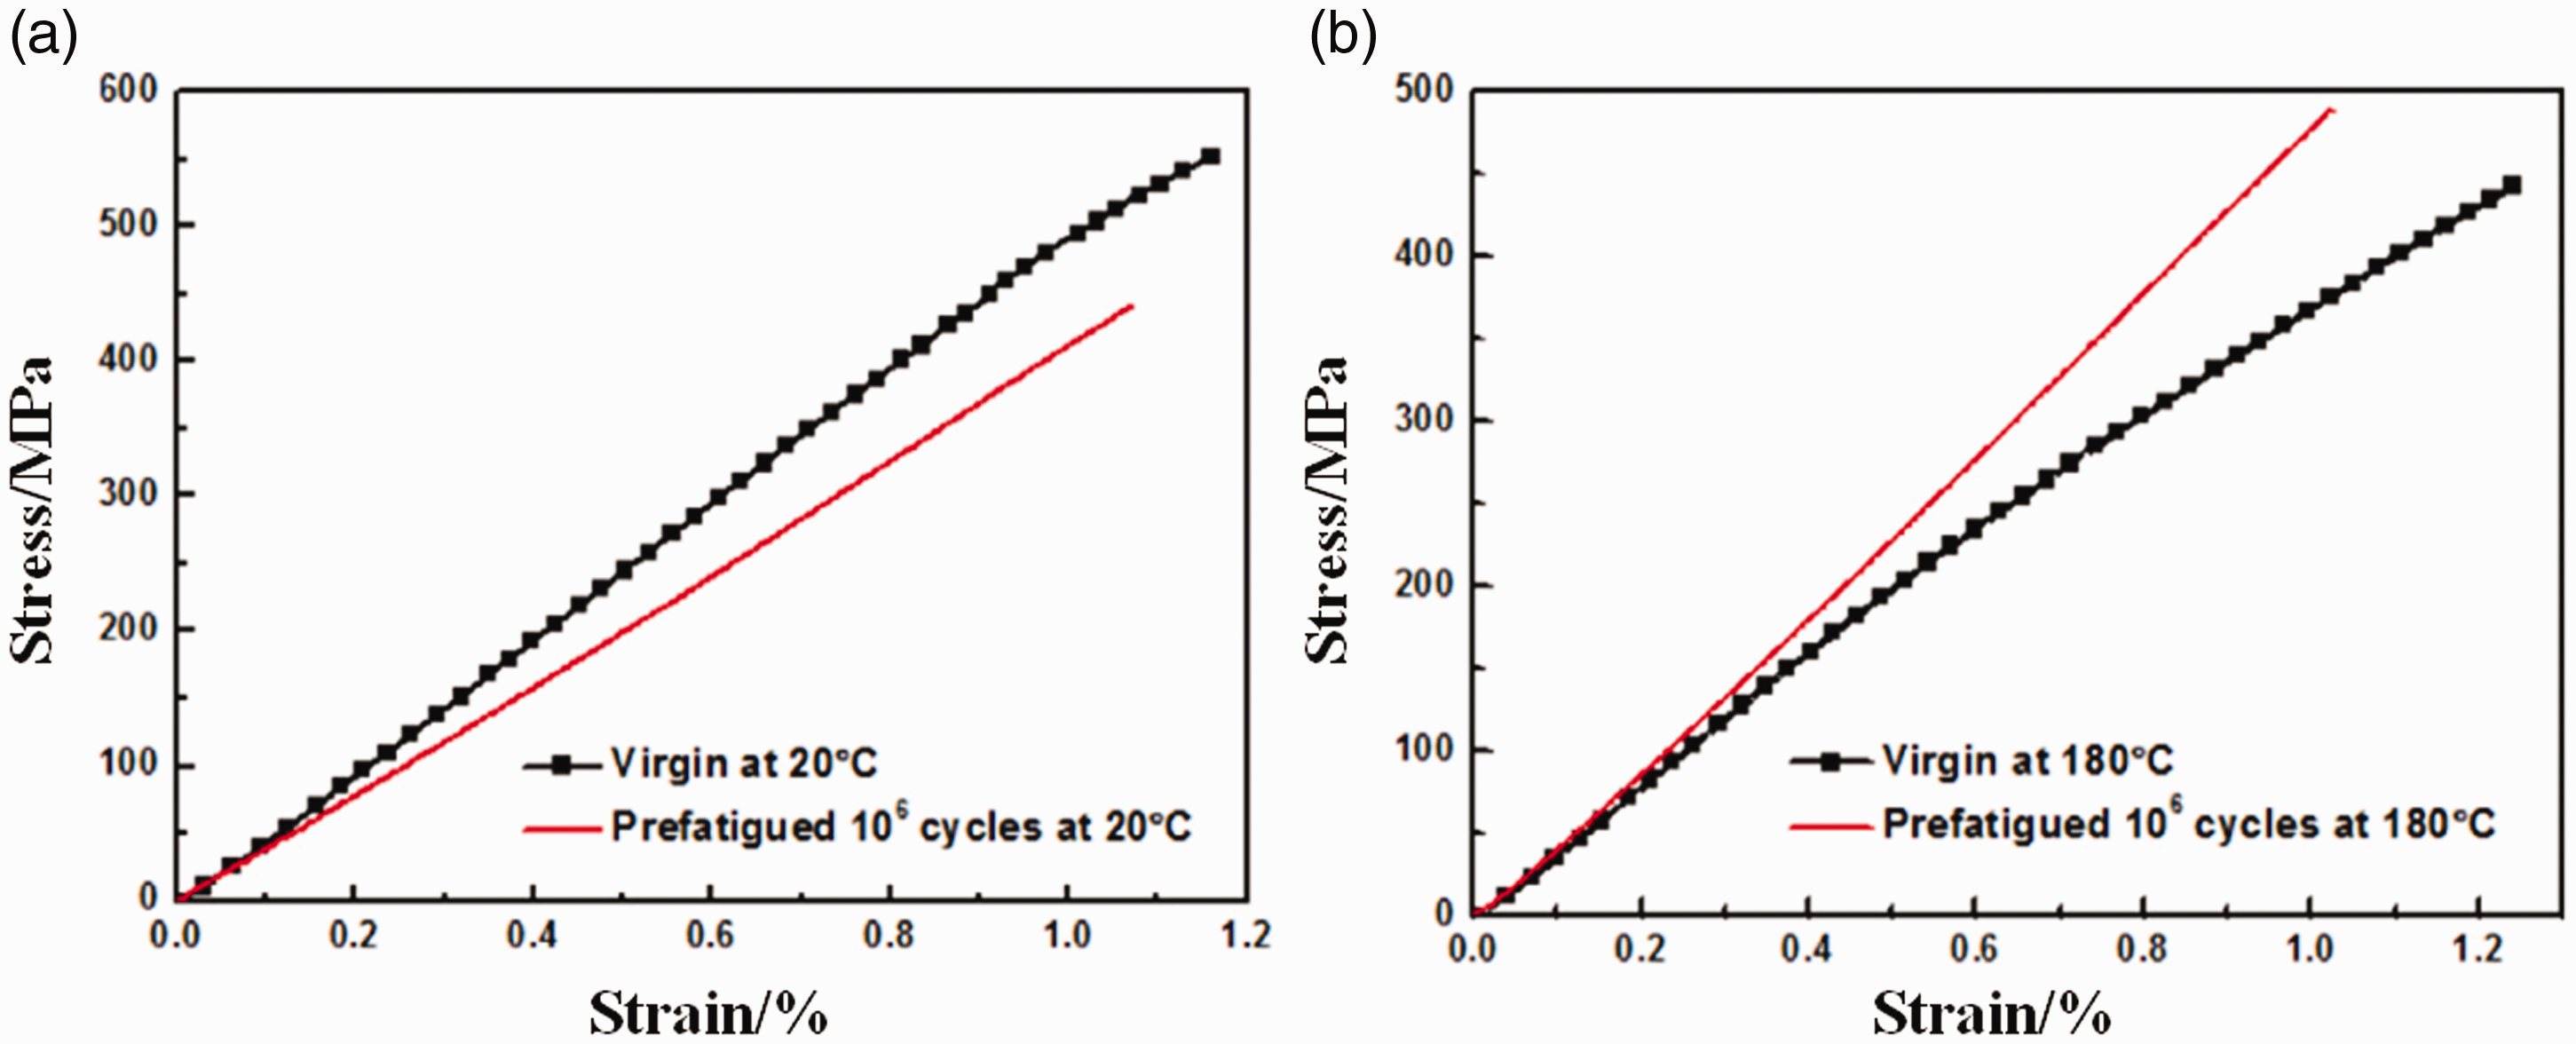
In depth understanding of the T-T fatigue properties of this typical composites at un-ambient temperatures, a temperature-dependent fatigue life prediction model was derived based on the unit cell approach [88]. The fatigue lives alongside the damage evolution processes at ambient temperature (20 °C) and un-ambient temperature (180 °C) were analyzed. The results showed that the fatigue properties of 3D layer-to-layer angle interlock composites were sensitive to temperature, which was partially attributed to the mechanical properties of resin and the change of inclination angle of warp yarns. As shown in Figure 25, thermo-mechanical behaviors of pure resin and damage mechanism of 3DAWC were displayed. The modulus and strength of pure resin decreased as the temperature increases (Figure 25(a)), resulting in degradation in mechanical properties of 3DAWC at elevated temperatures. The ductility of 3DAWC improved at elevated temperatures due to softening resin, and the stress concentration were effectively accommodated. As shown in Figure 25(b), the inclination angle of load-bearing warps decreased. The load-bearing capacity in warp direction of 3DAWC were strengthened. It could be deduced that the crimp of warp yarns influenced the mechanical properties of 3DAWC. With the decrease of inclination angle degree, the mechanical properties of 3DAWC were enhanced. This is the reason of fatigue strengthening after a small cyclic loading. But the fatigue life was obviously reduced due to the decrease of mechanical properties of resin induced by elevated temperatures.

Thermo-mechanical behaviors of pure resin and damage mechanism of 3DAWC: (a) Stress vs strain curves of pure resin at 20, 160 and 200 °C; (b) Damage mechanism in process of warp fatigue [88].
The contour images of the stress distribution during a single T-T load cycle were also depicted [65]. The results indicated that the inner central region carried the majority of the applied load during the load cycle. As shown in Figure 26, the inner central region occupies the highest volume content of fiber tows, and the stress concentrations occur at the regions with high curvature. the maximum curvature occurs and the weft tows cross the warp tows. Different from the weft yarn perpendicular to the loading direction, the system of undulated warp yarns was the main loading component in the loading direction.

Stress distribution and stress concentration regions in the 3DAWC [65].
Tension-compression and compression-compression fatigue
The model of fatigue life prediction was established to predict the C-C fatigue life of 3D woven composites [72]. The numerical relationship between critical shear stress and fatigue life was established, the maximum stress failure criterion was introduced to judge the failure of the material. 3D layer-to-layer angle interlock, through-the-thickness angle interlock and orthogonal woven composites were discussed. Fatigue damage accumulation leading to kinking, Formula (1) for the elapsed cycles to first kink band formation was proposed based on the micromechanics of kink formation.

Fatigue damage accumulation was conjectured to consist of continuous lowering of the value taken locally by τc. The law of degradation of τc is written

A law for constant load amplitude fatigue life:

Then the formula was also the basis for estimates of fatigue life. Fatigue life data and measured misalignment angles, which determine the local axial shear stress, support the fatigue model. Stress-strain hysteresis records taken from the clip gauge showed that the loading and unloading elastic moduli remain nearly constant over 80–90% of the fatigue life. Only over the last 10–20% of fatigue life did softening and pronounced hysteresis develop. It was likely that the onset of softening and hysteresis was a manifestation of kink band formation.
Three-point bending fatigue
The T-B fatigue properties of 3D woven composites were analyzed based on numerical models, which were mainly to predict the stress distribution, energy absorption and damage morphologies. The modeling established in present researches were based on the experimental datum. Finite element method (FEM) was generally adopted to discuss the stress distribution and failure mode when composites under bending cycles.
For 3DOWC, the corresponding finite element model [89], a microstructure model at yarn level [90], and whole-scale 3D solid model [91] were established for predicting the bending fatigue properties. Different T-B fatigue damage criteria were used to establish the corresponding models. The change rule of fatigue damage variable could be obtained, and then the fatigue damage of 3DOWC was calculated. Based on the degradation of component material, the fatigue damage mechanism of composites under experimental conditions was conducted. The variation of deflection was simulated by using finite element software. Further on, the influences of warp yarns, weft yarns and binder yarn systems were discussed. The stress distribution and failure mode of composites model were also obtained under low-cyclic loading. The following conclusions could be drawn: The variation of deflection was consistent with the experimental results. Warp yarn system bears the most cyclic load as well as energy absorption. The validity and feasibility of the model were verified. The stress concentration area was located in the central loading area. The damage occurred on the warp yarns that was close to the binder yarns. The triangle damage area was gradually generated from up to down in the stress concentration area as the loading cycle increased.
For 3DAWC, the interior deformation, energy absorption, and stress distribution characteristics during the fatigue process were analyzed by using FEM. By characterizing the key failure region of composites under three-point bending fatigue load, the structural effect and fatigue failure trend of the composite were analyzed qualitatively. The initial and propagative criteria of fatigue failure were proposed based on the relationship between cumulative inelastic hysteresis energy and material failure rate. According to the relationship between the release rate of fracture energy and the propagation rate of interface crack, the initial and propagative criteria of interfacial crack were determined. The finite element model was established to discuss the structural effect of failure under fatigue loading [92]. Further on, a microstructure shell element model at yarn level was established to investigate the stress distribution and deformation response [93]. A shown in Figure 27(a), the stress distribution of the proposed model of 3DAWC were displayed. It indicated that the warp yarns carry much more load than the weft yarns and resin. Besides, the warp yarns neared the central part of model presented the greatest stress distribution, which lead to stress concentrations and were easier for damage initiation and development. To compare the load-carrying amplitudes among the warp, weft yarns, and resin, some specific nodes were selected, and the comparison result was presented in Figure 27(b). The tendency of three curves was similar. Moreover, the damage modes were also discussed. The damage was easily occurred at the regions where weft yarns crossover the warp yarns, which showed a good agreement with the experimental results.

Stress distribution and comparison: (a) Stress distribution; (b) Comparison of maximum node stress in warp yarn, weft yarn and resin [93].
Based on the fatigue failure criterion of inelastic hysteresis energy, the deformation and stiffness degradation were fully discussed. A large-scale mesoscopic structure geometrical model was established to study the characteristics of inner stress and deformation, and the failure mechanism of yarns and resin matrix were also discussed [81,94]. Figure 28 gives a part of single warp yarn’s mesoscopic structure. Three parts were obtained, named Part A, Part B and Part C. The stress distribution of three parts were displayed. Part B and C were weaker than Part A. because the Part A elongates flatly. The structure of Part A was conducive to spread load out and give full play to the stiffness of composites. The inclination angle of part C weakened it in transferring force. Part B with structural curvature was the transition region of Part A and Part C. The curvature difference lead to uneven stress distribution of inside and outside of Part B. For warp yarns, areas like Part B and C were stress concentrating regions. For resin, damage occurred at the interface between resin and yarns. Under T-B cyclic loading, resins were in unbalanced stress state at the interface between yarns and resin. The stress concentrations were emerged in these areas, and finally lead to macroscopic damage [81].

A single warp yarn [81].
Based on the quasi-static bending simulation, the model with composites and indenter was proposed to investigate the failure mode [95]. The following results obtained: Warp yarns carried most of the load and absorbed the maximum energy. The geometric structures of composites have a great influence on the failure modes. The stress distributions and degradations for these models were regularity. The stress mainly concentrated in the middle load-carrying part for the longitudinal direction. The top and bottom surface of composites in thickness direction suffered the more stress. The crack propagates mainly along the interface between warp yarns and resin matrix. Yarn breakage and resin breakage dominated the failure modes of top surface. Interfacial debonding dominated the failure mode of bottom surface.
Conclusions and future directions
3D woven composites are emerging as an important class of advanced textile material with current and future applications in the industrial and civil fields subject to cyclic loading fatigue. Considerable research has been undertaken to better understand the properties of 3D woven composites in fatigue. Many important contributions in the area of 3D woven composites fatigue have been described in this review, though the review is by no means exhaustive. Based on the geometrical structure of repeated units, a new classification of 3D woven fabrics was developed to review the researches clearly. Two represented units, named repeated vertical unit and repeated inclined unit, were defined to discuss the geometrical structures of 3D woven fabrics. This classification was based on the directional yarn systems in 3D woven fabrics, because the influence of fabric structure on the quasi-static and fatigue properties were particularly important. Numerical models are usually established based on geometrical descriptions.
The fatigue properties of 3D woven composites under the cyclic loading have been reviewed based on the testing method. According to the cyclic loading, the experimental investigations were conducted by using various observation methods. The influence of the internal and external parameters on the fatigue properties were discussed, and the conclusions were obtained as follows: Both the fraction and crimp of binder yarns affect the fatigue properties of 3D woven composites. The fabric architecture affected crack initiation and growth under cyclic loading. Different stress levels lead to the different degrees of damage of 3D woven composites. At the same stress level, the residual strength and stiffness decreased with the increase of the number of load cycles. Load direction has the high influence on the fatigue properties of 3D woven composites. The fatigue properties of 3D woven composites were sensitive to temperature.
The works could provide theoretical support for enhancing the fatigue properties of 3D woven composites. The theorical prediction models were reviewed according to testing method. The residual strength and stiffness models were used to predict the T-T fatigue properties, and the model of fatigue life prediction was established to predict the C-C fatigue life. The T-B fatigue properties of 3D woven composites were analyzed based on numerical models (i.e. FEM), which were mainly to predict the stress distribution, energy absorption and damage morphologies. The following conclusion could be draw: Warp yarn system bears the most cyclic load as well as energy absorption. Stress concentration was easily occurred at the intersections of two different yarn systems. The geometric structures of fabrics have a great influence on the failure modes of composites. The crack propagates mainly along the interface between yarns and resin matrix.
Based on the summarization above, it indicates that a tremendous progress has been created for the research on the fatigue properties of 3D woven composites. However, it is necessary to develop the further research for the functional design of fatigue resistance structures. It might be used in a variety of aircraft parts, such as fuselage clips, pylon panels, rudder and elevator, horizontal stabilizer. Also, the application of 3D woven composites in automotive industry is the best choice to reduce energy consumption by light weighting. More and more heavily loaded lightweight structures are manufactured from 3D woven composites, which was used for modern wind turbine blades. The influence of geometrical structure on the fatigue properties of 3D woven composites have been reviewed. But 3D woven fabrics that provide the best fatigue properties are yet to be determined, although yarn crimp and weaving-induced fiber damage are important. In addition, the effects on the other loading cases should be conducted in the future.
The fatigue properties of 3D woven composite components were important to investigate, but the researches were difficult and time-consuming. It is most economical and effective to study the fatigue properties of 3D woven composites by numerical simulation. The numerical models of fatigue properties were established based on the mechanical models, and fatigue failure criteria were mainly adopted the ones of 2D composites. However, the accuracy of the simulation results is difficult to meet the requirements. With the development and verification of fatigue models, it is necessary to further characterization of the fatigue properties and mechanisms of 3D woven composites. Clearly, a lot of research has still to be done in this domain.
Footnotes
Declaration of conflicting interests
The author(s) declared no potential conflicts of interest with respect to the research, authorship, and/or publication of this article.
Funding
The author(s) received no financial support for the research, authorship, and/or publication of this article.