
Abstract
Admission to selective colleges has grown more competitive, yielding student bodies that are unrepresentative of the U.S. population. Admission officers report using sorting (e.g., GPA, standardized tests) and concertedly cultivated (e.g., extracurricular activities) and ascriptive status (e.g., whether an applicant identifies as a member of a racially minoritized group) criteria to make decisions. Using latent class analysis, we identified three groupings of institutions based on the admission criteria they claim to value. Public institutions largely practiced a “coarse sieve” approach that relied on sorting criteria. Some private institutions practiced “fine sieve” admissions by emphasizing concertedly cultivated and ascriptive status criteria. A few privates employed the “double sieve” that combined sorting and concertedly cultivated criteria. Results illuminate the shape of the admissions sieve, identifying institutional contexts that inform the admissions practices selective colleges claim to use.
Keywords
In The Shape of the River, Bowen and Bok (1998) describe the flow of racially minoritized students into and through selective higher education institutions. Competition for admission to the most selective U.S. colleges has intensified dramatically in the decades since (Hoxby 2009). Selective higher education, which admits few and bars access to many, has been described as a “social sieve” (Jencks and Riesman 1968; Stevens, Armstrong, and Arum 2008). To pass through the sieve, family life (especially for white and high-wealth households) is structured around preparing young people for admission competitions (McDonough 1997; Weis 2016; Weis, Cipollone, and Jenkins 2014). Accordingly, heightened selectivity has made many of the most prestigious colleges demographically distinct from the country as a whole. Compared to higher education overall, these high-status institutions have been slow to racially diversify their enrollments (Baker, Klasik, and Reardon 2018; Posselt et al. 2012), and they draw a notably lower share of students from low-income families (Bastedo and Jaquette 2011; Chetty et al. 2017).
Rather than focusing on the shape of the river, a metaphor describing the characteristics of the flow of students through higher education, we focus on the shape of the sieve, the institutional sorting and selecting mechanisms through which the river passes. We aim to illuminate the tools and preferences selective colleges claim to use to choose and exclude applicants. Higher education has become a central institution in the United States (Schofer, Ramirez, and Meyer 2021). The aspiration to attend college has become widespread, and students are increasingly distinguished by where they went to college rather than whether they went (Marginson 2016). Scholars have thus paid attention to college choice and enrollment patterns. Rather than focusing on the water (or students) filtered through higher education, we focus on the sieves (the admissions practices institutions claim) that filter.
We focus on highly selective colleges. Most U.S. colleges are less selective or open access, relying on minimum grades, test scores, and other factors to determine who can enroll. Few institutions can claim high levels of selectivity, maintaining a competitive process through which a small share of applicants is admitted and many are denied. Less than 1 in 5 private, not-for-profit, four-year colleges are classified as having “most,” “highly,” or “very” competitive admissions; only about 1 in 10 public four-year colleges fall into this prestigious group (authors’ calculations from National Center for Education Statistics [NCES] and Barron’s [2017] data).
Applications to highly selective colleges typically include many components (Furuta 2017). Some components, such as high school GPAs and test scores, are numeric measures that can be used to sort and rank many applications quickly (Park and Becks 2015). On the institutional side, such measures allow admissions staff to arrange large volumes of applications along a numerical axis. We refer to these application components as sorting criteria. Sorting criteria also reflect a bureaucratic approach to admissions in which merit is constructed and rationalized quantitatively (Weber [1864–1920] 1947). Seemingly standard metrics provide efficiency and a sheen of legitimacy to the sieve (Bowles and Gintis 1976; Hirschman, Berrey, and Rose-Greenland 2016). The National Association for College Admission Counseling reports that GPA, test scores, and the rigor of high school curriculum are commonly considered important in admissions (Clinedinst 2019).
Conversely, evaluating essays, recommendations, and other criteria requires considerable staff time and effort. These criteria emphasize how well the applicant’s family life has been organized around providing documentation of personal qualities and interests. Stevens (2009) argues that the machinery of middle-class U.S. family life has shifted to focus on producing measurably accomplished children. For example, neighborhood pick-up soccer was replaced with organized travel leagues that facilitate opportunities for measurable accomplishments like team captain or tournament wins. Lareau (2011) describes this as “concerted cultivation,” or the deployment of family time and money to develop children’s interests and vocabularies in ways that seem to naturally fill a college application. Concertedly cultivated children are coached to question, challenge, and develop relationships with teachers that later turn into remarkable recommendations (Calarco 2018). These children excel in extracurriculars because their parents have the knowledge, time, and resources to encourage that involvement. Just so, application essays can also be coached with sufficient investments of time and money because the essay prompts tend to fit within established genres and topics (Gebre-Medhin et al. 2022).
Concertedly cultivated children tend to stand out in a college interview because they have the vocabulary, cultural capital, and entitlement that allow them to feel comfortable in power-imbalanced, high-stakes settings (Lareau 2011). Admissions offices’ claims of how they value extracurriculars, interviews, and similar criteria reflect a conceptualization of colleges as distinctive organizations and students as particular individuals whose merit and match with a college should be assessed holistically (Furuta 2017)—a laborious undertaking for admissions officers. Building on Lareau (2011), we refer to these components of an application as concertedly cultivated criteria. Concertedly cultivated criteria are less commonly used in admissions than academic factors: Around 80 percent of four-year colleges report giving some consideration to essays, recommendations, and extracurriculars, whereas only half consider interviews (Clinedinst 2019).
Without a doubt, students and their families can cultivate sorting criteria through test prep and tutoring (Park and Becks 2015). Unlike sorting criteria, however, concertedly cultivated criteria resist quantification and, therefore, require staff time to evaluate. Thus, while sorting and concerted cultivated criteria are both cultural products, admissions officers may process them differently. Sorting criteria can be arranged along a unidimensional continuum, allowing staff to speedily process applications. Interviews and extracurriculars cannot be sifted the same way but require articulation of “personhood” by both the applicant and institution (Furuta 2017).
Given that multiple dimensions of admissions tend to favor the privileged (Karabel 2005; Weis et al. 2014), some have proposed a system in which colleges use a lottery to select who is admitted above certain academic thresholds. However, this approach is unlikely to produce more equitable outcomes (Baker and Bastedo 2022). Admissions officers who wish to make the process and outcomes more equitable thus often advocate for explicit consideration of applicants’ backgrounds. We refer to these criteria, such as attention to racial identity and first-generation status, as ascribed status criteria. Fewer than half of colleges report using background characteristics, such as race and first-generation status, in admissions (Clinedinst 2019).
In this article, we analyze longitudinal data from 2007 to 2015 regarding the importance selective colleges report placing on sorting, concertedly cultivated, and ascribed status criteria to identify and describe the social sieve through which colleges claim to choose and exclude applicants. The metaphorical admissions sieve has distinct contours, which we map, outlining patterns in the admissions values that selective colleges claim. Although this field-level analysis cannot illustrate exactly how admissions decisions are made, studying patterns in admissions officers’ claimed values illuminates how influential staff members want to be perceived as sifting students. This leads to our first question: Do selective colleges claim to use admissions criteria in patterned ways that indicate latent classes of admissions values?
We conceptualize selective colleges as a social field characterized by hierarchy (Fligstein and McAdam 2012), and we use latent class analysis (LCA), a case-centric technique (Masyn 2013) that is well suited to identify colleges that share a corner of the field characterized by a common suite of stated admissions values. Our application of LCA holds categories constant and allows institutions to move from one group to another annually, which leads to our second question: How does membership in these groups vary over time?
Finally, although selective colleges are, by definition, high-status institutions, a social field includes fine-grained distinctions even among powerful members (Fligstein and McAdam 2012). Associations between groupings of stated admissions values and institutional characteristics allow us to describe which kinds of sieves are most prevalent at which kinds of institutions. We use multinomial logistic regression to answer our third question: What institutional characteristics relate to membership in latent classes of stated admissions values?
Unlike other articles on admissions (many of which we cite and value), we do not focus on the river, chronicling enrollment changes over time and by institutional type. Rather, we focus on the sieve through which applicants must pass—or, at least, the sieve admissions officers claim to use.
Conceptualizing Patterns in Stated Admissions Values
Admissions officers can place varying levels of importance on different components of college applications. Some components, such as standardized tests, tout—albeit dubiously—their usefulness in measuring “academic abilities.” Proponents of these assessments claim the tests offer impersonal insights into a student’s academic potential that easily allow for sorting. Sorting can also happen through other quantifiable academic criteria, such as GPA, class rank, and rigor of curriculum. These factors provide a way to sift through many applications and select students who “merit” admission, but they also raise equity concerns given the correlation between test scores and white and upper-class status (Camara and Schmidt 1999; Reeves and Halikias 2017) and differences in the availability of advanced high school courses (Lucas and Berends 2002).
Components like extracurriculars, essays, and interviews promise insight into an applicant’s “distinctive characteristics,” reflecting an assumption that “talents and capabilities are not merely reducible to unidimensional criteria” (Furuta 2017:239). Families concertedly cultivate children to document excellence in extracurriculars, form relationships with teachers that lead to strong recommendations, and display confidence in an interview. These activities translate middle- and upper-class resources and tastes into application components. Finally, ascribed status indicators describe an applicant’s identity characteristics. These measures say not what an applicant has accomplished but instead indicate whether a student identifies as a member of an underserved group. Unlike sorting and concertedly cultivated criteria, which likely reflect racial and socioeconomic privilege, ascribed status criteria offer the possibility of purposeful steps toward equity.
Adjudicating among different application components is complicated (Stevens 2009). A growing body of research focuses on holistic admissions—placing applicants’ achievements in the context of their environment and opportunities therein. This work describes how institutions implement holistic review and its implications for college access (Bastedo and Bowman 2017; Bastedo et al. 2018). Other research indicates common features of holistic review—consideration of extracurriculars and subjective assessments of applicants—do not relate to increased access among low-income and racially minoritized students (Rosinger, Ford, and Choi 2021).
Prior work has also examined test-optional admissions, which offers the potential to increase access because standardized tests reinforce existing privileges. This model of selection de-emphasizes sorting criteria in favor of an application that can be concertedly cultivated. Test-optional practices allow colleges to brand and legitimate themselves in a competitive organizational field (Furuta 2017). It is unclear whether reduced attention to standardized tests has achieved its professed purpose. Some analyses of test-optional admissions indicate it has done little to improve racial and socioeconomic diversity (Belasco, Rosinger, and Hearn 2015; Saboe and Terrizzi 2019), although recent research examining more institutions indicates it has expanded enrollments among low-income, racially minoritized, and women students (Bennett 2021). More dramatic changes, in which applicants with grades and scores above specified thresholds are admitted through a lottery system, also have limited ability to promote equity (Baker and Bastedo 2022).
Using a Theory of Fields to Conceptualize the Relationship Between Stated Admissions Values and Institutional Characteristics
The muted evidence regarding holistic and test-optional admissions is unsurprising. For much of the twentieth century, qualitative aspects of admissions—interviews, essays, even photographs—were used to discriminate rather than expand opportunity (Karabel 2005). Processes of cultural matching—in which those in positions of power confer advantage on those with similar social identities or daily practices—are also present in graduate admissions (Posselt 2014, 2016) and elite employment (Rivera 2012, 2016). Interviews, essays, and other application components allow campus officials to create fine-grained distinctions among applicants with similar sorting credentials along the basis of social identities and cultural practices (Bourdieu 1984). Privileged families, for their part, organize their leisure hours in ways that position their children to offer selective colleges the portfolio of achievements that institutions prefer (Weis 2016; Weis et al. 2014). The use of concertedly cultivated criteria differs in technique from the use of sorting criteria but can yield the same inequities. In this way, incumbency is reproduced by many different means (HoSang and Lowndes 2019).
We use Fligstein and McAdam’s (2012) theory of fields to conceptualize these differences. This approach casts fields as shared social spaces characterized by well-known rules for allocating resources and status. Members of the field—applicants, parents, school personnel, and admissions officers—understand these rules and attempt to navigate them strategically. Admissions officers want to craft a class that maximizes institutional wealth and status (Stevens 2009). Given that members begin from unequal positions, however, we do not expect admissions offices to be able to do this equally well (Fligstein and McAdam 2012). Even high-status institutions differ widely from one another (Taylor and Cantwell 2019). By extension, we expect the most selective institutions will claim to use selection techniques that are less common among or unavailable to other institutions.
Highly selective institutions, where essays and interviews distinguish among applicants with similar GPAs or test scores, may report focusing on concertedly cultivated criteria. The selectivity demonstrated by the most prestigious private colleges far exceeds that of the highest status public universities. Furthermore, demand for admission is often inversely related to size; smaller institutions are sometimes highly selective (Taylor and Cantwell 2019). Accordingly, we expect highly selective private and/or smaller institutions will report emphasizing concertedly cultivated criteria.
Conversely, sorting characteristics may be emphasized at larger, less selective public institutions. This may reflect pressure from state governments to serve a state’s population, or it may reflect declining per-student state government funding, which encourages institutions to operate at scale to generate resources (Taylor and Cantwell 2019). Enrollment pressures—whether to serve the state or achieve scale—likely discourage time-intensive assessments and favor sorting that distills a candidate to a handful of numbers. Accordingly, we expect larger and public institutions to report emphasizing sorting criteria.
Finally, governance agencies—in the case of public colleges, state governments—are particularly powerful actors within social fields (Fligstein and McAdam 2012). These bodies set the rules by which organizations compete for positions. During our study period, many state governments involved themselves in admissions, with the banning of affirmative action being a common intervention (Baker 2019; Taylor 2022). Therefore, we expect the use of ascriptive status criteria to be more commonly reported among private institutions.
Data and Methods
Sample and Data
Our sample was 95 public and 273 private, not-for-profit colleges classified as “most,” “highly,” or “very” competitive (Barron’s 2017). As Fligstein and McAdam (2012) note, even members of homogeneous fields display differences in status and resources. Yale, Harvard, Stanford, and Princeton reject over 90 percent of applicants, whereas some selective public universities admit around 70 percent of applicants. Despite these differences, each sampled institution has been identified as practicing competitive admissions (Barron’s 2017), indicating our sample is a reasonable proxy for the choice set of selective U.S. colleges.
To answer our first two questions, we licensed historical data from Peterson’s (2016), which, together with the College Board and U.S. News and World Report, annually surveys admissions officers regarding their college’s admissions practices. Because the survey asks about other institutional features, institutional research offices are also frequently involved in completing the data request. Peterson’s, the College Board, and U.S. News and World Report share the survey responses in their publications, which are intended to guide prospective students in their college search. To encourage colleges to respond, publishers highlight the marketing opportunity for potential students (Common Data Set n.d.).
These data contain information on the importance colleges reported placing on specific admissions components annually from the 2007–2008 to 2015–2016 academic years. Each admissions consideration could be reported as not considered, considered, important, or very important. We identified four components as sorting criteria: GPA, test scores, rigorous curriculum, and class rank. Each facilitated the processing of many applications. Six criteria aligned with our concept of concertedly cultivated criteria: essays, interviews, recommendations, extracurriculars, volunteering, and work. These criteria afforded applicants the opportunity to present a version of themselves that had been crafted for admission purposes but required staff labor to process these signals on the institutional side. Ascribed status criteria included consideration for first-generation students, racially minoritized students, and legacy applicants.
To answer our third question, we merged Peterson’s data with data on institutional characteristics, mostly from NCES’s Integrated Postsecondary Education Data System (IPEDS). We merged IPEDS and Peterson’s data so that institutional factors and stated admissions values were measured in the same academic year (e.g., characteristics of students in 2015–2016 were matched to reported admissions values from that same year). We merged data from corresponding years because the importance institutions reported placing on admissions considerations was consistent over time, making it difficult to examine how changes in institutional characteristics in one year related to changes in reported admissions practices in another. Instead, our data allow us to explore more generally how institutional characteristics relate to stated admissions values.
Analytic Method
We use LCA to answer our first question. This finite mixture modeling technique is more appropriate than other clustering approaches when researchers assume the sample includes multiple distinct subsamples (Masyn 2013), such as institutions that report valuing different criteria. LCA identifies unobservable groupings in the data using manifest (observable) binary variables (McCutcheon 1987), in this case, the admissions values selective colleges claim to use. To address nonindependence of observations in panel data, we cluster errors by institution.
For the sorting, concertedly cultivated, and ascribed status criteria, a value of 1 indicates a college reported valuing a component as important or very important. Elements of applications colleges reported as not considered or only considered (not important) were coded as 0. We reverse-coded legacy consideration—creating a measure of whether an institution reported placing no or low emphasis on legacy status—for easier interpretation alongside consideration of first-generation and racially minoritized statuses. For ascribed status criteria, a value of 1 indicates foregrounding equity.
A persistent challenge of LCA is determining the number of classes, or patterns of reported admissions values, to report. Numbers such as the Akaike Information Criterion (AIC) or Bayesian Information Criterion (BIC) indicate improved model fit as they become lower (Dziak et al. 2012). We selected a three-category model, which improved notably on a two-category model; four- and five-category models hardly changed the AIC and BIC. The three-category model classifies 99.3 percent of cases with 75 percent or greater confidence and 92 percent of cases with 90 percent or greater confidence. These figures exceed standards of good model fit (Masyn 2013). They also exceed the percentage of high-confidence classifications in the four-category model, suggesting the inclusion of another class makes the model less precise. Having settled on LCA results, we address our second question by describing the shifting proportion of cases in each class for every year in our panel.
We answer our third question using multinomial logistic regression, which is appropriate when the dependent variable (belonging to one of three latent classes) is categorical and unordered (Long 1997). The model can be expressed:

where r is a given category of the dependent variable, i is a specific institution, t is year, X is a suite of independent variables, u is the error term, and Y is the probability of belonging to a particular category r relative to the referent category.
Because our data set includes repeated measures of the same institutions over time, we use a random-effects technique (Hartzel, Agresti, and Caffo 2001). Random-effects techniques analyze a weighted mean of within- and between-unit variance. This approach is appropriate because we found little within-unit variance in the dependent variable. An approach using fixed effects would condition all inferences on the few institutions that changed class membership over time. Institutions that did not change classes would have no variation to analyze.
We include independent variables from three categories—university resources, enrollment practices, and student characteristics—measured annually and reflective of an institution’s position in a stratified field. Because colleges have different resource bases, the first two variables are financial: (1) total educational expenditures per full-time equivalent (FTE) student to account for different enrollment levels (logged) and (2) percentage of revenue drawn from tuition, which indicates the extent to which an institution relied on students for financial resources. In general, higher status institutions rely less on tuition and more on other revenue sources (Taylor and Cantwell 2019).
Next, we added measures of an institution’s enrollment funnel and practices: (1) percentage of applicants admitted, which approximates institutional prestige; (2) count of applications, which measures the volume an admissions office processed (logged); and (3) a binary variable indicating whether an institution used a no-loan program, which accounts for the possibility that larger scale changes to admissions or aid practices might be associated with particular sieves. We gathered data on no-loan programs from Bennett, Evans, and Marsicano (2021) and institutional websites.
Two variables measure student characteristics: (1) Percentage of students who identified as white indicates the extent to which an institution enrolled socially privileged students. We use this metric rather than multiple measures of student body racial demographics because it allows us to focus on racism and white privilege. This approach aligns with our substantive focus on institutional position within a stratified field. (2) Percentage of students who received a federal Pell Grant indicates the extent to which an institution enrolled low-income students. Finally, a series of (t – 1) dummy variables for year account for variation over time.
We conducted separate analyses for public and private schools. High-status private schools tend to be more selective than prestigious public schools (Taylor and Cantwell 2019) and so are likely to use different techniques to assess applications. We include two time-invariant institutional characteristics to account for differences within these subsamples. For public institutions, we include binary variables indicating whether an institution was a research university (“very high” or “high” research activity), according to 2005 Carnegie Classifications. We also include a binary variable indicating whether an institution was a designated land-grant recipient. For private institutions, we include indicators for research universities and liberal arts colleges (2005 Carnegie Classifications).
Because multinomial logistic regression uses a logarithmic link function, results can be difficult to interpret (Long 1997). We therefore present exponentiated coefficients indicating percentage change in the risk of belonging to one category r relative to the referent category. To address serial correlation, we cluster errors “one unit up” from the observed unit (Angrist and Pischke 2009), in our case, by state.
With 368 institutions observed over nine years, a total of 3,312 institution-year observations were possible. Due to missing Peterson’s data, only 2,975 observations (89.8 percent) were available to answer our first two questions. Nine of these institutions were missing IPEDS data for independent variables in our regression model. We excluded these observations using listwise deletion, resulting in a sample of 2,966 cases for our third question. Missing data meant 10.2 percent and 10.5 percent of institution-year observations were excluded for public colleges and private colleges, respectively. We excluded 5 public and 10 private colleges from the sample entirely due to missing Peterson’s data in all years.
Limitations
The limitations of our study contextualize the findings. Importantly, Peterson’s (2016) data come from college admissions officers’ survey responses regarding the importance their institution claimed to place on various admissions criteria. The data are part of the Common Data Set Initiative, which aims to standardize and ensure the accuracy and quality of data colleges report to college guide and ranking publishers (commondataset.org). However, self-reported data are social data and should be interpreted as a representation of how the responding institution wants to be perceived rather than a documentation of the institution’s actual actions. Given the role the data play in college guides, rankings, and public perceptions, colleges may face pressure to be perceived as valuing certain criteria. For instance, institutions may wish to be perceived as valuing race if they hope to position themselves as prestigious by claiming to embrace equity and inclusion (Ford and Patterson 2019). Alternatively, institutions may underreport the extent to which they consider race to avoid attention from opponents of affirmative action and lawmakers who can implement legislation banning race-conscious admissions. In addition, institutions may face normative pressures to align admissions practices with incumbents in the organizational field.
Although we do not know if admissions officers’ behavior exactly mirrors their survey responses, these data provide a window into what admissions officers believe they should value and what they want others to imagine their institution values even if institutional pressures mean they operate differently than they claim. In addition, our data comprise the largest field-level longitudinal data set available regarding the various factors considered in selective admissions and the importance institutions claim to place on each. Prior studies have used these data to examine affirmative action practices (Hirschman and Berrey 2017; kehal, Hirschman, and Berrey 2021) and admissions practices more broadly (Rosinger et al. 2021). These studies indicate the data offer helpful insight into admissions practices.
An additional limitation stems from our analysis of public colleges, which are frequently subject to state- and system-level policies that determine or place constraints on admissions practices, such as affirmative action bans (Baker 2019) or automatic admissions or percent plans (Cortes and Klasik 2020). In these cases, state- and institution-level factors shape admissions practices. Our analysis considers the reported admissions values at the majority of selective public colleges, but it may overlook some nuances in reported admissions values. For example, our thresholds for inferring importance may differ from those some survey respondents had in mind when they submitted data.
Another limitation of our study relates to missing data, particularly regarding colleges’ reported admissions practices. As noted earlier, around 10 percent of institution-year observations were missing for both public and private colleges. If institutions that were missing data systematically differed from those that were not, missing data could bias our results or lead to results that are not generalizable to a broader group of institutions. We conducted two-tailed t tests to examine (1) whether public institutions with missing data were more (or less) likely to be in states with affirmative action bans (and therefore may face greater scrutiny in their reported admissions practices), (2) whether missing data were clustered in years surrounding the 2015 Fisher Supreme Court cases (again, a time when institutions may have faced greater scrutiny in their reported admissions practices), and (3) whether institutions with missing data differed in selectivity, finance, or enrollment features (racially minoritized and low-income student enrollment) from included institutions.
The first two analyses of missingness help us understand whether colleges that were facing greater scrutiny in their admissions practices were systematically missing from our analysis because they did not report data on stated admissions values. We did not find evidence that missing data were patterned by the Fisher case. Observations in years surrounding the Fisher case (2013–2015) were missing data at a nominally similar rate (8.2 percent) to observations from other years (8.5 percent). We found that a nominally higher level of public institution-year observations in states that had banned race-based affirmative action were missing data on one or more admissions practice variables (20 percent) than was the case for public institution-year observations in other states (8.3 percent). However, relatively few selective public institutions were in states that had imposed bans on race-based affirmative action. Perhaps due to this limited statistical power, a two-tailed t test indicated that these nominal differences were not statistically different. Nonetheless, we urge caution in generalizing our findings to public universities in states with bans on race-based affirmative action because such institutions were more likely to be missing data on admissions practices than were institutions in states without bans.
Our third analysis of missingness explored whether excluded observations differed in observable ways from included institutions. We identified several systematic differences. In particular, excluded institutions, compared to included institutions, spent less on educational expenditures, denied admission to a lower share of applicants, and enrolled a student body that was less white and more likely to include Pell Grant recipients. In other words, included institutions tended to be wealthier and more socially exclusive than institutions with missing values. We identified no significant differences in application volume, and among public institutions, we found no differences in missingness among (non)land grant institutions or (non)research university status.
Finally, we acknowledge that a college is not a unified entity. There may be differences within an admissions office that our analysis cannot identify because we use a single response for the entire institution. We acknowledge our data cannot explore this possibility, but we think our decision is defensible. Admissions officers may change their behavior in response to training or other interventions (Bastedo and Bowman 2017). Given how professional development activities are administered and funded, we expect most admissions officers at a college participate in a similar suite of activities. By extension, we expect admissions officers at a single institution to have some level of agreement about the application components to which they attribute importance. Accordingly, we expect enough within-institution consistency that a single response is a reasonable reflection of institutional practices. However, future research might examine within-organization differences in claimed admissions values.
Results
Latent Classes of Admissions Values
Selective colleges reported valuing application components in patterned ways. Table 1 presents LCA results along with a description of the sample and a series of two-tailed t-tests comparing the mean for each class to the sample mean. These tests facilitate a more robust interpretation of LCA results. For example, the nominal difference in the mean value placed on GPA in the overall sample and an individual class could be small but statistically distinct because observations were so heavily clustered around 1.00. Many variables follow this pattern (small nominal differences that are statistically distinct), confirming our decision to use LCA. In contrast to variable-centric clustering techniques, LCA is case-centric, meaning it identifies patterns in k dimensions rather than flattening all variables into a single indicator of similarity (Masyn 2013). Accordingly, we focus on the overall pattern indicated by LCA results—the general characteristics of a class—rather than fine distinctions among individual measures.
Results of Three-Category Latent Class Analysis Model.
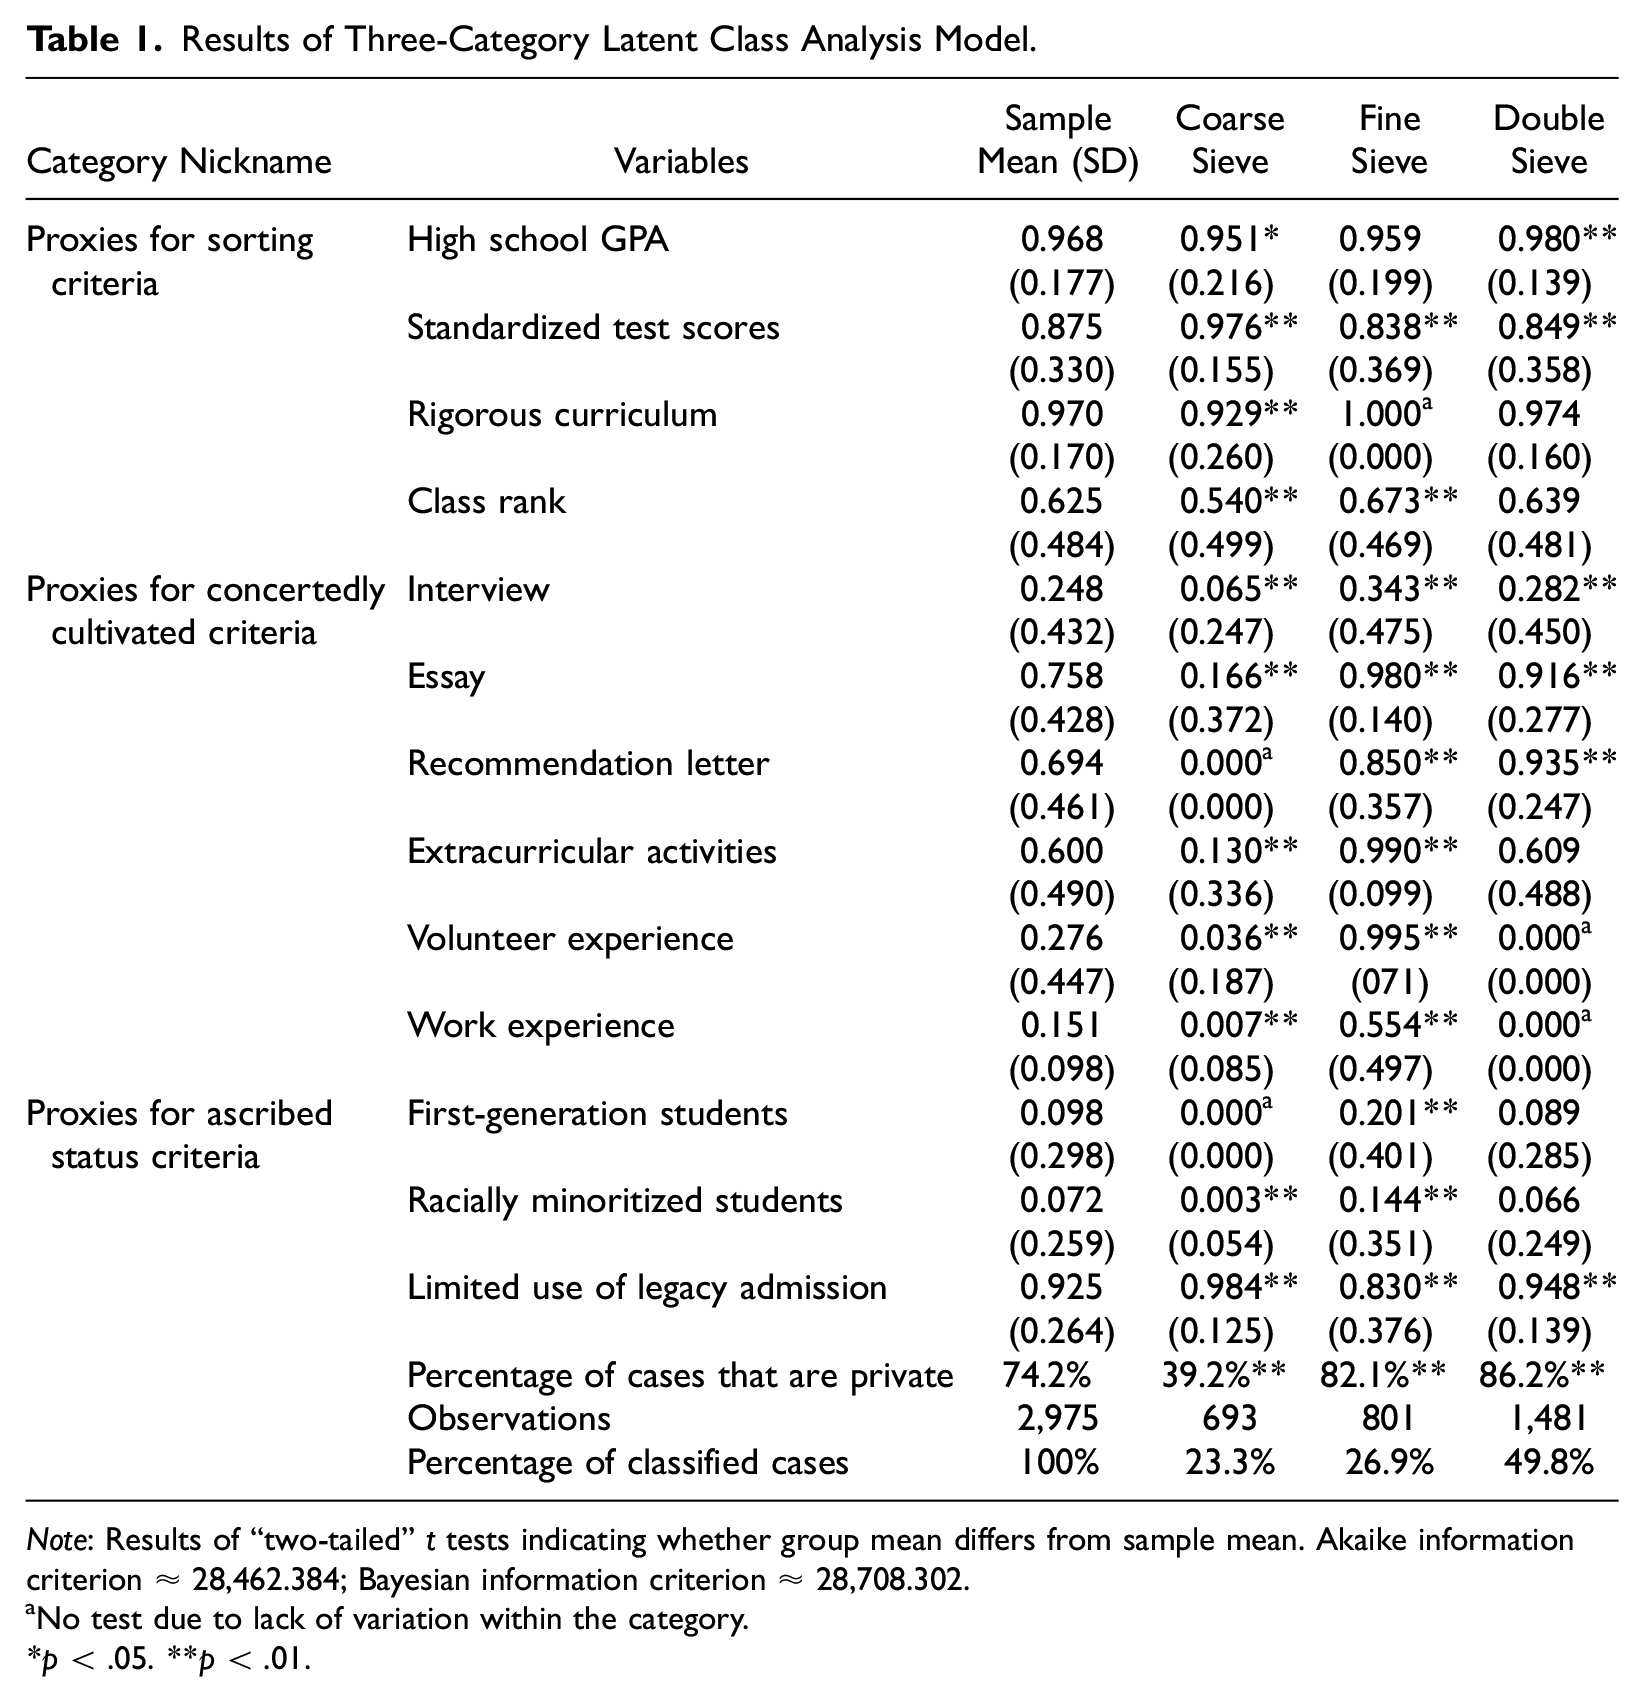
Note: Results of “two-tailed” t tests indicating whether group mean differs from sample mean. Akaike information criterion ≈ 28,462.384; Bayesian information criterion ≈ 28,708.302.
No test due to lack of variation within the category.
p < .05. **p < .01.
We developed labels for each latent class to describe characteristics of members of that class. Admissions officers in the first class of institutions claimed to use a coarse sieve. These institutions claimed to value sorting criteria that allowed them to process many applications quickly. A reliance on standardized tests was characteristic of institutions in this group, with almost 98 percent of cases reporting test scores were important. Concertedly cultivated criteria were reported as important at lower rates than the sample average. Interviews (6.5 percent) and essays (16.6 percent) were rarely identified as important. Institutions belonging to this category claimed to value extracurriculars at lower rates than the sample as a whole, although at higher rates than interviews (13 percent). Measures of ascribed status, such as whether an applicant identified as a first-generation (0 percent) or racially minoritized (0.3 percent) student, were rarely touted as important. Almost none (1.6 percent) claimed to give preference to legacy applicants.
As expected, institutions that used a coarse sieve were more likely to be public than institutions in the full sample. Almost 77 percent of institutions in this group were public. More than half of public colleges in our sample (54.8 percent) claimed to use a coarse sieve.
We refer to members of the second category as using a fine sieve. As the name implies, these institutions reported emphasizing concertedly cultivated over sorting criteria. Indeed, every concertedly cultivated measure was claimed as important at an above-average rate, including a near-universal emphasis on extracurriculars and volunteering. These criteria embody how wealth and status facilitate the concerted cultivation of an applicant (Weis 2016). Results were more uneven for sorting criteria. Standardized tests were identified as important at a significantly lower rate than in the full sample. By contrast, all institutions in this group claimed rigor of curriculum, the most granular of the sorting criteria in that it involves reviewing coursework, as important. This suggests institutions where admissions staff claim to value a fine sieve may place more emphasis on equity than do their peers given that prior research indicates school and community context tends to boost admission officers’ consideration of low socioeconomic status applicants (Bastedo and Bowman 2017). Bolstering this interpretation, the fine sieve class was also more likely than the sample as a whole to claim to value ascribed status indicators, such as whether an applicant identified as a first-generation or racially minoritized student. However, this is somewhat offset by the fine sieve institutions’ tendency to claim to consider an applicant’s legacy status and to emphasize concertedly cultivated criteria, which likely advantage middle-class and white students. Fine sieve admissions, in other words, could expand opportunity and reproduce privilege simultaneously.
More institutions in our sample claimed to use fine sieves than coarse sieves. The fine sieve class also differed in composition from the coarse sieve group. The fine sieve category primarily comprised private institutions, in contrast to the concentration of public universities in the coarse sieve.
Institutions in the third category used a double sieve, combining elements from the other two groups. These colleges claimed to place importance on most of the admissions components we examined. The importance of recommendations (93.5 percent), GPA (98 percent), limited use of legacy admissions (94.8 percent), and essays (91.6 percent) were asserted at high rates in this category. These components came from across the three different groups of criteria. GPA, a sorting criterion, was considered important at a higher rate than in any other class. Concertedly cultivated criteria, such as interviews, essays, and recommendations, were claimed to be considered important at above-average levels as well. Perhaps demonstrating that no institution can truly do everything, however, volunteering and work were not claimed as important at higher rates than in the full sample. Claimed consideration of whether an applicant identified as a first-generation or racially minoritized student were also indistinct from the sample average. Among ascribed status criteria, only claims about the limited use of legacy admissions distinguished this class from the sample average. This suggests institutions in the double sieve category focused on traditional measures of applicant “merit”—whether constructed through sorting mechanisms or concerted cultivation—rather than claiming admissions considerations that explicitly expand opportunity for underserved students.
The double sieve was the largest subsample we identified. Almost half of observations fell into this category. The majority of the group consisted of private institutions. Just one in eight members were public.
Change in Stated Admissions Values over Time
Figure 1 illustrates change over time in class memberships, our second question. Class membership was largely stable, as might be expected given that colleges are slow to change. The coarse sieve category slowly declined, dropping from 25 percent of cases in 2007 to 22.8 percent in 2015. This finding is consistent with prior research on the rise of holistic admissions over time (Furuta 2017). This change was not dramatic: Fewer than 10 institutions moved out of the coarse sieve and into the other two categories in about equal numbers, further dissipating a minor change. Membership in the fine and double sieve classes remained the same, with the exception of additions from the coarse sieve.
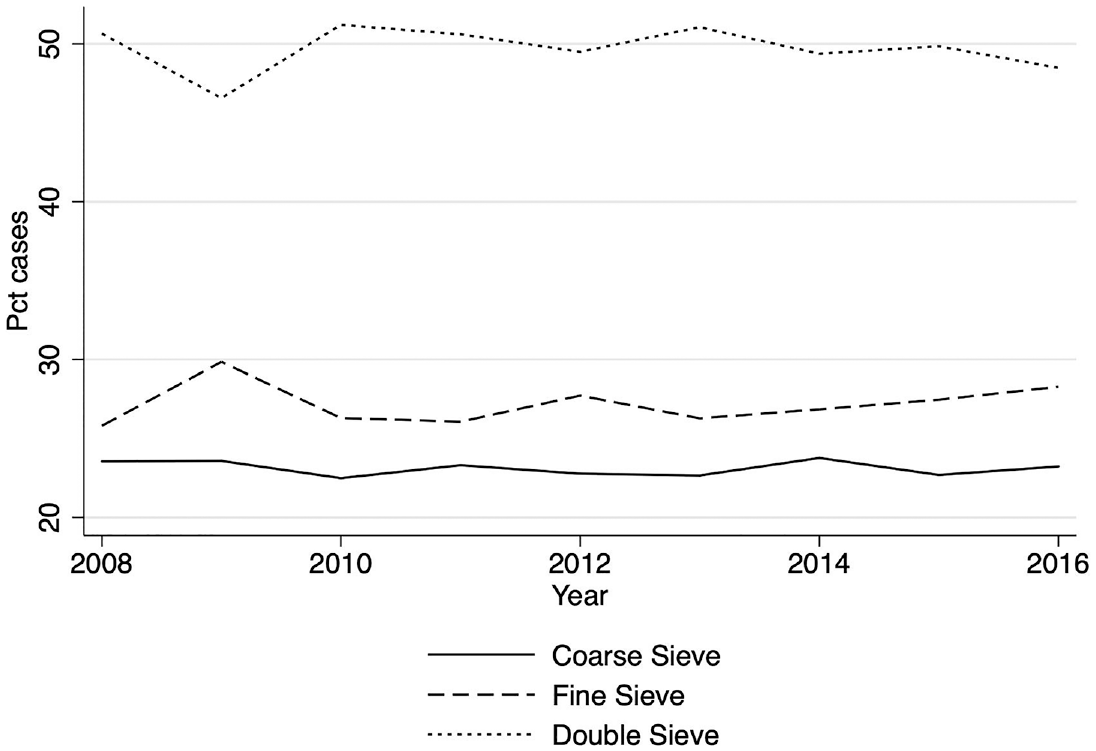
Latent class membership over time.
Public Institution Regression Results
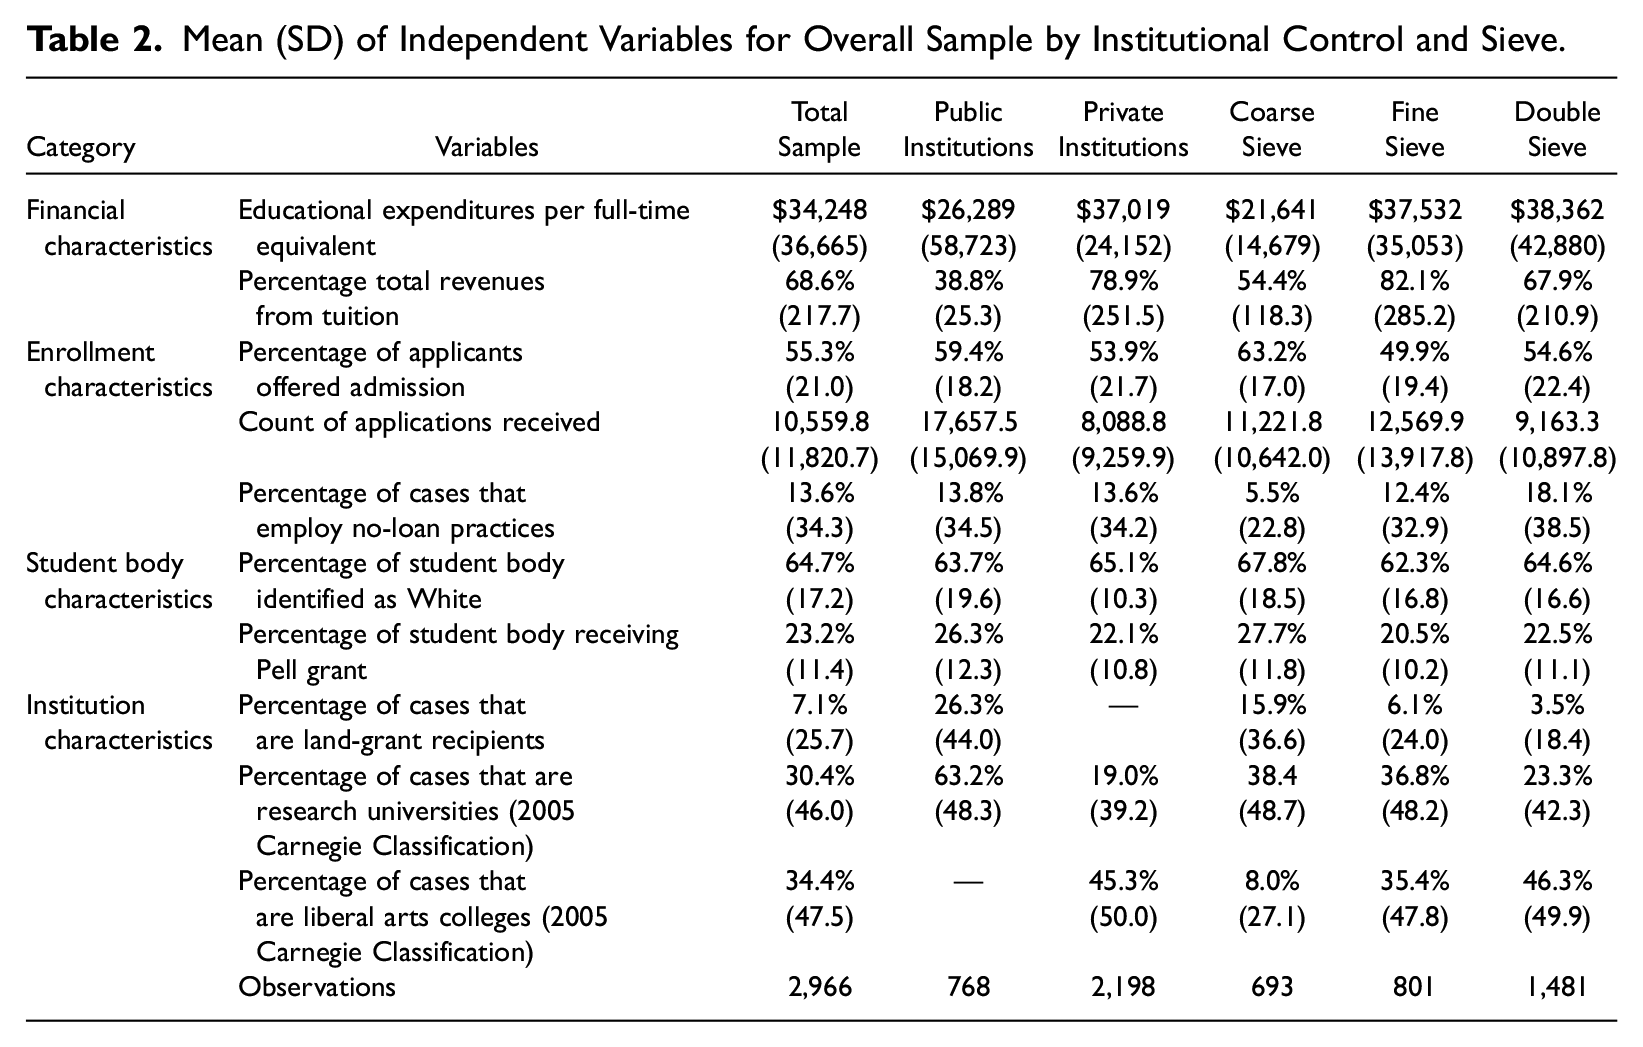
Table 2 presents descriptive statistics for independent variables, providing context for interpreting regression findings. Table 3 presents regression coefficients for public colleges for our third question. We omit coefficients for year fixed effects due to limited theoretical interest. The referent category is the coarse sieve because it is the largest category of public institutions. Institutions in the fine sieve class differ notably from those characterized by a coarse sieve (results in first column, Table 3). Net of other factors, a 1 percent increase in education expenditures per FTE relates to a 3.1-fold increase in the chance of belonging to the fine sieve category. Two enrollment characteristics are also associated with stated admissions values. A 1 percentage-point increase in the share of applicants admitted, net of other factors, is associated with a 2.5 percent decline in the chance of claiming a fine sieve. No-loan programs are also strongly associated with a fine sieve (relative to a coarse sieve).
Mean (SD) of Independent Variables for Overall Sample by Institutional Control and Sieve.
Results of Random Effects Multinomial Logistic Regression Presented as Exponentiated Coefficients (Relative Risk Ratios) Relative to the Omitted Category (Coarse Sieve), Public Colleges and Universities.
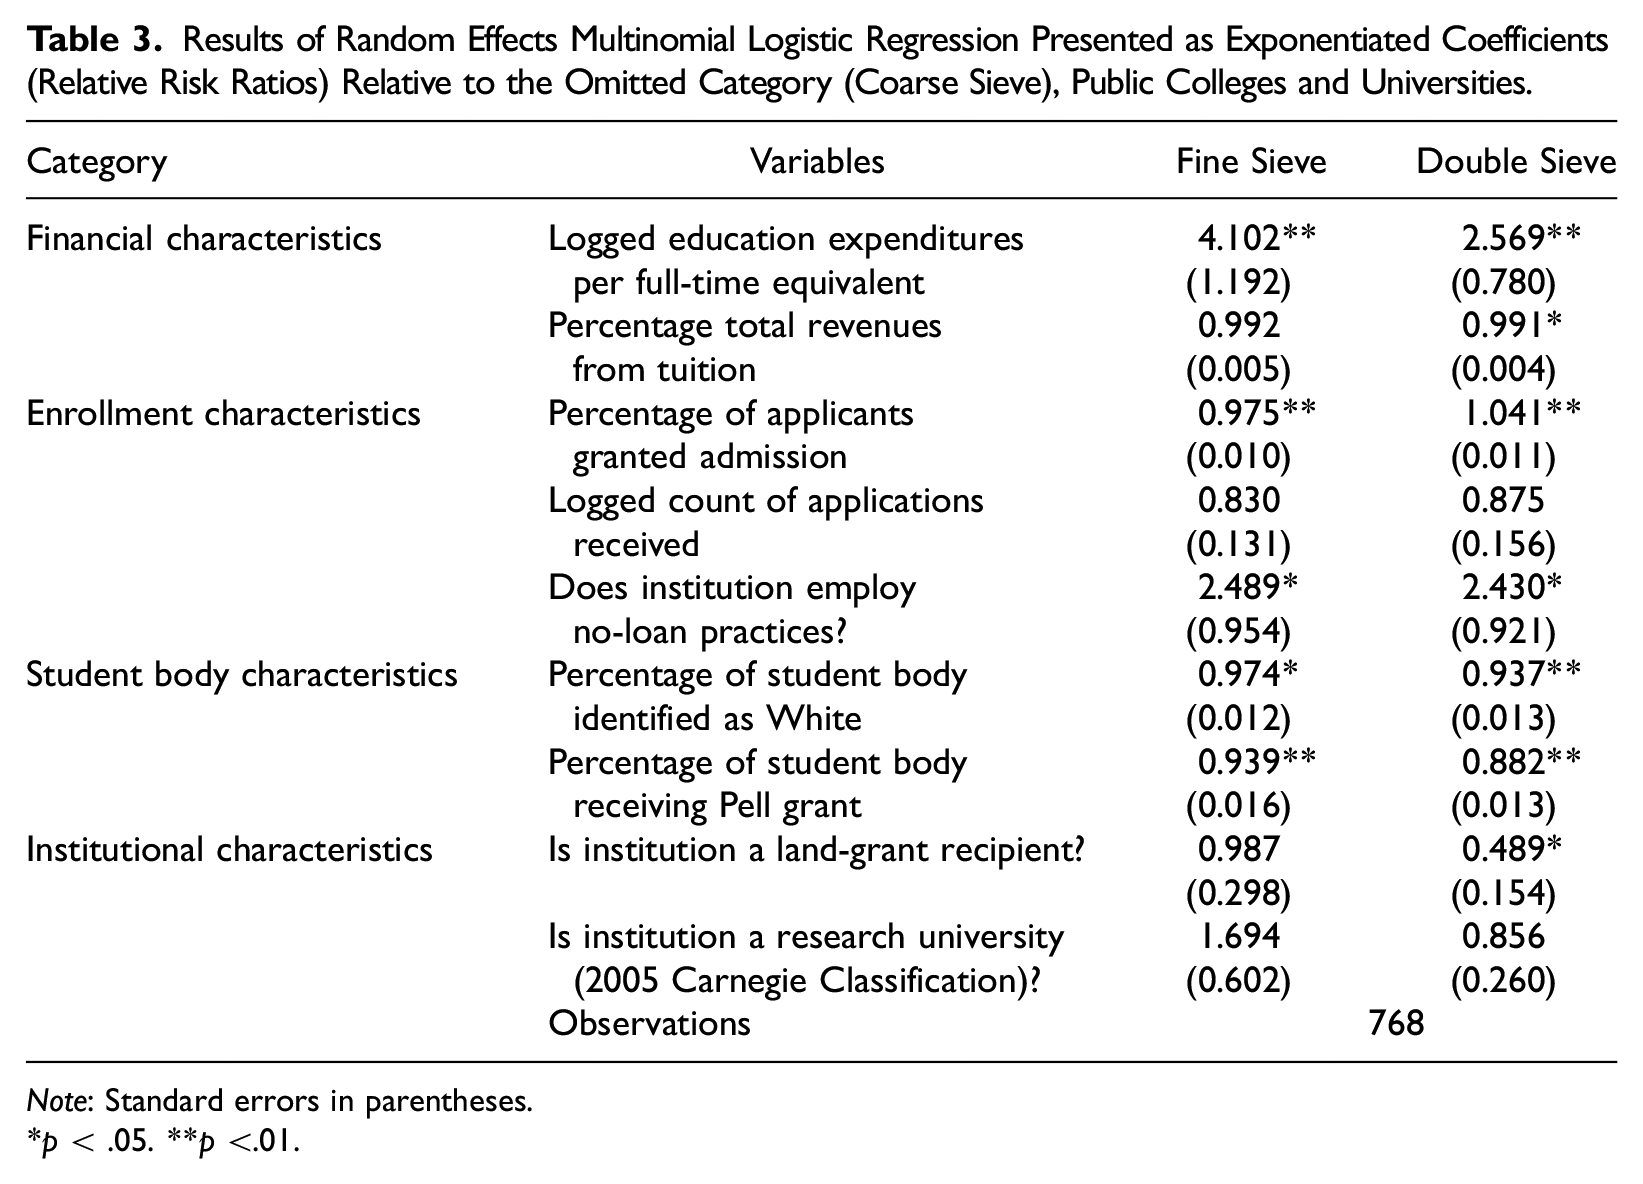
Note: Standard errors in parentheses.
p < .05. **p <.01.
The clearest differences between public institutions using coarse and fine sieves may be student characteristics. A 1 percentage-point increase in the share of students identified as white is associated with a 2.6 percent decline in the chance of claiming a fine sieve. In other words, public schools in the fine sieve class tend to draw a lower share of enrollment from white students than do those in the coarse sieve class. Similarly, a 1 percentage-point increase in the share of Pell Grant recipients is associated with a 6.1 percent decrease in the chance of fine sieve membership. These findings echo Jones and Nichols (2020), who note the dangers of relying on income or other proxies for students’ racial identities. Public institutions in the fine sieve class are more racially diverse and less likely to enroll Pell Grant recipients than their coarse sieve counterparts.
The second column of Table 3 reports results for the double sieve relative to the coarse sieve. Once again, an increase in educational spending per student is associated with an increase in the likelihood of double sieve membership. The source of revenue also matters. Increased tuition dependence indicates a smaller chance of being in the double sieve class. The magnitude of this coefficient is tiny (0.9 percent change in risk). However, the independent variable is spread across a wide distribution of possible values at public institutions (see Table 2). Accordingly, a given public college could witness notable rises in tuition dependence over time. We therefore conclude that this relationship is both practically and statistically meaningful.
Beyond money, public institutions in the double sieve class differ from their coarse sieve counterparts in other ways. Admissions selectivity points in the opposite direction from that observed in the case of the fine sieve. Less selective public institutions are more likely to belong to the double sieve than the coarse sieve class. Relative to the coarse sieve, a no-loan program is strongly associated with double sieve membership, whereas being a land grant institution is negatively associated with being in the double sieve class.
As in the case of the fine sieve, notable differences among public institutions appear when considering student characteristics. Institutions are more likely to belong in the double sieve than the coarse sieve class as the share of students identified as white declines. The likelihood of belonging to the double sieve group also declines as the share of students receiving Pell Grants increases. As with the fine sieve, institutions in the double sieve class seem to move both toward and away from equity.
Private Institution Regression Results
Table 4 presents results for private colleges. To facilitate nominal comparison across public and private schools, we retained the same referent category (coarse sieve). The first column reports results for the fine sieve relative to the coarse sieve. Neither financial variable is significantly associated with belonging to the fine sieve class relative to the coarse sieve. Among enrollment characteristics, application volume is negatively associated with fine sieve membership. Net of other factors, a 1 percent increase in applications is associated with a 19.7 percent decline in the likelihood of belonging to the fine sieve class. By extension, coarse sieve membership is more likely when greater application volume encourages the use of unidimensional sorting criteria. Research universities and liberal arts colleges are more likely than other private institutions to claim a fine sieve, relative to a coarse sieve.
Results of Random Effects Multinomial Logistic Regression Presented as Exponentiated Coefficients (Relative Risk Ratios) Relative to the Omitted Category (Coarse Sieve), Private Colleges and Universities.
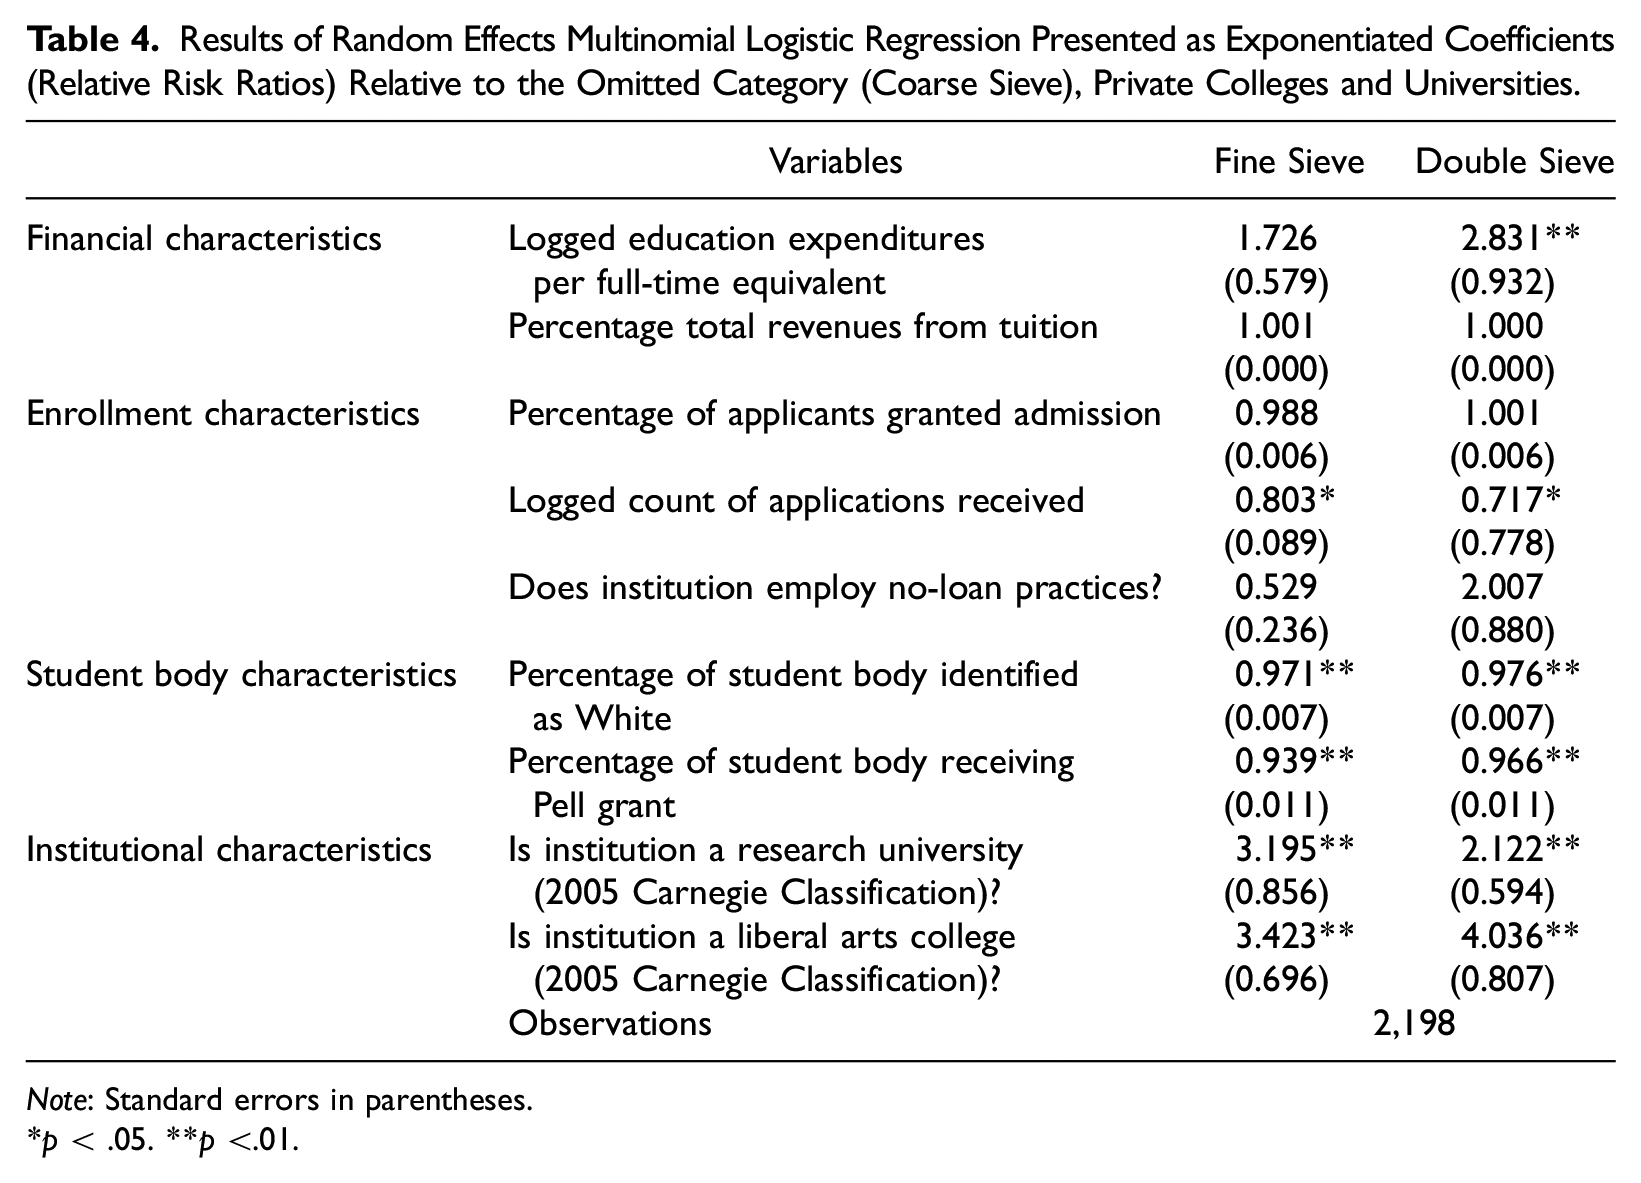
Note: Standard errors in parentheses.
p < .05. **p <.01.
Finally, student characteristics are associated with the likelihood of fine sieve membership relative to the coarse sieve. A 1 percentage-point increase in the share of students identified as white relates to a 2.9 percent decrease in the likelihood of fine sieve membership relative to coarse sieve. The share of Pell Grant recipients has a similar negative relationship with likelihood of belonging to the fine sieve class. These findings mirror associations in both public models.
The second column of Table 4 reports results for membership in the double sieve relative to the coarse sieve. In contrast to the fine sieve, one financial variable is associated with the likelihood of double sieve membership: a 1 percent increase in educational expenditures per FTE is associated with a 183 percent increase in the risk of membership. In other words, private schools in the double sieve group are better resourced than those claiming the coarse sieve. Among enrollment criteria, application volume is associated with double sieve class membership. A 1 percent increase in applications relates to a 28.3 percent decrease in the risk of belonging to the double sieve rather than coarse sieve class. As with the fine sieve, this relationship confirms our expectation that sorting criteria help admissions officers manage application volume. Research universities and liberal arts colleges are more likely to claim to use a double sieve rather than a coarse sieve. These findings also mirror those of the fine sieve.
Student characteristics further distinguish private schools belonging to the double sieve relative to the coarse sieve. A 1 percentage-point increase in the share of students identified as white is associated with a 2.4 percent decrease in the likelihood of double sieve membership. Similarly, a 1 percentage-point increase in the share of Pell Grant recipients is associated with a 3.4 percent increase in likelihood of membership, net of other factors.
The shape of the sieve: selective admissions and social inequities
Our analysis identified three approaches by which selective colleges wish to be perceived as choosing their students. A coarse sieve approach claims to place greater weight on test scores and other academic factors that would be useful to sort large volumes of applications. Institutions in this group report placing little emphasis on nonquantifiable components like essays, recommendations, and interviews. Over 60 percent of institutions in the coarse sieve class are public. This may seem like welcome news. Members of the coarse sieve report de-emphasizing concertedly cultivated criteria that are widely associated with racial and class privilege, instead relying on standardized criteria. Yet this has not broadened opportunity, with many prestigious public universities enrolling less diverse student bodies than do other public schools (Taylor and Cantwell 2019). Additionally, institutions in the coarse sieve class are less likely to report valuing ascribed characteristics, such as racially minoritized and first-generation status, which could promote equity. As with other forms of legalistic reasoning (Garces et al. 2021), being perceived as relying on sorting criteria might insulate public colleges from lawsuits or public scrutiny, but it does not promote equity.
Two other admissions approaches were used primarily by private institutions. A fine sieve approach claimed to place below-average emphasis on sorting criteria and above-average emphasis on concertedly cultivated criteria (essays, interviews, extracurriculars, volunteering) and ascribed status (first-generation or racially minoritized status). Institutions in the double sieve category claimed to combine sorting and concertedly cultivated criteria but reported de-emphasizing ascribed status criteria. This final characteristic of the double sieve, the largest category, is crucial to understanding the relationships between admissions values and inequities in society. Without explicit attention to racial or socioeconomic justice, colleges claiming a double sieve approach—like those claiming coarse sieve admissions—are likely to reproduce status quo inequities (Jones and Nichols 2020). The fact that almost half of sampled institutions reported emphasizing criteria that reward race and class privilege without emphasizing ascribed status criteria that could partly redress that privilege demonstrates how the social sieve of selective admissions reproduces inequities.
Because our data reflect admissions officers’ claimed preferences, our results suggest these groupings but cannot document them in actual practice. Perhaps claimed admissions values are regularly transgressed in practice. However, prospective students respond to signals from institutions, not just to practices, as indicated by students’ different responses to “sticker price” and “net price” tuition (Hillman 2012). Accordingly, we believe the signals we document as sieves are worth understanding. Future research might explore instances in which admissions offices want to be perceived one way but face organizational pressure to work in another.
Membership in these three categories was fairly stable over time, but this may change as growing numbers of public institutions reduce reliance on sorting criteria. During the COVID-19 pandemic, many institutions announced test-optional policies, some permanent (Rosinger 2020). Movement out of the coarse sieve, which is currently dominated by public universities, could change the landscape of what selective colleges claim to value in admissions.
As institutions become test-optional, they may report placing more weight on other application components. Public colleges that report abandoning testing requirements may be on their way to the fine sieve group, whose members claim to place greater emphasis on essays, recommendations, and extracurriculars. However, the concertedly cultivated criteria that dominate the fine sieve group are laden with racial and class privilege (Rosinger et al. 2021; Warren 2013). College admission is an outlet for anxieties attendant to preserving privilege because a seat at a desirable institution reassures families their children will enjoy advantages into the future (Ford and Thompson 2016). In other words, the privilege of households and institutions is linked through selective admissions.
Regression findings elaborated on the complex contours of these links. Public and private schools both became more likely to claim to use a coarse sieve as the share of enrollment identified as white increased. In other words, the coarse sieve is associated with racial privilege, perhaps because so few members of that category assert the importance of ascribed status criteria. At the same time, the coarse sieve is positively associated with the share of Pell Grant recipients, implying this kind of sieve could expand socioeconomic opportunity while constraining racial equity. These relationships indicate the complex ways privilege is perpetuated by selective admissions. Different espoused admissions values recognized and reified different forms of social privilege.
All sampled colleges practiced selective admissions, but the most desirable and competitive seats are those at the wealthiest private institutions (Taylor and Cantwell 2019). Among private colleges, educational spending per FTE is strongly associated with claims to use a double rather than a coarse sieve. Private research universities and liberal arts colleges are more likely than other institutional types to use a fine or double sieve. Even selective public schools followed these general contours, with increased educational spending and no-loan programs associated with claims to use a fine or double sieve.
We present these findings with a high level of confidence, but our analysis is limited in important ways. Given that public institutions in states that had banned affirmative action in college admissions were nominally (although not statistically) more likely to be missing data on admissions practices than institutions in states without bans, we urge some caution when extrapolating our findings to selective institutions in these states. Sampled public universities are concentrated in the coarse sieve category of stated admissions practices, perhaps because it is the most legally defensible strategy. Public institutions from states that banned race-based affirmative action might have failed to report data on admissions practices because they used another model of admissions practices. We cannot know this based on the data at hand, so we caution against generalization of our results beyond what we observed. Future research might more closely consider admissions practices in the context of state and federal policies, particularly in light of the summer 2023 Supreme Court rulings that severely restrict race-conscious admissions considerations. Subsequent analyses of these institutions will be particularly important in understanding college admissions practices and the institutional characteristics that relate to different practices at public and private institutions.
In addition, our findings are more generalizable to wealthier, more selective, and less diverse selective institutions because these institutions are more likely to report admissions practices than their less (although still) selective peers. This pattern of missing data may indicate institutional capacity. The highest spending institutions are also the most likely to be able to afford continuity in the staff members who report data. Alternatively, or additionally, this pattern could indicate that the most exclusive institutions are most eager to share information on the bases of exclusion as a means of stimulating additional interest and application volume. We cannot test these possibilities with the data we have. We can say with confidence, however, that our results describe the operations of higher spending, more exclusive institutions more accurately than those of other colleges and universities.
Indeed, it is important to note that the relationships we identified are not deterministic. Our analyses are associational. Furthermore, we unearthed some countervailing evidence. For example, among private institutions, fewer applications were associated with fine and double sieves. In other words, private institutions that claim to use the coarse sieve may do so to quickly process many applications. This finding is intuitive given the prominence of sorting criteria in the coarse sieve category. It also troubles the link between professed admissions values and institutional position because greater application volume is associated with both high status and the coarse sieve.
On balance, our regression findings suggest access to the most desirable seats—as indicated by financial resources, enrollment characteristics, and institutional traits—may be allocated via fine or double sieves rather than a coarse sieve. The most desirable institutions claim to engage in the parsing of fine distinctions among concertedly cultivated criteria rather than using a coarse sieve and the sorting criteria it entails. Because household and institutional status are linked, students may respond to this attention to personhood by investing greater effort in cultivating their admissions personae (Furuta 2017). Selective admissions can be a generative process (Gebre-Medhin et al. 2022). As admissions officers focus on the ever-finer grains of distinction applicants cultivate, they create incentives for students to cultivate even finer-grained distinctions.
This feedback loop reinforces broader social patterns. With ever more people seeking a postsecondary credential, where a person goes to college has become a status marker. This drives application volume for the most desirable institutions even higher (Cantwell 2018; Cantwell, Marginson, and Smolentsiva 2018; Marginson 2016). Organization-level admissions practices seem likely to exacerbate these trends, driving demand even higher—and the means by which applicants are sorted even finer—for the most prestigious seats.
Given these ties to broader social problems, we think altering admissions practices is unlikely to address the dynamics of power and privilege inherent in selective admissions. Changes to admissions values can help de-escalate the cycle we describe, but durable inequities will remain, and savvy social actors will find means to consolidate their positions under new rules. For example, it is reasonable to think that dramatic changes to the legal environment might shift stated admissions values. Yet in two-sample t tests, the public institutions in states that had banned race-based affirmative action differed statistically from their counterparts on only a few of the measures used to fit our LCA (writing sample, recommendation letters, and grades). Broad regulatory changes clearly matter, but they may matter less at the most selective institutions, where social status and accumulated resources provide some insulation for campus decision makers (Taylor, Barringer, and Warshaw 2018). In other words, officials at the institutions we studied appear to enjoy some latitude in decision-making.
Changing from one suite of stated admissions values is rare (Figure 1) both because few institutions are able to improve their social position and because the staff of successful institutions work diligently and creatively to consolidate their status, even as the rules that govern them shift. When changes do happen, they are likely to make at best a partial step toward greater equity. After all, we found that admissions practices associated with racial privilege (the coarse sieve) differ from those associated with class privilege (the fine and double sieves).
Accordingly, we encourage advocates for a more just higher education system to question the underlying premise of selective college admissions. Today’s hypercompetitive landscape is of recent vintage. Admission to even the most prestigious private universities was not especially competitive in the first half of the twentieth century (Axtell 2016). Intense competition to secure admission to a few highly desirable institutions is not inevitable.
Left unchecked, however, the current system is likely to continue—and to exacerbate the problems we document. Competition for admission to a few elite colleges intensified as demand for enrollment began to outstrip the number of desirable seats (Marginson 2006). Given that a necessary component of a more just admissions system is expanded participation, we see no reason to question the demand side of this situation. Instead, we encourage policymakers and scholars to concentrate on the supply side. We call for reinvestment in moderate-status public schools to close the demand gap between these institutions and universities that currently practice selective admissions. Such a strategy would be partial and incomplete. We do not imagine applicants would suddenly prefer a middle-tier public university to Stanford or Yale. Even so, we view this as a better option than narrow adjustments to admissions values that seem unlikely to substantially alter enrollment opportunities. Fiddling with the shape of the sieve—that is, emphasizing some criteria and de-emphasizing others—may slightly change how admissions officers select students. The greater challenge is to ensure students who get caught in the sieve have other good options. The most direct way to make the consequences of being sorted less dire is to raise educational spending at middle-tier institutions. Such a system could weaken the link between selective admissions and social inequities.
Footnotes
Research Ethics Statement
The research reported here does not constitute human subjects research.