
Abstract
The study of affirmative action bans suffers from focusing on the ivory tower as the site for the impacts of affirmative action bans. Prior literature on affirmative action bans has missed the bigger picture, failing to see that less glamorous schools have also been impacted by the bans. This article fully fleshes out the impacts of affirmative action on postsecondary education by their level of selectivity (Barron’s Admissions Competitiveness Index) and sector (private, public, and for profit) from a merged data set (Integrated Postsecondary Education Data System and the Current Population Survey) spanning 1991 to 2016. The results of a differences-in-differences analysis find that a small group of for-profit institutions with very large enrollments became a destination for underrepresented minority students in the wake of affirmative action bans.
Keywords
Beginning with Proposition 209 in California in 1996, 10 states have passed bans on the practice of affirmative action, preventing public institutions of higher education from considering race in admissions or the awarding of scholarships and other financial aid. 1 A legal challenge to the legitimacy of the state-level bans (particularly in Michigan), Schutte v. Coalition to Defend Affirmative Action (2014), resulted in a six to two Supreme Court decision that did not disrupt states’ abilities to impose bans on affirmative action. 2 This study exploits state-level variation in the presence and timing of affirmative action bans in the first nine affirmative action ban states and uses the nonban states as a control to estimate the effect of these bans on college enrollment of underrepresented minority (URM) students.3,4
The term URM generally refers to an ethnoracial group with a smaller percentage within a significant subgroup (e.g., college enrollees) than the ethnoracial group comprises in the general population (e.g., college-age people 18–22 years old). Although the term URM is itself critiqued for denying groups the right to name themselves, obfuscating the different circumstances existing within the URM group (e.g., differential effects between Black and Hispanic individuals), and implying a racial hierarchy in which non-URMs dominate URMs (Bensimon 2016; Lane 2005; McNair, Bensimon, and Malcom-Piqueux 2020; Walden et al. 2018), this article assesses the effect of the bans on people grouped by this term because the term is so closely tied to educational civil rights.
As measured in this study, the term also excludes some categories within the Asian American ethnoracial group that are sometimes considered URMs by their institutions. For example, bachelor’s degree attainment is lower for Cambodian (16.4 percent), Laotian (18 percent), Hmong (18.4 percent), Burmese (21.3 percent), and Vietnamese (29.5 percent) individuals. Conversely, some groups have much higher bachelor’s degree attainment: Indian (74.2 percent), Korean (56.3 percent), Pakistani (56.2 percent), Chinese (55.4 percent), and Japanese (51.6 percent; Snyder, De Brey, and Dillow 2019). However, because the National Center for Education Statistics does not collect this heterogeneity data and because it is uncertain which postsecondary schools identify these subgroups as URMs, this is a limitation of this study.
Nevertheless, in the Grutter (2003) Supreme Court case, the term “underrepresented” appears 41 times in the decision and the various concurring and dissenting opinions, and it appears twice in the four-page syllabus (i.e., summary). Although it was never formally held that higher education institutions were required to operate using this definition, Justice Thomas’s minority opinion stated, “the Court clearly approves of only one use of race—the distinction between underrepresented minority applicants and those of all other races.” In response, several institutions clarified their definitions of “underrepresented.” 5 For instance, on March 19, 2004, the Association of American Medical Colleges (2022) Executive Committee adopted a clarification to its definition of “underrepresented in medicine.” Furthermore, given the conservative tilt of the current Court (which includes Justice Thomas) and the looming legal battle over affirmative action involving Harvard and the University of North Carolina, an analysis using the term URM may be more relevant than an analysis using the more heterogenous ethnoracial categories defined by the Office of Management and Budget (1977, 1997, 2000).
Previous work on affirmative action bans has shed light on some of the changes in URM undergraduate student enrollment (Backes 2012; Bleemer 2020; Hinrichs 2012), but it has been unable to explain what happened to URM students in the wake of these bans. These studies estimate that URM enrollment declined at the most selective institutions, yet there is no evidence of an increase in URM enrollments across any groupings of postsecondary education. Sander (2004:411) claims the “lack of good empiricism on this issue results from the tendency of researchers, public intellectuals, and media to focus on the glamorous schools and to give only passing attention to those in the trenches.” These studies did not differentiate for-profit institutions from “private schools”; thus, the focus on some of the less glamorous schools in the trenches was lost. 6 This study distinguishes for-profit from other private schools and, like prior work on affirmative action, uses the Barron’s classification as the primary measure of selectivity (Alon and Tienda 2005; Kehal, Hirschman, and Berrey 2018; Long and Bateman 2020). By highlighting these schools, this work more fully explains the effects of state-level affirmative action bans across the landscape of undergraduate postsecondary education, filling a lacuna in research on affirmative action in university admissions. In describing the robust changes in enrollment due to affirmative action bans, this study directly answers the question, “Where did all of the underrepresented minorities go after affirmative action bans?”
The Anti-Affirmative Action Avalanche
The “anti-affirmative action avalanche” describes the slide of URM students down the tiers of undergraduate postsecondary education while also considering if URM students enroll in college at all in the wake of affirmative action bans. The avalanche consists of two central mechanisms, each occurring at a different level: the institution and the state. The first mechanism is racial self-interest at the state level. Baker (2019) found that state-level bans on affirmative action (most of which were state-level policy ballot initiatives) were driven mainly by variables motivated by the White racial majority’s self-interest to preserve its group privilege. As such, affirmative action bans are a notable racialized instance of opportunity hoarding (Tilly 1998) at the state level: The non-URM racial group hoards the resource of education through the bans to preserve its access to the highest quality education. Much like critical race theory suggests (Christian, Seamster, and Ray 2019; Ladson-Billings and Tate 2006; Park and Liu 2014), the group-level hoarding of opportunities elucidates how the legal system distributes resources and opportunities to the racial groups best positioned to reap the rewards of postsecondary education. 7
The bans are consistent with other work that argues a group’s self-interest governs educational resource distribution (Alon 2009, 2015; Lucas 2001), particularly regarding affirmative action (Warikoo 2016). Policy is ostensibly framed as a public good, often purporting to serve the greater society instead of particular interest groups (Shukla 2017). However, those in power largely define the public good (Levinson, Sutton, and Winstead 2009). As Rodriguez, Deane, and Davis (2022:10) write, “power in policymaking arenas has served as a function of racial domination, control, and exclusion from institutions of social and political authority.”
Considering race specifically, Baker’s (2019) work on the state-level determinants of affirmative action bans embodies the hallmarks of Bobo and Hutchings’s (1996) social-psychological racial group position theory (i.e., prejudice, racial dominance, and a threat to resources). Blumer’s (1958) seminal work on group position argues that racial prejudice results from competition and the threat of losing relative status within a socio-racial hierarchy. Bobo and Hutchings (1996) build on the theory by showing how racial alienation and self-interest result in racial prejudice. The bans exemplify the prejudicial response manifested into law by the dominant racial group, whose educational prospects are perceived as threatened by affirmative action. Bobo’s (1998) work confirms that the perceived threat of affirmative action inspires prejudicial attitudes by White individuals toward affirmative action. This study empirically shows that racial self-interest at the state level succeeds because state-level, racial-group self-interests govern the distribution of educational resources through affirmative action bans. I capture racial self-interest at the state level by comparing ban states to nonban states to show differences in URM student enrollment patterns.
The second mechanism I uncover, organizational racialization, occurs at groups of institutions classified by their level of selectivity. This mechanism shows that the effects of affirmative action felt at one institutional tier reverberate across the whole system of undergraduate education, but not as traditionally understood by institutional isomorphism (DiMaggio and Powell 1983). The affirmative action cascade is more akin to Ray’s (2019) and Wooten’s (2019) work on racialized organizations, which builds on Omi and Winant’s (2012, 2014) racial formation theory to argue that organizations implement and reinforce the racial hierarchies existing in society. When postsecondary institutions first applied affirmative action to give historically marginalized ethnoracial groups increased access to postsecondary education, it disrupted the connection between the U.S. racial hierarchy and the hierarchy of prestige and merit at postsecondary institutions (Stulberg and Chen 2014). Later, state-level affirmative action bans reforged the connection between these hierarchies that affirmative action had disrupted. Ultimately, these bans began to restore the ethnoracial inequality in postsecondary education that had existed prior to affirmative action policies.
I argue that affirmative action bans set off a chain reaction of organizational racialization within postsecondary institutions (Bleemer 2020; Sander 2004). Unlike Bleemer (2020) and Sander (2004), who suggest the bans created a cascade pattern, I use the more disastrous term avalanche to emphasize the plight URM students have suffered due to the bans. Previous studies of affirmative action bans emphasize that URM enrollment changes due to these bans occurred almost wholly due to organizational responses to admitting students from particular racial groups and not changes in student application behavior (Bleemer 2020; Card and Krueger 2005; Mickey-Pabello and Garces 2018). I explore this mechanism of organizational racialization by estimating how URM student enrollment changed at each level of university selectivity.
The avalanche starts at the most selective institutions, where affirmative action bans first displace a group of URM students (Backes 2012; Hinrichs 2012). The rejection of URM students from the most elite institutions sets off a chain reaction across the various tiers. Figure 1 shows the hypotheses for each institutional tier, or selectivity level, to show how students have been “avalanched” by institutional responses to affirmative action bans. Bleemer’s (2020) study underscores why some of the movement in the middle tiers of selectivity is not captured when using enrollment as a dependent variable. After URMs slide from the top of the avalanche, the competition for resources renews at each tier of the anti-affirmative action avalanche. As a group of URM students is displaced from the most selective institutions (the starting zone),
8
it creates new competition for a limited number of enrollments available at the next tier of postsecondary education (the track). In Bleemer’s (2020:10) words: Overall, these patterns are consistent with a substantial cascade of URM students from more-to less-selective universities after 1998, with URM students from more-selective schools taking the less-selective university seats previously held by lower-[academically qualified] URM students rejected in the absence of affirmative action, who themselves take the seats of other URM students who formerly enrolled at even less-selective universities. This cascade explains why the proportion of each campus’s URM applicants who enroll at that campus only declines at the three more-selective campuses.
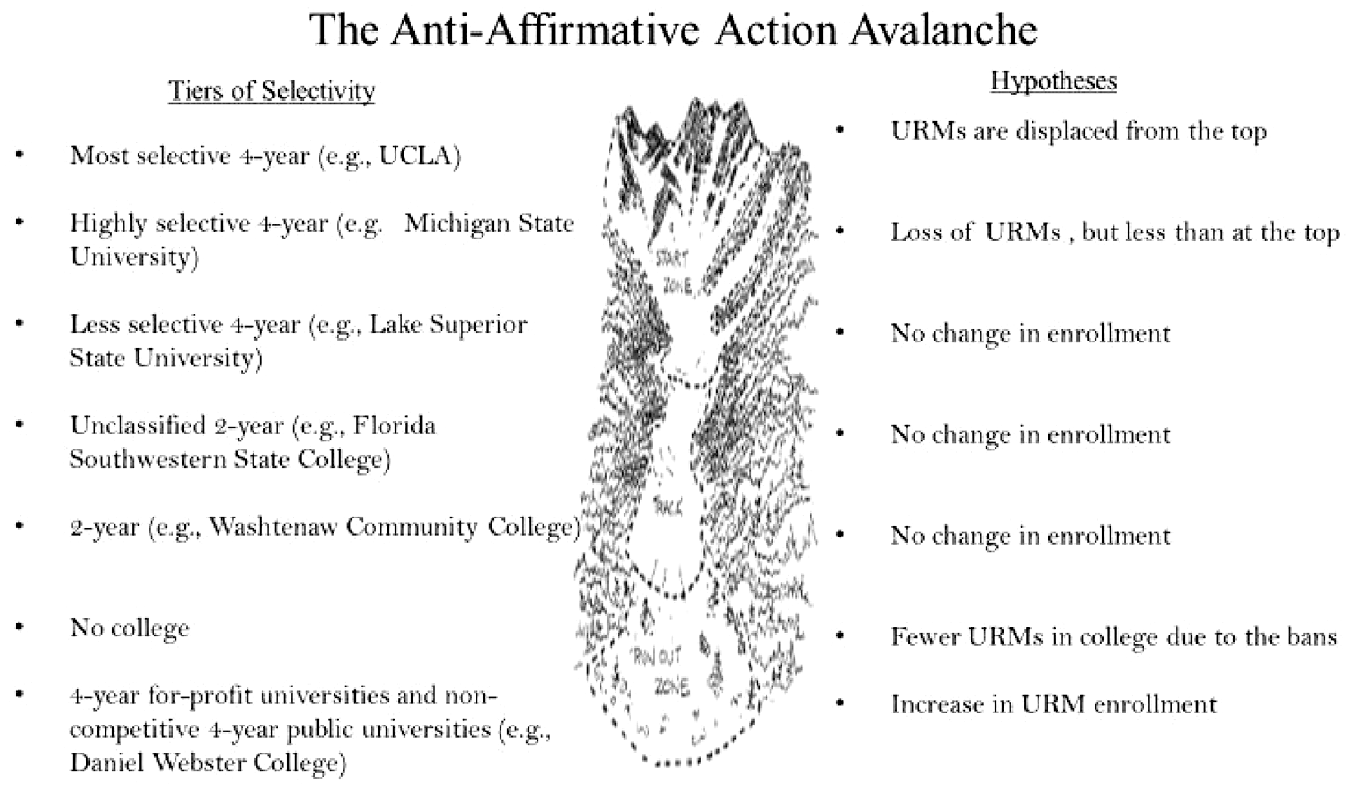
Hypotheses of the affirmative action avalanche.
Although I cannot trace students’ applications and admissions decisions due to the limitations of the Integrated Postsecondary Education Data System (IPEDS), this study expands the analysis of enrollment beyond Bleemer’s (2020) focus on the University of California system because I investigate the entire system of U.S. undergraduate postsecondary education.
After the starting zone (i.e., the top), students enter a competition between less academically qualified URMs and similarly qualified non-URM students at less selective four-year schools. This pattern continues at every tier down the anti-affirmative action avalanche (to four-year schools unclassified by selectivity and then to two-year public and private schools; the rest of the track) until a final group of URM students hits the base of the mountain (the runout zone; consisting of for-profit schools and four-year public, noncompetitive schools). Along the way down, competition lessens. However, because only 20 to 30 percent of colleges and universities can pick and choose their students (Bowen and Bok 2016), prior work on the effect of affirmative action bans has focused on these schools. Yet the applicants displaced by the bans at the most selective schools reverberate through the other 70 to 80 percent of schools. There is movement through this middle part of the anti-affirmative action avalanche, as shown by Bleemer (2020), but there should be no statistically significant affirmative action ban effects in the track of the avalanche (i.e., less selective four-year schools and two-year colleges) because students in the track (i.e., the middle of the avalanche) push down students in the lower tier of selectivity; there is no net gain or loss because other URMs replace these URM students. In other words, the net change in URM enrollment for the tiers of education comprising the track (i.e., less selective four-year and two-year schools) should be close to zero.
The runout, the bottom of the avalanche, is where the percentage of URM students should increase because it is the only place left for them to go. Although the American Dream posits that no postsecondary education is the least desirable outcome, not enrolling in postsecondary education may be preferable to attending a for-profit college (Cottom 2017). One audit study found no differences in getting a job interview between someone with a high school degree and someone who attended a for-profit institution (Darolia et al. 2015). For-profit colleges practice unethical recruiting, target vulnerable populations such as racial minorities and people with low incomes (Dougherty et al. 2016; Lahr et al. 2014), provide low-quality education, produce lower graduation rates, saddle students with more student debt, and offer fewer job prospects than their peer institutions (Cellini and Koedel 2017; Gilpin and Stoddard 2017; Lynch, Engle, and Cruz 2010; Schade 2014). Because for-profit schools are part of the bottom of the avalanche, there can be no more displacement into a lower category. Therefore, I hypothesize an increase in URM enrollment at for-profit schools.
Additionally, this study tests if there are other lower-selectivity schools, not just for-profit schools, where URM students may have enrolled. To further ensure that the bottom of the avalanche is truly for-profit schools or other less selective schools and not “no postsecondary enrollment,” I conducted another analysis to measure the change in the share of URMs who did not enroll in college. The hypotheses about the bottom of the avalanche are included in Figure 1.
Data and Methods
Data
This study used the IPEDS and the Current Population Survey (CPS) from 1991 to 2016. I take advantage of rich state-level variation across the implementation years of the bans in each state and the period before implementation of these bans to apply a difference-in-differences model that estimates the causal effect of the bans (California, 1997; Texas, 1997; Washington, 1999; Florida, 2001; Michigan, 2007; Nebraska, 2009; Arizona, 2011; New Hampshire, 2012; and Oklahoma, 2013; I exclude Idaho, 2020). Focusing on 1991 to 2016 ensures the bans studied have the pre- and postban periods required by the analysis. Texas was included only through 2003, when Grutter v. Bollinger overturned the Hopwood v. Texas decision. After 2003, Texas is treated as missing because the staggered difference-in-differences analyses used here cannot accommodate instances in which a group becomes treated and then untreated (Baker, Larcker, and Wang 2022; de Chaisemartin and D’Haultfoeuille 2020; de Chaisemartin, D’Haultfoeuille, and Guyonvarch 2019; Goodman-Bacon 2018; Goodman-Bacon, Goldring, and Nichols 2019). Because Idaho passed its ban on affirmative action in 2020, it is treated as a nonban state in the analysis (through 2016). However, once time passes and the data mature, Idaho should be included as a ban state in future studies.
URM students are coded as 1 if they are Black (African American), Hispanic, or Native American (0 otherwise). International students are classified as “race/ethnicity unknown” and thus as non-URM. These are the categories used by colleges and universities when they report data to IPEDS. 9 I use the URM category and not the Office of Management and Budget ethnoracial categories because the landmark Supreme Court Case Grutter v. Bollinger (2003) specifies this definition to measure the need for race-sensitive policies in postsecondary education: “the Court clearly approves of only one use of race—the distinction between underrepresented minority applicants and those of all other races.”
The units of analysis in this study change based on the analysis. For most of the analyses, the unit of analysis is the institution, to measure the enrollment of URMs by various tiers of selectivity. The exception is an analysis investigating whether URMs were displaced entirely from higher education in response to the affirmative action bans. The units of analysis here are persons age 18 to 35. Although 22 to 35 is frequently used as the college graduate group, I included 18- to 21-year-olds to capture currently enrolled students (i.e., “some college, no degree”). This analysis uses the CPS’s Annual Social and Economic Supplement downloaded from the Integrated Public Use Microdata Series (Ruggles et al 2019) to construct the dependent variable: no college (1 = no college, 0 = any college). Respondents with more than a high school degree are coded as 0 (i.e., one year of college and some college, no degree or greater), and those with a high school degree or less are coded as 1. This coding best captures whether URM students were displaced from postsecondary education altogether.
Most of the analyses investigate how the share of URMs enrolled in postsecondary institutions changed differentially due to affirmative action bans; these analyses used institutions as units of analysis. The dependent variable for these analyses is the share of URM students enrolled according to the institutions’ characteristics. I use institutions’ sector (two-year or four-year and private, public, or private for-profit) and level of selectivity to stratify the analysis to see where the share of enrolled URMs changes after affirmative action bans. Colleges are classified by their Barron’s Admissions Competitiveness Index to measure selectivity. The categories are “most competitive,”“highly competitive,”“very competitive,”“competitive,”“less competitive,”“noncompetitive,” and “special.” Because some categories contained very few schools (e.g., only eight public schools are in the most competitive group), I recoded most competitive, highly competitive, and very competitive as “highly selective”; competitive, less competitive, noncompetitive, and special were recoded as “less selective”; and schools that Barron’s did not index were coded as “unclassified.” The special category includes some highly competitive art, music, and design schools that have low admissions rates (e.g., less than 7 percent for Juilliard in 2020); those admissions processes are special because they often require a portfolio or audition to be accepted. The unclassified category retains 963 schools for the analysis (385 for-profit, 185 public, and 393 private nonprofit). Results are reported for both the recoded (in the text) and nonrecoded (see Appendix D in the online Supplemental Material) measure of Barron’s selectivity to illustrate the difference between the two categorizations. Comparing both results, we see that the choice to recode or not recode the categories does not change the substance of the findings.
I included many state-level variables from the CPS to control for state variation. Table 1 shows these controls’ means and standard deviations for ban states and nonban states. These variables include state-level racial demographics (i.e., percentage of the population that is White, Asian, Black, Latino, Native American, or other), state-level educational attainment (i.e., 25- to 34-year-olds with at least a bachelor’s degree), and state-level economic indicators, including the unemployment rate of the population most susceptible to the effect of the bans upon graduation (25- to 34-year-olds) and personal income (also for 25- to 34-year-olds). 10 Due to the analytic strategy used, time-invariant state differences are controlled. The importance of these variables is detailed in Appendix B in the online Supplemental Material, which also discusses the parallel trend assumption. Succinctly, these variables control for ban state and nonban state differences in the dependent variable that are not explained by the bans alone. The results in Appendix B in the online Supplemental Material suggest caution in interpretation of the “highest selectivity” category of public institutions due to the presence of anticipation effects. These anticipation effects suggest the bans’ effects occurred before the bans were implemented, in anticipation of their implementation.
Covariates for Ban States and Nonban States.
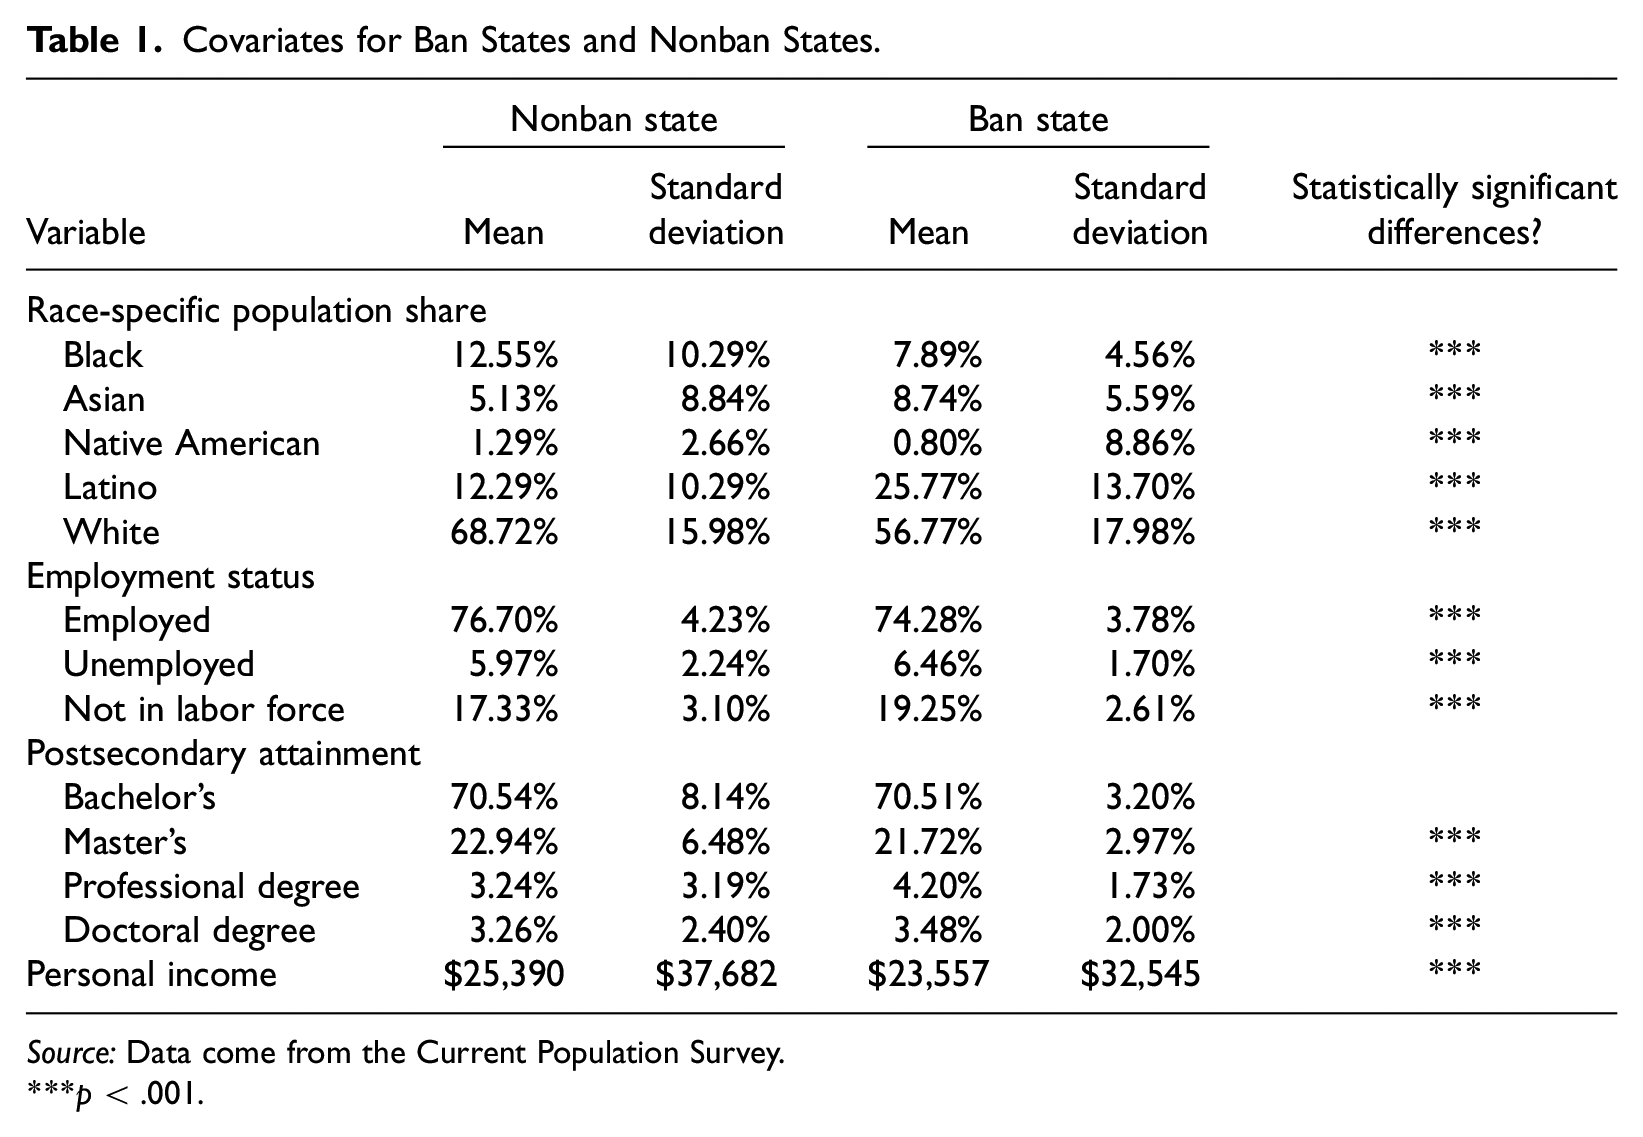
Source: Data come from the Current Population Survey.
p < .001.
The results of this study are weighted by enrollment and unweighted. The weights are equal to the total number of enrolled students at a given institution (Afifi, May, and Clark 2003; Backes 2012; Garces and Mickey-Pabello 2015; Hill 2017; Hinrichs 2012, 2014, 2020; Mickey-Pabello and Garces 2018). The analysis weighted by enrollment yields results concerning a typical student; the unweighted analysis yields results that reflect the typical school. Because there is evidence that a small handful of for-profit colleges make the weighted estimate for for-profit schools statistically significant while the unweighted estimate is not statistically significant, I estimate Cook’s distance to hone in on the most influential for-profit schools driving this result. After finding these most influential schools, I use a mixed-methods approach to further explore the four most influential schools. Descriptive quantitative information about these schools’ enrollment characteristics before and after the bans are presented alongside qualitative data drawn from secondary news media sources to reveal details regarding the institutions’ histories, recruitment tactics, and lawsuits due to their recruitment tactics. 11 These details show that URM enrollments profoundly changed at a small number of institutions, but the typical for-profit school did not experience a dramatic change. In summary, the reliability and validity of this novel finding are undergirded by a causal inference model, descriptive statistics, and qualitative data.
I also investigate the timing of the bans through analysis of various time points as the onset of the bans: ratification, implementation, and fall cohort. Ratification marks when the ban became law. Implementation marks when admissions decisions became race-neutral. Fall cohort refers to the cohort of entering first-year students first affected by changes in admissions policies. The complete arc of time between ratification, implementation, and fall cohort spans two to three years and varies by state; this suggests the “onset of treatment” is complex (see Appendix A in the online Supplemental Material). All three points are analyzed as the “onset of treatment” in this study’s analytic design, but only the implementation period is presented and discussed in the main text. An analysis of the ratification and fall cohort timings is included in Appendix C in the online Supplemental Material.
Analytic Strategy: Difference-in-Differences-in-Differences
A difference-in-differences strategy estimates the effect of affirmative action bans on URM enrollment. Many scholars have used this strategy to study bans on affirmative action (Backes 2012; Bleemer 2020; Garces and Mickey-Pabello 2015; Hinrichs 2012; Mickey-Pabello and Garces 2018). In this analysis, the “first difference” compares the proportion of URM enrollees before and after an affirmative action ban. If the affirmative action ban affected URM enrollment, there would be a change after the policies were enacted. However, because URM enrollment may differ year to year for reasons other than the bans (e.g., changes in demographics or labor market conditions), this first difference may also reflect these other changes. Thus, a “second difference” is used to capture any external trends by taking advantage of a comparison group of people who lived in states where affirmative action bans were not implemented. Among people in nonban states, enrollment changes over the same period are attributed to underlying trends rather than affirmative action bans. After subtracting the second difference from the first, an estimate of the causal effect of affirmative action bans on URM enrollment remains.
This estimation strategy is implemented in a multilevel regression framework before applying difference-in-differences-in-differences (i.e., triple difference), using fixed-effects accounts for the hierarchical nature of the data (Murnane and Willett 2011). This does not mean there are two analyses (one state level and another institutional level). The two levels in this hierarchical model emphasize that the bans occurred at the state level but that URM enrollment changes occurred at the institutional level (i.e., the units of analysis). The state level corresponds to the mechanism of racial self-interest at the state level, and the institutions correspond to the mechanism of organizational racialization. State-clustered standard errors account for residual correlation not eliminated by state fixed effects alone or robust standard errors (Bertrand, Duflo, and Mullainathan 2004). However, because the number of clusters is small (fewer than 50), there may be a tendency to overreject the null hypothesis; hence, the use of wild bootstrap is warranted and provides more conservative estimates for the effects of the bans (MacKinnon and Webb 2018, 2020). I provide p values for the wild cluster restricted (WCR) and wild cluster unrestricted (WCU) models only when the cluster robust standard error yields statistically significant p values. The two values (WCR and WCU) should be similar in agreement to reject the null hypothesis (MacKinnon and Webb 2018, 2020; for an empirical example, see Conley and Taber 2011).
Another somewhat recently discovered issue with difference-in-differences is that staggered designs (i.e., states enter into treatment at different times) are often biased (Baker et al. 2022; de Chaisemartin and D’Haultfoeuille 2020; de Chaisemartin et al. 2019; Goodman-Bacon 2018; Goodman-Bacon et al. 2019). A decomposition of the staggered difference-in-differences model into all possible 2 × 2 difference-in-differences groups can reveal heterogeneity in the treatment through “negative weights,” that is, situations in which some groups are of the opposite sign of the true effects. The decomposition of the difference-in-differences (Goodman-Bacon 2018) and unbiased difference-in-differences estimators (de Chaisemartin and D’Haultfoeuille 2020) are produced in Appendix E in the online Supplemental Material.
The following multilevel ordinary least squares regression is fitted:

where Enrollist indicates the proportion of URMs enrolled at institution i at time t;
12
A further analytic step produces difference-in-differences-in-differences estimates (Chetty, Looney, and Kroft 2009; Gruber 1994; Ravallion et al. 2005). The triple difference analysis is useful in estimating heterogeneous differences to the affirmative action bans by group category. It emphasizes the difference between URM and non-URM attainment caused by affirmative action bans. The triple difference analysis measures whether URMs (individuals i as the units of analysis) did not enroll in college because of affirmative action bans. The difference-in-differences-in-differences estimate is specified as follows:
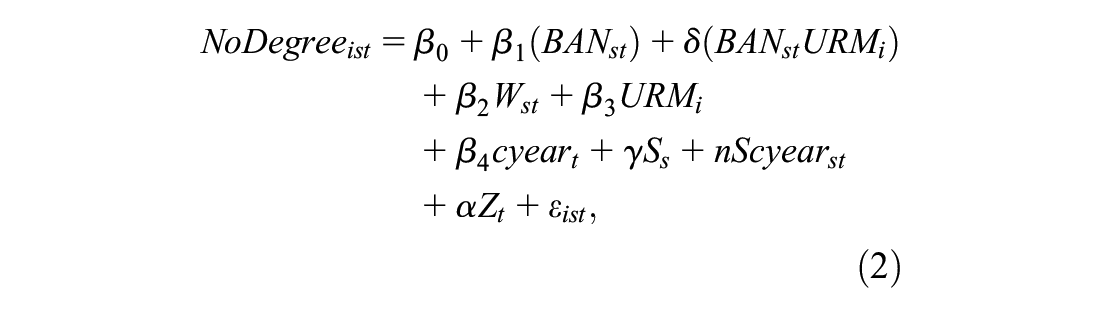
where
Findings
The first group of findings describes the displacement of URM students out of undergraduate postsecondary education due to affirmative action bans (here, students are the units of analysis). I then examine the effects of affirmative action bans across several sectors (public, private, and private for-profit) and selectivity tiers of postsecondary education. Collectively, describing these institutional types illustrates the anti-affirmative action avalanche, giving credence to racial self-interest at the state level and organizational racialization. I then supplement those results with some brief mixed-methods findings to explain the peculiar role of for-profit institutions in the affirmative action avalanche.
Table 2 shows how much affirmative action bans affected the share of URM enrollment (i.e., number of URMs / total enrollment at each school) in various sectors of postsecondary education. These results mainly flesh out the anti-affirmative action avalanche: the chain reaction set off by state-level bans on affirmative action at public postsecondary education institutions. To recapitulate, the weighted analyses reflect what happened to the typical student, and the nonweighted analyses reflect what happened at the typical institution. Because not all schools have the same number of students, the weighted results provide a more practical understanding of how many students slide down the track of institutional sectors and tiers in the avalanche. This distinction is particularly interesting for for-profit schools because the weighted analysis is statistically significant but the unweighted analysis is not.
The Effect of Affirmative Action Bans on the Share of URM Enrollment at Four-Year Colleges (Recoded).
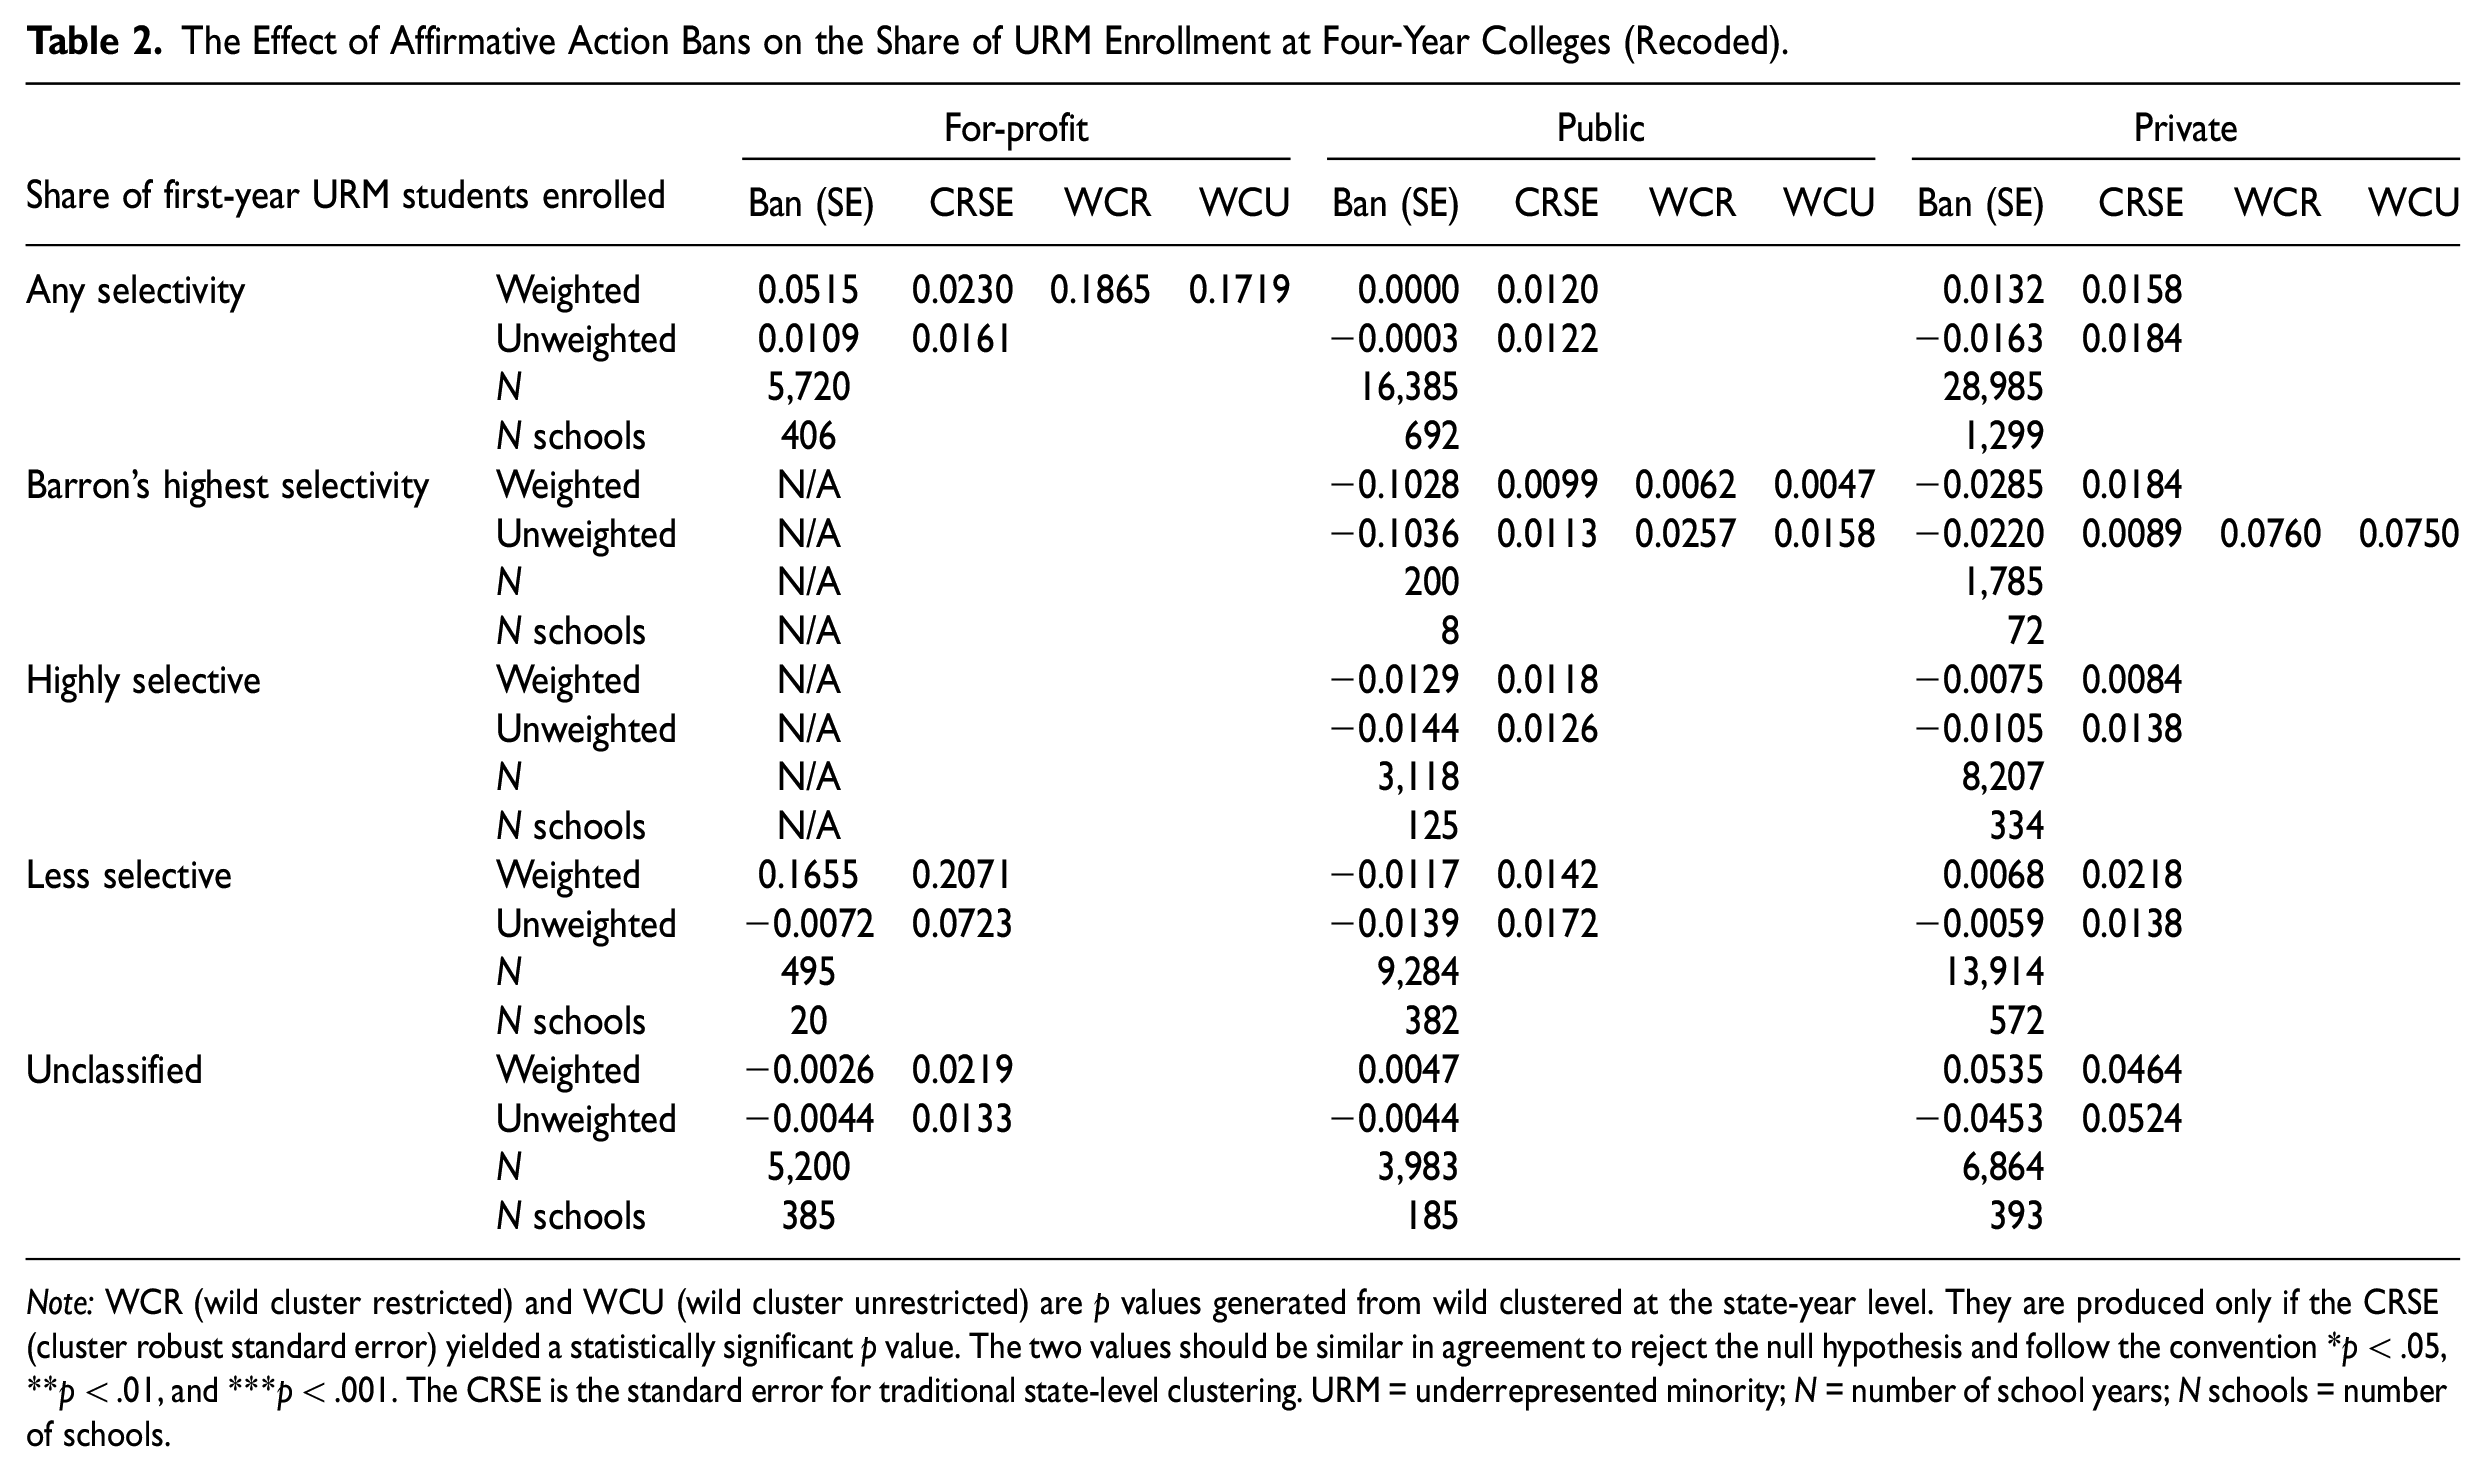
Note: WCR (wild cluster restricted) and WCU (wild cluster unrestricted) are p values generated from wild clustered at the state-year level. They are produced only if the CRSE (cluster robust standard error) yielded a statistically significant p value. The two values should be similar in agreement to reject the null hypothesis and follow the convention *p < .05, **p < .01, and ***p < .001. The CRSE is the standard error for traditional state-level clustering. URM = underrepresented minority; N = number of school years; N schools = number of schools.
The weighted results in Table 2 show that affirmative action bans increased the share of URM enrollment at for-profit colleges (by a share of 0.05 and statistically significant for the weighted findings; these results lose their statistical significance using wild bootstraps). Public and private schools’ URM enrollment shares did not change for the weighted analyses (0.00 and 0.01, respectively). Because these coefficients are difficult to interpret, I calculated the percentage changes using the mean of the dependent variable for the ban states before the ban and the estimated causal effect of the ban. This calculation measures how much the bans changed URM college enrollment. These results indicate public and private nonprofit schools’ URM enrollments increased by 0.13 and 7.00 percent (not statistically significant), but for-profit schools’ URM enrollments increased by 17.62 percent (statistically significant, but not when considering the wild bootstrap).
Additionally, for the highest selectivity group, I found statistically significant declines in URM enrollment for both the weighted and unweighted analysis (−0.1028 and −0.1036) using the conventional state-level clustered standard errors and wild bootstrapping, suggesting the declines affect the typical student and typical school. This finding is consistent with Backes (2012), Hinrichs (2012), and Bleemer (2020), who find that affirmative action bans affect more highly selective schools (public and private). However, Backes (2012) and Hinrichs (2012) both acknowledge that affirmative action bans may have had spillover effects from their targets, public schools, to private schools. Hirschman and Berrey (2017) speculate that the spillover effects to private schools may be attributable to the fear over lengthy and costly legal battles. Weighted results show this is true for private schools, but only concerning the typical institution (−0.0220 and statistically significant), not the typical student (−0.0285 and not statistically significant). Furthermore, the unweighted result for private schools is not statistically significant when considering the wild bootstraps (p values of 0.07 and 0.07). This is notable because Backes (2012) and Hinrichs (2012) conducted their studies before scholars started using the wild bootstrap in difference-in-differences studies when the number of clusters is small (MacKinnon and Webb 2018, 2020). The difference between the more traditional estimates and the wild bootstrap estimates suggests the possibility of some spillover but does not confirm it as the typical pattern.
The finding in Table 2 that affirmative action bans increase URM enrollment at for-profit schools for the weighted analysis (nonbootstrapped) but not the unweighted analysis is perplexing. However, this phenomenon boils down to what the two analyses capture. The weighted analysis captures what happens to the typical URM student, and the unweighted analysis captures what happens to the share of URM enrollment at the typical school. In other words, the models show that some schools with substantially large enrollments experience changes due to affirmative action bans, but the typical for-profit institution would not experience such a change. This is also seen in the large differences between the magnitude of the coefficients between the two weighted and unweighted estimates.
The conservative estimates for the wild bootstrap suggest no statistically significant effect for the weighted analysis; this means there is no statistically significant result for the typical URM student. However, the discrepancy between the magnitude of the weighted and unweighted estimates still suggests something unusual is occurring.
To investigate whether alternative groupings reveal a different pattern and whether less selective for-profit schools may be driving the results, Table 3 shows additional models of various selectivity groupings: any selectivity, the five least competitive Barron’s categories, and the four least competitive categories. Because the five least competitive categories grouping is significant but the four least competitive categories grouping is not, this means schools’ selectivity is not driving this result. Instead, it appears that a rogue group of for-profit schools may be driving this result. To further investigate this point, Table 4 lists the first-year enrollment (i.e., the weight) and the share of URM enrollment for the year before the ban and the year when the four most influential for-profit schools in ban states contributed their largest Cook’s distance. 14 In this case, Cook’s distance illuminates the largest changes between the pre- and postban shares of URM enrollment.
Which Tier Is Driving the For-Profit Result?
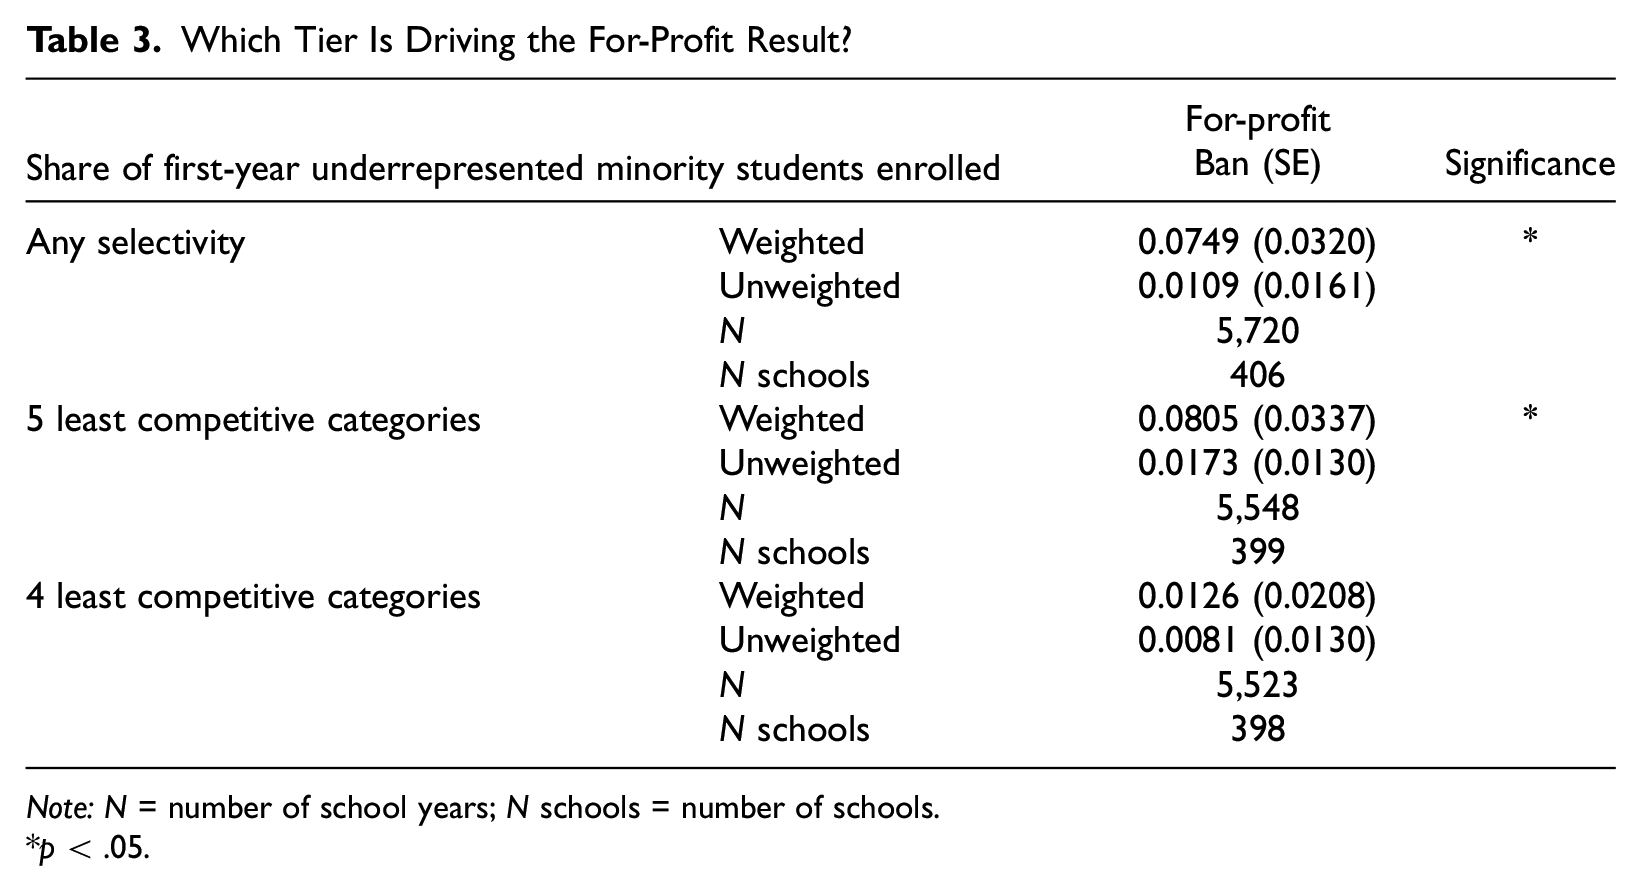
Note: N = number of school years; N schools = number of schools.
p < .05.
Influential For-Profit Schools.
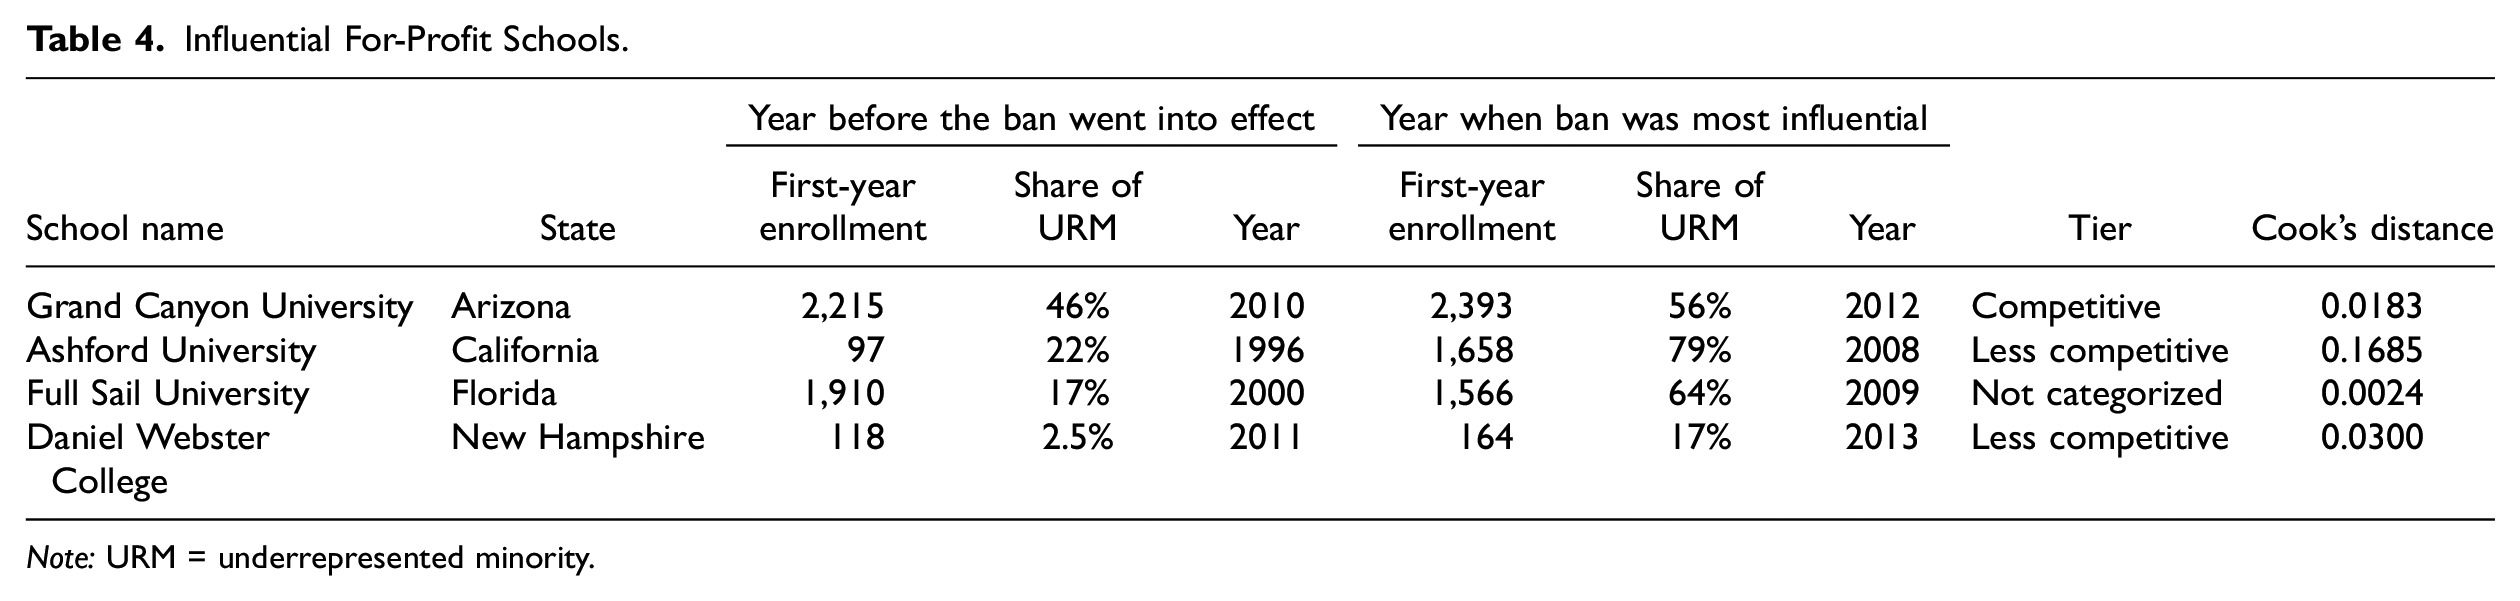
Note: URM = underrepresented minority.
Brief qualitative details can help understand how these schools enrolled students from URM backgrounds. These details highlight the extent to which the influential for-profit schools in the analysis have been more interested in their bottom line than their students’ welfare.
Daniel Webster College in New Hampshire declared bankruptcy in 2016. In 2009, it was a private nonprofit university with financial problems, scoring 0.5 out of 3 on a “financial responsibility standards” scale established by the U.S. Department of Education (Brindley, 2009). When these financial problems were coupled with threats to its accreditation, the college was purchased by ITT Educational Services in 2009 (Blumenstyk 2009). ITT then went bankrupt in 2016, mainly because they were barred from enrolling students receiving federal aid after state and federal investigations revealed the company engaged in questionable recruitment practices that took advantage of low-income students (Voorhis 2016). In 2011, when New Hampshire passed its ban on affirmative action, Daniel Webster College had a 2.5 percent first-year URM enrollment; two years after the ban, URM enrollment had grown over six times to 17 percent.
Full Sail University in Florida started as a recording studio in Ohio in 1979 but moved to Florida in 1980 and began offering online degrees in 2007. Its accreditation status is often problematic for its students interested in transferring because although it is recognized by the Accrediting Commission of Career Schools and Colleges, it is not recognized by a regional accreditor or the National Association of Schools of Art and Design. Before Florida’s ban in 2000, its URM enrollment was 17 percent; in 2009, when its URM enrollment was highest, it was 64 percent. During that same school year, the school was one of the top 5 percent most expensive for-profit schools in terms of tuition and net price (U.S. Department of Education, National Center for Education Statistics, Inegrated Postsecondary Education Data System [IPEDS0] 2010). Its loan default rates (13 percent) are also higher than the national average (10.1 percent).
Grand Canyon University (GCU) in Arizona is the highest quality institution among the influential for-profit schools in this analysis, earning a Barron’s classification of competitive. It is the world’s largest Christian university, boasting an enrollment of 70,000 online and 20,000 in person (Jenkins 2018). In the early 2000s, after suffering financial woes, GCU was purchased by Significant Education, LLC, and became the first for-profit Christian college in the United States. It also has the distinction of being the only for-profit college to participate in NCAA Division I athletics. GCU’s URM enrollment swelled after the passage of affirmative action bans in Arizona. In 2010, its URM enrollment was 46 percent, and in 2012, it was 56 percent. The amount of URM enrollment is even more unusual because GCU boasted a very low admissions rate that year (32 percent). The University of Michigan, also in a state subject to an affirmative action ban, admitted 36 percent of its applicants in 2012 (only 8.6 percent of its entering first-year class was URM). If Arizona’s ban on affirmative action extended to private for-profit schools, GCU would likely be in violation. GCU has been sued by online students who claim they were recruited to the university based on false promises of the careers they could get after completing their degrees, only to find their degree program did not meet the accreditation standards of the state where they worked or wanted to work (Leingang 2019).
Ashford University in California has the largest Cook’s distance reported in this study (0.1685). In 1996, its URM enrollment was 22 percent; by 2008, it had grown to 79 percent. Like other for-profit colleges that enroll students online, Ashford University has been accused of misleading students and failing to inform them that an accrediting body would not accept their degree in the state where they worked (Willems 2011). Ashford University has also been embroiled in a controversy over improper recruitment of students qualifying for GI Bill funding, and it was fined $31.5 million for lying to students about private student loans (Herron 2016). GI Bill-eligible students provide over a quarter of its enrollment. An NBC News Investigates piece alleged that Ashford targeted veterans with posttraumatic stress disorder (Przybyla and Strickler 2019).
In summary, these supplemental data highlight each college’s recruitment practices, lawsuits, questionable ethical behavior, and brief histories. However, there is no concrete evidence that these schools changed their recruitment practices after the bans. Therefore, this study could not rule out the possibility that preexisting recruitment practices at this handful of for-profit schools were responsible for the increased enrollment of the typical URM at for-profit schools. However, this result is driven by a small group of for-profit schools (not the typical school) with very aggressive recruitment strategies that primarily target students most eligible to receive federal funding for their education.
Table 5 shows similar findings for two-year institutions as Table 2 showed for four-year institutions. The table shows no significant effects of the ban. These results support Backes’s (2012) previous findings that affirmative action bans do not affect two-year institutions. These findings are consistent with the idea that two-year institutions are part of the affirmative action ban avalanche’s middle (i.e., the track), where no discernable movement of URM students occurs.
The Effect of Affirmative Action Bans on the Share of URM Enrollment at Two-Year Colleges.
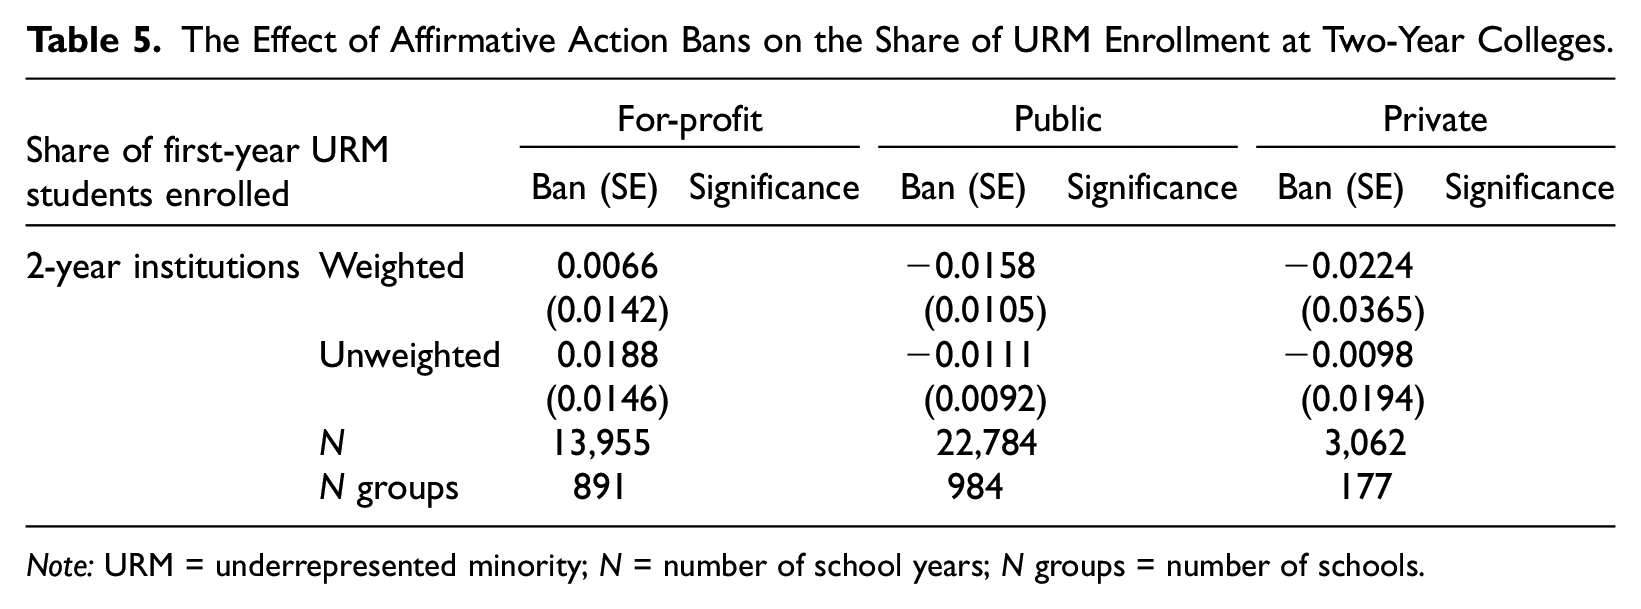
Note: URM = underrepresented minority; N = number of school years; N groups = number of schools.
Table 6 shows the share of URMs not attaining any postsecondary education. Panel A presents difference-in-differences, and Panel B presents the difference-in-differences-in-differences results. The convention for triple differences is to explain the difference-in-differences results (Panel A) before explaining the triple-differences results (Panel B). The first line of the difference-in-differences results (Panel A) describes the ban’s effect when race is controlled (these models are not stratified by racial category). Here, we see no statistically significant difference in educational attainment due to the ban (−0.0046). This provides a robustness check: There are no differences between ban states and nonban states that the coefficients cannot explain.
The Effect of Affirmative Action Bans on Underrepresented Minority Students Not Having College Education.
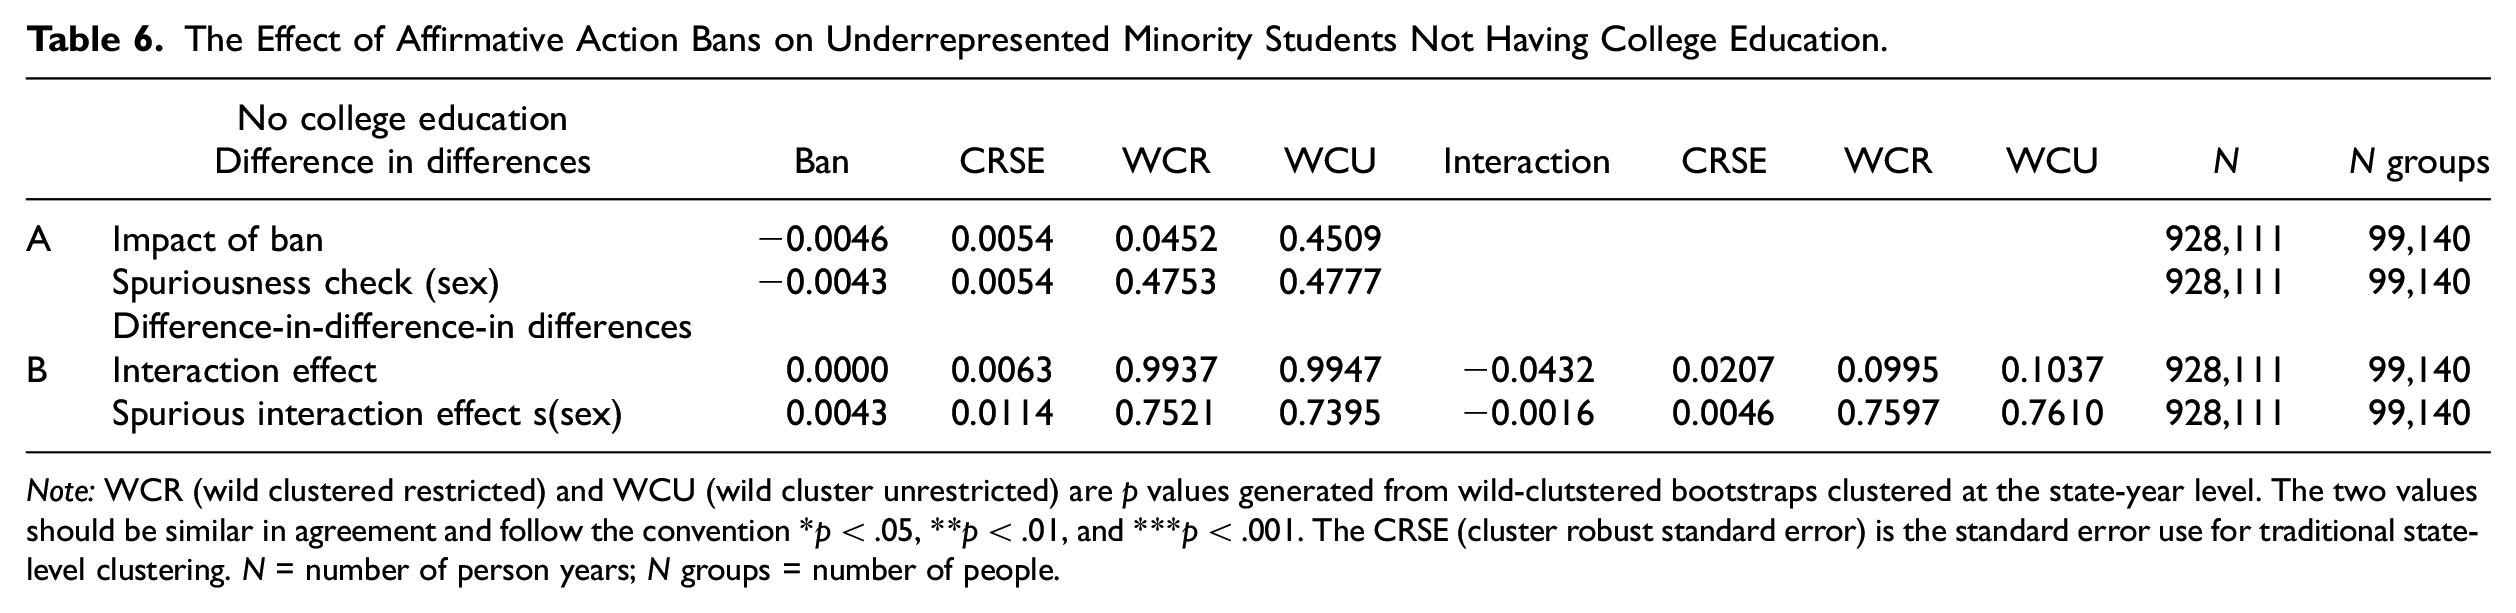
Note: WCR (wild clustered restricted) and WCU (wild cluster unrestricted) are p values generated from wild-clutstered bootstraps clustered at the state-year level. The two values should be similar in agreement and follow the convention *p < .05, **p < .01, and ***p < .001. The CRSE (cluster robust standard error) is the standard error use for traditional state-level clustering. N = number of person years; N groups = number of people.
The top line of Table 6, Panel B, which describes the ban’s effect when race (URM or non-URM) interacts with the ban variable, shows that the noninteracted effect of the ban is not significant (0.0000). There is no statistically significant difference between the ban and nonban states that is not explained by racial category. The triple difference (i.e., the interaction between URM status and the ban) in Panel B shows how URMs were affected by the bans relative to non-URMs. The coefficient here is negative (−0.0432) and statistically significant. However, it approaches statistical significance only when using wild bootstraps, meaning it cannot be confirmed that affirmative action bans increased the college-going rates of URMs relative to non-URMs. I also calculated the percentage change because it approaches statistical significance. The percentage change shows a decrease of 8.63 percent in not attending college (i.e., an 8.63 percent increase in attending any postsecondary institution) for URMs relative to non-URMs.
What Does the Anti- Affirmative Action Avalanche Really Look Like?
This study’s results paint a more complete picture of the effects of affirmative action bans. Previous findings by Backes (2012) and Hinrichs (2012), which indicated that affirmative action bans decrease the share of URM students at public and private four-year nonprofit institutions, are confirmed. This study also reassessed the pattern of spillover effects (from public schools to private schools) in the wake of the bans found by Backes (2012) and Hinrichs (2012): The results are supported by conventional state-clustered standard errors, as in Backes (2012) and Hinrich (2012), but approach statistical significance only when using wild bootstraps to account for the few clusters (i.e., states) that implement bans. This study suggests that at four-year private schools of the highest selectivity, there was a decline in URM enrollment at the typical school but not for the typical URM student.
Teasing out for-profit schools in the analysis helped to finally answer the question: “Where did all the URM students go after they were displaced from the most selective schools?” This study finds an increase in URM enrollment at for-profit private and four-year public schools in the noncompetitive selectivity tier. The results show that a handful of for-profit schools are responsible for the increase in URM enrollment. Table 4 provided further details about the four for-profit colleges most influential to the analysis. Finding no evidence that these schools intentionally changed their practices after affirmative action bans, the more plausible explanation is that their preexisting aggressive recruitment of URMs well positioned them to recruit a new group of URMs seeking a college degree. However, the avalanche’s bottom includes noncompetitive four-year public schools (see Table 2), meaning that not all “avalanched” URM students enrolled in for-profit schools. Furthermore, this study shows that “no postsecondary education” was not at the bottom of the anti-affirmative action avalanche.
Speculatively, some of the URM students’ enrollment at the bottom of the avalanche may not be caused by the avalanching theorized. Student application behavior may have affected the bottom tier of the affirmative action avalanche. Unfortunately, this limitation cannot be addressed with this study’s data, and it is unlikely to be addressed with application data because those data heavily rely on SAT score sends, which do not exist for nonselective schools (Bleemer 2020; Card and Krueger 2005).
Theoretically, regarding the mechanism of racial self-interest at the state level, the findings show the state-level bans directed resources toward non-URM students and away from URM students by decreasing URM representation at the most selective schools and increasing URM representation at for-profit and less selective schools. This is consistent with prior work that finds postsecondary education is becoming more ethnoracially segregated as it becomes less White (Baker, Solanki, and Kang 2023; Clotfelter 2017; Hinrichs 2022). I argued that opportunity hoarding (Tilly 1998) is achieved via the legal system when affirmative action bans are used as levers within the state context to distribute resources and opportunities (i.e., enrollment) in a self-serving manner to racial groups already in power. Even though some URM students enrolled more in college than non-URMs due to the bans (as suggested by the findings in Table 6 that approach statistical significance), many URM students could be paradoxically worse off due to the increase in enrollment for the typical URM student at a handful of for-profit schools.
The anti-affirmative action avalanche illustrates why the myth of equal opportunity is not realized in postsecondary education. Through state-level affirmative action bans, underrepresented students of color are filtered from institutions where they can prosper and have greater returns to their education into lesser quality institutions, some of which are predatory and leave them saddled with high amounts of student debt. The anti-affirmative action avalanche was created by schools in ban states that forcibly jettisoned color-conscious affirmative action, engaging in organizational racialization when they applied colorblind meritocratic schemas about race categories that are tied to organizational resources (i.e., being admitted to college). Returning to Figure 1, the top of the avalanche, the starting zone, is the most selective four-year undergraduate education (and the competitive tier of for-profit institutions). The track, the middle part of the avalanche (i.e., less selective four-year institutions and two-year institutions), shows no discernable enrollment movement. Toward the bottom of the avalanche, the runout reflects students attending four-year for-profit universities and noncompetitive four-year public schools.
The theory posited that URMs would be displaced from the starting zone of the avalanche and resurface at the runout zone, where their life chances are the worst and there is the least competition. The analyses ruled out that the anti-affirmative action avalanche would end with URM students removed from higher education altogether. Yet the avalanche does end with URM students displaced into for-profit universities, which may be more damaging to their life chances than not attending higher education (Cottom 2017). In summation, affirmative action bans produced a decline of URMs at the top of the avalanche, no change along the track, and an increase of URMs at some undergraduate postsecondary institutions at the bottom of the avalanche.
Conclusions
The primary contribution of this study was discovering where URM students were displaced because of affirmative action bans (i.e., four-year for-profit education and lower quality four-year public schools). This complements the more well-known finding that affirmative action bans caused URM enrollment at public four-year colleges and universities to decline. As such, this work may influence studies of higher education, policy, organizations, and contemporary racism. Broadly, this study sheds light on how a racial policy applies society’s racial hierarchy to shape access to the hierarchy of undergraduate postsecondary institutions. Theoretically, this study describes how group position theory (Alon 2009; Alon and Tienda 2007; Bobo and Hutchings 1996; Tilly 1998), racialized organizations (Ray 2019), and structural racism (Bobo, Kluegel, and Smith 1997; Bonilla-Silva 1997) come together through the creation and adoption of racially charged policies at the state level to preserve racial group self-interests in education and disrupt the possibility of ethnoracial equal opportunity.
The enrollment effects of affirmative action bans could be addressed through policy interventions at four levels. First, the looming Supreme Court battle could change how affirmative action is considered at the federal level: It can allow the use of race-conscious policies or say that they are unconstitutional—expanding the reach of affirmative action bans to all of higher education. Second, should states continue to implement the bans, states would have the agency to impose new bans or to potentially repeal those bans, as California attempted in 2020 with Proposition 16. Third, colleges and universities themselves have the power to explore race-neutral alternatives to affirmative action bans. Fourth, federal education policies that do not concern ethnoracial categories but are ethnoracial adjacent and affect underperforming institutions that disproportionately target underrepresented minority students could be relevant here. This final group of policies would be worth pursuing (even more) if the Supreme Court rules against affirmative action and any efforts to diversify student enrollments in postsecondary education ethnoracially.
Time will tell how the first intervention plays out. During the writing of this article, the Court had heard oral arguments but had not yet reached a decision. Suppose affirmative action ban policy continues its status quo; reversing the second level (state-level bans on affirmative action) appears to be the most decisive intervention for achieving racial diversity and equity in postsecondary education in effect. In that case, it should help reverse the impacts on URMs reported in this study. But switching these decisions has proved challenging. Only California placed it back on the ballot in 2020, and when it did, it failed to repeal its affirmative action ban. The third set of interventions, those within universities, has seemingly stalled. Postsecondary institutions have considered a wide breadth of alternatives to race-based admissions, but none are a proper substitute for race-conscious admissions (Alon 2015; Byrd 2021; Espinosa, Orfield, and Gaertner 2015; Long 2016; Reardon et al. 2017; Warikoo 2022). Furthermore, the Court could rule that any effort to increase ethnoracial diversity—even through race-neutral alternatives such as experienced hardship detailed in personal essays or geographic location—may violate the Equal Protection Clause of the 14th Amendment.
The fourth set of interventions is the most pertinent concerning this study’s finding that URM enrollment increased at for-profit colleges and universities. This study suggests that affirmative action bans may partly explain some of the increased enrollment at for-profit schools since the early 2000s (Chetty et al. 2017; Deming, Goldin, and Katz 2012). Recent reports from the think tank Third Way find that degree programs offered by these institutions are the least likely to be paid off quickly by student loan borrowers (40 percent for-profit, 56 percent private, and 73 percent public) and are the most likely to offer no return on their investment (46 percent for-profit, 12 percent private, and 13 percent public; Itzkowitz 2021). Thus, policy interventions that push students out of for-profit education and pull them into other institutional types may reduce the effect of affirmative action bans on URM students enrolled at for-profit schools.
One policy intervention that has had success in the for-profit sector is the “gainful employment” rule (Deming et al. 2012). Under the Obama administration in 2014, the Department of Education ruled that graduates need to earn enough money to repay their loans. This rule stipulates that for each program within each school (not only for-profits), the typical graduate’s debts must be less than 8 percent of their total income or less than 20 percent of their discretionary income. If graduates have loan payments between 8 and 12 percent of their total earnings or between 20 and 30 percent of their discretionary earnings, the program would be warned. The program would receive a failing grade if its graduates have annual loan payments greater than 12 percent of their total earnings or 30 percent of their discretionary earnings. Programs receiving a failing grade or those who were warned and did not improve would be disqualified from receiving federal aid. This rule was revoked during the Trump administration in 2019 but was reinstated by the Biden administration in 2022.
Pull interventions that direct students toward more financially friendly institutions, such as community colleges and four-year public schools, could better serve URM students without affirmative action. Students at such schools would likely, on average, have superior outcomes relative to students enrolling at for-profit colleges. There is some optimism that this has already begun through the expansion of the community college baccalaureate. Florida has long been a pioneer in postsecondary education (Love 2020), and California has recently been working on investments and policies geared to growing community college baccalaureate programs (Cuellar and Gándara 2021; Martinez and Acevedo 2022).
In conclusion, this study shows the effects of affirmative action bans seep beyond the battle for the most coveted ivory tower seats and extend to students and schools at the other end of the distribution who are all too often forgotten. Hopefully, the results of this study will help policymakers and the U.S. court system make better informed decisions about affirmative action bans by understanding their complete breadth of effects on U.S. undergraduate postsecondary education.
Supplemental Material
sj-docx-1-soe-10.1177_00380407231198225 – Supplemental material for The Anti-Affirmative Action Avalanche: The Rise of Underrepresented Minority Enrollment at For-Profit Institutions
Supplemental material, sj-docx-1-soe-10.1177_00380407231198225 for The Anti-Affirmative Action Avalanche: The Rise of Underrepresented Minority Enrollment at For-Profit Institutions by David Mickey-Pabello in Sociology of Education
Footnotes
Acknowledgements
I thank my dissertation committee (Sarah Burgard, Stephen DesJardins, John Burkhard, Barbara Anderson, and Deirdre Bloome), Liliana Garces, Gary Orfield, Laurie Russman, Harvard’s Sociology Colloquium series, and ASA’s Regular Session participants,
Funding
The author disclosed receipt of the following financial support for the research, authorship, and/or publication of this article: AERA Minority Dissertation Fellowship (N025759) and an AERA Early Career Grant (NSF-DRL 1749275).
Research Ethics
No institutional review board was required for this study.
Supplemental Material
Supplemental material for this article is available online.
Notes
Author Biography
References
Supplementary Material
Please find the following supplemental material available below.
For Open Access articles published under a Creative Commons License, all supplemental material carries the same license as the article it is associated with.
For non-Open Access articles published, all supplemental material carries a non-exclusive license, and permission requests for re-use of supplemental material or any part of supplemental material shall be sent directly to the copyright owner as specified in the copyright notice associated with the article.