
Abstract
Empirical evidence suggests children’s socio-emotional skills—an important determinant of school achievement—vary according to socioeconomic family background. This study assesses the degree to which differences in socio-emotional skills contribute to the achievement gap between socioeconomically advantaged and disadvantaged children. We used data on 74 countries from the 2018 Programme for International Student Assessment, which contains an extensive set of psychological measures, including growth mindset, self-efficacy, and work mastery. We developed three conceptual scenarios to analyze the role of socio-emotional skills in learning inequality: simple accumulation, multiplicative accumulation, and compensatory accumulation. Our findings are in line with the simple accumulation scenario: Socioeconomically advantaged children have somewhat higher levels of socio-emotional skills than their disadvantaged peers, but the effect of these skills on academic performance is largely similar in both groups. Using a counterfactual decomposition method, we show that the measured socio-emotional skills explain no more than 8.8 percent of the socioeconomic achievement gap. Based on these findings, we argue that initiatives to promote social and emotional learning are unlikely to substantially reduce educational inequality.
Keywords
Achievement gaps between socioeconomically advantaged and disadvantaged children exist in all countries, and they are particularly pronounced in the United States (Bradbury et al. 2015; Gruijters and Behrman 2020; World Bank 2018). Moreover, these achievement gaps have increased over the past few decades (Chmielewski 2019). Gaps in academic performance lay the foundation for entrenched inequality in a range of desirable life outcomes, including income, happiness, health, and longevity (Almlund et al. 2011; Farkas 2003; Heckman, Stixrud, and Urzua 2006). Therefore, reducing socioeconomic inequalities in school achievement is a key priority for policymakers and other stakeholders interested in social justice. To do so, however, we need to understand the mechanisms behind these achievement gaps.
Success in school relies not only on the development of cognitive capabilities but also on a range of broader socio-emotional and psychological attitudes and competencies, often referred to as “socio-emotional skills.” 1 Skills such as self-efficacy, work ethic, and self-confidence are not only intrinsically important for children, but they also have major effects on educational performance and broader life outcomes (Almlund et al. 2011; Farkas 2003; OECD 2019c). Evidence suggests socio-emotional skills are malleable and can be developed through a process known as “social and emotional learning” (SEL; Sánchez Puerta, Valerio, and Bernal 2016). Research on the “Asian American achievement paradox” (Hsin and Xie 2014; Lee and Zhou 2015) and the gender gap in achievement (DiPrete and Jennings 2012; Golsteyn and Schils 2014) shows that socio-emotional skills can be an important explanation for group-based differences in learning. It is plausible that this explanation applies to socioeconomic groups as well: If children from advantaged family backgrounds are more likely to acquire school-relevant socio-emotional skills, then this might explain part of their advantage in test scores and other measures of educational achievement.
The idea that socio-emotional skills contribute to socioeconomic achievement gaps is widespread in education and policy circles. For example, an influential joint policy paper by the American Enterprise Institute and the Brookings Institution (AEI/Brookings Working Group on Poverty and Opportunity 2015:60) mentioned “promoting social-emotional and character development” as one of its four key recommendations to reduce the education gap between children from middle-class and poor families, stating that SEL interventions are particularly important for low-income children, who “will fall further behind without it.” A stakeholder survey commissioned by the UK Cabinet Office echoed this sentiment, concluding that “children and young people experiencing disadvantage or living in vulnerable circumstances were reported to have more to gain from social and emotional skills provision, and seen as less likely to be developing social and emotional skills at home” (Yeo and Graham 2015:7). A second commissioned review concluded that class-based inequalities in social and emotional skills “serve to perpetuate the cycle of advantage or disadvantage across generations” (Goodman et al. 2015:2). The provision of SEL-related services has grown into a huge industry, worth approximately USD $1.5 billion in 2020 and expected to increase to USD $3.9 billion by 2025 (“$3.9 Billion Worldwide Social and Emotional Learning Industry to 2025” 2020). Programs to foster SEL are often explicitly framed as a way to reduce socioeconomic achievement disparities. For example, SEL provider Wings for Kids (n.d.) argues that [t]raits such as self-control, optimism, perseverance, confidence, and growth mindset are predictors of success in school and life. . . . This is particularly important for low-income children who, by virtue of their situation, can’t get a lot of the things we know are important to learning and have more obstacles to overcome than their wealthier peers.
The Collaborative for Academic, Social, and Emotional Learning (CASEL n.d.), a leading advocate for SEL, argues that “SEL can help address various forms of inequity.”
Despite these sweeping claims, there is little empirical evidence on the relationship between socio-emotional skills and socioeconomic inequalities in learning. Our study therefore asks to what extent learning gaps between socioeconomically advantaged and socioeconomically disadvantaged children can be explained by socio-emotional skills. We answer this question using the 2018 Programme for International Student Assessment (PISA), which provides nationally representative data from high school students in 74 countries, extending previous studies that mostly focus on primary school students in the United States. The 2018 PISA survey measured a comprehensive set of academically relevant socio-emotional skills, including growth mindset and self-efficacy.
We posit three conceptual scenarios that distinguish between differences in the returns to socio-emotional skills between socioeconomically advantaged and disadvantaged children: simple accumulation, in which advantaged children have higher levels but similar returns to socio-emotional skills compared to disadvantaged children; multiplicative accumulation, in which advantaged children have higher returns; and compensatory accumulation, in which disadvantaged children have higher returns. Based on these scenarios, we conducted a counterfactual decomposition of the socioeconomic achievement gap in science scores. Our results show that if disadvantaged children had the same levels of and returns to socio-emotional skills as advantaged children, this would reduce the learning gap by no more than 8.8 percent. Most of this is due to compositional effects: Contrary to popular wisdom, there is no systematic difference in the relative importance of these skills for socioeconomically advantaged and disadvantaged children. Because of potential reverse causality and omitted variable bias in observational data, we interpret these estimates as an upper bound on the socioeconomic achievement gap that can be explained by the observed socio-emotional skills. Based on these findings, which are relatively robust across global cultural contexts and levels of economic development, we argue that interventions aimed at improving social and emotional skills are unlikely to substantially reduce class-based inequalities in academic performance.
Conceptualizing Socio-Emotional Skills
The multidisciplinary literature on child development uses a wide range of terms to refer to broadly similar sets of skills that are relevant to educational attainment and achievement. Psychologists tend to use the terms “social and emotional learning,”“psychosocial competencies,” and “life skills” interchangeably, whereas economists prefer the generic “noncognitive skills” (Sánchez Puerta et al. 2016). Sociologists working in the structural-cultural tradition often use the term “cultural resources” to highlight the malleable and acquired nature of these characteristics. Farkas et al. (1990) define children’s cultural resources as the “general skills, habits and styles” that are valued by teachers. Other sociologists have used psychological dispositions, such as self-efficacy and work ethics, as proxies for child agency (Burger and Walk 2016). Each of these terms refers to a broadly similar set of educationally relevant psychological skills and dispositions, including a positive attitude toward schooling and learning, confidence in one’s ability to learn, and an intrinsic motivation to master new skills (Farkas 2003). 2 We prefer the term “socio-emotional skills,” which is widely used in the psychological literature and in educational policy and practice.
The OECD (2021a:20) defines socio-emotional skills as a subset of an individual’s abilities, attributes and characteristics that are important for individual success and social functioning. They encompass behavioral dispositions, internal states, approaches to tasks, and management and control of behavior and feelings. Beliefs about the self and the world that characterize an individual’s relationships to others are also components of social and emotional skills.
Socio-emotional skills are widely considered to be important drivers of academic achievement and important developmental outcomes in their own right. Socio-emotional skills play an important role in the academic discourse around the “Asian American achievement paradox” (Hsin and Xie 2014; Lee 1996; Lee and Zhou 2015) and the gender gap in academic achievement (DiPrete and Jennings 2012; Golsteyn and Schils 2014). Although socio-emotional skills are individual rather than group attributes, they can be considered “cultural” in the sense of personal culture (Lizardo 2017).
Socio-Emotional Skills and Learning Outcomes
Educational psychologists have identified a wide range of socio-emotional skills that are beneficial for learning and for life outcomes more generally (Duckworth and Yeager 2015). Prominent examples are self-efficacy, “the conviction that one can successfully execute the behavior required to produce the outcomes” (Bandura 1977:141), and growth mindset, “the belief that your basic qualities are things you can cultivate through your efforts” (Dweck 2007:4). Noncognitive “soft” skills are often contrasted to “hard” cognitive skills, such as performance in mathematics and reading tests. Recent meta-analytical evidence confirms that socio-emotional skills are competencies that can be learned, rather than permanent and unchangeable traits (Durlak et al. 2011; Murano, Sawyer, and Lipnevich 2020).
There is widespread agreement that socio-emotional skills are important for learning outcomes. Observational evidence is available for a range of skills, including self-efficacy (Rosen et al. 2010), conscientiousness (Poropat 2009), and motivational beliefs and goals (Eccles and Wigfield 2002), which remain positively correlated with achievement even after controlling for gender, family background, and cognitive abilities. Some studies suggest socio-emotional skills are at least as important as intelligence in predicting academic performance, especially when we consider their cumulative effects (Almlund et al. 2011; Heckman et al. 2006).
Researchers have also identified some of the mechanisms and causal channels that give rise to the association between socio-emotional skills and learning outcomes. A prominent channel is motivation and effort. For example, students with a growth mindset persist longer in challenging tasks (Dweck 2007). Such behavior might, in turn, be reinforced via positive teacher or peer feedback (Yeager et al. 2019). The influential expectancy value theory of achievement motivation posits that individuals’ performance on an activity can be explained by (1) their beliefs about how well they will do on the activity and (2) the extent to which they value the activity (Wigfield and Eccles 2000). Socio-emotional skills contribute to both of these determinants. For example, (1) self-efficacy raises the expectation that one can achieve the desired result, while (2) work mastery, growth mindset, and competitiveness increase the subjective task value. This might be particularly important in the context of academic achievement tests because “the act of test-taking requires effort, sustained attention, persistence, and tolerance of frustration on test questions that have no payoff” (Deluca and Rosenbaum 2001:371).
A second channel is learning behavior: Students with high levels of socio-emotional skills have more effective study habits (Crede and Kuncel 2008; Lubbers et al. 2010). For example, Zhang and Ziegler (2016) found that students with high levels of openness and conscientiousness were more likely to adopt a deep-learning approach, which involves seeking a profound, rather than superficial, understanding of the content. Socio-emotional skills may also lead students to choose more challenging tasks and subjects that help them improve their academic performance (Almlund et al. 2011). Claro, Paunesku, and Dweck (2016) suggest students with a growth mindset actively seek out learning opportunities and relish difficult tasks, whereas students with a fixed mindset try to avoid such situations. Finally, students with low socio-emotional skills are more likely to exhibit internalizing or externalizing “problem behaviors” that may be harmful to learning (Almlund et al. 2011; Murano et al. 2020).
In summary, there is substantial evidence for a robust association between socio-emotional skills and learning outcomes that operates through established psychological and behavioral mechanisms. However, there is some debate about the extent to which this association is causal in nature. Almlund et al. (2011:89) note that “problems with reverse causality are rife in personality psychology.” For example, low school marks might result in lower self-confidence and disengagement, while high achievement can boost self-efficacy and motivation (Gonida, Kiosseoglou, and Leondari 2006; Holtmann, Menze, and Solga 2021; Rosenberg et al. 1995). A second challenge in estimating the causal relationship between socio-emotional skills and learning outcomes is omitted variable bias. Many of the aforementioned studies did not control for important student background characteristics, such as family socioeconomic status (SES) or school resources. Therefore, the strongest evidence is derived from experimental studies of SEL interventions. For example, Yeager et al. (2019) found that a one-hour growth mindset intervention in U.S. high schools led to a 0.1-point gain in GPA among low-performing students and increased their likelihood of enrolling in advanced mathematics courses. A similar intervention implemented over eight sessions improved performance by 0.3 grade points (Blackwell, Trzesniewski, and Dweck 2007). A meta-analysis of 213 comprehensive school-based SEL programs found a substantial average achievement gain of 11 percentile points (Durlak et al. 2011). These effect sizes, however, depend not only on the causal association between socio-emotional skills and learning but also the effectiveness of the interventions themselves in improving socio-emotional skills.
The Role of Socio-Emotional Skills in the Stratification Process
In the previous section, we identified several socio-emotional skills associated with learning outcomes in the psychological literature. Historically, psychologists have paid limited attention to the relationship between socio-emotional skills and family SES (Hollander and Howard 2000). Sociology, on the other hand, has traditionally focused on group differences in educational outcomes—especially differences based on gender, race, and class—and the mechanisms through which they arise. A long-standing sociological tradition examines how structural differences in power and material resources interact with “cultural” factors such as norms, values, attitudes, and behavioral patterns to produce group-based inequality in education and employment outcomes.
Scholars working in this tradition have argued that children from different social backgrounds develop distinctive psycho-cultural characteristics and identities in response to the structural constraints and opportunities they are exposed to (e.g., Bowles and Gintis 1977; Wilson 1987). Willis (1977:171) argued that macro-structural determinants of educational outcomes, such as class origin, “need to pass through the cultural milieu to reproduce themselves at all.” This perspective on the role of cultural characteristics in the stratification process thus considers cultural resources and behaviors to be mediating or enacting structural (dis)advantage (Freeman, Condron, and Steidl 2020).
Sociologists have proposed several ways socioeconomic family background can affect children’s school-relevant cultural resources, including their socio-emotional skills. First, the family, school, and neighborhood environments of socioeconomically advantaged children tend to be more conducive to the development of socio-emotional skills (Yeung, Linver, and Brooks-Gunn 2002). Child development, including the development of social and emotional skills, is strongly dependent on parenting style and other parental inputs, which differ by social class. Children internalize experiential patterns encountered in the world through a process known as enculturation, which converts class-specific childhood experiences into relatively stable cultural skills and resources (Lizardo 2017). The acquisition of school-relevant cultural resources requires substantial investments of parental time and resources and is therefore closely linked with socioeconomic privilege (Bodovski and Farkas 2008). Middle-class parents are more likely to engage in concerted cultivation, whereby they deliberately promote educationally desirable skills and attitudes in their children (Lareau 2003). For example, Calarco (2014) observed that middle-class parents “coach” their children to be assertive and proactive in seeking help from teachers. Middle-class children are also more likely to participate in organized extracurricular activities that provide opportunities for skill development (Weininger, Lareau, and Conley 2015). Conversely, children who grow up in poverty are more likely to experience parental absence, stressful events, and economic hardship, all of which make it more difficult to enculturate favorable social and emotional skills (Borghans et al. 2008; McLanahan and Percheski 2008).
Children’s self-image and perceived efficacy also depend on their relative social position and the corresponding opportunities for personal development and status attainment (Boyden, Dercon, and Singh 2015; Hitlin and Johnson 2015). Disadvantaged children can develop disengaged or oppositional attitudes and identities in the face of institutionalized discrimination and a perceived lack of opportunity. For example, Willis (1977) describes how some British working-class boys cultivated a defiant “counter-school culture,” rejecting the diligent and compliant attitudes valued by teachers and even the idea of academic achievement itself. Similarly, MacLeod (1987) highlights how a group of disadvantaged boys deviated from the “achievement ideology” imposed by their school and developed a fatalistic, nonconformist attitude. Nonconformity and oppositional behavior are far from universal among disadvantaged youth, however, and social class interacts with gender, race, and school context in the formation of young people’s identities and achievement orientations (O’Connor 2001; Warikoo and Carter 2009).
Teachers and schools tend to reinforce class-based differences in children’s cultural-psychological resources. Bourdieu and others have described how middle-class dispositions and cultural resources are often perceived as signs of academic giftedness (Bourdieu and Passeron 1970; Lamont and Lareau 1988). The result is a positive feedback loop in which schools reward and reinforce the cultural resources of middle-class children, thereby strengthening their socio-emotional development and positive engagement with schooling. Conversely, socioeconomically disadvantaged children may be unfamiliar with the informal codes of the educational system and less likely to live up to the image of the “ideal” student, resulting in negative teacher feedback and lower self-esteem (Farkas et al. 1990). Disadvantaged children are also disproportionally exposed to punishment, exclusion, and other forms of stigmatization, with negative consequences for their socio-emotional development (Kurian and Gruijters 2023).
The development of socio-emotional skills is thus likely an important mechanism behind the well-established association between socioeconomic family background and academic achievement. Only a few studies, however, have sought to quantify the extent to which cultural-psychological factors can explain socioeconomic achievement inequality. Using the Early Childhood Longitudinal Study, Liu (2019) shows that socio-emotional skills explain 20 percent of the SES gap in learning outcomes. Burger, Mortimer, and Johnson (2020) found that adolescent self-esteem and self-efficacy contribute to the intergenerational reproduction of advantage, primarily through school achievement. In a highly cited study, Claro et al. (2016:8664) found that students with a growth mindset “were appreciably buffered against the deleterious effects of poverty on achievement.”
This emerging body of research provides important evidence on the role of socio-emotional skills in the educational stratification process, but it has several limitations. For example, it is mostly focused on the United States and tends to use a limited set of socio-emotional skills, often examining single variables and/or teacher reports of pupil behavior. In contrast, we examine 74 countries and use a comprehensive set of socio-emotional skills that have been elicited using validated psychometric instruments. In doing so, we contribute to the long-standing debate on the role of psycho-cultural resources in explaining between-group inequality.
Conceptual Framework: Socio-Emotional Skills and the Socioeconomic Achievement Gap
In this study, we follow the OECD (2019b:55) in conceptualizing the socioeconomic achievement gap as the difference in average test scores between children in the top and bottom SES quartiles. We are interested in the extent to which this gap is explained by socio-emotional skills. Socio-emotional skills can contribute to achievement inequality in two ways: because advantaged children have higher levels of academically relevant socio-emotional skills than disadvantaged children (an endowment effect) or because advantaged children derive more academic benefits from their socio-emotional skills—or, conversely, are less affected by a lack of socio-emotional skills (a returns effect). In the terminology of Lundberg, Johnson, and Stewart (2021), our theoretical estimand is the potential average test scores socioeconomically disadvantaged children would achieve if they had (1) the same levels of socio-emotional skills as advantaged children and (2) the same returns to socio-emotional skills as advantaged children, all other things remaining the same. Following previous research (DiPrete and Jennings 2012; Golsteyn and Schils 2014), we estimate these counterfactual scenarios using the Kitagawa-Oaxaca-Blinder (KOB) decomposition.
Following the empirical and theoretical evidence, we develop three potential scenarios, based on the size and direction of the endowment and returns components (illustrated in Figure 1). In the first scenario (“simple accumulation” 3 ), advantaged children have higher average levels of socio-emotional skills than disadvantaged children and similar returns to these skills. In the second scenario (“multiplicative accumulation”), advantaged children have higher average levels of socio-emotional skills and higher returns to these skills. In the third scenario (“compensatory accumulation”), advantaged children have higher average levels of socio-emotional skills but lower returns to these skills. We do not discuss potential scenarios in which advantaged children have lower average levels of socio-emotional skills because the positive association between family SES and socio-emotional learning is well established in the empirical literature. In line with the literature, each of the three scenarios assumes a positive association between socio-emotional skills and learning outcomes. In the following sections, we discuss the theoretical and empirical support for each scenario.
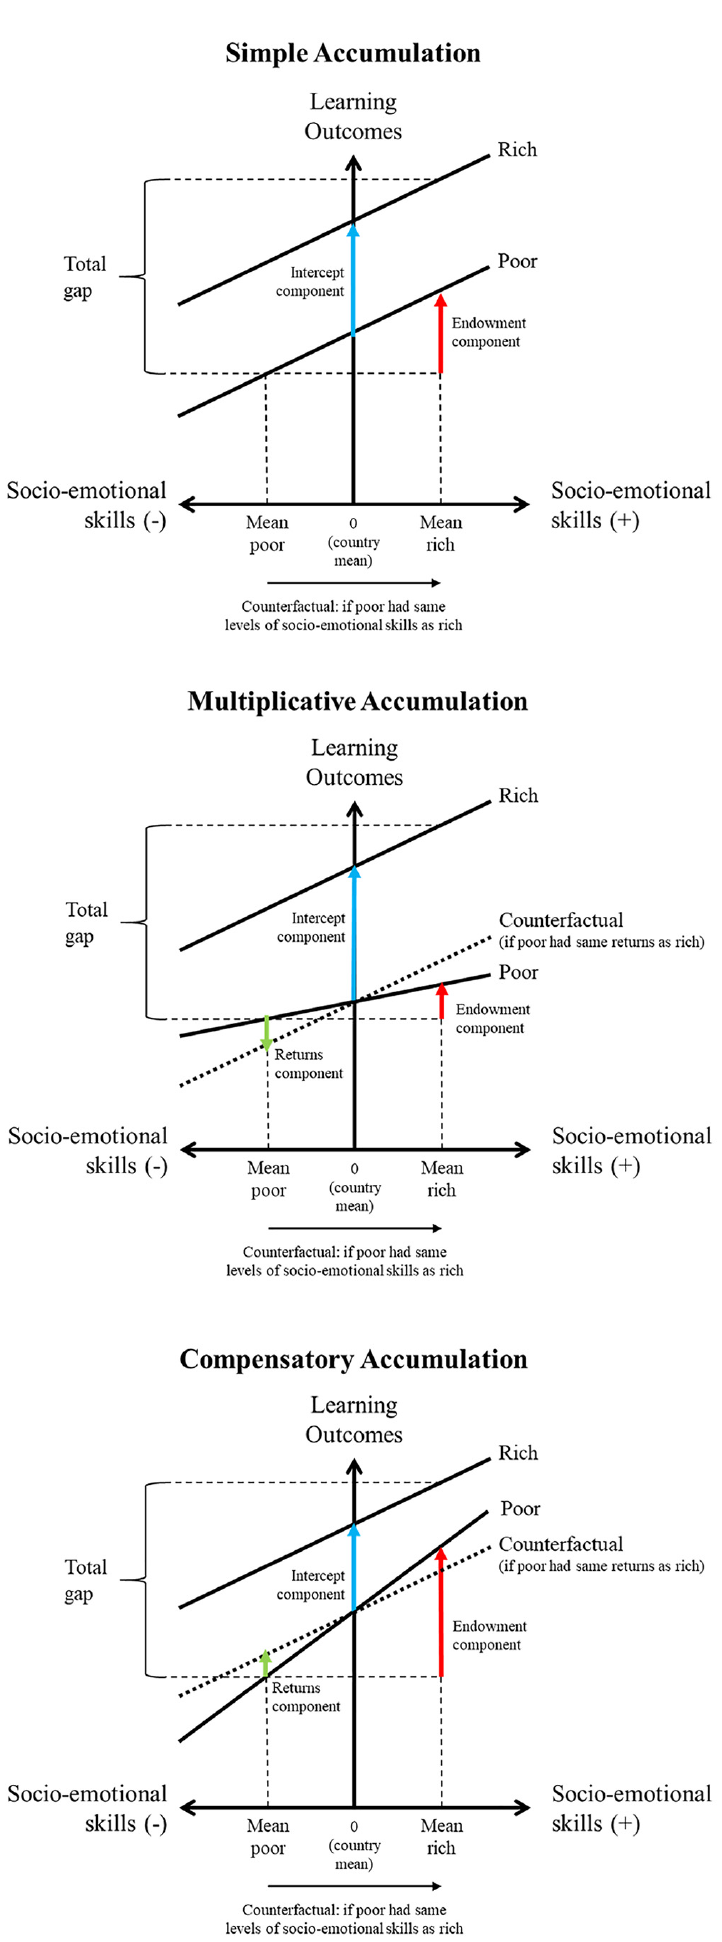
Stylized illustration of the three conceptual scenarios.
Scenario 1: Simple Accumulation
In the first scenario (illustrated in the top panel in Figure 1), socioeconomically advantaged children have higher average levels of educationally relevant socio-emotional skills (indicated on the x-axis) and similar return to these skills (as indicated by the parallel slopes of the regression lines for advantaged and disadvantaged children). Socio-emotional skills thus contribute to learning inequality through endowment effects: If disadvantaged children had the same average levels of socio-emotional skills as advantaged children, the gap would be reduced. The idea that socioeconomic gaps in learning outcomes are reinforced by differences in socio-emotional skills is also known as “structural amplification” (Ross and Mirowsky 2011; Shanahan et al. 2014). Figure 1 shows a substantial unexplained gap in learning outcomes, which is reflected in the difference between the intercepts. Because socio-emotional skills are standardized within countries, this unexplained gap represents the difference in predicted learning between an advantaged and a disadvantaged child with a country-average level of socio-emotional skills. Because the returns effect is zero in this scenario, the total explained gap is equivalent to the endowment effect.
The strength of the compositional effect, in turn, depends on two factors: the difference in average levels of socio-emotional skills between advantaged and disadvantaged children and the (causal) effect of socio-emotional skills on learning outcomes. Extensive research (summarized in the previous sections) shows how social class shapes children’s social and emotional skills, which in turn affect learning outcomes. The extent to which children from different socioeconomic backgrounds differ in their levels of socio-emotional skills is an interesting question in itself, especially among the age group considered in this study. Available evidence shows a robust positive association between SES and socio-emotional skills—including self-confidence, impulse control, self-efficacy, and motivation—in a range of contexts, including the United States, rural China, Germany, the United Kingdom, Ethiopia, Vietnam, Peru, and India (Attanasio et al. 2020; Borghans et al. 2008; Cunha and Heckman 2007; Dercon and Krishnan 2009; Falci 2011; Holtmann et al. 2021; Leight and Liu 2020). Gronqvist et al. (2017) found that socio-emotional skills are transmitted from parents to children to the same extent as cognitive skills.
In addition to the positive association between SES and socio-emotional skills, the simple accumulation scenario assumes the returns to socio-emotional skills are similar for advantaged and disadvantaged children. There is some evidence to suggest socio-emotional skills work in approximately the same way for all children regardless of their class background. For example, Destin et al. (2019) found that the association between growth mindset and academic achievement was similar for low- and high-SES children. And based on a sample of 81,000 U.S. high school students, Damian et al. (2015) concluded that the effect of personality traits on status attainment is largely independent of family background. However, there is also empirical and theoretical evidence for compensatory and multiplicative effects of socio-emotional skills, as we discuss in the following scenarios.
Scenario 2: Multiplicative Accumulation
In addition to their higher average levels of socio-emotional skills, socioeconomically advantaged children may experience higher returns to these skills such that the achievement gap increases with the level of socio-emotional skill. This scenario, which can be described as a Matthew effect (Merton 1968) or as multiplicative accumulation (Erola and Kilpi-Jakonen 2017), is illustrated in the second panel of Figure 1.
Multiplicative effects occur when socioeconomically advantaged children have more opportunities to convert their socio-emotional skills into educational performance. High-SES children may be better at translating their intentions into academic outcomes, for example, because they have better access to study resources (e.g., time, books and other educational materials, a quiet place to study, adults to provide feedback). Conversely, poor children with high levels of motivation and a positive mindset might still be thwarted in their efforts because of a lack of these resources—for example, because their parents are unable to help them with homework or because they need to perform household chores or paid work. Schoon and Heckhausen (2019:144) argue that “agency is less effective in situations where the socioeconomic risks are over-powering.” As an illustration, imagine a child attending a low-quality school with underqualified and demotivated teachers and having to work long hours after school to contribute to the family income. Such deprived conditions could result in poor school results regardless of the child’s level of determination, self-esteem, and other positive characteristics. This notion is supported by Deluca and Rosenbaum (2001), who found the relationship between school effort and educational attainment is weaker for low-SES students than for their high-SES peers (see also Gil-Hernández 2021). Similarly, Yeager et al. (2019) found their growth mindset intervention was successful only in schools where peer norms were supportive of challenge seeking. They hypothesized that students in unsupportive peer climates “risked paying a social price for taking on intellectual challenges in front of peers who thought it undesirable to do so” (Yeager et al. 2019:368).
In the multiplicative accumulation scenario, efforts to increase SEL will be less effective for disadvantaged children. If an intervention were to succeed in improving socio-emotional skills across the board, it would also increase inequality because high-SES children would benefit more from a similar increase than would low-SES children.
Scenario 3: Compensatory Accumulation
When socio-emotional skills produce higher academic returns for socioeconomically disadvantaged students, the achievement gap narrows with higher levels of socio-emotional skills: This is the scenario described as compensatory accumulation in Figure 1 (bottom panel). For example, disadvantaged children might have lower levels of resilience than their wealthier peers, but that resilience might be more important to their learning outcomes. This is the scenario envisioned in many SEL interventions, which are often assumed to be particularly beneficial for children from disadvantaged backgrounds (e.g., AEI/Brookings Working Group on Poverty and Opportunity 2015; Yeo and Graham 2015).
The resource substitution hypothesis (Ross and Mirowsky 2011; Shanahan et al. 2014) suggests socio-emotional skills are more important for children with lower levels of socioeconomic resources. It assumes underprivileged children can compensate for a lack of social and economic capital through a growth mindset, positive work attitude, and similar socio-emotional characteristics. Conversely, high-SES children might be more protected from the negative effects of lacking socio-emotional skills because they have alternative sources of support and motivation to fall back on. This scenario has considerable empirical support. For example, Shanahan et al. (2014) found that youth whose parents have less education benefit to a greater degree from valued personality characteristics, but they are less likely to possess such characteristics. They describe this scenario as “resource substitution with structural amplification.”Liu (2020) observed a negative interaction between socio-emotional skills and family SES, wherein the academic performance of children with high socio-emotional skills is less affected by their SES. Finally, Claro et al. (2016:8667) found that a growth mindset is more predictive of academic success for low-income students: “[A] fixed mindset is more debilitating (and a growth mindset is more protective) when individuals must overcome significant barriers to succeed.”
Context Specificity
The relationship between family background, socio-emotional skills, and learning may be context dependent. For example, prior work shows socio-emotional skills and academic motivation are less stratified by social class in East Asian societies (Lee and Zhou 2015; Liu and Xie 2016). This would imply a smaller—or even absent—endowment effect in Asian societies. It is also possible that skills and attitudes, such as fear of failure and competitiveness, are valued differently in individualistic societies compared to more collectivist ones, leading to differences in the size or direction of the return effects. This suggests effects of socio-emotional skills may vary systematically between global cultural regions. On the other hand, Bandura (2002) argues that the effect of self-efficacy on performance is independent of the cultural context.
Second, the effects of socio-emotional skills and their association with SES and learning outcomes may depend on a country’s overall level of economic development. The group defined as disadvantaged in our study—the bottom SES quartile—will be more deprived in absolute terms in lower-income societies, where malnutrition, preventable diseases, and other poverty-induced stressors are prevalent among the most disadvantaged children. Prolonged exposure to such compounding risks can overwhelm children and stifle their social and emotional development (Boyden et al. 2015; Dercon and Krishnan 2009). This may entail wider SES gaps in socio-emotional skills in lower-income countries, which may result in larger compositional effects. The returns to socio-emotional skills may also be lower for children living in absolute poverty and deprivation, in line with the multiplicative accumulation scenario. These comparisons remain exploratory because we have little empirical evidence to hypothesize about the differential role of socio-emotional skills in various global contexts.
Methods
Data and Measures
The Programme for International Student Assessment (PISA) is a school-based survey that takes place every three years. It has historically focused on providing standardized, internationally comparative measures of competence in mathematics, reading, and science, and it is widely used to assess inequalities in learning. We use the PISA 2018 data set (released in December 2019), which covered 78 countries and was the first to include a comprehensive set of psychometrically validated socio-emotional skills (OECD 2019a). PISA provides nationally representative data on the learning outcomes and socioeconomic backgrounds of 15-year-olds who are enrolled in school. The exceptions to this are China, which surveyed only four higher-income provinces, and Azerbaijan, which surveyed only the capital Baku. Findings for these countries should therefore be interpreted with caution. 4
In our empirical analyses, we dropped four countries that did not administer the full set of socio-emotional skill questions and the 50 percent of children who were neither socioeconomically advantaged nor disadvantaged (see the following). Of the remaining sample, we dropped a further 34,818 observations (12.3 percent) due to item nonresponse. Our analytic sample thus consists of 248,375 students in 74 countries.
Our primary outcome variable is students’ science test score, which is standardized across countries to have a mean of 500 and a standard deviation of 100. To define SES, we used PISA’s Index of Economic, Social and Cultural Status (ESCS), which combines information on the social, financial, human, and cultural resources of students’ households. We followed the OECD (2019b:55) in defining the top quartile of the ESCS distribution within each country as “socioeconomically advantaged” and the bottom quartile as “socioeconomically disadvantaged.” The labels “advantaged” and “disadvantaged” thus refer to the relative socioeconomic standing of children’s households within their countries rather than to absolute standards of poverty or wealth.
We considered five socio-emotional skills that were included in the PISA survey because of their relevance to educational attainment and achievement. Each of these indicators have been extensively tested for cross-cultural compatibility and internal consistency (for more details, see Appendix A). All the socio-emotional indicators are standardized within countries.
Self-efficacy is defined as “the extent to which individuals believe in their own ability to engage in certain activities and perform specific tasks, especially when facing adverse circumstances” (Bandura 1977; OECD 2019c:188). It was measured with five Likert scale items (e.g., “My belief in myself gets me through hard times”; see Appendix A for a full list of items). Self-efficacy is widely perceived to be an important dimension of agency (Hitlin and Johnson 2015) and is assumed to be positively related to learning outcomes. The sociological literature suggests that while some disadvantaged children show remarkable resilience in the face of structural barriers, others may develop disengaged or fatalistic attitudes (Boyden et al. 2015; O’Connor 1997; Willis 1977).
Fear of failure is the “general tendency to self-protectively avoid potential mistakes and failures because they are experienced as shameful” (OECD 2019a:230). Fear of failure can serve as an extrinsic motivation for learning, but it may be harmful to performance if it leads students to avoid potentially challenging tasks. It was measured with three items (e.g., “When I am failing, I worry about what others think of me”). The literature on “stereotype threat” suggests the fear of being perceived as unintelligent or incompetent might be particularly pronounced among low-income or otherwise stigmatized students (Spencer, Logel, and Davies 2016). As a result, disadvantaged students can develop coping strategies that are detrimental to achievement, such as withdrawal, internalization, or confrontation (MacLeod 1987; Mukhopadhyay and Mukunda 2017).
Work mastery reflects students’“dispositional desire to work hard to master tasks” (OECD 2019a:230), which is considered an intrinsic motivation for learning. The definition of this variable in PISA has much in common with the “big five” personality trait conscientiousness, which is strongly related to behaviors such as hard work, ambition, and self-discipline (Meyer et al. 2019). It was measured by four items (e.g., “If I am not good at something, I would rather keep struggling to master it than move on to something I may be good at”).
Competitiveness reflects the “dispositional desire to outperform others” (OECD 2019a:230), which can be an extrinsic motivation for performance. It was measured with three items (e.g., “It is important for me to perform better than other people on a task”). Friedman (2013) describes how middle- and upper-class U.S. parents seek to cultivate a competitive orientation in their children, especially though extracurricular activities. Although many low-income children endorse the achievement ideology and its underlying logic of competitiveness, some may refuse to engage in competitions that are perceived as unfair or unwinnable (Lamont 2018; Willis 1977).
Growth mindset, also known as an “incremental mindset,” was measured using a single item measured on a 4-point Likert scale: “Your intelligence is something about you that you can’t change very much.” This item was converted to a binary variable where students who (strongly) agreed with the statement are considered to have a fixed mindset and those who (strongly) disagreed with the statement are considered to have a growth mindset. Across the PISA countries, 55 percent of respondents had a growth mindset.
Empirical Approach
Counterfactual decomposition techniques can help us disentangle the sources of between-group inequality. To assess the extent to which the socioeconomic achievement gap in PISA science scores is explained by socio-emotional skills, we use the well-known Kitagawa-Oaxaca-Blinder (KOB) decomposition (Kitagawa 1955; Oaxaca 1973). The KOB method decomposes the achievement gap into four components: (1) a component resulting from differences in the intercepts between the two groups (intercepts component), (2) a component explained by differences in returns to socio-emotional skills (returns component), (3) a component explained by compositional differences in socio-emotional skills (endowment component), and (4) a component resulting from the interaction between endowments and returns (interaction component). The decomposition can be written as
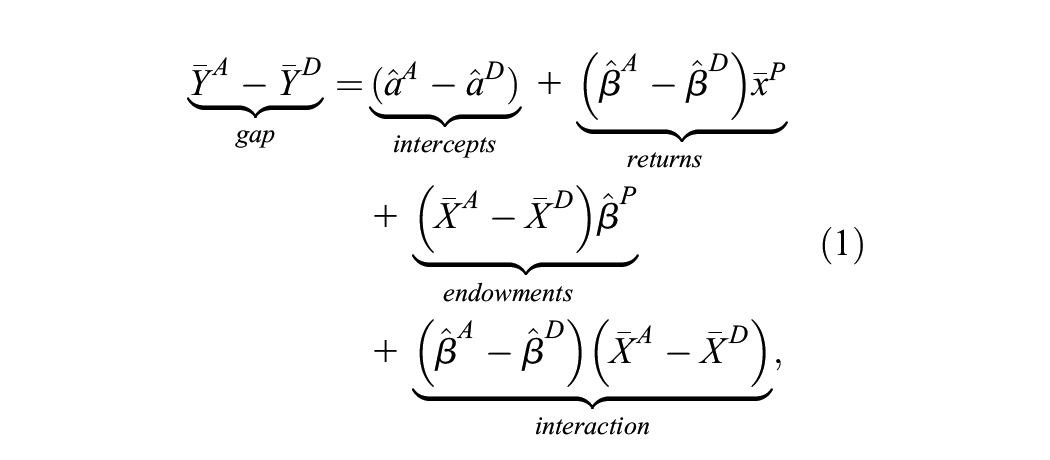
where
The endowment (or compositional) component is based on a counterfactual scenario in which disadvantaged students are assigned the same average levels of socio-emotional skills as advantaged children but retain their own intercept and coefficients (essentially, this entails a shift along the “advantaged” regression line in Figure 2). The extent to which this improves their predicted learning outcomes depends on (1) the size of the socioeconomic gap in socio-emotional skills and (2) the strength of the association between noncognitive skills and learning outcomes for disadvantaged children. Many SEL interventions with marginalized children are based on this logic: By improving disadvantaged children’s social and emotional skills, such as self-efficacy and growth mindset, they seek to improve their educational performance and reduce the gap with their wealthier peers. Each of our conceptual scenarios (simple accumulation, multiplicative accumulation, and compensatory accumulation) assumes a positive endowment effect.
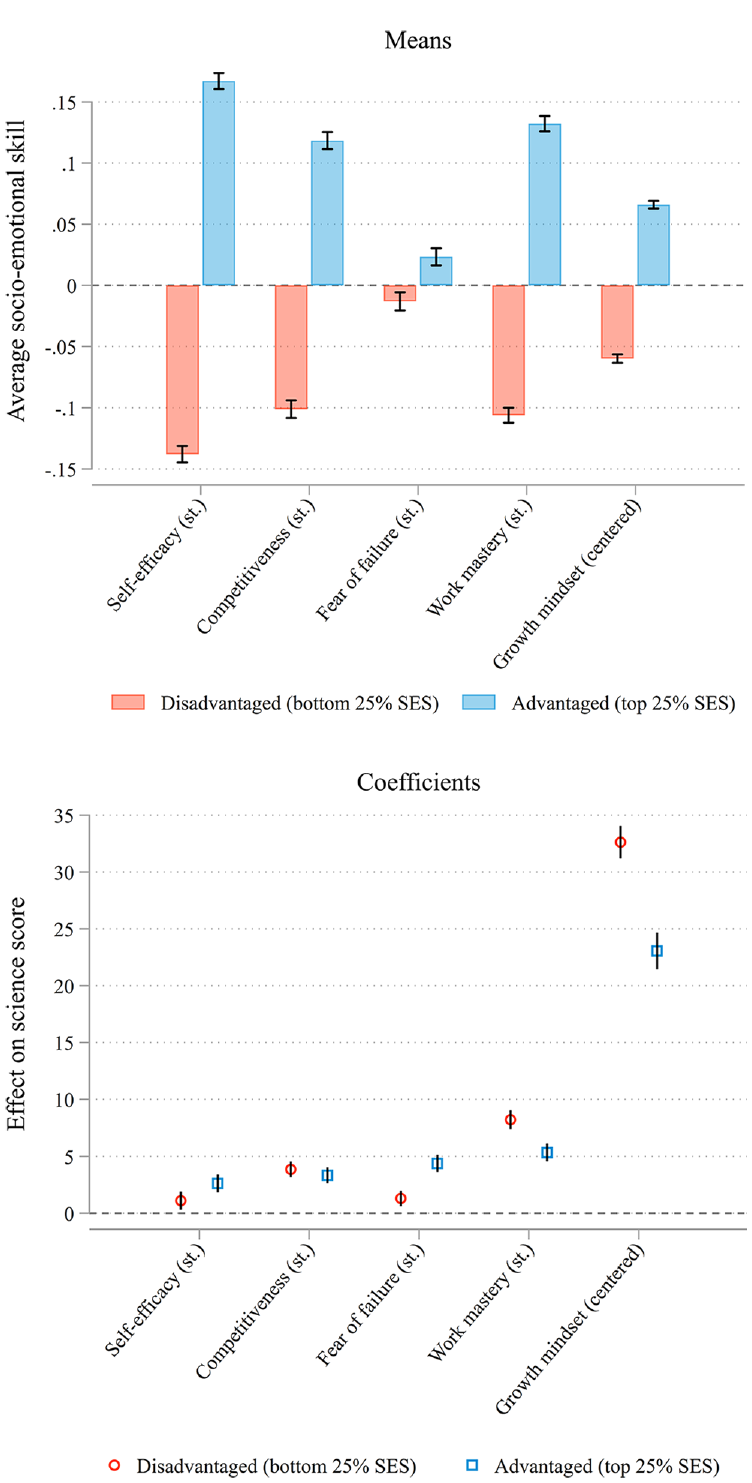
Means and coefficients of socio-emotional skills, by socioeconomic status group.
The returns (or coefficient) component relies on a counterfactual scenario in which disadvantaged children are assigned the returns to socio-emotional skills that are observed in advantaged children. In Figure 2, this entails shifting the slope of the regression line while keeping its intercept in place. In the simple accumulation scenario, the returns effect is 0 because advantaged and disadvantaged children have the same returns to socio-emotional skills (indicated by the parallel regression lines). In the compensatory accumulation scenario, the returns effect is positive: If disadvantaged children were assigned the (lower) returns of their wealthier peers, this would increase their predicted performance. The reason is that disadvantaged children are assumed to have below-average socio-emotional skills, so attaching increased importance to these skills would be detrimental to their performance relative to the reference category (children with country-average socio-emotional skills). In the multiplicative accumulation scenario, the opposite occurs: Assigning the disadvantaged group the (higher) coefficients of the advantaged group reduces their predicted performance, leading to a negative returns component.
A well-known problem in KOB decompositions is that the size and composition of the returns component is dependent on the choice of the reference category, or the zero point for scale variables (Fortin, Lemieux, and Firpo 2011; Jones and Kelley 1984). However, Kim (2013:358) states that “any detailed decomposition method is acceptable as long as there are theoretical or practical reasons to believe that the researcher’s choice of reference group (or weighting factors) produces a meaningful decomposition result.” In our case, standardizing the socio-emotional skill variables within countries makes sense because it gives an intuitive interpretation to the intercept component: It is the average difference in learning outcomes between an advantaged and a disadvantaged child with country-average levels of socio-emotional skills. Socio-emotional skills likely explain only part of the achievement gap in learning outcomes, so an unexplained component remains even after accounting for the effects of socio-emotional skills. The intercept component—the part of the gap due to “group membership” (Jann 2008)—can be interpreted as the group difference in learning outcomes that is due to factors other than socio-emotional skills. These may include differences in school quality, the home environment, or any other variables not included in the model.
Finally, the interaction effect accounts for the possibility that cross-group differences in endowments and coefficients can occur simultaneously. It reflects the incremental change in the gap that would occur if the disadvantaged group were assigned the levels and returns to socio-emotional skills of the advantaged group over and above the “pure” endowment and returns effects (Jones and Kelley 1984).
Importantly, our conceptual scenarios presume the existence of a causal relationship between socio-emotional skills and learning outcomes. If socio-emotional skills are unrelated to PISA test scores or if the observed relationship is spurious, then socio-emotional skills cannot explain group differences in learning. KOB decompositions only have a causal interpretation under the strict assumption that the underlying relationships are themselves causal (Jackson and VanderWeele 2018). As we explained previously, however, cross-sectional associations between socio-emotional skills and academic performance may be affected by reverse causality and omitted variable bias. Reverse causality occurs when academically gifted children develop more positive socio-emotional traits and attitudes, a scenario that is intuitively plausible and has been observed in previous research (Borghans et al. 2008; Gonida et al. 2006; Rosenberg et al. 1995). Similarly, low performance in school can diminish self-efficacy and contribute to disengaged or oppositional attitudes (MacLeod 1987). Omitted variable bias occurs when socio-emotional skills serve as a proxy for unobserved factors (e.g., parenting styles or school-level factors) that exert causal effects on learning outcomes.
We therefore interpret both the compositional and the returns effects as upper bounds on the true or causal share of the socioeconomic achievement gap that is explained by the socio-emotional skills included in our model. This upper bound interpretation is warranted because both reverse causality and omitted variable bias inflate the contribution of socio-emotional skills to learning inequality. One can therefore assume that the true contribution is lower than what is observed in our cross-sectional decomposition. An upper bound interpretation can be substantively meaningful, especially if the upper bound is fairly low—as is the case in our findings.
We started the empirical analysis by calculating the KOB decomposition across all countries in our sample. In all our analyses, we used the plausible values, replicate weights, and sample weights as recommended by PISA (OECD 2021b). We applied PISA’s senate weight, which gives equal weight to each country, and standardized each of the explanatory variables within countries. This means we sought to explain the socioeconomic achievement gap within each country. Our aggregate estimates can be interpreted as averages across the 78 countries. These averages may hide important country- and regional-level heterogeneity, however, which is why we repeated the analyses using groups of countries and for each country individually. In line with our substantive interest, country groups were defined by cultural regions (West, East Asia, Latin America, and Middle East and North Africa) and GDP categories (lower-middle, upper-middle, and high income). Finally, we checked the robustness of our findings to using a different measure of learning outcomes (reading and mathematics scores) and different specifications of the “advantaged” and “disadvantaged” groups. In both cases, the results did not change substantively.
Results
We start by presenting the findings for the full PISA sample. Country-level differences were averaged out by standardizing all variables within countries. Across all countries, the average difference in PISA science scores between disadvantaged (bottom SES quartile) and advantaged (top SES quartile) children is 70.5 points (0.71 SD): This is the “gap” we are seeking to explain. In practical terms, 0.71 SD is a very large gap, equivalent to almost three years of schooling (Avvisati and Givord 2021).
The Oaxaca decomposition is based on (1) group differences in the means of the explanatory variables and (2) group differences in the coefficients of the explanatory variables when regressing science scores on socio-emotional skills separately for each SES group. Figure 2 presents these constitutive elements of the decomposition. It shows that on average, advantaged children had higher levels of socio-emotional skills than disadvantaged children. The difference is 0.036 SD for fear of failure, 0.22 SD for competitiveness, 0.24 SD for work mastery, and 0.31 SD for self-efficacy (remember that all socio-emotional skills are standardized within countries). Advantaged children were also 12.6 percentage points more likely to have a growth mindset (a binary variable). Although these differences are substantial and significant, they are relatively smaller than the socioeconomic achievement gap in science scores, which was 0.74 SD. The SES gap in socio-emotional skills is thus much smaller than the SES gap in cognitive skills, which is in line with previous research (Hsin and Xie 2017). Overall agreement with the statements underlying these skills was quite high for both advantaged and disadvantaged children.
The bottom panel of Figure 2 shows the returns to socio-emotional skills for each group. Each of the socio-emotional skills has a positive and significant effect on science scores, controlling for all other skills. Differences in the returns between advantaged and disadvantaged children show a mixed picture: Self-efficacy and fear of failure have a somewhat larger association with learning outcomes for advantaged children, whereas work mastery and growth mindset are more beneficial to disadvantaged children. The most striking result here is the coefficient of growth mindset (a binary variable), which is associated with a 33-point (0.33 SD) increase in science scores for disadvantaged children and a 23-point (0.23 SD) increase for advantaged children. This is a very large effect: As a comparison, the effect of a standard deviation increase in household socioeconomic status (ESCS) is around 30 points. Effects for the other socio-emotional skills are more modest, ranging between +1 and +10 points for a standard deviation increase in the respective variable. Our findings thus confirm previous studies that highlight the positive associations between socio-emotional skills and learning outcomes. However, we find no consistent pattern in the relative importance of these skills for socioeconomically advantaged and disadvantaged children.
Based on the differences in means and coefficients, we calculated the KOB decomposition of the socioeconomic achievement gap in science scores (presented in Table 1). Across all countries, the average gap in science scores between advantaged and disadvantaged children is 74.4 points. Table 1 shows that 7.3 of this 74.4-point gap (9.8 percent) is due to compositional differences in socio-emotional skills (p < .001; confidence interval: 9.4%, 10.3%). Endowment effects occur when advantaged students perform better than disadvantaged students because they have, on average, higher academically relevant socio-emotional skills.
Kitagawa-Oaxaca-Blinder Decomposition of the Socioeconomic Gap in Science Scores, All Programme for International Student Assessment Countries.
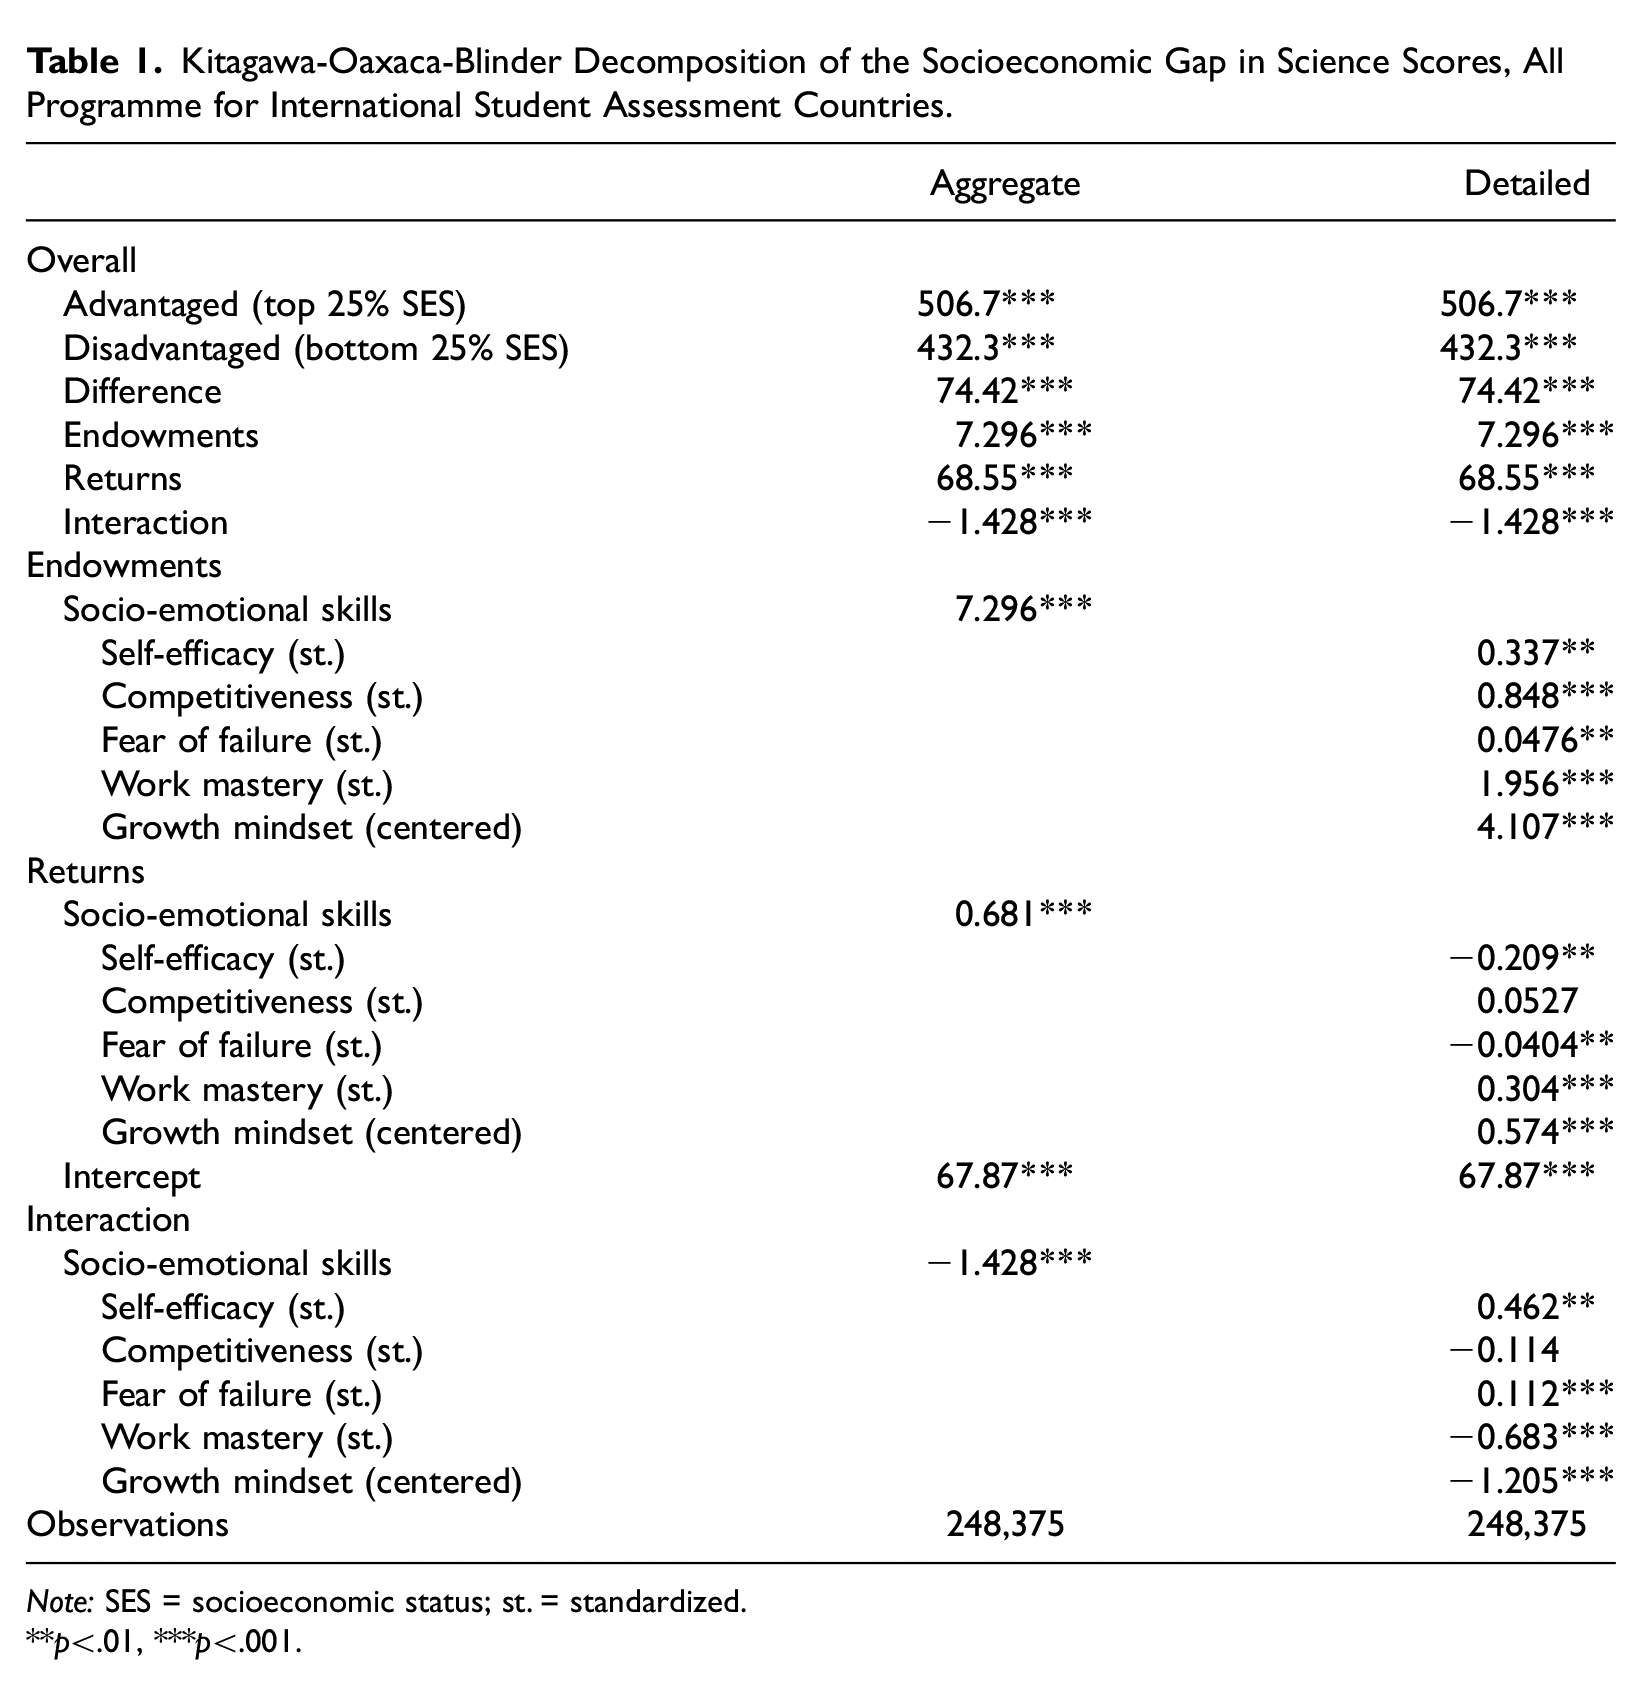
Note: SES = socioeconomic status; st. = standardized.
p<.01, ***p<.001.
Returns effects occur when low- and high-SES students differ in their ability to convert socio-emotional skills into achievement. Differences in returns to socio-emotional skills explain only a relatively insubstantial 0.68 points, or 0.92 percent of the socioeconomic gap in learning outcomes (p < .001; confidence interval: 0.64%, 1.19%). The interaction between endowments and returns explains −1.43 points (−1.92 percent) of the achievement gap. The negative figure suggests the interaction further advantaged the advantaged group.
In combination, endowments, returns, and their interaction therefore explain 8.8 percent (9.8% + 0.9% – 1.9%) of the socioeconomic achievement gap. This 8.8 percent should be interpreted as an upper bound on the “true” explained gap because a certain amount of reverse causality in the effect of socio-emotional skills on learning outcomes is likely, as is unobserved confounding. Conversely, 91.2 percent of the gap (67.9 science points) remains unexplained, which equates to the intercept component in Table 1. As discussed previously, the intercept component reflects the difference in predicted science score between an advantaged and a disadvantaged child with country-average levels of socio-emotional skills. We interpret this as the share of the achievement gap that is due to factors unrelated to the socio-emotional skills assessed in this study. Such factors may include differences in structural characteristics, such as school funding, access to extracurricular tuition, and teacher bias, and factors that are often described as “cultural,” such as parenting styles, aspirations, and classroom behaviors.
Figure 3 illustrates the different counterfactual scenarios implied in the KOB decomposition: If disadvantaged children were to obtain the same levels of socio-emotional skills as advantaged children while keeping their own returns, their performance in science would improve marginally. If they obtained the same returns to socio-emotional skills while keeping their levels constant, this would hardly affect their performance. Finally, assigning the advantaged group’s levels and returns to socio-emotional skills simultaneously still does not place the disadvantaged group anywhere near the advantaged group, suggesting most of the gap is due to factors unrelated to socio-emotional skills.
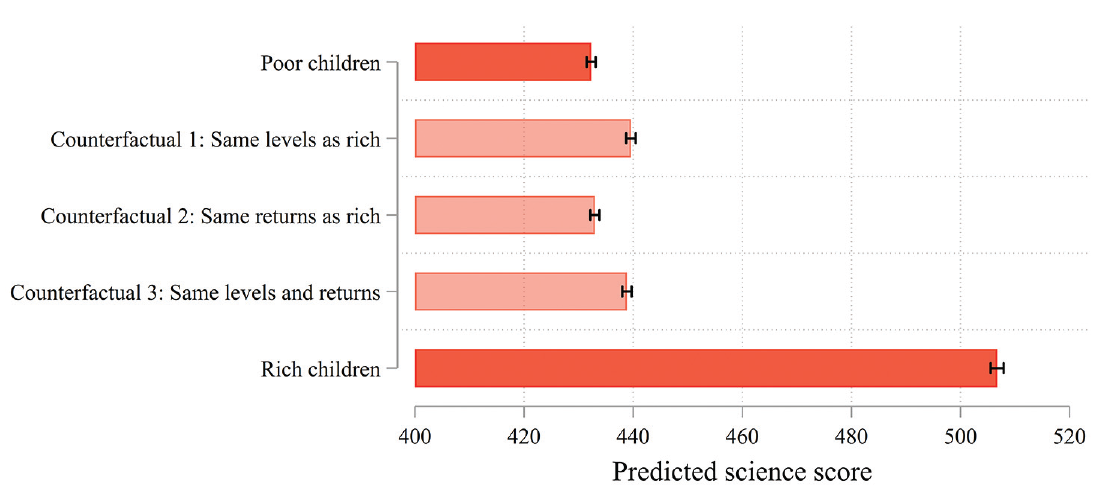
Predicted science scores under different counterfactual scenarios (full sample).
The detailed decomposition allows us to assess the contribution of individual skills to the aggregate endowment and returns components. Table 1 shows that more than half of the compositional effect (4.1 points) is due to differences in growth mindset, followed by work mastery (2.0 points). Levels of growth mindset and work mastery differ substantially between advantaged and disadvantaged children, and both variables are positively correlated with learning outcomes (see Figure 2). Differences in fear of failure, on the other hand, are minimal, and as a result, this variable hardly contributes to the endowment component. The aggregate returns effect, itself very small, resulted from minor differences in the returns to growth mindset, work mastery, and competitiveness.
Context Specificity
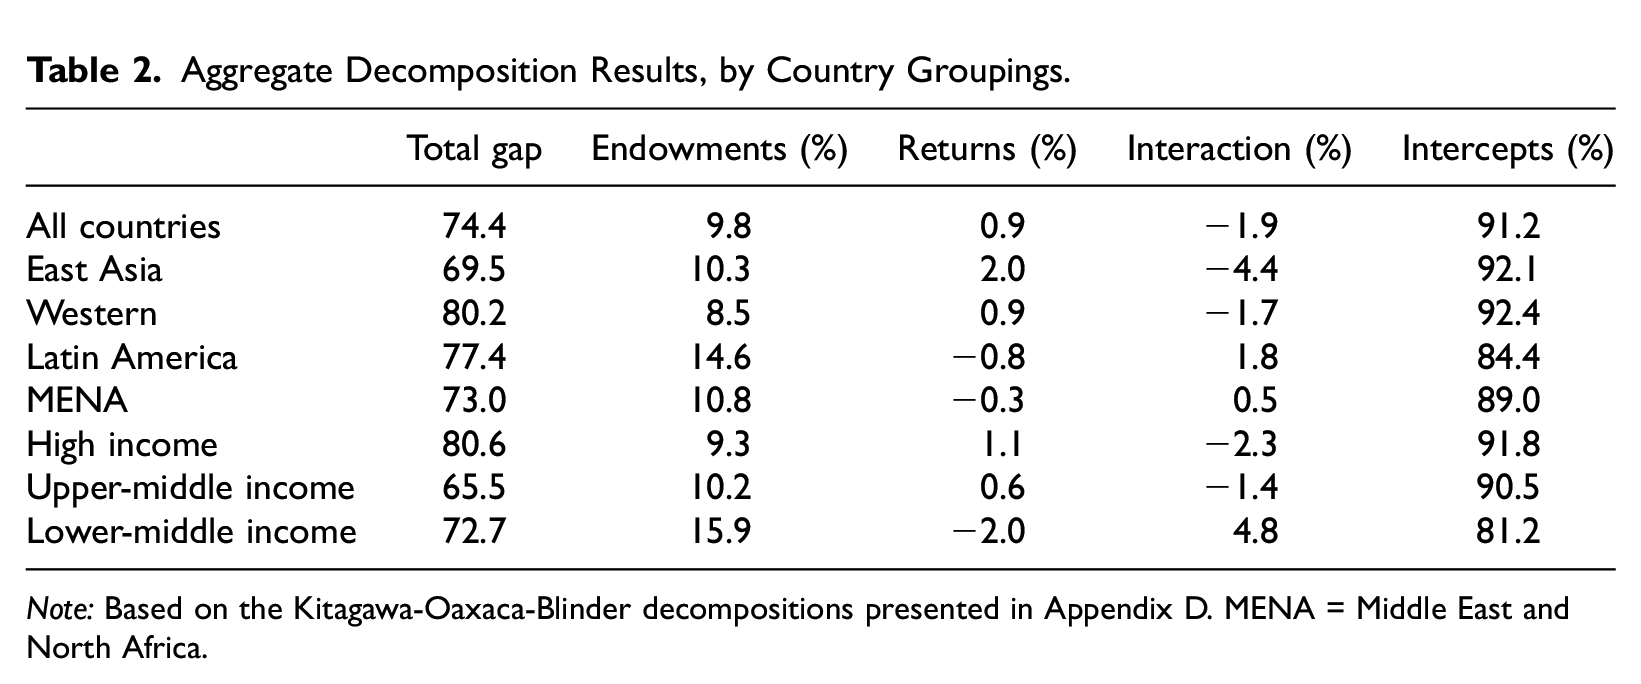
The findings in the previous section represent averages across the 78 PISA countries. As discussed previously, however, the role of socio-emotional skills in learning inequality may differ between cultural regions or between lower- and higher-income countries. Table 2 shows the aggregate KOB results with countries grouped by cultural region.
Aggregate Decomposition Results, by Country Groupings.
Note: Based on the Kitagawa-Oaxaca-Blinder decompositions presented in Appendix D. MENA = Middle East and North Africa.
Strikingly, the socioeconomic gap in learning outcomes is relatively stable across regions, ranging from 69.5 points in East Asia to 80.2 points in Western countries. The role of socio-emotional skills in explaining this gap is also relatively similar in each region: Differences in returns play a minor role, and differences in levels of socio-emotional skills explain a small but significant share of the gap, ranging from 8.5 points in the West to 14.6 points in Latin America. The total share of the socioeconomic gap in science achievement explained by the five socio-emotional skills amounts to 7.9 percent in East Asia, 7.6 percent in the West, 15.6 percent in Latin America, and 11.0 percent in the Middle East and North Africa. The detailed decompositions (presented in Appendix D) show that in each of the four regions, socioeconomic differences in growth mindset made the largest contribution.
Differences in economic development might also affect the relative importance of socio-emotional skills in learning inequality. Table 2 summarizes the aggregate decomposition by World Bank income groups (high income, upper-middle income, and lower-middle income). Again, most of the explained achievement gap is due to socioeconomic differences in levels of socio-emotional skills—growth mindset in particular—rather than to divergent returns. The total share of the gap in science achievement explained by compositional differences in socio-emotional skills amounts to 9.3 percent in high-income countries, 10.2 percent in upper-middle-income countries, and 15.9 percent in lower-middle-income countries. This provides tentative evidence that socioeconomic differences in socio-emotional skills are larger in lower-income contexts, contributing to learning inequality. This may relate to the detrimental effects of absolute poverty and deprivation—which are likely more prevalent in lower-income countries—on social and emotional development (Boyden et al. 2015; Dercon and Krishnan 2009). Note, however, that our sample includes only five lower-middle-income countries (Philippines, Ukraine, Moldova, Indonesia, and Morocco).
We also performed the decomposition analysis for each country individually (see Appendix E). The individual-country analyses do not show major deviations from the general pattern of modest compositional components and small returns components.
Robustness Checks
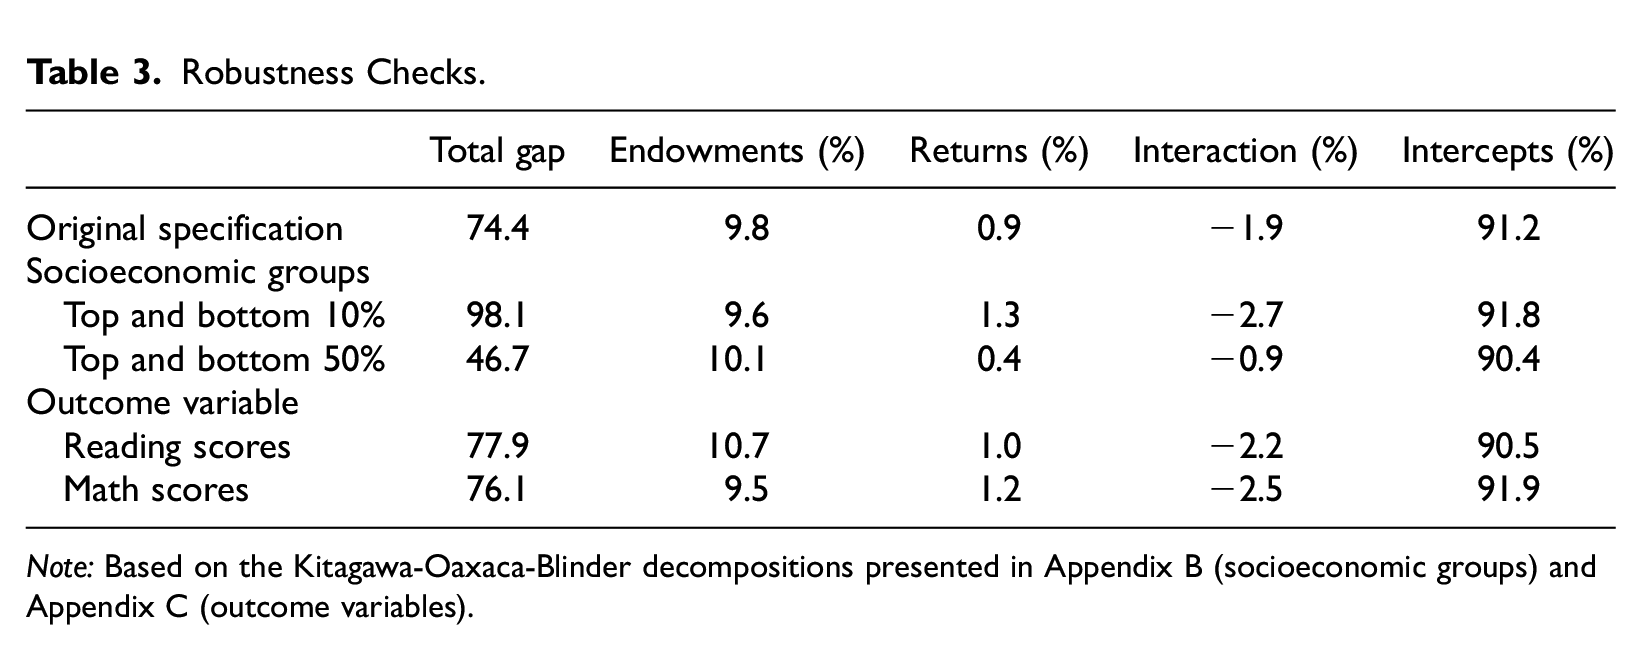
One could argue that using the top and bottom quartiles of the SES distribution to define “advantaged” and “disadvantaged” children is somewhat arbitrary; it is possible our results would change if we looked at the extreme ends of the socioeconomic distribution or if we enlarged the groups. We therefore repeated the overall decomposition using two different specifications for the SES groups: the top and bottom deciles and the top and bottom halves of the SES distribution. In each of the three specifications, around 10 percent of the achievement gap is explained by compositional differences in socio-emotional skills, with the return and interaction components playing a relatively marginal role (see Table 3). We also checked whether using reading or mathematics performance as an outcome variable instead of science would affect our findings (Table 3). Again, the results are very similar for each of the three learning outcomes, strengthening the robustness of our main conclusions.
Robustness Checks.
Note: Based on the Kitagawa-Oaxaca-Blinder decompositions presented in Appendix B (socioeconomic groups) and Appendix C (outcome variables).
Discussion
Sociologists working in the structural-cultural tradition have explained how the distinct constraints and opportunities faced by children from different socioeconomic backgrounds can affect their socio-emotional development and therewith their academic performance. The purpose of this study was to quantify the extent to which socio-emotional skills (also known as noncognitive skills) can explain the well-known gap in academic performance between low- and high-SES children. We developed three conceptual scenarios for the relationship between family background, socio-emotional skills, and learning outcomes: simple accumulation, multiplicative accumulation, and compensatory accumulation. Each scenario is grounded in theory and supported by at least some of the empirical evidence.
Our empirical estimates, based on a counterfactual KOB decomposition, show that the observed socio-emotional skills make a modest contribution to socioeconomic achievement inequality. We found that several of the socio-emotional skills measured in PISA—growth mindset in particular—have a strong association with learning outcomes. In combination, however, these skills explain no more than 8.8 percent of the socioeconomic gap in learning outcomes, equivalent to 6.6 points in the PISA science test.
Most of this effect is due to compositional differences in levels of socio-emotional skills between socioeconomically advantaged and disadvantaged children (simple accumulation). We found no evidence for cumulative or compensatory accumulation: Instead, disadvantaged children derived relatively similar academic returns from socio-emotional skills as did advantaged children. This observation runs counter to the widely held assumption that social and emotional skills are particularly important and beneficial for socioeconomically disadvantaged children, which underpins many SEL programs in the United States and elsewhere (e.g., AEI/Brookings Working Group on Poverty and Opportunity 2015).
The explained share of the learning gap is modest because differences in socio-emotional skills between the low- and high-SES groups are not that large: Both display relatively high levels of school-relevant socio-emotional skills. For example, 84 percent of disadvantaged children and 90 percent of advantaged 15-year-olds across the 78 countries (strongly) agreed with the statement, “I feel proud that I have accomplished things.” This suggests that young people who grow up in difficult circumstances generally do develop a sense of personal agency and accomplishment.
Moreover, we argue that the compositional and returns effects observed in our counterfactual model represent an upper bound on the “true” or causal share of the socioeconomic learning gap that is explained by the socio-emotional skills included in our model. We are unable to provide a more precise causal estimate because we cannot rule out omitted variable bias and reverse causality. Potential omitted variables include parenting practices—to the extent they are independent of SES—and school-level inputs that simultaneously increase socio-emotional skills and learning outcomes. Reverse causality occurs when high-achieving children develop more favorable socio-emotional skills—such as growth mindset and self-efficacy—through processes of positive reinforcement. Importantly, however, both omitted variable bias and reverse causality inflate the importance of socio-emotional skills, which is why we interpret our estimate as an upper bound on the underlying causal estimand.
In interpreting these conclusions, a number of limitations should be kept in mind. Our upper-bound interpretation of the explained socioeconomic achievement gap would be violated if we had excluded certain socio-emotional skills that are highly correlated with SES and have a strong causal effect on learning outcomes. Educational psychologists have described a wide range of skills or traits that are considered important for learning outcomes, and not all of them are measured in PISA. However, the PISA questionnaires were designed to include a comprehensive set of the most learning-relevant socio-emotional skills (OECD 2019a). Skills that were not included in PISA—such as “grit”—tend to be strongly correlated with included skills, such as work mastery and self-efficacy (Usher et al. 2019), so their omission is unlikely to dramatically affect the results. However, in light of this possibility, we emphasize that the upper-bound interpretation applies only to the socio-emotional skills included in our model. A second potential limitation is structural measurement error in the socio-emotional skills variables. Respondents might have provided excessively positive responses to questions about their psychological dispositions due to either social desirability or self-deception (Borghans et al. 2008). Lizardo (2017) argues that personal culture can be divided into a declarative form (knowledge “that”), which is transparent and easily elicited in linguistic reports such as surveys, and a hard-to-elicit nondeclarative form (knowledge “how”), which can only be acquired via long-term processes of habituation and enskillment. Especially among working-class and otherwise disadvantaged groups, these two modes of personal culture often diverge, leading to a “nondeclarative enculturation gap” (Lizardo 2017:105). Nondeclarative skills and habits, such as seeking help from teachers and effective study habits, are often particularly important for learning outcomes and may contribute to socioeconomic achievement inequality (Calarco 2012, 2014). Our findings therefore do not suggest that “cultural” factors, in the broadest sense, are unimportant for educational inequality or that the entire unexplained gap can be attributed to differences in “structural” resources.
These limitations do not diminish our core finding that socio-emotional skills explain at most a small share of the learning gap between high- and low-SES children. This finding has major policy implications. Most importantly, it suggests SEL-type interventions are unlikely to achieve their stated goal of substantially reducing achievement gaps. Even if such interventions were able to close the socioeconomic gap in socio-emotional skills—which is unlikely, considering the myriad ways children’s social and emotional development is linked to social origins—this would reduce the learning gap by no more than 8.8 percent.
Our findings therefore challenge some of the more sweeping claims in the popular psychological literature, which sometimes appears to suggest educational success is simply a question of mindset and attitude (Duckworth 2016; Dweck 2007). This literature often disregards class- and poverty-related constraints, which operate not only through socio-emotional skills but also through (lack of) support from family and peer groups, the unequal distribution of educational resources, outright discrimination, and several other channels. This is not to say social and emotional skills are not important; they have a deep intrinsic value, and we found that several of them show remarkably large correlations with learning outcomes. Unfortunately, however, they are not a magic bullet for tackling the socioeconomic achievement gap.
Footnotes
Appendix A: Measurement of Socio-Emotional Skills
The socio-emotional skill variables used in this study are composite indicators provided by the Programme for International Student Assessment. The underlying questionnaire items (measured on a Likert scale) are provided in Table A1. Cronbach’s alphas within countries ranged from 0.64 to 0.91, suggesting strong internal consistency.
Different socio-emotional skills tend to be positively correlated (see Table A2), but the weak to moderate strength of the correlations (−0.09 to 0.43) suggests they tap into different underlying constructs.
Appendix B: Different Specification of Socioeconomic Groups
Kitagawa-Oaxaca-Blinder Decomposition of Science Scores Using Different Specifications of Socioeconomic (Dis)Advantage.
| Top and bottom 10% | Top and bottom 50% | |||
|---|---|---|---|---|
| Aggregate | Detailed | Aggregate | Detailed | |
| Overall | ||||
| Advantaged | 518.5*** | 518.5*** | 492.4*** | 492.4*** |
| Disadvantaged | 420.7*** | 420.7*** | 445.6*** | 445.6*** |
| Difference | 97.89*** | 97.89*** | 46.74*** | 46.74*** |
| Endowments | 9.578*** | 9.578*** | 4.737*** | 4.737*** |
| Returns | 91.14*** | 91.14*** | 42.41*** | 42.41*** |
| Interaction | −2.823*** | −2.823*** | −0.413*** | −0.413*** |
| Endowments | ||||
| Socio-emotional skills | 9.578*** | 4.737*** | ||
| Self-efficacy (st.) | 0.359 | 0.186*** | ||
| Competitiveness (st.) | 1.079*** | 0.552*** | ||
| Fear of failure (st.) | 0.0442 | 0.0545*** | ||
| Work mastery (st.) | 3.018*** | 1.208*** | ||
| Growth mindset (centered) | 5.078*** | 2.736*** | ||
| Returns | ||||
| Socio-emotional skills | 1.372*** | 0.183*** | ||
| Self-efficacy (st.) | −0.252 | −0.113** | ||
| Competitiveness (st.) | 0.0552 | 0.00458 | ||
| Fear of failure (st.) | −0.0738* | −0.0262*** | ||
| Work mastery (st.) | 0.645*** | 0.115*** | ||
| Growth mindset (centered) | 0.997*** | 0.202*** | ||
| Intercept | 89.77*** | 89.77*** | 42.23*** | 42.23*** |
| Interaction | ||||
| Socio-emotional skills | −2.823*** | −0.413*** | ||
| Self-efficacy (st.) | 0.586 | 0.242** | ||
| Competitiveness (st.) | −0.121 | −0.0105 | ||
| Fear of failure (st.) | 0.151** | 0.0635*** | ||
| Work mastery (st.) | −1.431*** | −0.262*** | ||
| Growth mindset (centered) | −2.008*** | −0.446*** | ||
| Observations | 97,559 | 97,559 | 488,024 | 488,024 |
Note: st. = standardised.
p<.05, **p<.01, ***p<.001.
Appendix C: Reading and Mathematics Scores as Outcome Variables
Kitagawa-Oaxaca-Blinder Decomposition of the Socioeconomic Gap in Math and Reading Scores, All Programme for International Student Assessment Countries.
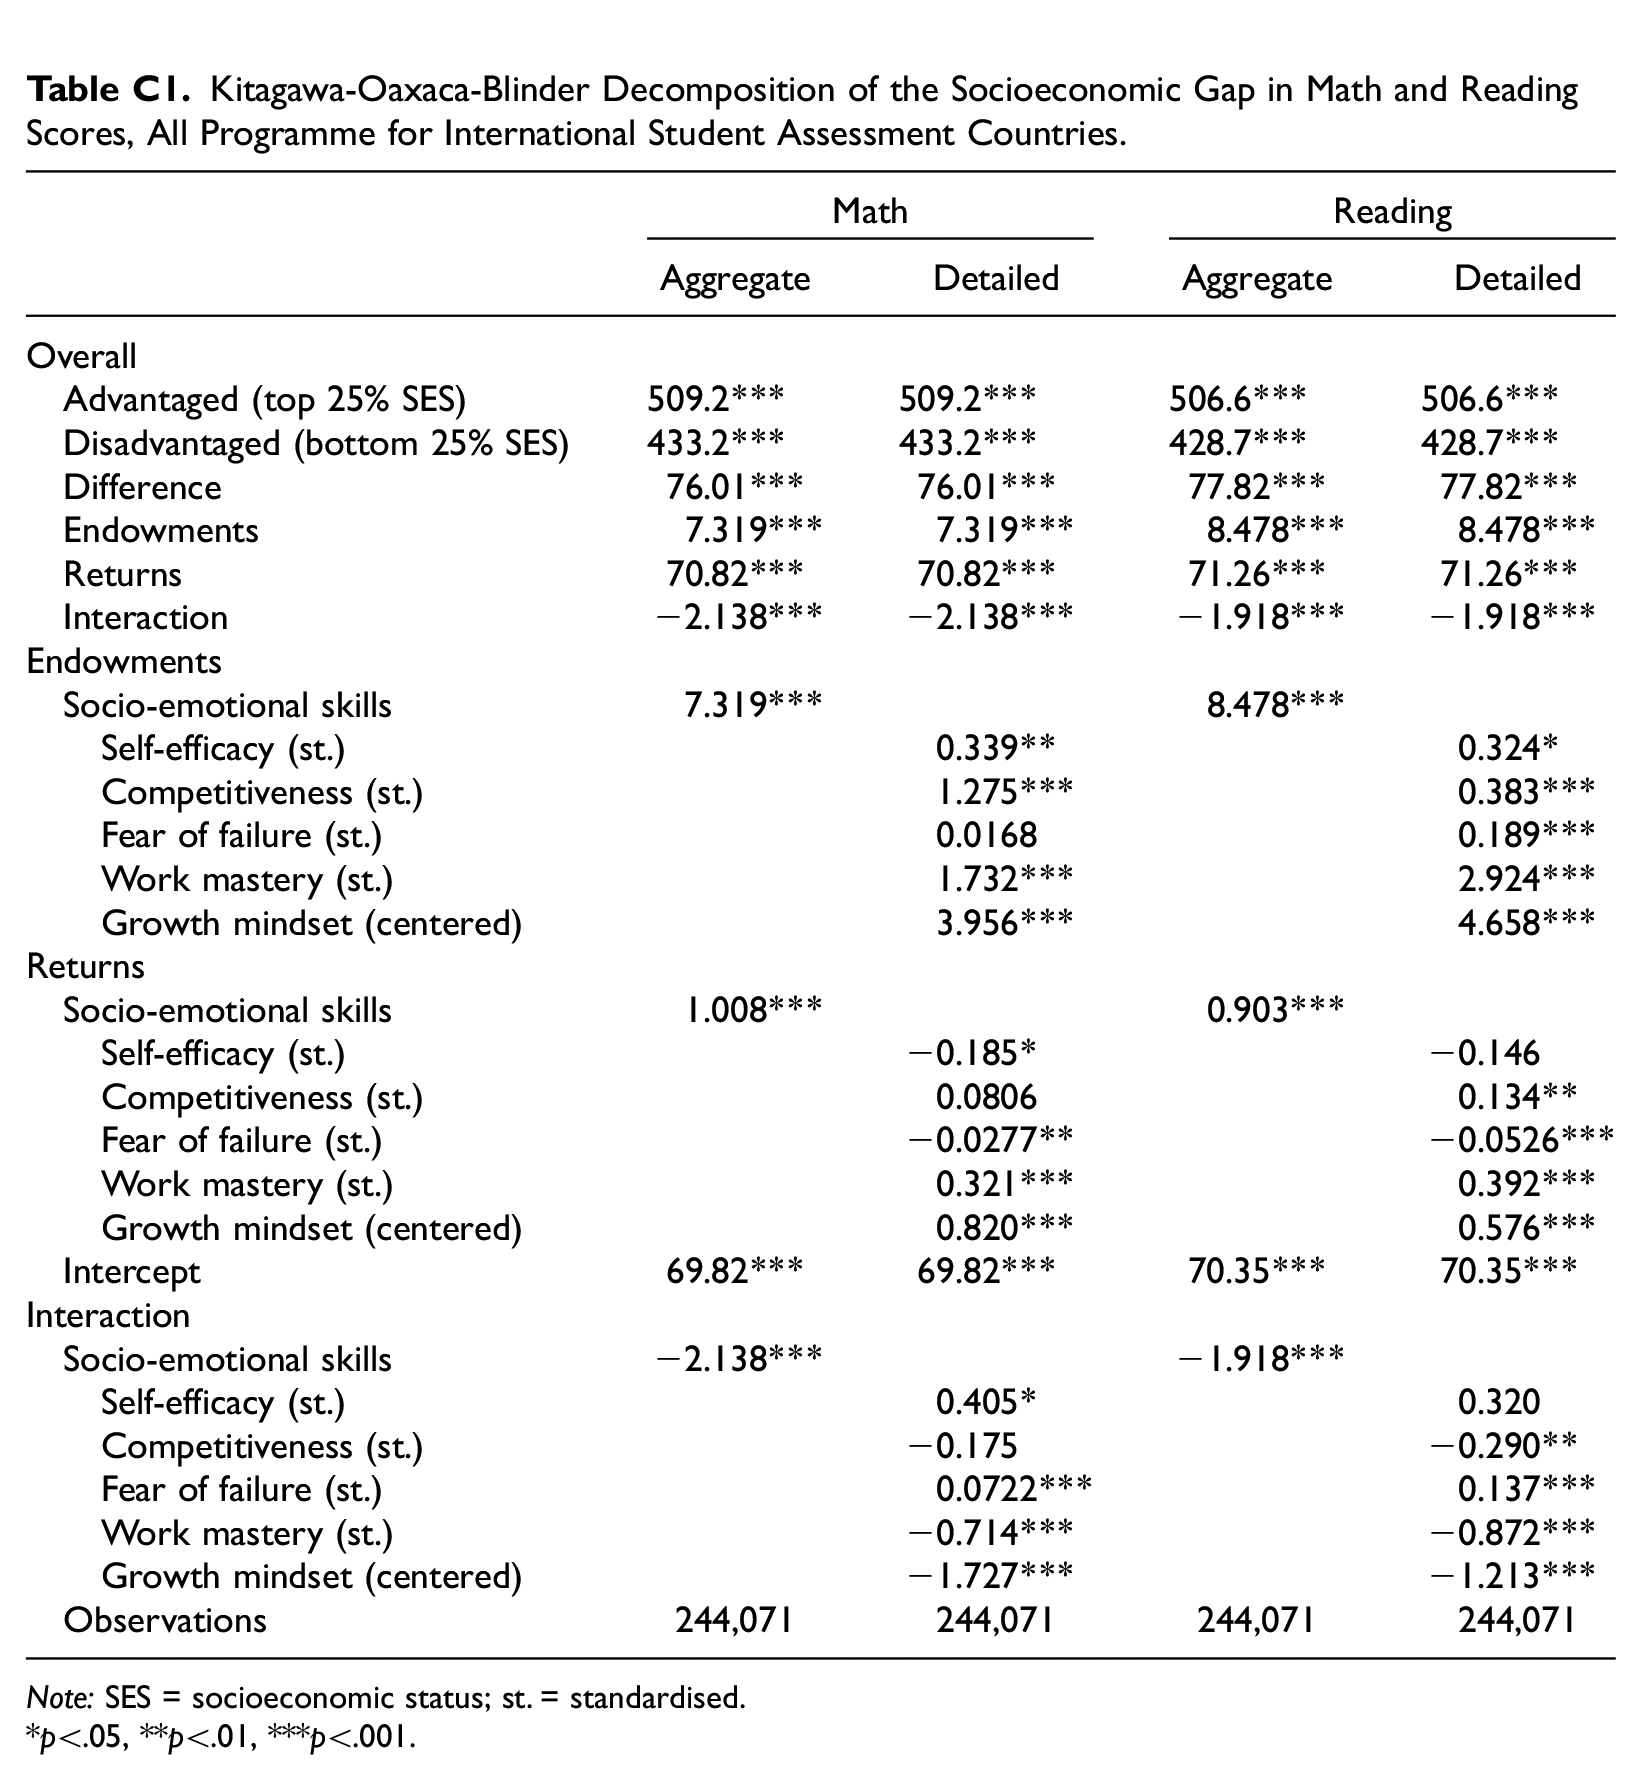
| Math | Reading | |||
|---|---|---|---|---|
| Aggregate | Detailed | Aggregate | Detailed | |
| Overall | ||||
| Advantaged (top 25% SES) | 509.2*** | 509.2*** | 506.6*** | 506.6*** |
| Disadvantaged (bottom 25% SES) | 433.2*** | 433.2*** | 428.7*** | 428.7*** |
| Difference | 76.01*** | 76.01*** | 77.82*** | 77.82*** |
| Endowments | 7.319*** | 7.319*** | 8.478*** | 8.478*** |
| Returns | 70.82*** | 70.82*** | 71.26*** | 71.26*** |
| Interaction | −2.138*** | −2.138*** | −1.918*** | −1.918*** |
| Endowments | ||||
| Socio-emotional skills | 7.319*** | 8.478*** | ||
| Self-efficacy (st.) | 0.339** | 0.324* | ||
| Competitiveness (st.) | 1.275*** | 0.383*** | ||
| Fear of failure (st.) | 0.0168 | 0.189*** | ||
| Work mastery (st.) | 1.732*** | 2.924*** | ||
| Growth mindset (centered) | 3.956*** | 4.658*** | ||
| Returns | ||||
| Socio-emotional skills | 1.008*** | 0.903*** | ||
| Self-efficacy (st.) | −0.185* | −0.146 | ||
| Competitiveness (st.) | 0.0806 | 0.134** | ||
| Fear of failure (st.) | −0.0277** | −0.0526*** | ||
| Work mastery (st.) | 0.321*** | 0.392*** | ||
| Growth mindset (centered) | 0.820*** | 0.576*** | ||
| Intercept | 69.82*** | 69.82*** | 70.35*** | 70.35*** |
| Interaction | ||||
| Socio-emotional skills | −2.138*** | −1.918*** | ||
| Self-efficacy (st.) | 0.405* | 0.320 | ||
| Competitiveness (st.) | −0.175 | −0.290** | ||
| Fear of failure (st.) | 0.0722*** | 0.137*** | ||
| Work mastery (st.) | −0.714*** | −0.872*** | ||
| Growth mindset (centered) | −1.727*** | −1.213*** | ||
| Observations | 244,071 | 244,071 | 244,071 | 244,071 |
Note: SES = socioeconomic status; st. = standardised.
p<.05, **p<.01, ***p<.001.
Appendix D: Kitagawa-Oaxaca-Blinder Decompositions,by Country Groups
Kitagawa-Oaxaca-Blinder Decomposition, by Global Cultural Regions.
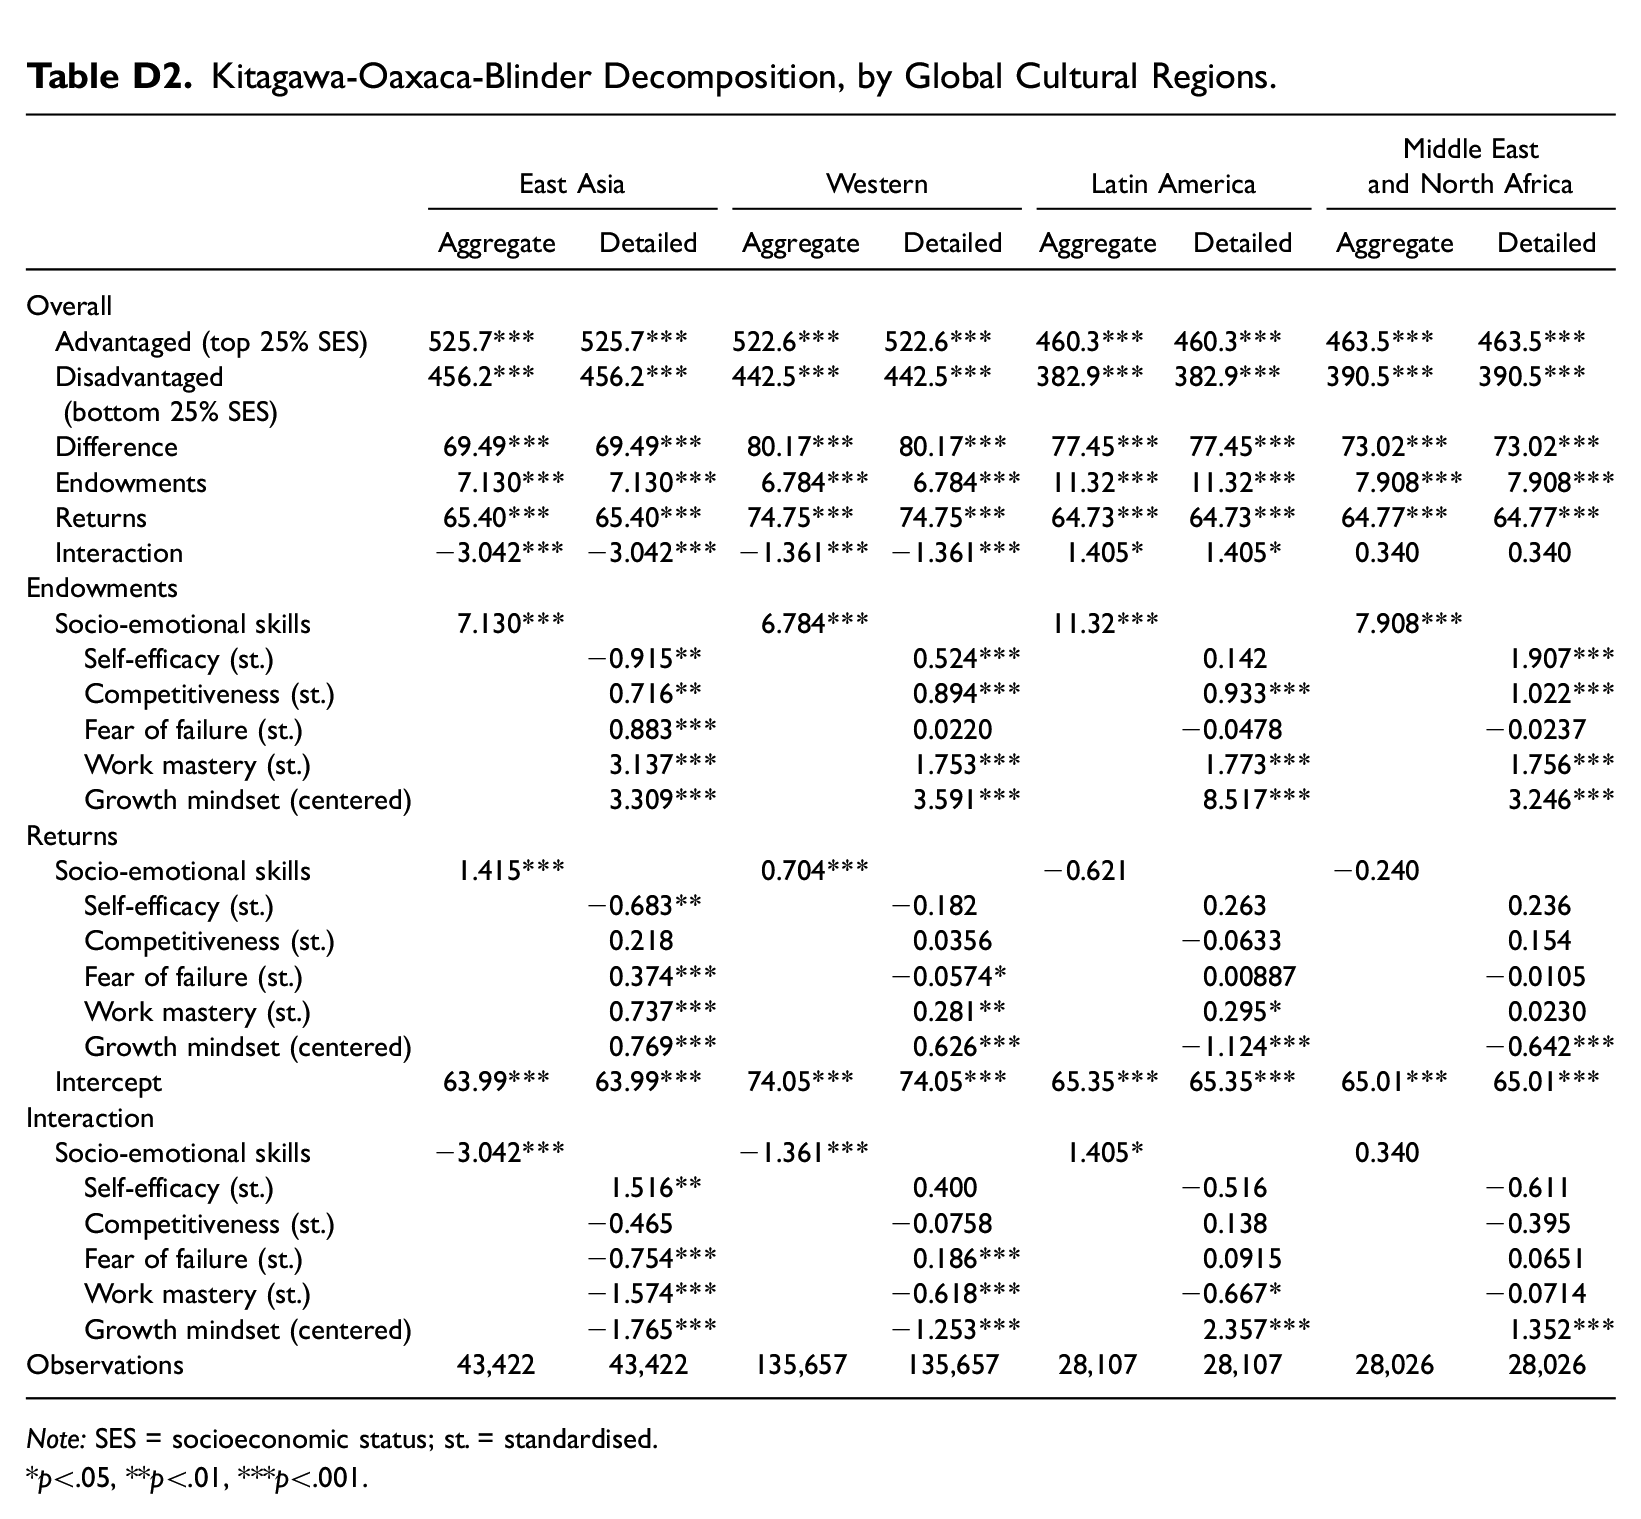
| East Asia | Western | Latin America | Middle East and North Africa | |||||
|---|---|---|---|---|---|---|---|---|
| Aggregate | Detailed | Aggregate | Detailed | Aggregate | Detailed | Aggregate | Detailed | |
| Overall | ||||||||
| Advantaged (top 25% SES) | 525.7*** | 525.7*** | 522.6*** | 522.6*** | 460.3*** | 460.3*** | 463.5*** | 463.5*** |
| Disadvantaged (bottom 25% SES) | 456.2*** | 456.2*** | 442.5*** | 442.5*** | 382.9*** | 382.9*** | 390.5*** | 390.5*** |
| Difference | 69.49*** | 69.49*** | 80.17*** | 80.17*** | 77.45*** | 77.45*** | 73.02*** | 73.02*** |
| Endowments | 7.130*** | 7.130*** | 6.784*** | 6.784*** | 11.32*** | 11.32*** | 7.908*** | 7.908*** |
| Returns | 65.40*** | 65.40*** | 74.75*** | 74.75*** | 64.73*** | 64.73*** | 64.77*** | 64.77*** |
| Interaction | −3.042*** | −3.042*** | −1.361*** | −1.361*** | 1.405* | 1.405* | 0.340 | 0.340 |
| Endowments | ||||||||
| Socio-emotional skills | 7.130*** | 6.784*** | 11.32*** | 7.908*** | ||||
| Self-efficacy (st.) | −0.915** | 0.524*** | 0.142 | 1.907*** | ||||
| Competitiveness (st.) | 0.716** | 0.894*** | 0.933*** | 1.022*** | ||||
| Fear of failure (st.) | 0.883*** | 0.0220 | −0.0478 | −0.0237 | ||||
| Work mastery (st.) | 3.137*** | 1.753*** | 1.773*** | 1.756*** | ||||
| Growth mindset (centered) | 3.309*** | 3.591*** | 8.517*** | 3.246*** | ||||
| Returns | ||||||||
| Socio-emotional skills | 1.415*** | 0.704*** | −0.621 | −0.240 | ||||
| Self-efficacy (st.) | −0.683** | −0.182 | 0.263 | 0.236 | ||||
| Competitiveness (st.) | 0.218 | 0.0356 | −0.0633 | 0.154 | ||||
| Fear of failure (st.) | 0.374*** | −0.0574* | 0.00887 | −0.0105 | ||||
| Work mastery (st.) | 0.737*** | 0.281** | 0.295* | 0.0230 | ||||
| Growth mindset (centered) | 0.769*** | 0.626*** | −1.124*** | −0.642*** | ||||
| Intercept | 63.99*** | 63.99*** | 74.05*** | 74.05*** | 65.35*** | 65.35*** | 65.01*** | 65.01*** |
| Interaction | ||||||||
| Socio-emotional skills | −3.042*** | −1.361*** | 1.405* | 0.340 | ||||
| Self-efficacy (st.) | 1.516** | 0.400 | −0.516 | −0.611 | ||||
| Competitiveness (st.) | −0.465 | −0.0758 | 0.138 | −0.395 | ||||
| Fear of failure (st.) | −0.754*** | 0.186*** | 0.0915 | 0.0651 | ||||
| Work mastery (st.) | −1.574*** | −0.618*** | −0.667* | −0.0714 | ||||
| Growth mindset (centered) | −1.765*** | −1.253*** | 2.357*** | 1.352*** | ||||
| Observations | 43,422 | 43,422 | 135,657 | 135,657 | 28,107 | 28,107 | 28,026 | 28,026 |
Note: SES = socioeconomic status; st. = standardised.
p<.05, **p<.01, ***p<.001.
Appendix E: Country-Level Analyses
Kitagawa-Oaxaca-Blinder Decomposition, by Country.
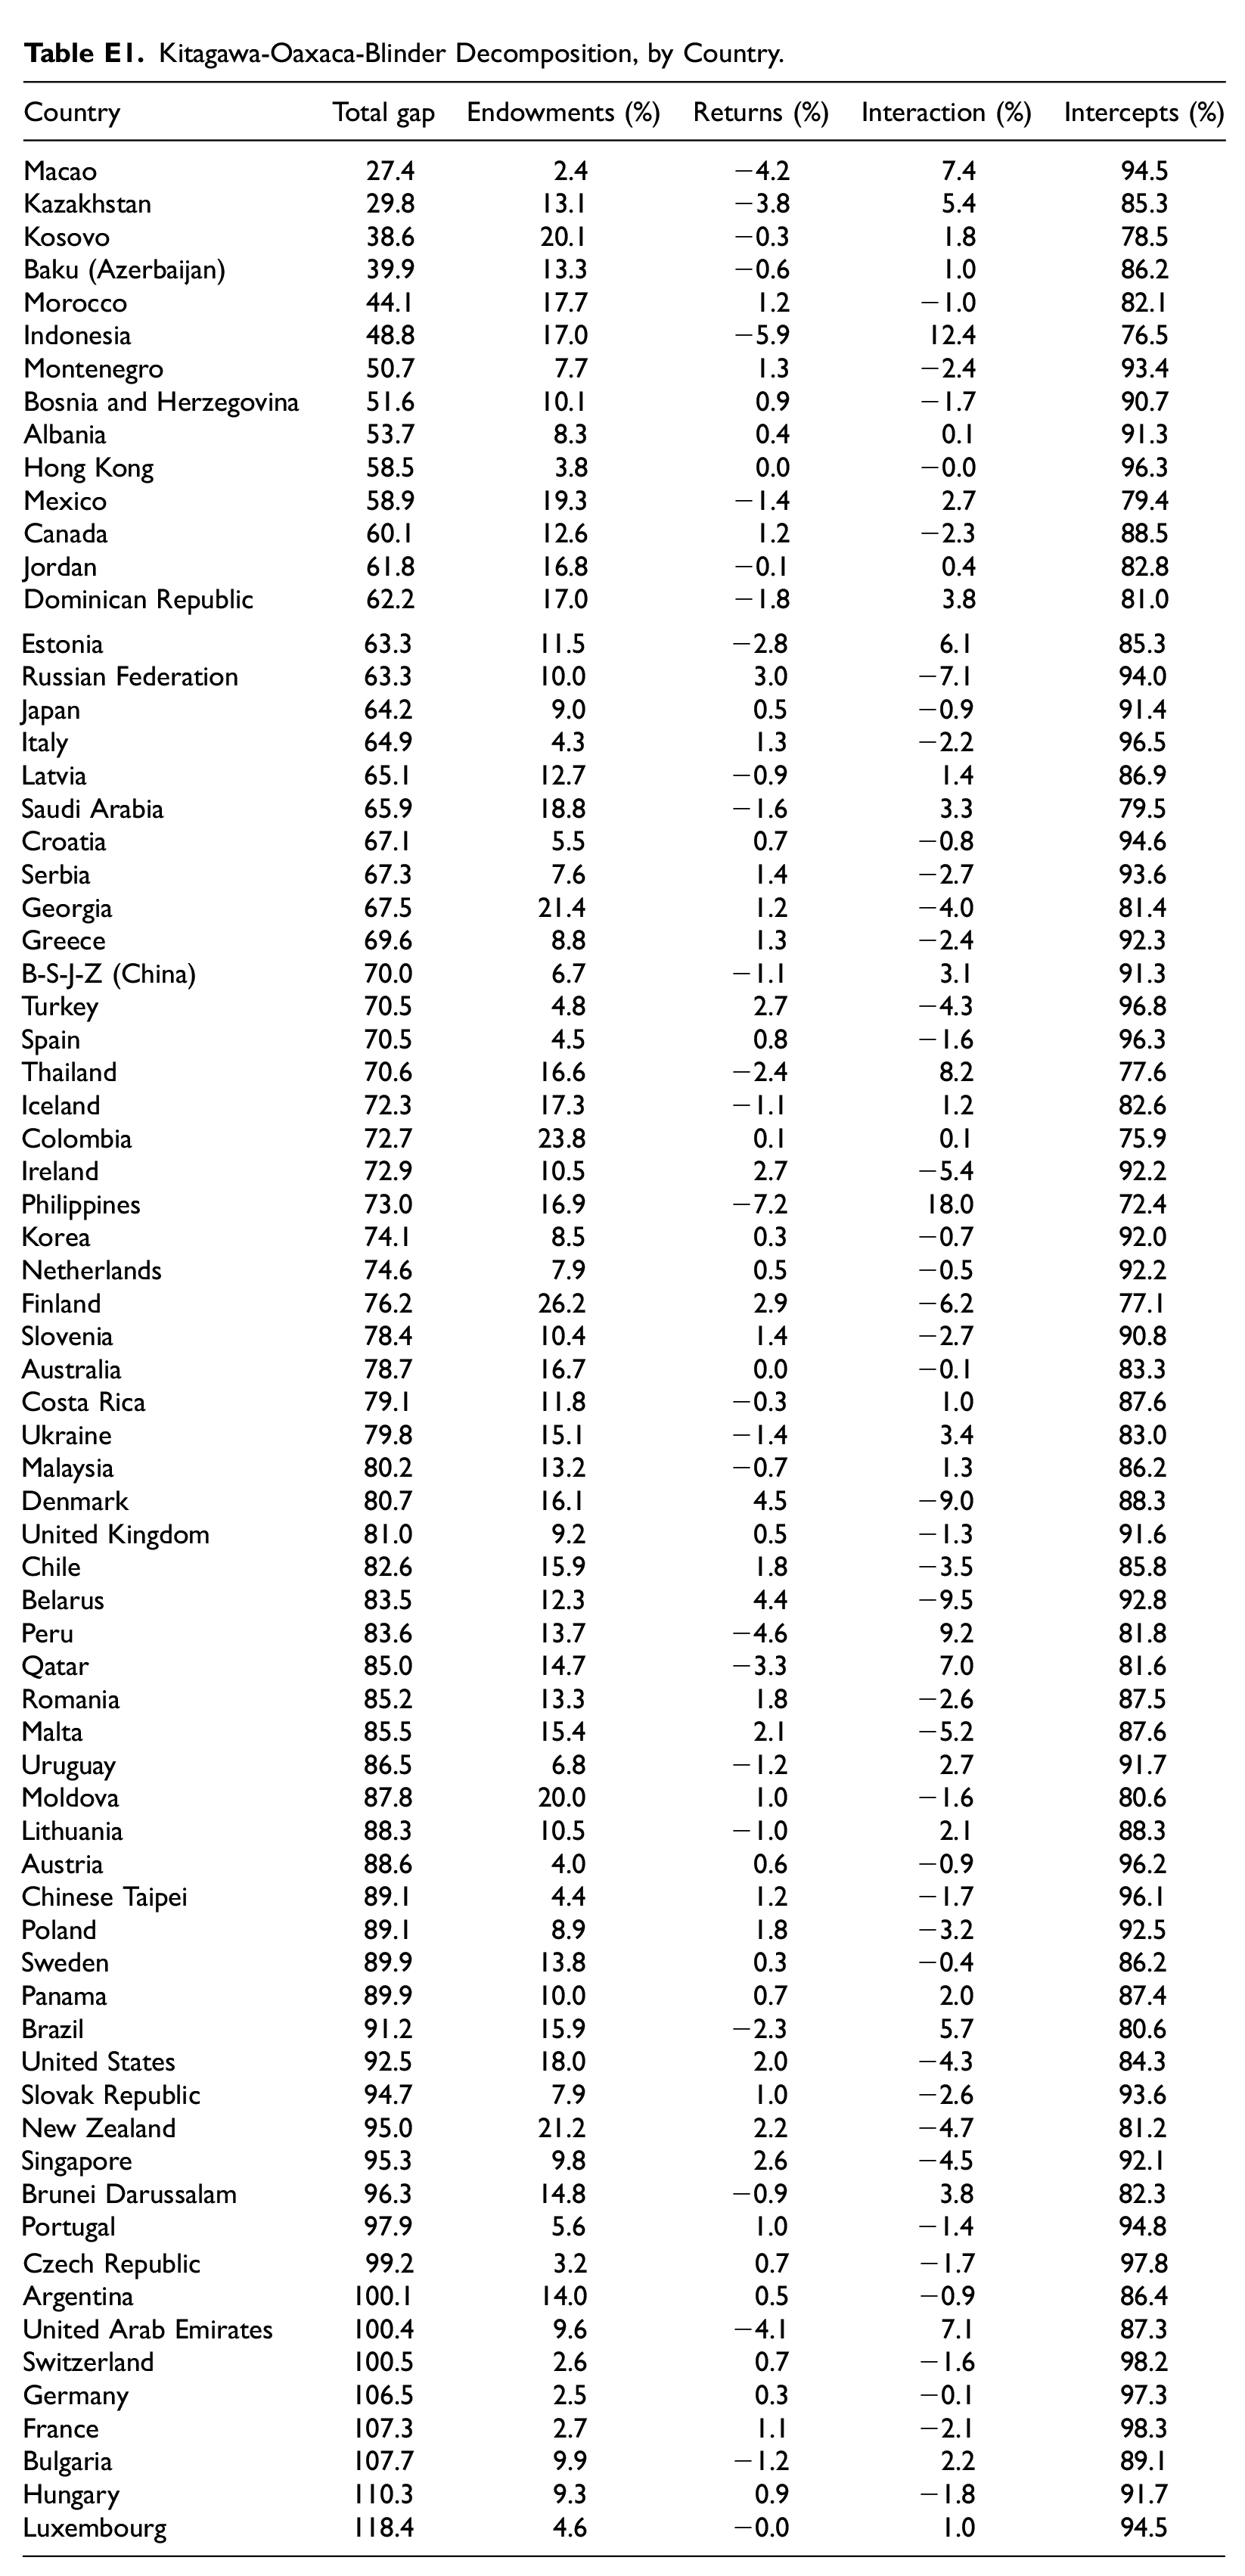
| Country | Total gap | Endowments (%) | Returns (%) | Interaction (%) | Intercepts (%) |
|---|---|---|---|---|---|
| Macao | 27.4 | 2.4 | −4.2 | 7.4 | 94.5 |
| Kazakhstan | 29.8 | 13.1 | −3.8 | 5.4 | 85.3 |
| Kosovo | 38.6 | 20.1 | −0.3 | 1.8 | 78.5 |
| Baku (Azerbaijan) | 39.9 | 13.3 | −0.6 | 1.0 | 86.2 |
| Morocco | 44.1 | 17.7 | 1.2 | −1.0 | 82.1 |
| Indonesia | 48.8 | 17.0 | −5.9 | 12.4 | 76.5 |
| Montenegro | 50.7 | 7.7 | 1.3 | −2.4 | 93.4 |
| Bosnia and Herzegovina | 51.6 | 10.1 | 0.9 | −1.7 | 90.7 |
| Albania | 53.7 | 8.3 | 0.4 | 0.1 | 91.3 |
| Hong Kong | 58.5 | 3.8 | 0.0 | −0.0 | 96.3 |
| Mexico | 58.9 | 19.3 | −1.4 | 2.7 | 79.4 |
| Canada | 60.1 | 12.6 | 1.2 | −2.3 | 88.5 |
| Jordan | 61.8 | 16.8 | −0.1 | 0.4 | 82.8 |
| Dominican Republic | 62.2 | 17.0 | −1.8 | 3.8 | 81.0 |
| Estonia | 63.3 | 11.5 | −2.8 | 6.1 | 85.3 |
| Russian Federation | 63.3 | 10.0 | 3.0 | −7.1 | 94.0 |
| Japan | 64.2 | 9.0 | 0.5 | −0.9 | 91.4 |
| Italy | 64.9 | 4.3 | 1.3 | −2.2 | 96.5 |
| Latvia | 65.1 | 12.7 | −0.9 | 1.4 | 86.9 |
| Saudi Arabia | 65.9 | 18.8 | −1.6 | 3.3 | 79.5 |
| Croatia | 67.1 | 5.5 | 0.7 | −0.8 | 94.6 |
| Serbia | 67.3 | 7.6 | 1.4 | −2.7 | 93.6 |
| Georgia | 67.5 | 21.4 | 1.2 | −4.0 | 81.4 |
| Greece | 69.6 | 8.8 | 1.3 | −2.4 | 92.3 |
| B-S-J-Z (China) | 70.0 | 6.7 | −1.1 | 3.1 | 91.3 |
| Turkey | 70.5 | 4.8 | 2.7 | −4.3 | 96.8 |
| Spain | 70.5 | 4.5 | 0.8 | −1.6 | 96.3 |
| Thailand | 70.6 | 16.6 | −2.4 | 8.2 | 77.6 |
| Iceland | 72.3 | 17.3 | −1.1 | 1.2 | 82.6 |
| Colombia | 72.7 | 23.8 | 0.1 | 0.1 | 75.9 |
| Ireland | 72.9 | 10.5 | 2.7 | −5.4 | 92.2 |
| Philippines | 73.0 | 16.9 | −7.2 | 18.0 | 72.4 |
| Korea | 74.1 | 8.5 | 0.3 | −0.7 | 92.0 |
| Netherlands | 74.6 | 7.9 | 0.5 | −0.5 | 92.2 |
| Finland | 76.2 | 26.2 | 2.9 | −6.2 | 77.1 |
| Slovenia | 78.4 | 10.4 | 1.4 | −2.7 | 90.8 |
| Australia | 78.7 | 16.7 | 0.0 | −0.1 | 83.3 |
| Costa Rica | 79.1 | 11.8 | −0.3 | 1.0 | 87.6 |
| Ukraine | 79.8 | 15.1 | −1.4 | 3.4 | 83.0 |
| Malaysia | 80.2 | 13.2 | −0.7 | 1.3 | 86.2 |
| Denmark | 80.7 | 16.1 | 4.5 | −9.0 | 88.3 |
| United Kingdom | 81.0 | 9.2 | 0.5 | −1.3 | 91.6 |
| Chile | 82.6 | 15.9 | 1.8 | −3.5 | 85.8 |
| Belarus | 83.5 | 12.3 | 4.4 | −9.5 | 92.8 |
| Peru | 83.6 | 13.7 | −4.6 | 9.2 | 81.8 |
| Qatar | 85.0 | 14.7 | −3.3 | 7.0 | 81.6 |
| Romania | 85.2 | 13.3 | 1.8 | −2.6 | 87.5 |
| Malta | 85.5 | 15.4 | 2.1 | −5.2 | 87.6 |
| Uruguay | 86.5 | 6.8 | −1.2 | 2.7 | 91.7 |
| Moldova | 87.8 | 20.0 | 1.0 | −1.6 | 80.6 |
| Lithuania | 88.3 | 10.5 | −1.0 | 2.1 | 88.3 |
| Austria | 88.6 | 4.0 | 0.6 | −0.9 | 96.2 |
| Chinese Taipei | 89.1 | 4.4 | 1.2 | −1.7 | 96.1 |
| Poland | 89.1 | 8.9 | 1.8 | −3.2 | 92.5 |
| Sweden | 89.9 | 13.8 | 0.3 | −0.4 | 86.2 |
| Panama | 89.9 | 10.0 | 0.7 | 2.0 | 87.4 |
| Brazil | 91.2 | 15.9 | −2.3 | 5.7 | 80.6 |
| United States | 92.5 | 18.0 | 2.0 | −4.3 | 84.3 |
| Slovak Republic | 94.7 | 7.9 | 1.0 | −2.6 | 93.6 |
| New Zealand | 95.0 | 21.2 | 2.2 | −4.7 | 81.2 |
| Singapore | 95.3 | 9.8 | 2.6 | −4.5 | 92.1 |
| Brunei Darussalam | 96.3 | 14.8 | −0.9 | 3.8 | 82.3 |
| Portugal | 97.9 | 5.6 | 1.0 | −1.4 | 94.8 |
| Czech Republic | 99.2 | 3.2 | 0.7 | −1.7 | 97.8 |
| Argentina | 100.1 | 14.0 | 0.5 | −0.9 | 86.4 |
| United Arab Emirates | 100.4 | 9.6 | −4.1 | 7.1 | 87.3 |
| Switzerland | 100.5 | 2.6 | 0.7 | −1.6 | 98.2 |
| Germany | 106.5 | 2.5 | 0.3 | −0.1 | 97.3 |
| France | 107.3 | 2.7 | 1.1 | −2.1 | 98.3 |
| Bulgaria | 107.7 | 9.9 | −1.2 | 2.2 | 89.1 |
| Hungary | 110.3 | 9.3 | 0.9 | −1.8 | 91.7 |
| Luxembourg | 118.4 | 4.6 | −0.0 | 1.0 | 94.5 |
Research Ethics
This study is based on publicly available secondary data and did not require ethical approval.