
Abstract
Why do inequalities in schooling persist, even in relatively egalitarian school systems? This article examines within school sorting as an explanation. We use classroom data on friendship networks in 480 European secondary schools and contrast comprehensive (England, Sweden) and tracked systems (Germany, Netherlands). Our question is to what extent comprehensive systems reduce achievement sorting at the level of (a) schools, (b) classrooms, and (c) friendships. Between-school variance in achievement is lower in comprehensive systems. However, this is counterbalanced by greater sorting within schools, between classrooms, and, especially, in friendship networks. Still, comprehensive schools create more equal environments for two reasons. First, the difference in between school sorting is larger than the difference in within school sorting. Second, within school sorting is less strongly related to social background characteristics. These findings help explain both why comprehensive schools produce more equal outcomes and how substantial inequality can nevertheless persist.
Keywords
The UN Convention on the Rights of the Child states that governments should provide schooling for every child on the basis of equal opportunity (United Nations 1989). To this end, school systems around the world have instituted reforms to create more equal learning environments (Erikson and Jonsson 1996; Furuta 2020; Meyer et al. 1977; Meyer, Ramirez, and Soysal 1992). These include the standardization of curricula and examinations, postponement of tracking between schools, and discouragement of ability grouping within them. At the same time, important gaps in learning persist, even in countries that have gone to considerable lengths to equalize opportunity. This has led many observers to conclude that the bulk of educational inequality must have its roots in the family and the unequal learning environments that students face at home. A key conclusion of the Coleman et al. (1966) report on equality of educational opportunity was that most variance in achievement occurred within schools, not between them, suggesting a limited role for school level factors in the creation of educational inequality.
Yet as countless scholars following Coleman have argued, low variance between schools does not imply that school environments are equal (Alexander 2016; Alexander, Cook, and McDill 1978; Gamoran 1987; Kerckhoff 1976). One reason is that students who attend the same school might still face dramatically different environments within schools. Despite school policies favoring equalization at the macro level, principals or teachers might stream students into different classes based on achievement or demographic characteristics correlated with achievement (Domina et al. 2019; Hallinan 1994b; Oakes 1982; VanderHart 2006). Furthermore, individuals have a powerful tendency to cluster together in social cliques based on similar traits, known in the social network literature as homophily (Flashman 2012; McPherson, Smith-Lovin, and Cook 2001). These countervailing mechanisms suggest there is a limit to what equalizing policies at the system wide level can achieve. Focusing on variance between schools therefore risks obscuring the considerable stratification of learning that occurs within schools.
In this study, we adopt a cross country comparative perspective to understand how education systems structure the peer environments students face within schools. We draw on comprehensive classroom and network data from four European countries: England, Germany, the Netherlands, and Sweden. The selection of countries is strategic to understand the contrast between tracked and comprehensive systems. Notably, these European systems differ in their macro level organization: In tracked systems, students go to entirely different secondary schools based on their performance in elementary school. In comprehensive systems, all students attend the same school, and little or no tracking based on performance or grades takes place on the classroom level (Van de Werfhorst 2019). We focus on the formative period around age 15 because this is where institutional differences are most clearly brought out—with students in some countries (Germany, the Netherlands) having already been put on different tracks and those in others (England, Sweden) still facing the first major branching point in the education system. Our sample consists of 480 schools (952 classrooms), divided equally over the participating countries, and first surveyed in 2010 as part of the Children of Immigrants Longitudinal Study in Four European Countries ([CILS4EU] 2016). In all countries, data on student achievement were collected using standardized instruments, and sociometric data captured students’ friendship networks in class.
Our first aim is to examine the stratification of achievement at three levels: schools, classrooms, and friendships. This allows us to take the classical question that Coleman et al. (1966) studied—Does most variation in achievement occur between schools or within them?—and extend it to variation between classrooms and friendship networks within schools (Duncan, Boisjoly, and Harris 2001). Previous studies have shown that comprehensive schooling reduces variance between schools, yet we do not know whether this holds at the lower levels of social interaction we study. Does comprehensive schooling foster equality between students belonging to different classrooms and peer groups as well? Or does greater sorting at these lower levels offset the benefits of comprehensive schooling? We distinguish between total inequality in achievement and inequality explained by parent socioeconomic status (SES), migration background, and gender. Sorting at various levels can increase inequality in the distribution of achievement, but this will only exacerbate social inequality insofar as it overlaps with background characteristics (Lucas and Berends 2002).
Our analysis yields several important findings about stratification in students’ learning environments. Achievement sorting between classrooms and, especially, between friendship groups adds a powerful hidden layer to inequality. The variation in test scores occurring at these levels is of a similar magnitude to and sometimes greater than that between schools. Moreover, unlike achievement sorting between schools, sorting at the subschool level is larger in comprehensive systems. Thus, the same institutional features that minimize variance between schools are also associated with higher variance between classrooms and friendship groups within schools. In this way, the equalizing effect of comprehensive schooling is more limited than might first appear. However, even taking this hidden stratification into account, comprehensive schools still create more equal environments for two reasons. First, the difference in between school sorting is larger than the difference in within school sorting. Second, within school sorting is less strongly related to social background characteristics. In conclusion, although within school stratification is a powerful countervailing force, it should not lead us to fundamentally rethink the benefits of comprehensive schooling.
Background and Theory
Parents with greater skills and resources are able to invest in their children in various ways, and counteracting this imbalance is a key objective for education policy in many countries. Because education is an important determinant of economic outcomes, inequalities that emerge at this stage will have major repercussions throughout one's life. One key interest of studies in this area is comparative: We want to know whether the stratification of learning is particularly pronounced in certain kinds of societies or school systems over others. Increased availability of data, in particular, large scale international student assessments, has expanded our knowledge dramatically in the past decades (Van de Werfhorst and Mijs 2010).
Among the most consistent of the institutional predictors of achievement inequality is the age at which students are put on different tracks (Bol et al. 2014; Horn 2009; Marks 2006). In some systems, students are sorted into academic and vocational paths as early as age 10 or 11, when knowledge about student ability is still premature and family influence looms large. Research has demonstrated that early tracking policies lead to higher dispersion of achievement (Hanushek and Wößmann 2006; Matthewes 2020) and greater inequality by socioeconomic background (Bol and Van de Werfhorst 2013; Brunello and Checchi 2007; Burger 2016; Parker et al. 2015; Van de Werfhorst 2019). In contrast, comprehensive school systems that expose students to similar school resources and curricula typically achieve more equal outcomes.
Why do comprehensive schools produce more equal outcomes? This simple question masks a plethora of different mechanisms (Domina et al. 2019; Sørensen 1970). Students in comprehensive schools are subject to similar institutional demands in the form of curricula, formal examinations, and informal expectations of teachers and parents. Moreover, they spend the same time in school and are exposed to similar institutional inputs in the form of instruction and school facilities. They also face equivalent options in terms of the rewards, costs, and risks that govern forward looking educational decisions, such as the level of effort expended.
In addition, comprehensive students may benefit from more diverse peer environments—exposing them to a broader range of social norms and educational values as well as access to potentially beneficial social capital (Montt 2016; Mouw 2006; Paloyo 2020; Sacerdote 2011). But as students face different environments within schools, a more mixed student body does not necessarily lead to these opportunities. The immediate classroom context can differ from the wider school composition, and even within classrooms, peer environments emerge from self selection into social interactions (Hallinan and Sørensen 1985; McFarland et al. 2014; Moody 2001). Therefore, it is important to consider to what extent comprehensive schools actually equalize the kind of peers that students associate with. Studying social interactions at the micro level of classrooms through the lens of friendship networks helps us understand whether and how stratification within schools limits the equalizing potential of comprehensive schooling.
We illustrate this point in Figure 1, which shows three simple scenarios where students belong to either of two groups: “low” or “high” achievers. In Figure 1a, students are perfectly segregated across schools and hence experience little interaction with different types of students. In Figure 1b, schools are integrated, but different types of students are sorted into different classrooms and experience very different environments. In Figure 1c, schools and classes are both integrated, but students self select into friendships with similar others. The outcome in all three cases is similar, but the mechanisms leading there are different. Only by considering the downstream implications of tracking for social network formation can we learn whether policies to create equal learning environments affect the actual peer environments that students face.
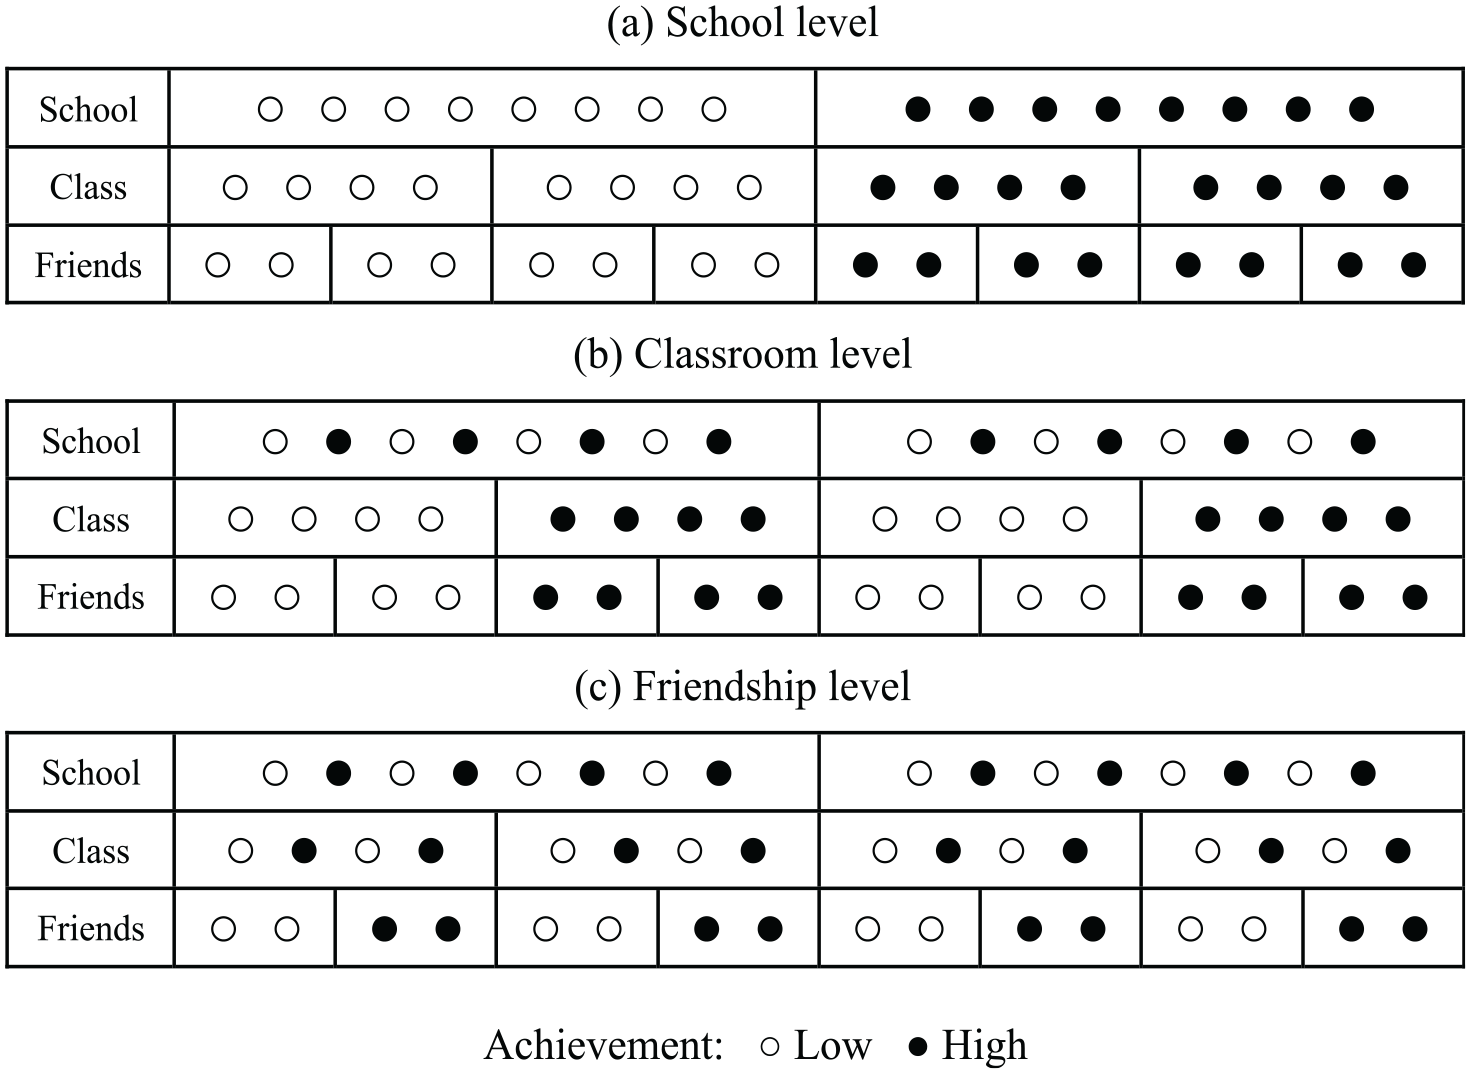
Illustration of achievement sorting at different levels: (a) school level, (b) classroom level, and (c) friendship level.
Between-School and Within-School Tracking
Research from the United States finds considerable segregation between classrooms within schools in terms of both student demographics and achievement (Conger 2005; Domina et al. 2019; Kalogrides and Loeb 2013). This could be relevant in the countries we study as well. In Britain, curriculum differentiation occurs largely through streaming of students across courses, such as academic A-Levels or “hard” GCSEs (McMullin and Kulic 2016). In such cases, principals and teachers may separate courses by classroom (OECD 2013). Advantaged parents may also lobby to keep their children from classmates who are perceived as a bad influence (Ferrer-Esteban 2016). But between classroom stratification could also occur for ostensibly unrelated reasons, for example, if students are grouped by residence to aid logistics or social cohesion. Given that residence is segregated by achievement (Schachner and Sampson 2020), such policies would increase between classroom dispersion as well.
We expect that within school stratification may become more important in comprehensive systems. If it serves schools’ functional needs to keep classrooms homogeneous, a greater heterogeneity at the school level may be counterbalanced by efforts to differentiate within schools (Dupriez, Dumay, and Vause 2008; Oakes and Guiton 1995). A similar logic applies to parents’ preferences. The “effectively maintained inequality” thesis (Lucas 2001) holds that when education is made more universal, privileged parents will turn to other means, such as choosing more prestigious or demanding courses, to ensure their children get ahead (Triventi et al. 2019). However, some previous research also finds that within school tracking is less sociodemographically stratified than tracking between schools (Chmielewski 2014; Gamoran and Mare 1989). This would imply that even if both between- and within school tracking reinforce achievement differences, the latter will be less consequential for social inequalities.
Social Structure and Network Formation
The stratification of learning experiences does not stop at the classroom door. Perhaps the most salient social influence is the company students keep in class: who they choose to become friends with or who chooses them. One of the most well documented drivers of friendship selection is homophily, the tendency for similar people to befriend each other (McPherson et al. 2001). Research on networks in education has documented a tendency for homophily with respect to achievement (Flashman 2012), aspirations (Raabe and Wölfer 2018), and motivation (Gremmen et al. 2018), giving rise to friendship clusters that are relatively homogeneous in these dimensions. If this is the case, friendship groups may display a narrower range of achievement than would be expected based on school or classroom composition alone.
Again, we expect that within school stratification, in this case, between friendship networks, may be more important in a comprehensive school setting. Research on ethnically diverse school classes shows that although diverse settings provide the opportunity for interethnic friendships, they simultaneously increase the preference for same ethnic friends, leading to fewer interethnic friendships than is structurally possible (Baerveldt et al. 2007; Smith et al. 2016; Wimmer and Lewis 2010). A similar dynamic could occur based on achievement, whereby students are more likely to group with similarly performing peers if the dispersion of achievement in a classroom is large. This could also arise from greater homophily on characteristics correlated with achievement, such as social or ethnic background, residential neighborhood, shared spare time activities, or similar interest in schoolwork.
Data And Methods
Data and Institutional Setting
We draw on rich, representative classroom and friendship network data across four European countries. These data come from the CILS4EU (2016), first collected by classroom questionnaires in the 2010–2011 school year. In the current study, we use information from the first wave, when students were around age 15. All countries collected comparable measures of cognitive and language achievement by standardized test batteries and sociometric data featuring classroom networks of self reported friends. Despite its name, the CILS4EU (2016) is a large scale (N = 18,716), population representative survey; it features a slight oversample of classrooms in ethnically diverse schools. The survey uses a three stage sampling design in which schools are the first sampled unit. Within schools, a number of classes (usually two) were sampled, and all students in each class were asked to participate in the survey.
The countries were deliberately chosen to represent different types of school systems: England and Sweden both operate comprehensive systems where students attend the same track until their midteens (Jackson, Jonsson, and Rudolphi 2012); Germany and the Netherlands, in contrast, have systems with early differentiation (from around age 10–11) and separate academic and vocational tracks (Buchmann and Park 2009; Jacob and Tieben 2009). While England's and Sweden's systems are nominally comprehensive, both countries have a liberal voucher system, and England has greater ability based streaming within schools and greater differences in funding between schools (OECD 2013). In all countries, residential segregation and the exercise of school choice contribute to considerable differentiation between schools (Benito, Alegre, and Gonzàlez-Balletbò 2014; Kruse and Kalter 2018).
Student Achievement
Achievement inequalities between students in different schools, classrooms, and friendship groups can have at least two sources. On the one hand, these contexts sort by prior achievement. On the other hand, shared peers and wider influences (e.g., material resources, school culture, teachers) will make students more similar and reinforce achievement differences by context over time (Eccles and Roeser 2011; Hallinan 1994a; Kerckhoff 1986). In this article, our main interest is to understand the first, sorting aspect. Ideally, we would have data on achievement before students enter school; unfortunately, no cross nationally comparative data set contains this information. Instead, we have to rely on achievement data that are collected simultaneously with the contextual information. To limit the social influence on measured achievement, we rely on test scores that are independent of the taught curriculum.
Our main instrument is a standardized test of cognitive skill that was administered in the first survey wave (N = 18,011). The test was designed to measure fluid intelligence and is similar in design to Raven's Progressive Matrices (Weiß, Bernhard, and Dt 2006). Focusing on visual puzzles, it aims to avoid cultural and linguistic bias. Although the test is intended to measure a student's ability, we prefer the word “achievement,” recognizing that no test can perfectly separate innate ability from social influences. The test comprised 27 items to be completed in seven minutes; the final score equals the number of correct answers. Equivalence tests between test Parts 1 and 2 and the retest reliability (after two and five months) are consistently high (>0.80) or very high (>0.90). Internal consistency is high for parts of the test (0.86–0.96). The construct and criterion validity of the test are supported by high correlations with grades in several random samples (Gruber and Tausch 2016).
In addition, we use a similar test of vocabulary that was administered at the same time (N = 18,167) in which students were asked to select antonyms based on multiple choice. The cognitive test has been extensively validated for comparability across cultural contexts, and therefore its distribution looks largely similar in the four countries (see Figure A1a in the online supplement). The language test differs in its sensitivity and thereby also in its distribution (see Figure A1b in the online supplement). To make the scale of the tests comparable, we transform both to percentile ranks within each national distribution (Figure A2 in the online supplement). This is also a convenient way to address the arbitrariness of scale: Test scores are, strictly speaking, ordinal information, and the rank transform treats them as such (Jacob and Rothstein 2016). We perform all analyses separately for cognitive and language tests, but to economize on space, we combine them into an average score (N = 18,180) for most results in the main text; the distribution of composite test scores is shown in Figure A3 in the online supplement.
Student Background
We also want to understand to what extent stratification on achievement overlaps with students’ sociodemographic characteristics—parental SES, migration background, and gender. To measure parental SES, we use information about both parents’ occupation, which was collected from students in the classroom interview and through follow up surveys with parents. Open-ended answers were coded to the 2008 International Standard Classification of Occupations, which lets us assign Socio-Economic Index scores (Ganzeboom and Treiman 1996). We take the average across all nonmissing values from up to four sources: the child's report about mother's and father's occupation and the responding parent's report about their own occupation and that of a partner. We use data on occupation because research shows this information is reported with similar reliability by parents and children (Engzell and Jonsson 2015). We use data on both parents because both independently predict children's outcomes (Thaning and Hällsten 2020).
Migration background is based on parents’ country of birth. The same information was provided by the child and a parent, and we assign priority to the parent's information if available. We group countries according to seven major regions: Northern Europe plus North America, Australia, and New Zealand; Southern Europe including the Balkans; Eastern Europe and other former Soviet republics; Middle East and North Africa; other African countries; other Asian countries; and Latin America and the Caribbean. If one or both parents were born in the host country, we treat the student as belonging to the majority. If both parents were born abroad, we assign the country group culturally closest to the host country if such a judgment is possible or else the mother's country of birth. We treat Northern Europe and the Anglosphere as closer than Southern Europe and Southern Europe as closer than Eastern Europe. All other regions we treat as equidistant. Less than 5 percent of students have foreign born parents hailing from different regions, so this particular coding affects a small part of the sample.
The third background variable we use is gender, and here data come from student self reports. We use data on parental SES, migration background, and gender in two different ways. First, we inspect the proportion of variance in test scores accounted for by background characteristics. For these analyses, we use 10 SES deciles and eight origin groups, including the majority. To avoid losing cases to missing data, we include missing or “other” answers on these questions as a separate category. The amount of missing or “other” answers ranges from 0.07 percent for gender to 6 percent for parental SES (see Table A2 in the online supplement). We then include full three way interactions between parental SES, migration background, and gender and tabulate the variance explained (R2). Second, we plot bivariate distributions of peer achievement separately by parental SES, migration background, and gender. Here we exclude missing or “other” answers. To avoid overplotting, we collapse parent SES to quintiles and reduce the number of ethnic groups to five by combining European and Anglophone countries into one group and Africa, the Caribbean, and Latin America into another.
Variance Decomposition Approach
The logic of our analysis follows the variance decomposition approach applied by Coleman et al. (1966), but we add two separate layers of stratification by nesting classrooms and friendship networks as lower levels within schools. Intuitively, if achievement is heavily stratified by schools, a larger proportion of variance in achievement is going to occur between schools rather than within them. Similarly, if there are large differences between classrooms within schools or between friendship groups within classrooms, we are going to find a large proportion of variance at these levels.
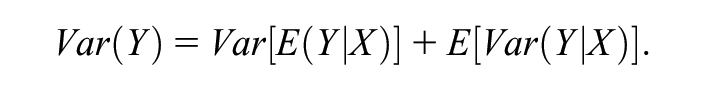
Formally, our decomposition approach rests on the law of total variance, which states that the variance in a random variable Y can be separated into that of a conditional mean (in our case, a set of group level means) and the variance of Y conditional on that mean:
The same procedure can be reiterated across more than one level, which in our context yields:
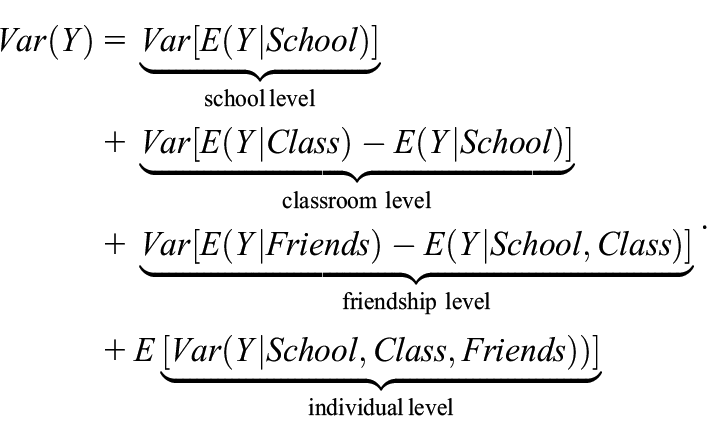
This model can be written more parsimoniously as

where α s , μ cs , and γ jcs are random intercepts at the school, classroom, and friendship levels, respectively, and ϵ ijcs is an individual error term. Our key interest is in the variance—or equivalently, the intraclass correlation—of each term.
After having achieved the multilevel partitioning in Equation 3, we estimate the proportion of unique variance at each level explained by student background characteristics, that is, parental SES (occupational status deciles), migration background (eight country groups), and gender (two categories). To this end, we retrieve the predicted random intercepts (i.e., the group level achievement means from the decomposition explained previously) along with the residual, individual component. We then use the predicted means at each level as outcomes in a set of regression analyses with student background indicators as explanatory variables. These regression analyses can be written as follows:

where
This analysis lets us say to what extent achievement sorting at each level overlaps with sociodemographic characteristics and thus is likely to enforce existing background inequalities. We estimate Equations 3 and 4 separately for each country and separately for cognitive and language achievement. We estimate the components of Equation 3 using dedicated multilevel software (StataCorp 2019). Equation 4 is estimated using ordinary least squares on the predicted means from the decomposition step.
Friendship Clusters from Social Networks
The variance decomposition presupposes that groups on the same level are mutually exclusive and that each level is nested within the next. This is applicable to classrooms in our data: Each class belongs only to one school, and classes are stable units such that students do not belong to more than one. However, this is not the case for students’ friendship networks. To measure the immediate peer environment, we use data on the friendship network in each classroom. Networks are based on the survey question, “Who are your best friends in class?” Respondents could name up to five classmates. We use the sociometric data from Wave 1, which results in 952 friendship networks, one within each class.
The challenge we face is to identify smaller groups of students that can meaningfully be said to belong to the same friendship group. There are several ways to address this problem, but we rely on community detection through a network clustering algorithm called Infomap (Rosvall, Axelsson, and Bergstrom 2009; Rosvall and Bergstrom 2007). This algorithm finds communities by using random walks to analyze potential information flows through a network structure and minimizing a cost function. Communities are defined based on the rationale that a random walker spends more time within a community than moving between communities (Peel 2010). Prior work shows that Infomap works well for networks of the same size range as the networks in the CILS4EU (2016) data (Yang, Algesheimer, and Tessone 2016). For our analysis, we view each cluster (i.e., each friendship group) as the immediate peer environment an individual is embedded in (Raabe and Wölfer 2018).
Figure 2 shows example networks in four classrooms, with different colors denoting the clusters identified. To ensure the quality and consistency of our network information, we screened the sample by size (excluding classes smaller than 10), density (excluding classes that had a density lower or higher than 2 SD from the mean), and missing network data (excluding classes where over 15 percent of students did not answer the sociometric questionnaire). Differences in the network descriptives were minute; we included all available groups in our main analyses. These comparisons can be found in Section 8 of the online supplement. To ensure that our results are not sensitive to the treatment of networks, we also present supplementary analyses with alternative ways to partition the networks: a modularity clustering algorithm described by Brandes et al. (2008) and an ego net approach that does not rely on clustering, described by Tranmer, Steel, and Browne (2014). These analyses appear in the “Robustness Checks” section.
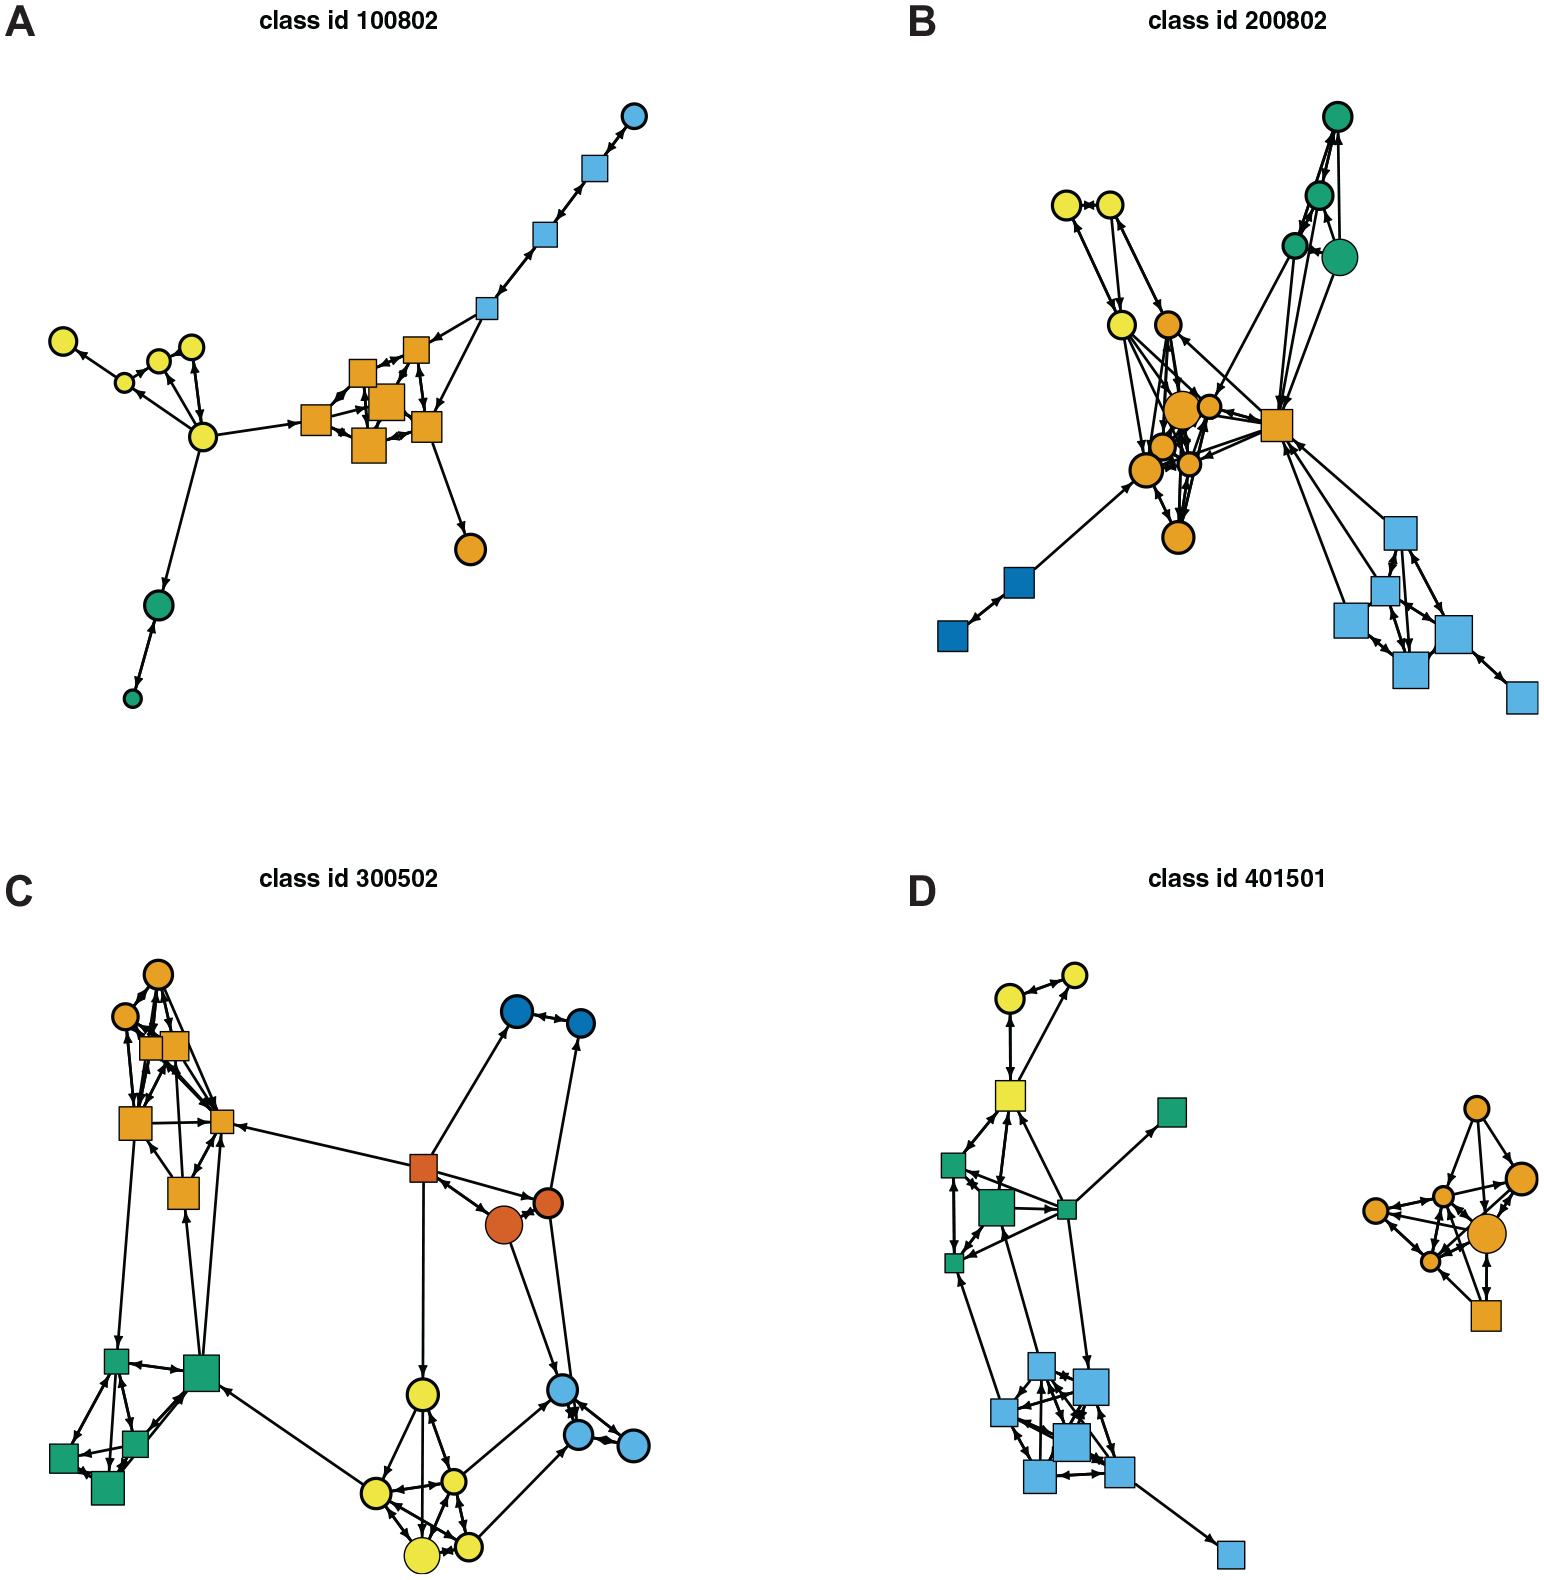
Four classrooms with peer group clusters.
Results
Student Sorting between and within Schools
Our first question is how the variance in achievement at each level depends on the tracking regime in our four countries. Figure 3a shows results for the decomposition using cognitive test scores. Each segment of the bars represents the proportion of variance that occurs at one level: schools (α s ), classrooms (μ cs ), friendship groups (γ jcs ), and individual students ϵ ijcs ). A higher variance at a given level means that there is greater stratification among the units at this level. High school level variance, for example, implies that schools differ in their average level of achievement.
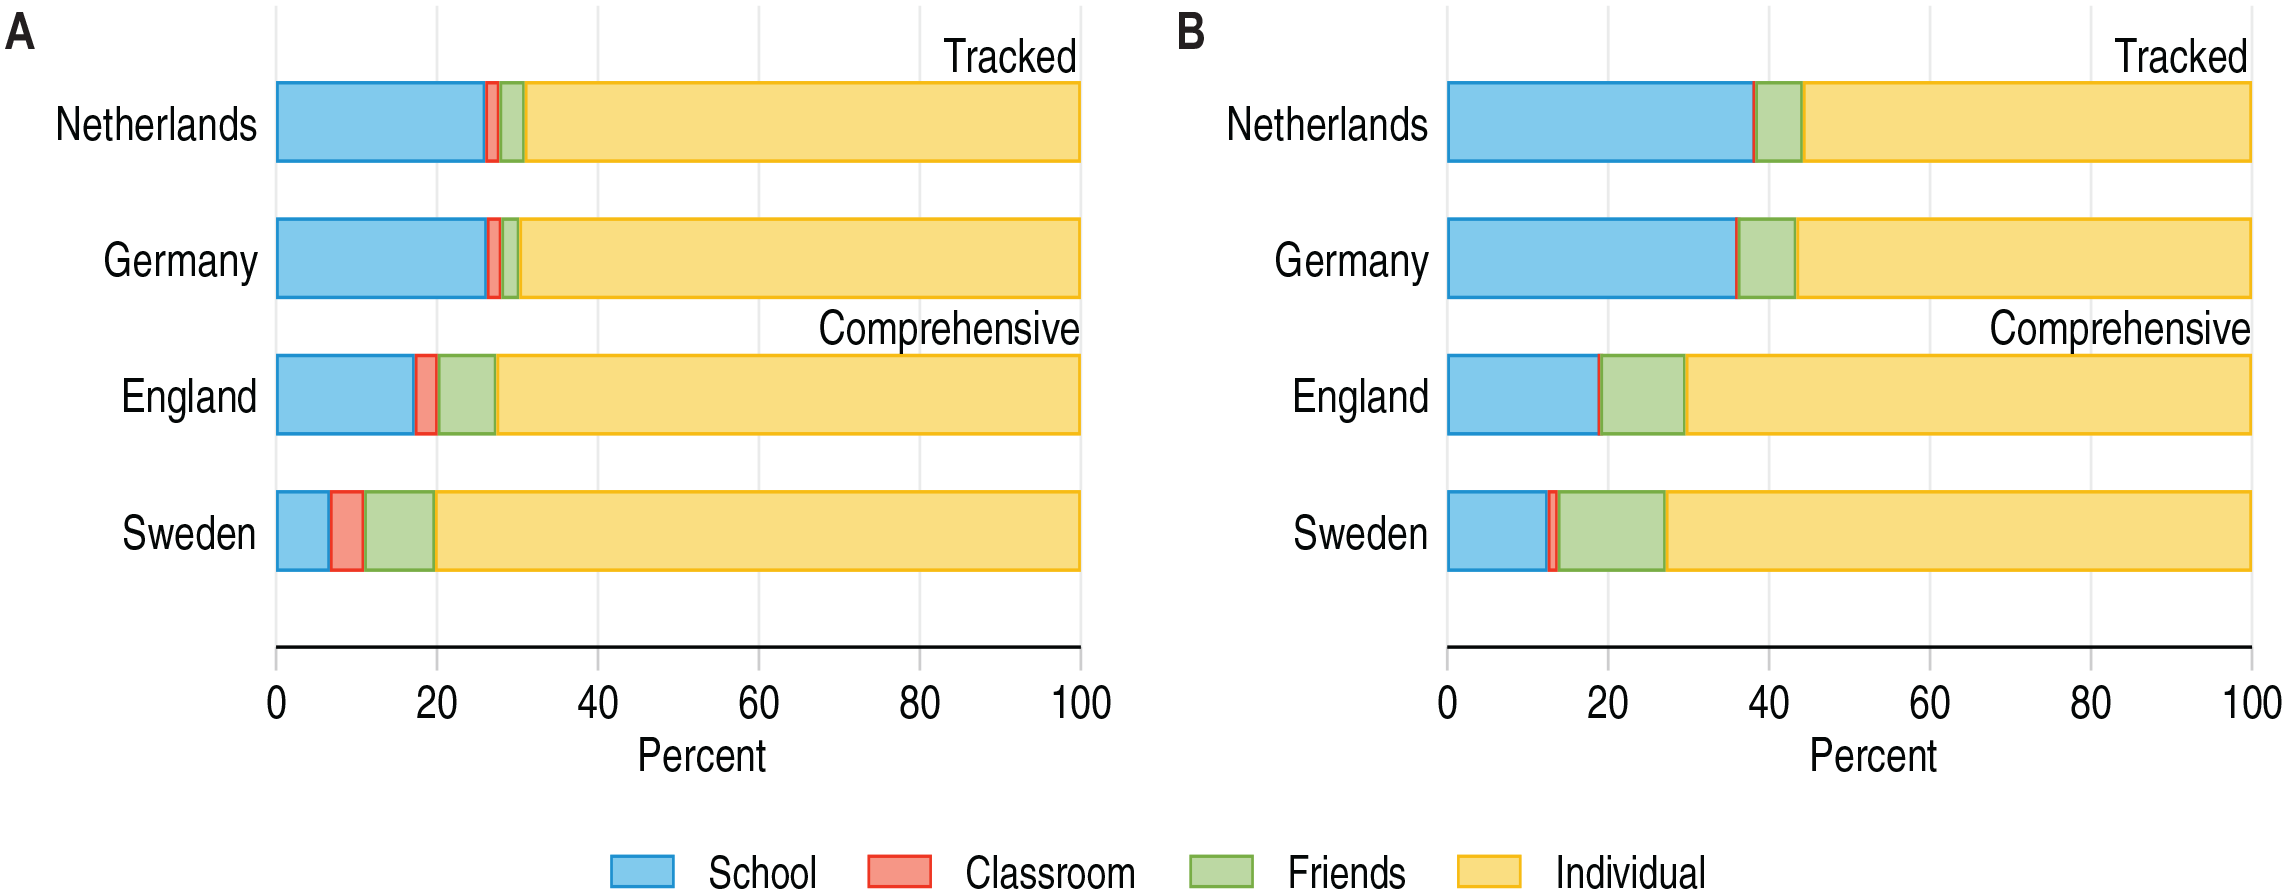
Variance decomposition of student achievement at various levels: (a) cognitive test scores and (b) language test scores.
As Figure 3a shows, there is a clear division between early tracking systems, represented by Germany and the Netherlands, and the comprehensive systems of England and Sweden. In the former, 26 percent of variance in cognitive test scores occurs between schools, whereas in the latter,that figure is between 7 percent and 17 percent. This finding aligns with earlier literature on tracking and inequality in student achievement: Separating students by ability creates schools that vary widely in their level of achievement.
Our main interest is whether the greater school level equality in comprehensive systems transfers to groups within schools. Figure 3a shows this is not unambiguously so: Stratification at the classroom and especially friendship levels is larger in the comprehensive systems in our sample both in absolute terms and relative to the school level variance. In Sweden, accounting for within school stratification more than doubles the inequality in learning environments: The classroom and friendship variances combined outsize the variance between schools. However, these differences are not large enough to completely outweigh the equalizing power of comprehensive schooling, which remains sizeable.
Figure 3b shows results using language test scores as the outcome. Although the pattern is similar, there are nuances: Between-school variance is markedly larger than for cognitive test scores (36--38 percent in tracked and 13--19 percent in comprehensive systems). In all countries, between classroom variance is smaller (or nonexistent) for language compared to cognitive test scores. One possible explanation for this is that an important driver of variation in language proficiency is migration background, and principals may strive to allocate immigrant students equally among classrooms (Ammermueller and Pischke 2009). Cognitive ability is less closely related to observables, and efforts to equalize environments across classrooms may therefore be only partly successful.
Overall, however, the main pattern is the same across cognitive and language test scores: Within-school stratification is larger in comprehensive systems but not large enough to undo the equalizing function of comprehensive schooling. Figure 4 illustrates what this means for the peer environments students face throughout the distribution of students’ own achievement. Here we use the average of both cognitive and language test scores, and we calculate peer variables as leave one out means—that is, not including the focal individual in the mean calculation. Including the individual's own contribution to group level means would spuriously induce a stronger correlation at the friendship level because these groups are smaller and hence every individual makes a larger contribution to the mean. Leaving the focal individual out avoids this mechanical relationship.
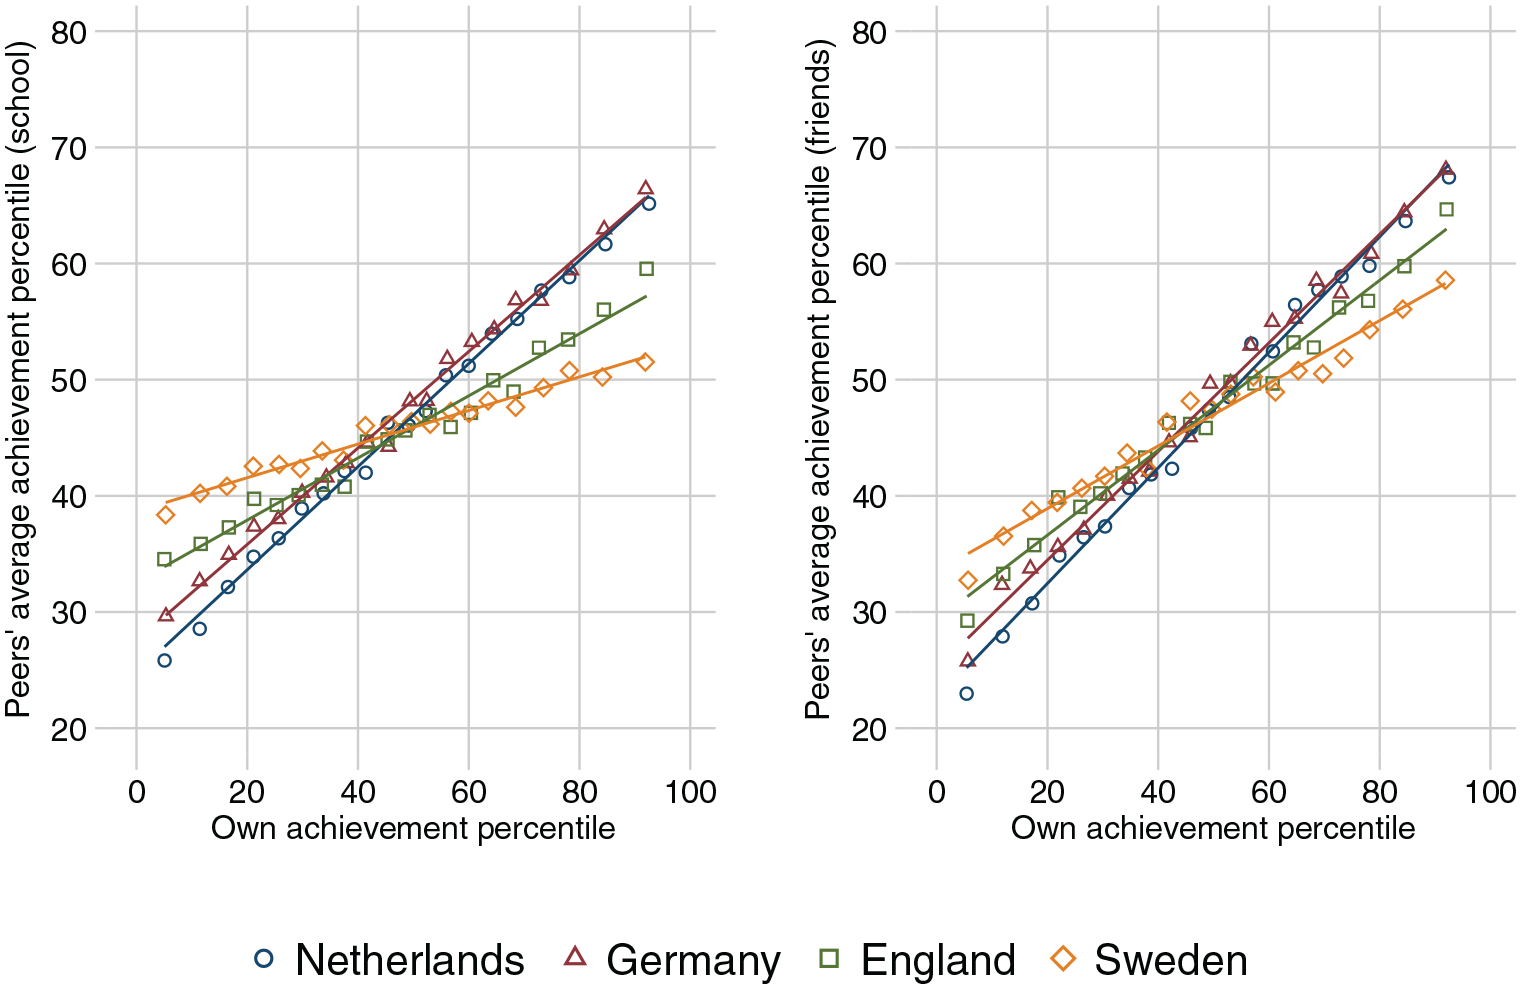
Peers’ average achievement by own achievement.
Figure 4, left panel, presents a binned scatterplot showing the expected achievement of schoolmates at different levels of students’ own achievement. Figure 4, right panel, does the same for friends’ achievement by students’ own achievement. Lines show the ordinary least squares fit; the markers show conditional means without imposing a functional form. The fact that markers and lines overlap indicates that the associations are largely linear. Regression slopes range from 0.44 in the Netherlands to 0.14 in Sweden for schoolmates and 0.50 in the Netherlands to 0.27 in Sweden for friends (see Table A3 in the online supplement). These country differences are statistically significant (see Table A4 in the online supplement). The country differences for friends’ achievement are less marked because some of the equalizing effect of comprehensive systems is counterbalanced by sorting into friendships. Still, the slope is flatter in England and, especially, Sweden, indicating that friendships in comprehensive school systems are more diverse in terms of achievement.
Relation to Social Background Inequalities
Next, we ask how stratification at each level overlaps with student demographics: parental SES, migration background, and gender. Achievement sorting is arguably of greater concern if it interlocks with and reinforces inequalities along these dimensions. We retrieve the random intercepts from our aforementioned variance decomposition and use them as outcomes in a regression with individual student characteristics as predictors. In other words, we ask what proportion of the variance in achievement at each level is explained by these background characteristics. We combine parental SES, migration background, and gender for our main results, and we include full interactions between the three.
Table 1 shows the results separately by test, country, and level of variance. In all countries, achievement stratification at the school level is more tightly interlinked with student background characteristics. The three characteristics explain between 18 percent and 26 percent of between school variance in cognitive achievement and 21 percent to 32 percent of between school variance in language achievement. At the lower levels of classrooms and friendship networks, the explanatory power of background characteristics is considerably weaker and at no point more than half that of the school level. Variance explained in individual deviations from the peer group is similarly modest, between 4 percent and 9 percent for cognitive test scores and 8 percent and 12 percent for language test scores.
Variance Explained by Student Background Characteristics.
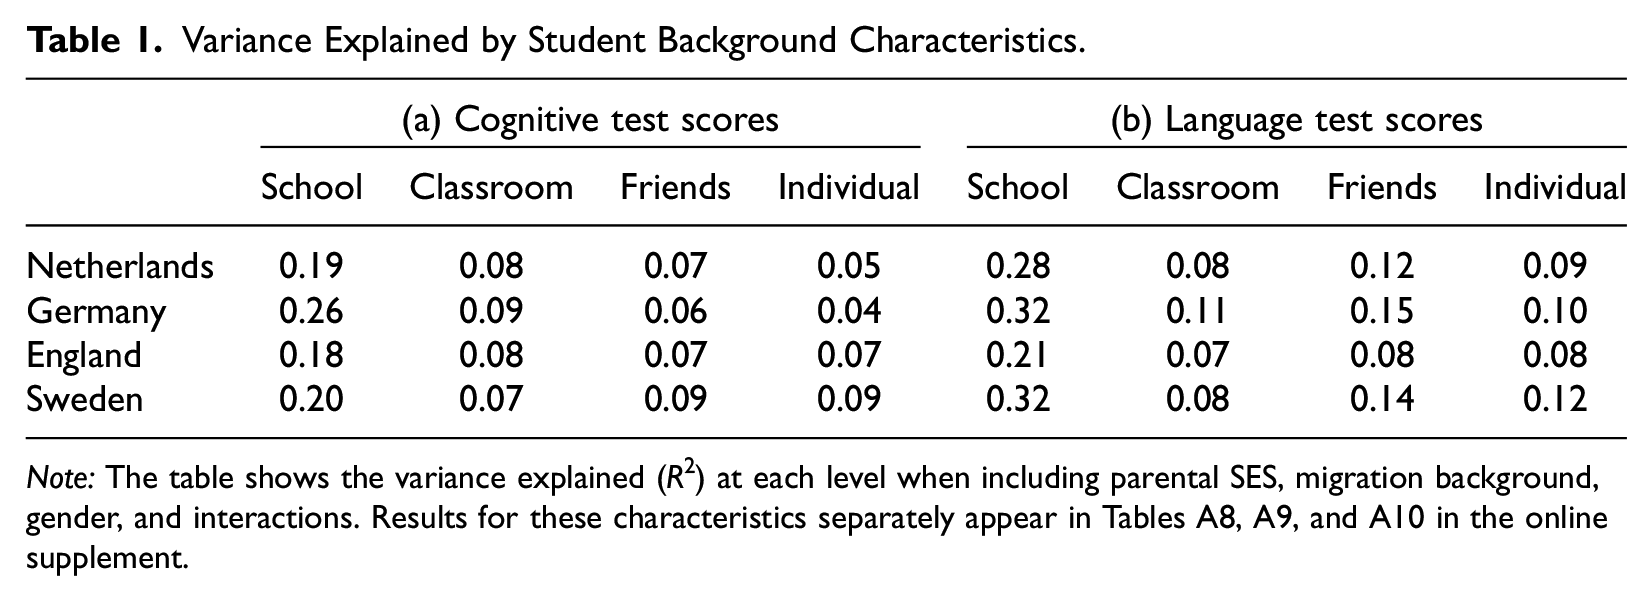
Note: The table shows the variance explained (R2) at each level when including parental SES, migration background, gender, and interactions. Results for these characteristics separately appear in Tables A8, A9, and A10 in the online supplement.
In Section 6 of the online supplement, we present separate results for each background characteristic. Doing so reveals that between school stratification is more strongly patterned by both parental SES and migration background than within school stratification. This finding holds in all four countries. By contrast, gender is largely inconsequential for achievement stratification at all levels except for friendship level stratification in language achievement.
Taken together, our findings suggest that within school sorting, even if it is greater in comprehensive systems, may not contribute to social background inequalities to the same extent as does between school sorting, where the overlap between background characteristics and achievement is larger. To test this, we plot the average achievement of peers in schools and friendship networks by parental SES and migration background across the four countries.
Figure 5, left panel, shows the expected achievement percentile of schoolmates by quintiles of parental SES. Again, we see more differentiation in the tracked systems of the Netherlands and Germany. Students in the bottom quintile of parental SES have schoolmates who, on average, score below the 40th percentile, whereas those in England and Sweden score around 40 or above. Differences are even more marked in the top: Students in the highest SES quintile have schoolmates who average about 55 to 60 percentile scores in early tracking countries but around 50 in comprehensive school settings. Turning to average achievement among friends (Figure 5, right panel), the contrast between countries is largely undiminished. The differences between tracked and comprehensive systems are for the most part highly statistically significant (see Table A5 in the online supplement).
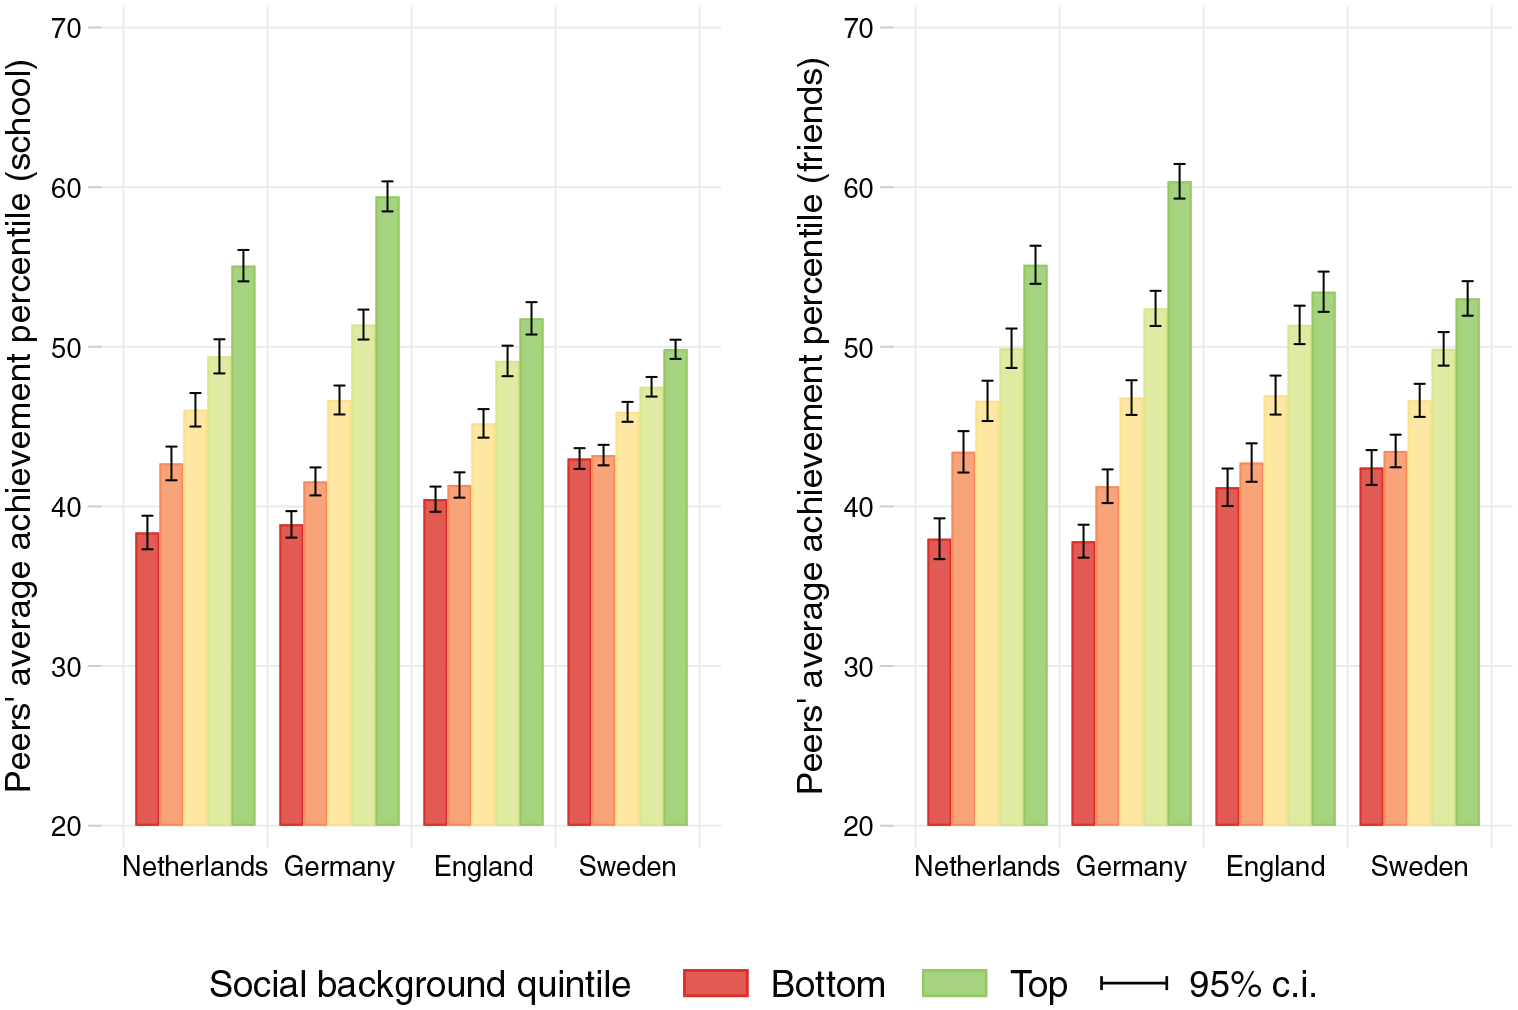
Peers’ average achievement by parental SES.
Figure 6 repeats this exercise for migration background, and in contrast to parental SES, here it seems like sorting, both between and within schools, contributes more uniformly to inequality across the four countries. The Netherlands displays greater dispersion of peers’ achievement across immigrant groups, but the dispersion is broadly similar across the remaining three countries: Germany, England, and Sweden. Figure 7 shows there are no marked differences by gender in any of the countries. Tables A6 and A7 in the online supplement confirm the absence of significant country differences for migration background and gender. In summary, when classroom and friendship sorting are taken into account, comprehensive systems remain more successful at exposing students from disadvantaged socioeconomic backgrounds to peers of a wide range of achievement, but not necessarily so for minority students. Gender is not a relevant axis of inequality in exposure to peer achievement in any of our countries.
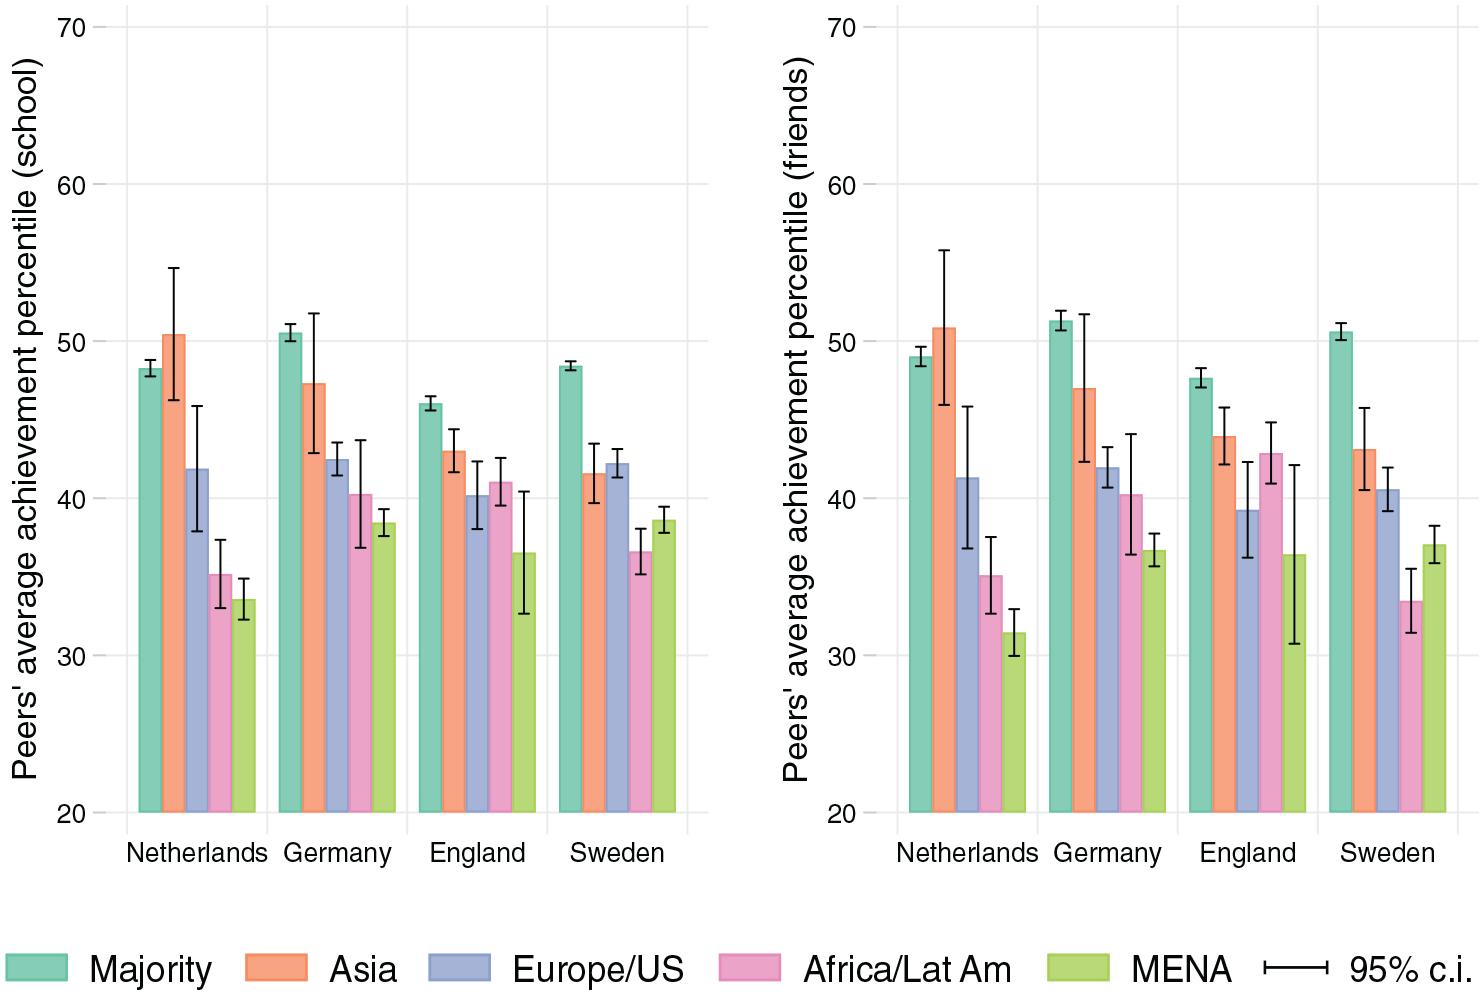
Peers’ average achievement by own migration background.
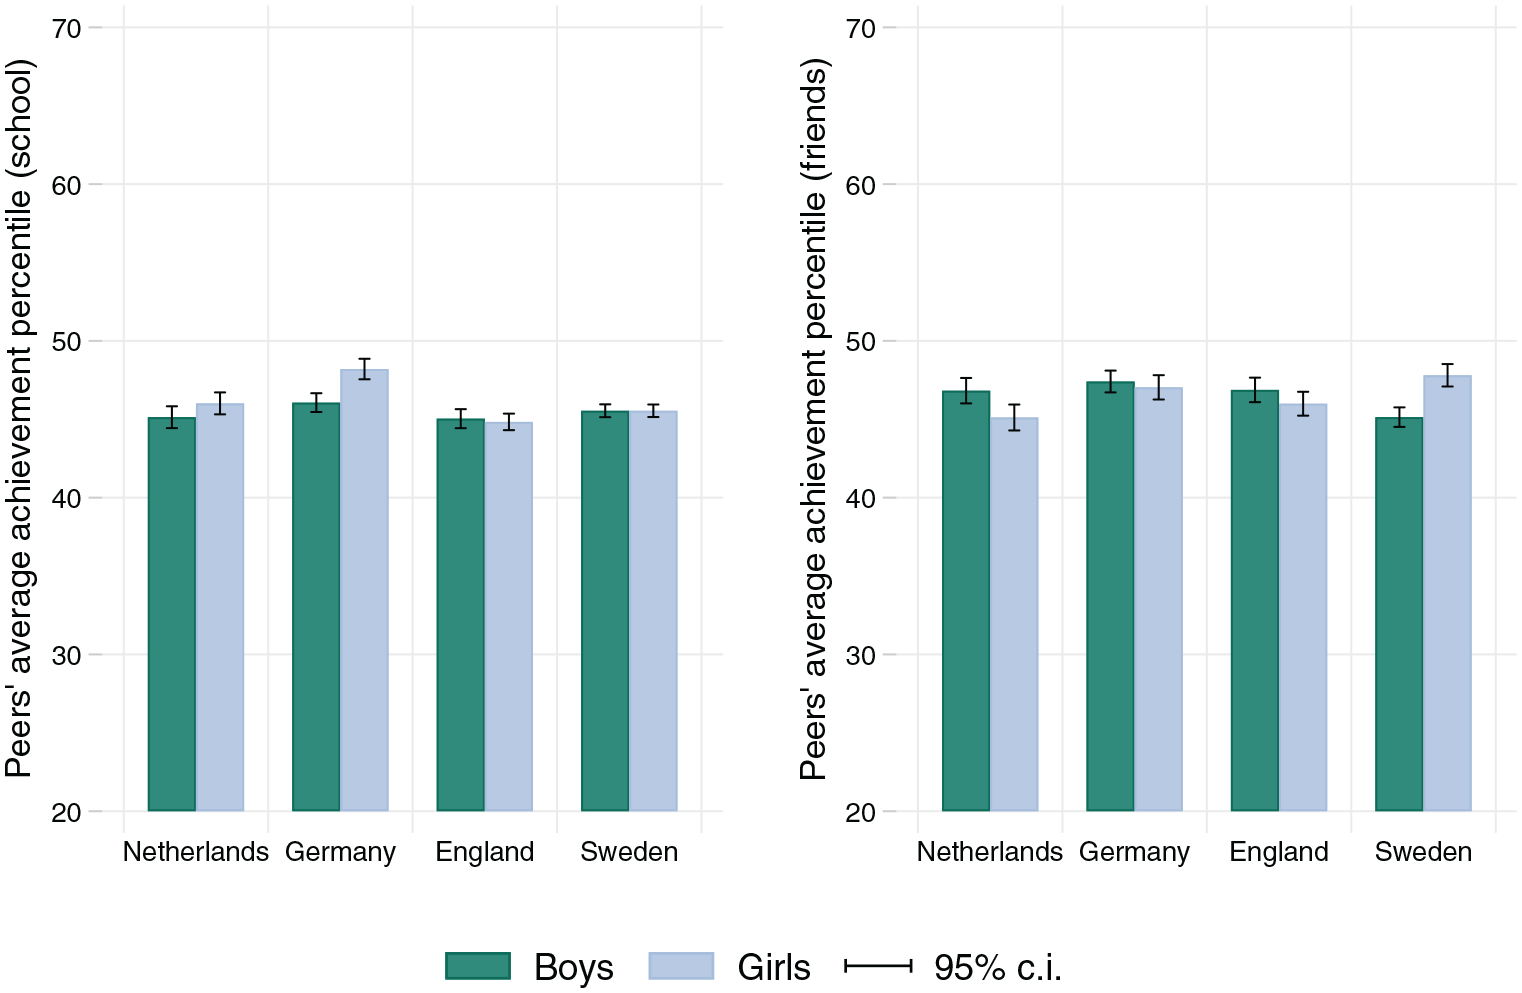
Peers’ average achievement by own gender.
Robustness Checks
We run several additional specifications and robustness checks. In our main analysis, we transform achievement to percentile ranks. In Figure A12 in the online supplement, we instead perform our decomposition on the raw scores, defined as the number of correct answers. It is not surprising that these results are similar: The rank transformation should be of minor consequence with any variable that is approximately normal (Engzell and Mood forthcoming).
To ensure that our results do not depend on the particular strategy used to determine communities in networks, we implement an alternative clustering method. Here, we use the modularity clustering algorithm of Brandes et al. (2008), which calculates the optimal community structure of a graph to maximize modularity over all possible partitions. Modularity is a measure of the density of connections within a community and is widely accepted as a quality criterion for clustering (Brandes et al. 2008). This algorithm guarantees maximum modularity and works well for small networks like those in our data. A broad class of algorithms aims to maximize the same modularity criterion; hence, our algorithm is a strategy that subsumes a palette of others. Most alternative algorithms are weaker approximations designed to work on large networks. Our variance decomposition with modularity clustering appears in Figure A13 in the online supplement; it shows no meaningful differences from our main results.
Both clustering algorithms we use assume that students belong to exactly one friendship group, yet in reality, groups overlap. Therefore, we also apply a multiple membership multiple-classification (MMMC) model that allows for overlapping groups. MMMC treats a student's ego-net—all outgoing friendship nominations by a student—as their immediate peer group. Tranmer et al. (2014) applied this method to AddHealth data from the United States. We implement this approach using the dedicated multilevel software MLwiN, which estimates the variance components via a Markov chain Monte Carlo approach (Rasbash et al. 2016). The results appear in Figure A14 in the online supplement; they are again similar, with some nuances. The results for language test scores closely resemble those in our main analyses. The results for cognitive test scores show greater similarity across countries, and here it appears that friendship level stratification brings England and Sweden up to a similar level of between group variance as that found in the Netherlands (but not in Germany). Nevertheless, the qualitative conclusions are similar.
Limitations
Our study is not free of limitations. First, we used standardized tests in cognitive and language achievement. The reliability of these tests is high, but achievement is a multifaceted concept encompassing many aspects that we are not able to measure. It would be valuable to complement our analysis with data on aspirations, behaviors, or “soft skills” (Tach and Farkas 2006). Arguably, such skills are more salient as a source of peer influence given that behaviors tend to be highly malleable. CILS4EU.000000 contains data on self reported grades, a more encompassing measure of achievement. However, we refrained from using them here for several reasons. First, our use of curriculum independent test scores is more in line with our purpose to study sorting as opposed to contextual effects. Second, grades are only reported in three core subjects and have a limited range, which limits the variation. Third and most importantly, grades are incomparable across school tracks.
Our empirical strategy assumes classrooms are constant and friendship networks are nested within classrooms. This is more reasonable to assume in a European context than in the United States, where schools often allocate the same student across several different classrooms depending on subject (Chmielewski, Dumont, and Trautwein 2013; Lucas 1999). Moreover, the fact that we only have a sample of classrooms within a school implies we may underestimate variance at the classroom level. The extent of this problem is likely to be limited, however. Swedish population data suggest that in 2010, the year of our data collection, 60 percent of schools had no more than an average of two classrooms per cohort, and 88 percent had no more than four (SKL 2018:10). The overall average number of classrooms per cohort is three. Because the number of participating classes per school is similar across the four countries, this is unlikely to account for any country differences we find. In fact, the lowest number of classes per school is found in England and the highest in the Netherlands (CILS4EU 2016:22), so any bias is likely to run counter to our main finding of higher within school stratification in comprehensive systems. A related concern is that we do not consider potential subject specific ability grouping within classrooms (Rudolphi and Erikson 2016).
Two further limitations are missing data and measurement error. We minimized missing data by using the first CILS4EU wave, where participation was uniformly high, and by complementing student reports with data from parents. Likewise, we limited our analyses to variables that are known to have high reliability even when reported by child respondents. Random measurement error in achievement will enter into the individual component and lead us to underestimate group level variance. Random measurement error in background variables will lead to attenuation bias and underestimation of the variance explained by these factors. There is little reason to assume that these biases differ across countries, so the country comparison should still stand. Although our network data use sociometric measurements that are considered state of the art, missing data and measurement error are a concern here, too. Missing network data is more severe in England than in other countries, which means the results for England must be taken with some caution. Yet the fact that our comparison of comprehensive and tracked systems holds up across two examples of each type of system inspires confidence in the results.
While our data set comprises a representative, random sample, the stratified sampling design means the results mainly generalize to schools with some ethnic diversity. Such schools are more likely to be found in urban centers than in rural regions, which is another limit to representativeness. A final limitation is our use of cross sectional data to study sorting, where ideally one would have measures of achievement prior to school entry. This means our decomposition does not provide a clean picture of sorting, but one that also subsumes peer influences and contextual effects to an unknown extent. To limit this concern, we use curriculum independent test scores, but work with longitudinal data will be better able to disentangle sorting from peer and contextual effects.
Conclusions
In this study, we brought a comparative approach to the study of achievement sorting in secondary schools across four European countries, representing a mix of tracked (Germany, Netherlands) and comprehensive systems (England, Sweden). We drew on two strands of tracking literature that remain largely segmented: a macro level literature focusing on different national educational systems and a micro level one that has mostly focused on variation within the U.S. context. Few studies have attempted to integrate these contexts and understand how macro level conditions of different national systems shape social realities for children in the classroom. We take a step in this direction by drawing on large scale comparative survey data coupled with micro level information on students’ friendship networks.
Existing literature on country differences shows that early tracking exacerbates inequalities between students in different schools. One possible mechanism is the channeling of students to schools with different social capital and peer cultures. In fact, equalizing peer environments is often an explicit goal of detracking policies. To assess whether such policies work, however, we need to study stratification within schools and not just between them. The effective peer environment a student faces depends on the wider school climate, but also potential within school tracking and selection into friendship groups. Stratification of learning within schools means students who attend the same school or classroom can be exposed to vastly different social environments. To understand schools’ role in ameliorating inequality, we must consider the patterns of social interaction that they promote.
We tested the hypothesis that comprehensive systems, which create more similarity of achievement between schools, may have the unintended consequence of increasing stratification within schools. In particular, we hypothesized that the greater diversity in comprehensive systems creates more opportunities for sorting at the classroom and friendship levels. This would undo some of the potential benefits of comprehensive schooling. At the classroom level, there is some, albeit limited, support for this hypothesis: There is slightly more between classroom variation in the comprehensive school systems of England and Sweden. Yet achievement sorting across classrooms accounts for a small share of total variation, and it is nearly absent in language test scores. The absence of a strong between classroom component suggests principals in all four countries aim to equalize achievement across classrooms.
By contrast, friendship formation is a more potent stratifying factor and is clearly greater in countries with comprehensive schooling. Thus, despite the best efforts to equalize achievement between schools and classrooms, homophily in friendship formation acts as a disequalizing force that counterweights those efforts. In an egalitarian school system like the Swedish one, the stratification of achievement between school classes and social networks together accounts for more of the variance than does stratification between schools. However, there is a silver lining. Even when achievement stratification at the classroom and friendship levels is taken into account, comprehensive systems do a better job at exposing students to peers with different abilities. The greater within school stratification in comprehensive systems is not enough to outdo equalization at the school level, and most variance is still between individuals rather than groups.
There are also important differences in the extent to which achievement sorting at these various levels overlaps with social background characteristics. In all countries, achievement stratification between schools is more strongly patterned by parental SES and migration background than is stratification within schools. This implies that even if comprehensive schools create greater stratification in classrooms and friendship groups, this is of less consequence for social inequalities because such sorting is less dependent on student background. Within-school sorting merits continued attention, but it does not undo the equalizing efforts of comprehensive schooling. An important caveat is that this pattern is weaker for migration background, which remains an equally important source of inequality in access to high achieving peers across all countries. This may be because ethnic identity matters for self identity and hence friendship selection to an extent that parental SES does not. Future work should aim to identify school practices and other institutional features with the potential to promote cohesion along ethnic lines.
Supplemental Material
sj-pdf-1-soe-10.1177_00380407231183952 – Supplemental material for Within-School Achievement Sorting in Comprehensive and Tracked Systems
Supplemental material, sj-pdf-1-soe-10.1177_00380407231183952 for Within-School Achievement Sorting in Comprehensive and Tracked Systems by Per Engzell and Isabel J. Raabe in Sociology of Education
Footnotes
Acknowledgements
Previous versions of this work were presented at the Educational Inequality: Mechanisms and Institutions Conference, Amsterdam Centre for Inequality Studies, July 2018; the European Conference on Social Networks, Zürich, September 2019; and the Swedish Institute for Social Research. We thank audiences at the previous presentations of this work for their comments, especially Adam Altmejd, Andreas Diemer, Anni Erlandsson, Tünde Lénárd, and Sönke Matthewes. Thanks also to the editors and anonymous reviewers whose comments greatly improved the article. Any remaining errors are our own.
Funding
The author(s) disclosed receipt of the following financial support for the research, authorship, and/or publication of this article: Engzell acknowledges support from the Swedish Research Council (2019-02168); the Swedish Research Council for Health, Working Life, and Welfare (2016-07099); and NordForsk (95263). Raabe was funded by an Ambizione Grant from the Swiss National Science Foundation. The Children of Immigrants Longitudinal Study in Four European Countries received funding from the NORFACE research program on Migration in Europe: Social, Economic, Cultural and Policy Dynamics.
Research Ethics
The current study received approval from the Regional Ethics Committee, Stockholm. Approval (Reference No. 2010/1557-31/5).
Supplemental material
Supplemental material for this article is available online.
Author Biographies
References
Supplementary Material
Please find the following supplemental material available below.
For Open Access articles published under a Creative Commons License, all supplemental material carries the same license as the article it is associated with.
For non-Open Access articles published, all supplemental material carries a non-exclusive license, and permission requests for re-use of supplemental material or any part of supplemental material shall be sent directly to the copyright owner as specified in the copyright notice associated with the article.