
Abstract
How are patterns of segregation related to families’ engagement in public-school choice policies across U.S. metropolitan areas? This article examines how segregation in urban public schools and the spatial mismatch between school-age children and relatively high-performing schools relate to the shares of Black, Hispanic, and White students enrolled in charter schools, one particular school choice mechanism. Drawing on Core-Based Statistical Area–level data, I find that charter-school enrollment among Black students is positively associated with spatial mismatch. As the degree of geographic imbalance between Black and, to a lesser extent, Hispanic school-age children and high-performing schools increases, so too does the share of Black and Hispanic students who enroll in charter schools. There is no such relationship for White students, whose enrollment in charter schools is higher when school segregation is relatively low—that is, when they would be more likely to attend neighborhood public schools with Black children.
One rationale underlying school-choice policies, including charter schools, is that they provide parents with the opportunity to select schools they believe will offer better academic environments for their children, regardless of where they live (Archbald 2004; Bifulco, Ladd, and Ross 2009; Liu and Taylor 2005). Recent evidence, however, indicates that the expansion of charter schools has increased racial/ethnic and socioeconomic school segregation within districts (Dalane and Marcotte 2021; Marcotte and Dalane 2019; Monarrez, Kisida, and Chingos 2022). Indeed, the link between residential and public-school segregation has strengthened over time with the growth of school choice (Frankenberg 2013).
The relationship between segregation and the market share of public-school choice options likely operates the other way as well. Whether students enroll in choice options like charter schools may be related to current levels of segregation in their metropolitan areas. White families, for instance, have used charter schools as a vehicle for “White flight” (Renzulli and Evans 2005). For these families, enrolling in charter schools may be motivated, at least in part, by how segregated they are from Black or Hispanic families and thus how likely their children are to be assigned to schools with Black or Hispanic children. Furthermore, given long-standing and persistent patterns in residential segregation and community disinvestment, the schools serving neighborhoods populated by Black and Hispanic families tend to be lower performing than those near White families (Jargowsky 2014; Lubienski, Gulosino, and Weitzel 2009; Phillippo and Griffin 2016). In this way, we can recast the concept of spatial mismatch—which usually refers to the process of racial residential segregation coupled with fewer jobs in areas where Black or Hispanic residents live (Hellerstein, Neumark, and McInerney 2008)—to describe the imbalance between schools and school-age children.
This article aims to describe (1) the spatial imbalance between Black, Hispanic, and White school-age children and high-performing schools and (2) the relationship between two aspects of segregation (of White students from Black or Hispanic students and of school-age children from relatively high-performing schools) and the share of students enrolled in charter schools across metropolitan areas. I use public-school and demographic data in large metropolitan areas between 2012 and 2017. The patterns described suggest the shares of Black, Hispanic, and White students enrolled in charter schools are related to different aspects of segregation. Higher shares of Black students and, to a lesser extent, Hispanic students are enrolled in charter schools in metropolitan areas with relatively high levels of spatial mismatch, whereas a higher share of White students are enrolled in charter schools where school segregation—especially from Black students—is relatively low (i.e., when they would be more likely to be assigned to neighborhood public schools with Black children).
Background
Because the public education system largely sorts students into schools based on the neighborhoods in which they live, schools reflect the racial/ethnic composition and socioeconomic (dis)advantages of their surrounding neighborhoods (Bischoff and Tach 2018; Lareau and Goyette 2014). Yet the expansion of school-choice policies—including charter and magnet schools, vouchers to attend private schools, and other intra- or interdistrict options—has the potential to reshape the link between residential and school segregation as well as the distribution of students across schools (Candipan 2020; Golann and Torres 2020; Owens 2017; Phillippo and Griffin 2016; Rich, Candipan, and Owens 2021). Unlike traditional public schools, charter schools can enroll students with less regard for the racial/ethnic segregation of a metropolitan area's neighborhoods or districts (Wells et al. 2019).
More than one in five public-school students nationwide attend a school other than the one they would have been assigned to based on where they live (Wang, Rathbun, and Musu 2019), and this figure is much higher in urban areas and places with especially robust public-school choice options (David, Hesla, and Pendergrass 2017; Grady and Bielick 2010). Charter schools represent the predominant mechanism for providing choice (Farmer, Poulos, and Baber 2020). Over 3 million students attend some 7,500 charter schools (Wang et al. 2019). Some proponents argue that charter schools, like other choice policies, can expand the schooling options available to families beyond the constraints of their neighborhood boundaries (Archbald 2004; Liu and Taylor 2005; Phillippo and Griffin 2016).
White, Black, and Hispanic students alike use charter schools as alternatives to the traditional public-school system. In fact, compared to traditional public schools, enrollment in charter schools is disproportionately Black and Hispanic (Berends 2015). In 2016 to 2017, Black and Hispanic students made up 26 percent and 33 percent of charter-school enrollment, respectively, and 15 percent and 26 percent of enrollment in traditional public schools (Wang et al. 2019). The increasing availability of charter schools may also disproportionately draw Black and Hispanic students out of traditional public schools (Bischoff and Tach 2020). White students, by contrast, are underrepresented in the charter sector: White students make up nearly 50 percent of enrollment in traditional schools but 32 percent of students in charter schools (Wang et al. 2019).
These differences are due, in part, to the fact that more than half of all charter schools are located in urban centers, where students of color are overrepresented in both charter and neighborhood schools (Berends 2015). Charter schools often open in communities with underperforming traditional public schools and higher percentages of poor, Black, and Hispanic residents (Burdick-Will, Keels, and Schuble 2013; Saultz and Yaluma 2017). At the same time, new charters can be found in neighborhoods spanning the socioeconomic spectrum (Lubienski et al. 2009). Indeed, charters can use their location to attract and retain certain types of students (Bell 2009; Hastings, Kane, and Staiger 2005). Some charter operators are responding to the demands of White and more affluent families by opening in urban neighborhoods undergoing gentrification and revitalization (Candipan and Brazil 2020; Denice, DeArmond, and Carr 2021; Makris and Brown 2020).
But the presence of Black, Hispanic, and White students in the sector tells us little about whether these schools ameliorate or worsen segregation. The research on this question is mixed. On the one hand, expansion in charter-school enrollment seems to have resulted in neither a decline nor an increase in the exposure of Black, Hispanic, and White students nationally (Chingos 2013). In most states, students transfer between public neighborhood and charter schools with similar racial/ethnic compositions (Zimmer et al. 2009). On the other hand, more recent evidence finds that segregation by race/ethnicity and socioeconomic status has increased in places where school choice has expanded (Dalane and Marcotte 2021; Kimelberg and Billingham 2013; Kotok et al. 2017; Ladd, Clotfelter, and Holbein 2017; Marcotte and Dalane 2019; Monarrez et al. 2022; Orfield and Frankenberg 2013). Additionally, charter schools are often more segregated than the neighborhoods in which they are located (Saporito and Sohoni 2006) and the traditional public schools from which their students came (Denice et al. 2021; Whitehurst et al. 2017).
It is also possible that families seek out charter schools for their children in response to current levels and patterns of segregation in their metropolitan areas and schools. As non-neighborhood public schools, charters open options for families to realize and act on their educational preferences and priorities when those are not being met by their neighborhood schools (Archbald 2004). In this way, charters can provide families with the opportunity to overcome some of the constraints posed by the public education system's “geography of inequality” (Logan, Minca, and Adar 2012)—including the uneven distribution of quality schools. At the same time, they can reify and exacerbate segregation in schools when families use charters to limit their children's exposure to students of other racial/ethnic groups (Bifulco et al. 2009; Renzulli and Evans 2005).
Charter Schools and Segregation
Racial segregation remains high in metropolitan areas across the United States (Firebaugh and Farrell 2016), and neighborhood public schools reflect this (Whitehurst et al. 2017). Even as the public-school population has grown more diverse, White, Black, and Hispanic students are increasingly enrolled in different schools across a metropolitan area's school districts and across a district's schools (Billingham 2019; Fiel 2013). But in places where segregation is marginally lower and the risk of assignment to more integrated neighborhood schools is higher, do families look to charter schools to manage the racial/ethnic composition of their children's schools?
Prior research indicates that parents are sensitive to the racial/ethnic composition of their children's schools and that this is especially true for White parents (Goyette, Farrie, and Freely 2012; Renzulli and Evans 2005; Saporito and Sohoni 2006). White families’ avoidance of schools with higher proportions of Black or Hispanic students persists even when accounting for other school traits that often serve as proxies for racial composition, such as school safety and student test scores (Billingham and Hunt 2016). Indeed, White parents engage in a two-step decision-making process in which they first rule out schools based on their percentage of Black or Hispanic students and then move on to consider other criteria (Saporito and Lareau 1999). Some White parents explicitly reference anti-Black attitudes when asked about why they selected the schools they did for their children (Johnson and Shapiro 2003).
This sensitivity to schools’ racial/ethnic composition is consistent with theories of group threat or outgroup avoidance wherein more advantaged families seek to maintain their social status by physically distancing themselves from groups of lower standing (Dixon 2006; Quillian 1996; Taylor 1998). Such patterns are evident in housing markets: White families avoid neighborhoods with high percentages of Hispanic and especially Black residents (Bobo and Zubrinsky 1996; Krysan et al. 2009). Charter schools may similarly facilitate preferences for outgroup avoidance by making it relatively easy for White families to select out of schools with higher shares of Black and Hispanic students (Bifulco et al. 2009; Candipan 2019; Renzulli and Evans 2005; Saporito 2003). White parents may espouse particularly racist views—and thus be more likely to seek out schooling options with lower shares of Hispanic and especially Black students—in places where Hispanic and Black families represent a larger share of the local population and where their children are more likely to be assigned to schools with Hispanic and Black students (Taylor and Mateyka 2011). In this way, charter schools can act as an alternative mechanism for reducing their children's contact with Black and Hispanic students without needing to move to a different school district or neighborhood or when doing so would not necessarily result in assignment to a neighborhood school with a lower concentration of Black or Hispanic students (Clotfelter 2004).
At the same time, theories about intergroup contact predict that increased exposure between racial groups lowers prejudice (Allport 1954; Dixon 2006). Thus, in places where racial/ethnic segregation is lower, it is possible that White flight to charter schools will be lower as well. This may be especially true with respect to Hispanic-White segregation, which tends to be lower than Black-White segregation, although it is increasing (Iceland and Sharp 2013).
Black, Hispanic, and other families may also evince segregative choices. Consistent with a theory of “neutral ethnocentrism,” in places where they may be more likely to be assigned to relatively integrated neighborhood schools, Black and Hispanic families may seek charter schools with higher concentrations of similar students (Bifulco et al. 2009; Bifulco and Ladd 2007). Other research, however, suggests these moves from more diverse neighborhood schools to more segregated charter schools result, in part, from the nearby supply of schools (Denice and Gross 2016). Due to long-standing patterns of residential segregation, the schools selected by and located close to the homes of Black and Hispanic parents tend to enroll higher proportions of Black and Hispanic students than do those selected by and located near White families.
One of this study's aims is to assess whether the degree to which White, Black, and Hispanic students attend public schools together shapes their relative enrollment rates in charter schools. Consistent with theories of group threat and outgroup avoidance, I hypothesize this will be especially salient among White students. In metropolitan areas where White students are more likely to be assigned to neighborhood public schools with Black or Hispanic students, I expect the percentage of White students enrolled in charter schools will be higher.
Charter Schools and Spatial Mismatch
In addition to being physically isolated from one another across neighborhoods and schools, Black, Hispanic, and White students also vary with respect to their proximity to high-quality public schools. The concept of spatial mismatch usually articulates the process of racial residential segregation coupled with fewer jobs in neighborhoods where Black and Hispanic residents live (Hellerstein et al. 2008; Kain 1968, 1992). Urban residents, and particularly Black and lower-income central-city residents, have difficulty finding work, in part, because of the decentralization of jobs within metropolitan areas, shifting labor demand to the suburbs, and housing discrimination (Houston 2005; Kain 1968). Spatial isolation from clusters of job opportunities entail material disadvantages in the form of long commutes, lower wages, and higher and longer spells of unemployment (Covington 2018; Reingold 2001; Stoll 2006).
We can borrow this concept to describe the spatial imbalance between schools and students: Just as proximity to jobs constrains the economic conditions of Black and lower-income workers, patterns of residential segregation mean fewer high-quality public schools are located near where Black and Hispanic children live (Jargowsky 2014; Logan et al. 2012; Lubienski et al. 2009). The schools located in or near neighborhoods populated by Black and Hispanic families—and thus the public schools to which their children are likely to be assigned—tend to be lower achieving and have lower achievement growth than schools serving White, more affluent neighborhoods (Hanselman and Fiel 2017).
Proximity to schools is important for several reasons. Schools that are farther away from home entail longer commutes, which negatively affect students’ academic achievement (Falch, Lujala, and Strøm 2013; Tigre, Sampaio, and Menezes 2017) and the time students can spend on health-promoting activities like sleep and exercise (Talen 2001; Voulgaris, Smart, and Taylor 2019). Longer commutes are also associated with higher absenteeism (Blagg, Rosenboom, and Chingos 2018; Cordes, Rick, and Schwartz 2021; Gottfried 2017; Stein and Grigg 2019) and an increased likelihood of switching schools, which can adversely affect test scores, discipline, and dropout (Blagg et al. 2018; Stein, Burdick-Will, and Grigg 2021). Students traveling long distances to school may also be exposed to dangerous conditions while walking to or waiting at transit stops (Burdick-Will, Stein, and Grigg 2019). Particularly when children are young and cannot travel to school alone, longer commutes constitute a “tax” on a family's resources (Rich and Jennings 2015) because parents have to adjust their schedules to accommodate longer trips. This may be one reason why distance from home shapes parents’ perceptions of a school's accessibility (Denice and Gross 2016; Schneider and Buckley 2002).
Many interrelated social, cultural, and economic institutions and factors help explain the unequal geography of educational opportunity (Cashin 2014; Orfield and Lee 2005; Tate 2008). Structural racism, legally inscribed segregation, and discriminatory housing policies have isolated Black and Hispanic families from White and higher-income neighbors and from higher-quality schools (Green 2015; Neely and Samura 2011; Rothstein 2017). Additionally, because public schools are funded primarily through local property taxes, school resources such as teacher salaries, building maintenance, and curricular materials vary systematically with neighborhoods’ racial and socioeconomic composition (Crosnoe 2005; Hanushek and Rivkin 2009; Orfield and Lee 2005; Saporito and Sohoni 2007; Walters 2001). Demographic and economic changes—including the influx of lower-income residents into cities coupled with the out-migration of White, middle-class families to the suburbs; a decline in job opportunities; and the deterioration of residential and commercial infrastructure—have hastened the contraction of urban schools’ tax base (Phillippo and Griffin 2016). Moreover, many cities have implemented accountability policies that closed chronically underperforming and underenrolled schools (Burdick-Will et al. 2013; Paino, Boylan, and Renzulli 2017), which has worsened proximity to schools for students who already reside in less advantaged neighborhoods (Lee and Lubienski 2017). Taken together, these processes mean fewer resources are available to the schools serving larger shares of Black, Hispanic, and lower-income students compared to schools serving White and more affluent children (Green, Sánchez, and Germain 2017).
When describing the geographic distribution of schools’“quality,” researchers generally refer to a school's ability and resources to support the development of its students, but the concept is difficult to measure (Hanselman and Fiel 2017). One challenge with measuring school quality is the strong relationship between race and class and students’ performance on achievement indicators such as standardized tests (Coleman 1966; Downey and Condron 2016; Duncan and Brooks-Gunn 1999). Schools in predominantly Black or Hispanic communities can get branded as “lower quality” regardless of their actual performance or resources (Goyette et al. 2012; Lareau and Goyette 2014). At the same time, even imperfect measures of performance—such as schools’ standardized test proficiency rates—can be useful for understanding the spatial distribution of educational opportunities (Logan et al. 2012). Such measures of student achievement are readily used by parents when they make enrollment decisions (Buckley and Schneider 2003; Denice and Gross 2016; Schneider and Buckley 2002; Tedin and Weiher 2004). Measures like student average growth or learning rates may be less correlated with student demographics than test scores (Reardon et al. 2019), but parents are more aware of and more likely to rely on simpler measures like test scores than more complicated measures like student growth or average learning rates. One recent study found that parents’ online reviews of schools correlated with schools’ standardized test scores but not with measures of school effectiveness or growth (Gillani et al. 2021).
School-choice options like charter schools offer the potential for families to overcome this spatial mismatch and enroll in better resourced and higher-quality schools than exist nearby. By decoupling school preferences from residence, parents can make choices that are less constrained by the supply of schools in their immediate neighborhoods. Instead, parents can select schools they believe will provide better academic environments for their children, regardless of where they live (Schneider, Teske, and Marschall 2002). Some empirical work suggests charter schools have expanded access to higher-performing schools for some Black and Hispanic students, especially in urban areas (CREDO 2015). At the same time, the evidence on charter schools’ ability to improve student achievement is mixed (Berends 2015). Other research finds null or negative effects of charters on achievement (Bifulco and Ladd 2006; Clark et al. 2015). Still other work focuses on the charter sector's paternalism. Charters that take a “no excuses” approach to discipline, for instance, may undermine students’ social and behavioral development (Golann and Torres 2020) and risk alienating parents and other community stakeholders (Glazer and Egan 2016). This variation notwithstanding, across racial/ethnic and socioeconomic groups, parents report exploring school-choice options like charters as a way to gain access to better schools than those to which their children would otherwise be assigned (Denice and Gross 2016).
In this study, I apply the concept and measurement of spatial mismatch from the literature on housing and jobs to describe the relative imbalance between Black, Hispanic, and White school-age children and a metropolitan area's highest performing schools. Then, I assess whether this spatial mismatch is associated with the share of students enrolled in charter schools. I hypothesize this will be especially salient for Black and Hispanic students, who are more likely than White children to live in neighborhoods underserved by high-performing schools. In metropolitan areas where Black and Hispanic students are more spatially mismatched from high-quality schools, I expect higher shares of these groups to be enrolled in charter schools.
Data and Methods
This study describes the relationship between racial/ethnic segregation and charter-school enrollment among urban Black, Hispanic, and White elementary and middle school students in the 2011–2012 and 2016–2017 school years (hereafter, 2012 and 2017) using a panel data set of large U.S. metropolitan areas. Metropolitan areas are defined using the 2010 Office of Management and Budget (OMB) definitions of Core-Based Statistical Areas (CBSAs). Demographic information about CBSAs and their constituent neighborhoods (census tracts) comes from the five-year American Community Surveys of 2007–2011 and 2012–2016. Information about public schools’ student composition comes from the National Center for Education Statistics's (NCES) Common Core of Data (CCD), and data on schools’ average test scores come from NCES's EdFacts system. Schools are geolocated inside census tracts and CBSAs using their latitude and longitude. I rely on the CCD-provided indicator to determine which schools are charters.
There were 366 OMB-defined metropolitan CBSAs in 2012 and 2017, but I restrict the sample in two ways. First, CBSAs in the sample had to have at least 1,000 Black, 1,000 Hispanic, and 1,000 White elementary- and middle-school–age children (i.e., children between the ages of 5 and 14) to meaningfully measure segregation among these groups. Second, I excluded CBSAs in which there were no charter schools operating in either year. The final sample of 152 metropolitan CBSAs represents 81 percent of all children ages 5 to 14 living in metropolitan areas nationwide.
Measures
I examine three outcome variables: the percentage of (1) Black, (2) Hispanic, and (3) White public K–8 students enrolled in charter schools during the 2011–2012 and 2016–2017 school years. Within each CBSA and separately by racial/ethnic group, I sum the number of public K–8 students enrolled in charter schools and divide this by the total number of public-school students. I focus on K–8 students because assignment to elementary and middle schools is more commonly tied to residential address than is high school assignment (Stroub and Richards 2013). Furthermore, because there are fewer high schools than schools serving grades K–8, treating small neighborhoods (census tracts) as an approximation of school proximity is less reasonable because schools become less local.
The primary independent variables of interest capture the segregation of Black, Hispanic, and White K–8 students from one another and their spatial imbalance from relatively high-performing schools. To measure the Black-White and Hispanic-White segregation of students across schools in each metropolitan area, I use the index of dissimilarity (Massey and Denton 1988a, 1988b). As a measure of evenness, the dissimilarity index,

where
I also use an index of dissimilarity to measure the average spatial mismatch between high-performing schools and the residence of school-age children. Other researchers have used the dissimilarity index to measure the degree of spatial imbalance between Black residents and jobs (Covington 2009, 2018; Martin 2001, 2004; Stoll and Covington 2012). Here, I apply the logic of spatial mismatch to schools and students. A dissimilarity index between Black children and high-performing schools would be calculated as follows:

where

To calculate composite population counts for each tract, I sum the number of residents in the target group (e.g., Black residents ages 5 to 14) in coterminous tracts and add this value to the number in the focal tract. In other words, a composite population count refers to the population count in tract t plus the population counts in its neighboring tracts. This helps capture the spatial interaction of population groups across tract boundaries (Horner and Marion 2009; Oka and Wong 2015). 1 I calculate similar measures for Hispanic children and White children.
I define “high-performing schools” according to their average standardized math test proficiency rates. Public-school students in the United States are typically tested in math and reading in grades three to eight. Across these tested grades in each school, I take the percentage of students scoring at or above the proficient level on the standardized math test. This percentage is calculated by dividing the number of students in a school scoring at or above proficient by the total number of students in that school who completed a state assessment in mathematics and for whom a proficiency level was assigned. To protect students’ privacy, NCES reports proficiency rates for small schools as ranges. In these cases, I take the midpoint (e.g., if the range is 40 percent to 49 percent, I use a value of 44.5 percent). Then, within each CBSA, state, and year, I calculate each school's percentile rank. Schools for which the percentage of grades three to eight students scoring at or above proficient falls within the top quartile of their metropolitan area are considered high performing. 2
Importantly, the dissimilarity index does not capture the actual physical distance between the average child of a given population group and a metropolitan area's top-scoring schools (Covington 2018). 3 However, absent data on individual children's exact residential addresses, the dissimilarity index approximates the average spatial imbalance between Black, Hispanic, or White school-age children and a CBSA's top-scoring schools. In contrast to other, more explicitly distance-based measures of proximity or access, the dissimilarity index allows uniform comparisons across geographic areas and between population groups (making it useful for the national scope of this article) and has a convenient interpretation (Easley 2018; Stoll and Covington 2012; Theys et al. 2019).
These measures of segregation and spatial mismatch are lagged by one year to examine how racial/ethnic segregation and spatial mismatch in one year might shape the share of Black, Hispanic, and White students in a CBSA who are enrolled in a charter school in the following year (Renzulli and Evans 2005). In other words, to measure levels of segregation and spatial mismatch that may have informed enrollment patterns for fall 2011, I use enrollment and test score data from the 2010–2011 school year. 4
I control for a number of demographic and socioeconomic characteristics that are likely associated with the extent to which families take advantage of charter-school options and the degree of segregation and spatial mismatch in metropolitan areas. To account for characteristics of the public-school population, I include the total (logged) count of all public K–8 students, the percentage of students who are Black or Hispanic, and the percentage of students attending urban schools (vs. suburban or rural schools within the CBSA's boundaries). To control for the supply and availability of charter-school options in each metropolitan area, I include the number of charter schools operating within a CBSA's boundaries. To account for the spatial distribution of charter schools, I measure the clustering of charter schools with the average nearest neighbor index (ANNI; Gilblom and Sang 2019). To calculate the index, I first find the distance (in miles) between the location of each charter school in a CBSA and its nearest charter-school neighbor. Then, I compute the average nearest neighbor distances for each CBSA. I compare these average distances to a CBSA's expected mean distance, or the average distance for a hypothetically random distribution of charter schools in a CBSA. If the ratio of the observed to expected mean distance is less than 1, then charter schools are relatively clustered. If this ratio is greater than 1, charter schools are more dispersed throughout the CBSA.
The focus on CBSA-level patterns is motivated, in part, by how families engage with public-school choice: Families are not generally bound by school-district boundaries when applying to a charter school. At the same time, CBSAs are quite large and differ in the number of districts and other public-education agencies operating within their borders. This variation, in turn, likely shapes residential patterns, proximity to specific schools, and the availability of non-neighborhood school options (Bischoff 2008). I control for such education agency fragmentation with a probability measure that represents the likelihood two students in the same metropolitan area attend schools operated by different education agencies (i.e., school districts or independent charter management organizations). This measure is defined as follows:

where
I also control for demographic traits, including each CBSA's population density (per square mile), median household income, the percentage of its school-age (5–14) population living in poverty, and racial/ethnic inequality in poverty (the ratio of the percentage of Black or Hispanic children living in poverty to the percentage of White children). Prior research shows school choice is more likely to be exercised by those with higher levels of human and social capital (Bifulco et al. 2009; Holme 2002; Lauen 2007; Saporito 2003; Saporito and Lareau 1999; Saporito and Sohoni 2007). Therefore, in addition to the percentage of the adult population with at least a bachelor's degree, I also control for educational inequality between Black (or Hispanic) and White residents. This measure is calculated as the ratio of the percentage of White adults with at least a bachelor's degree to the percentage of Black or Hispanic adults.
When estimating models focused on the relationship between charter enrollment of Black and White students and Black-White segregation (as in Table 2), the controls include the percentage of students who are Black and the Black-White measures of educational and poverty inequality; when estimating models of Hispanic and White students’ charter enrollment (Table 3), I include the percentage of students who are Hispanic and the Hispanic-White measures of inequality. All models also include fixed effects for year and region. Table 1 provides descriptive statistics for all variables for the sample of 152 CBSAs across the two years.
Summary Statistics.
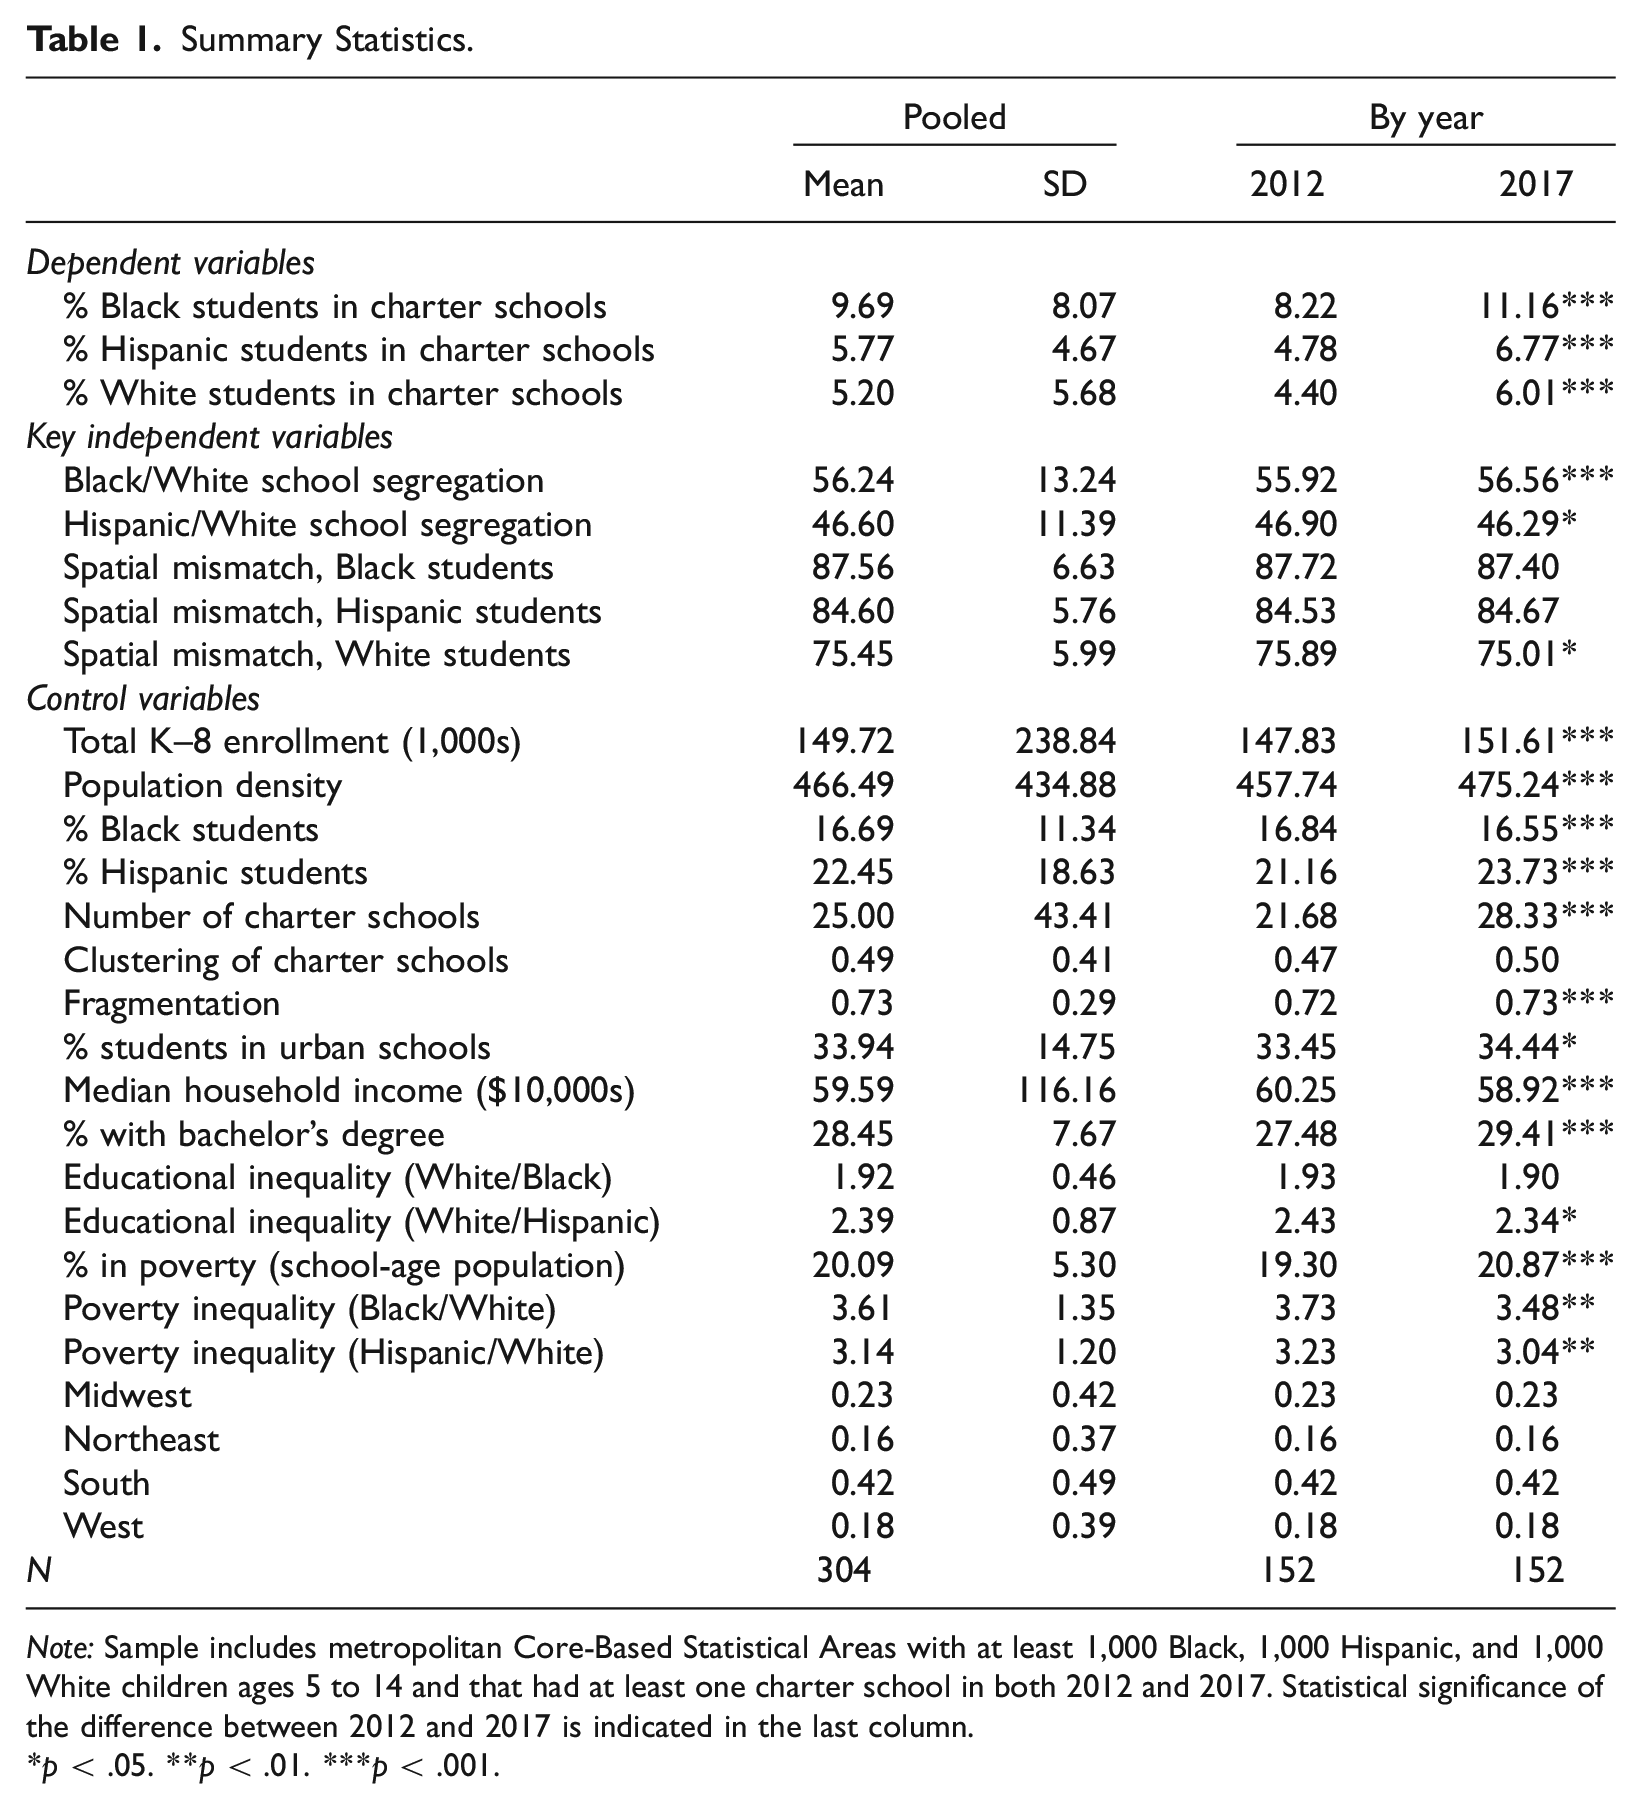
Note: Sample includes metropolitan Core-Based Statistical Areas with at least 1,000 Black, 1,000 Hispanic, and 1,000 White children ages 5 to 14 and that had at least one charter school in both 2012 and 2017. Statistical significance of the difference between 2012 and 2017 is indicated in the last column.
p < .05. **p < .01. ***p < .001.
Analytic Strategy
The analysis proceeds in two stages. First, I describe the spatial mismatch between Black, Hispanic, and White students and high-performing schools. Second, I examine the relationship between Black, Hispanic, and White students’ enrollment in charter schools and the measures of segregation and spatial mismatch. The data are structured such that each metropolitan area i is observed at two time points (t = 1, 2). Pooled cross-sectional ordinary least squares models examine variation between CBSAs for both years and can be specified as follows:
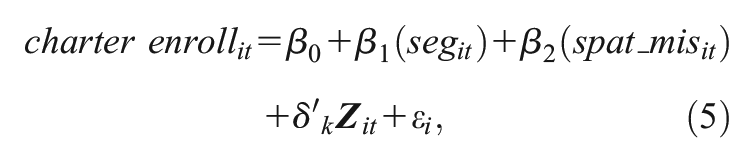
where segit is the index between Black and White students (or between Hispanic and White students) across public schools in CBSA i and year t; spat_ misit is the degree of spatial mismatch between Black, Hispanic, or White students and high-performing schools; and
Robustness Checks
To assess the sensitivity of the core results, I reestimated the models in several ways. For instance, I reran the models in Table 2 on a sample that included the 162 CBSAs in which there were at least 1,000 Black children and 1,000 White children between the ages of 5 and 14 (without the Hispanic student population restriction). Similarly, I reran the models in Table 3 on a sample that retained the 199 CBSAs with at least 1,000 Hispanic and 1,000 White school-age children (omitting the Black population restriction). I reestimated the models for a single year (2017) so I could relax the restriction that CBSAs had to have charter schools in both years. I also created charter share and segregation measures based on other grade configurations: just tested grades (grades three to eight), a single elementary-school grade cohort (grade four), and all grade levels (K–12). Across all specifications, the results were substantively similar.
Pooled Ordinary Least Squares Models Predicting the Percentage of Black and White Students Enrolled in Charter Schools.
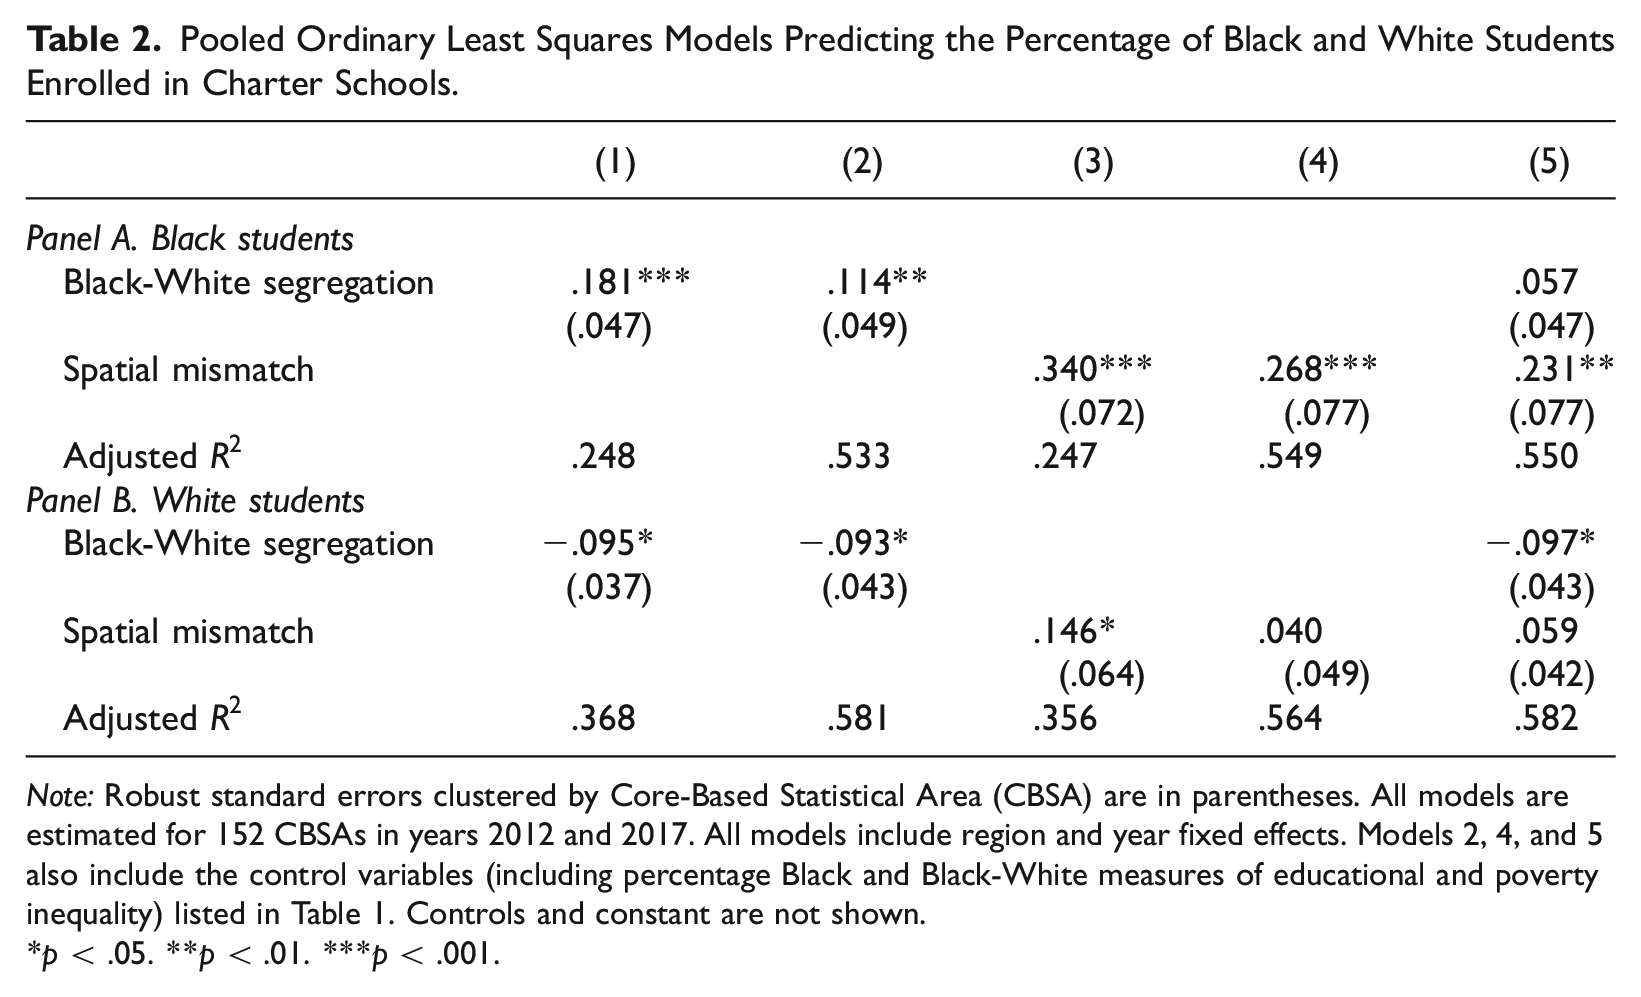
Note: Robust standard errors clustered by Core-Based Statistical Area (CBSA) are in parentheses. All models are estimated for 152 CBSAs in years 2012 and 2017. All models include region and year fixed effects. Models 2, 4, and 5 also include the control variables (including percentage Black and Black-White measures of educational and poverty inequality) listed in Table 1. Controls and constant are not shown.
p < .05. **p < .01. ***p < .001.
Pooled Ordinary Least Squares Models Predicting the Percentage of Hispanic and White Students Enrolled in Charter Schools.
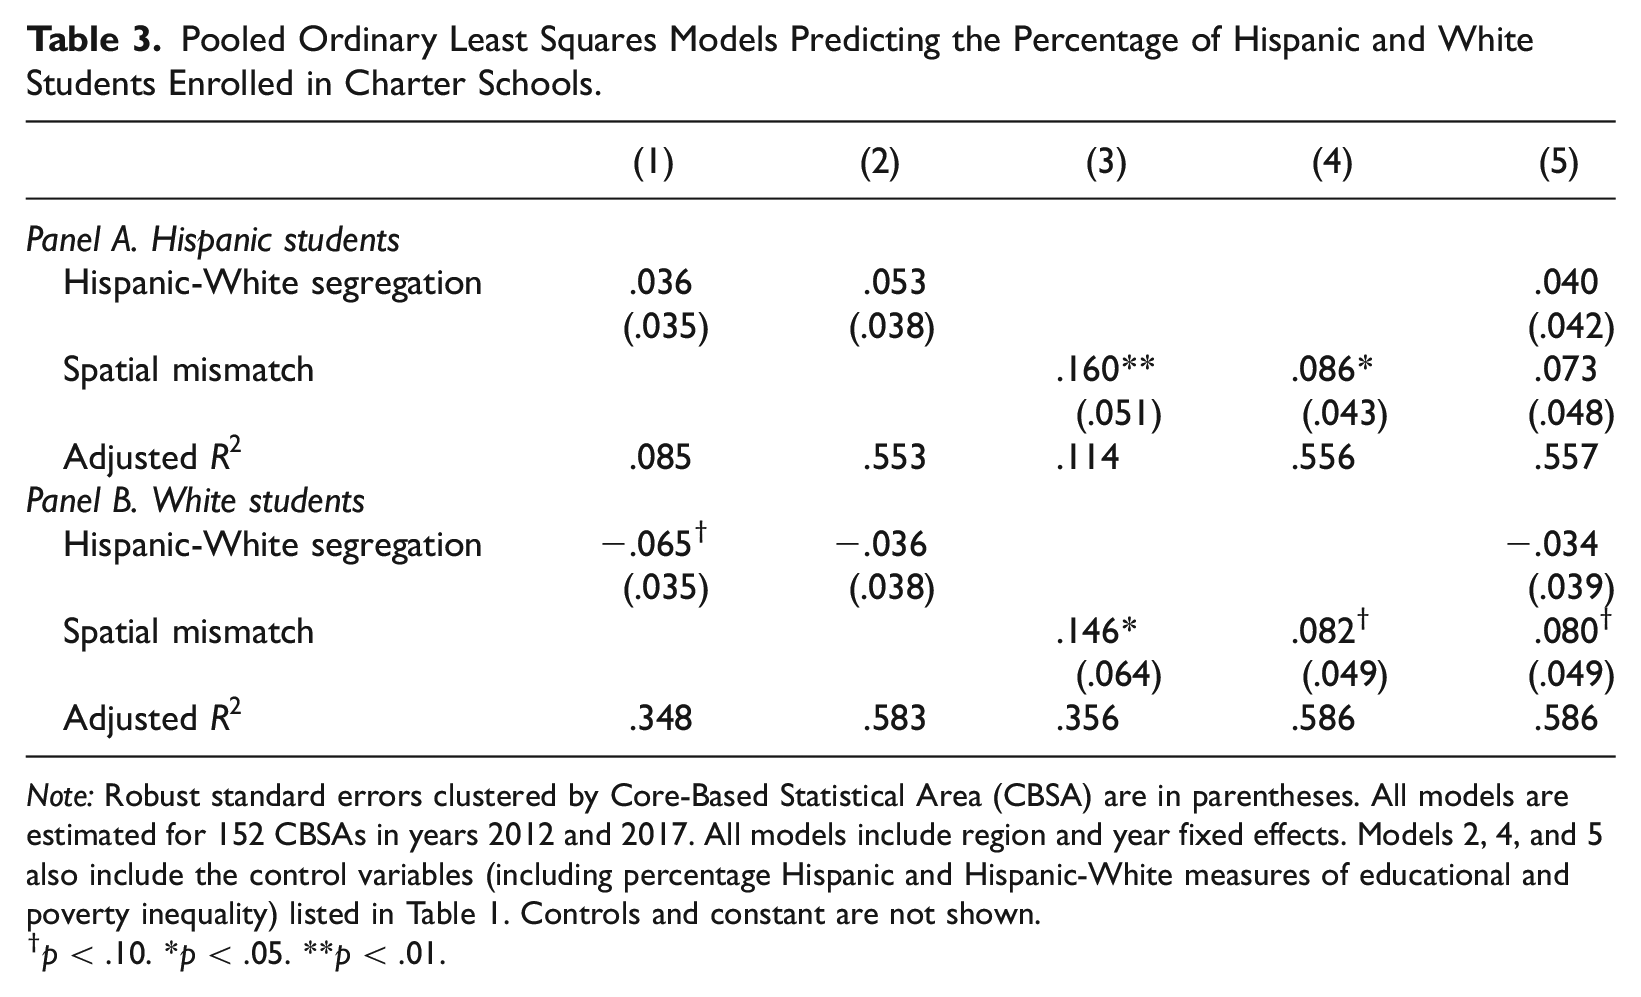
Note: Robust standard errors clustered by Core-Based Statistical Area (CBSA) are in parentheses. All models are estimated for 152 CBSAs in years 2012 and 2017. All models include region and year fixed effects. Models 2, 4, and 5 also include the control variables (including percentage Hispanic and Hispanic-White measures of educational and poverty inequality) listed in Table 1. Controls and constant are not shown.
p < .10. *p < .05. **p < .01.
Given the relationship between school proficiency rates and student composition discussed earlier, I reran the models using measures of spatial mismatch based on students’ average learning rates (Fahle et al. 2018). This measure characterizes a school's average growth from 2008 to 2016, so I focus on charter enrollment in the second year of data only (2017). Like test scores or proficiency rates, average learning rates do not provide a wholly unbiased measure of schools’ effects on student achievement because they do not account for out-of-school factors that also shape learning. But they do tell us about how much students at a given school improve relative to others, and they are less correlated with student demographics than are test scores (Reardon et al. 2019). Dissimilarity indices based on schools’ average learning rates are moderately to strongly correlated with those based on schools’ average proficiency (0.52 for White children, 0.67 for Black children, and 0.59 for Hispanic children) and produce results consistent with those in Tables 2 and 3.
Another set of models uses fixed effects to analyze variation within each CBSA over time. These models predict how a change in either segregation or spatial mismatch is associated with a change in the share of Black, Hispanic, or White students enrolled in charter schools. Because fixed-effects models control for observed and unobserved time-invariant characteristics, any differences in CBSAs’ governance, culture, or histories of public education are accounted for insofar as these did not change over the five-year observation period. Given the fairly narrow time period, these models can only give us a sense of short-run change, so many of the effects are smaller and not statistically significant but in the expected directions.
Findings
Describing Charter Enrollment and Spatial Mismatch
As Table 1 shows, across metropolitan areas, higher shares of Black K–8 students than Hispanic and White students are enrolled in charter schools. Whereas 9.7 percent of Black students attend a charter school, 5.8 percent of Hispanic students and 5.2 percent of White students do. All three groups of students saw their charter enrollment increase between 2012 and 2017—from 8.2 percent to 11.2 percent among Black students, from 4.8 to 6.8 percent among Hispanic students, and from 4.4 to 6.0 percent among White students. Reflecting the rising availability of and demand for school choice, the average number of charter schools serving grades K–8 in large metropolitan areas increased from about 22 to 28. Charter schools also tend to be clustered together within CBSAs, as evidenced by the average ANNI value well below 1.0 and consistent with other research (Gilblom and Sang 2019).
The averages in Table 1 mask variation across CBSAs. Figure 1 compares the charter enrollment of Black and White students (in Panel A) and of Hispanic and White students (in Panel B) in 2012 and 2017. The diagonal lines in the plots represent the hypothetically even distribution of Black (or Hispanic) and White students in charter schools. In Panel A, about two-thirds of CBSAs are located below the diagonal line in either year; Black students are overrepresented in charter schools in 66 percent of metropolitan areas. Similarly, in Panel B, a higher share of Hispanic students than White students are enrolled in charter schools in 55 percent of CBSAs.
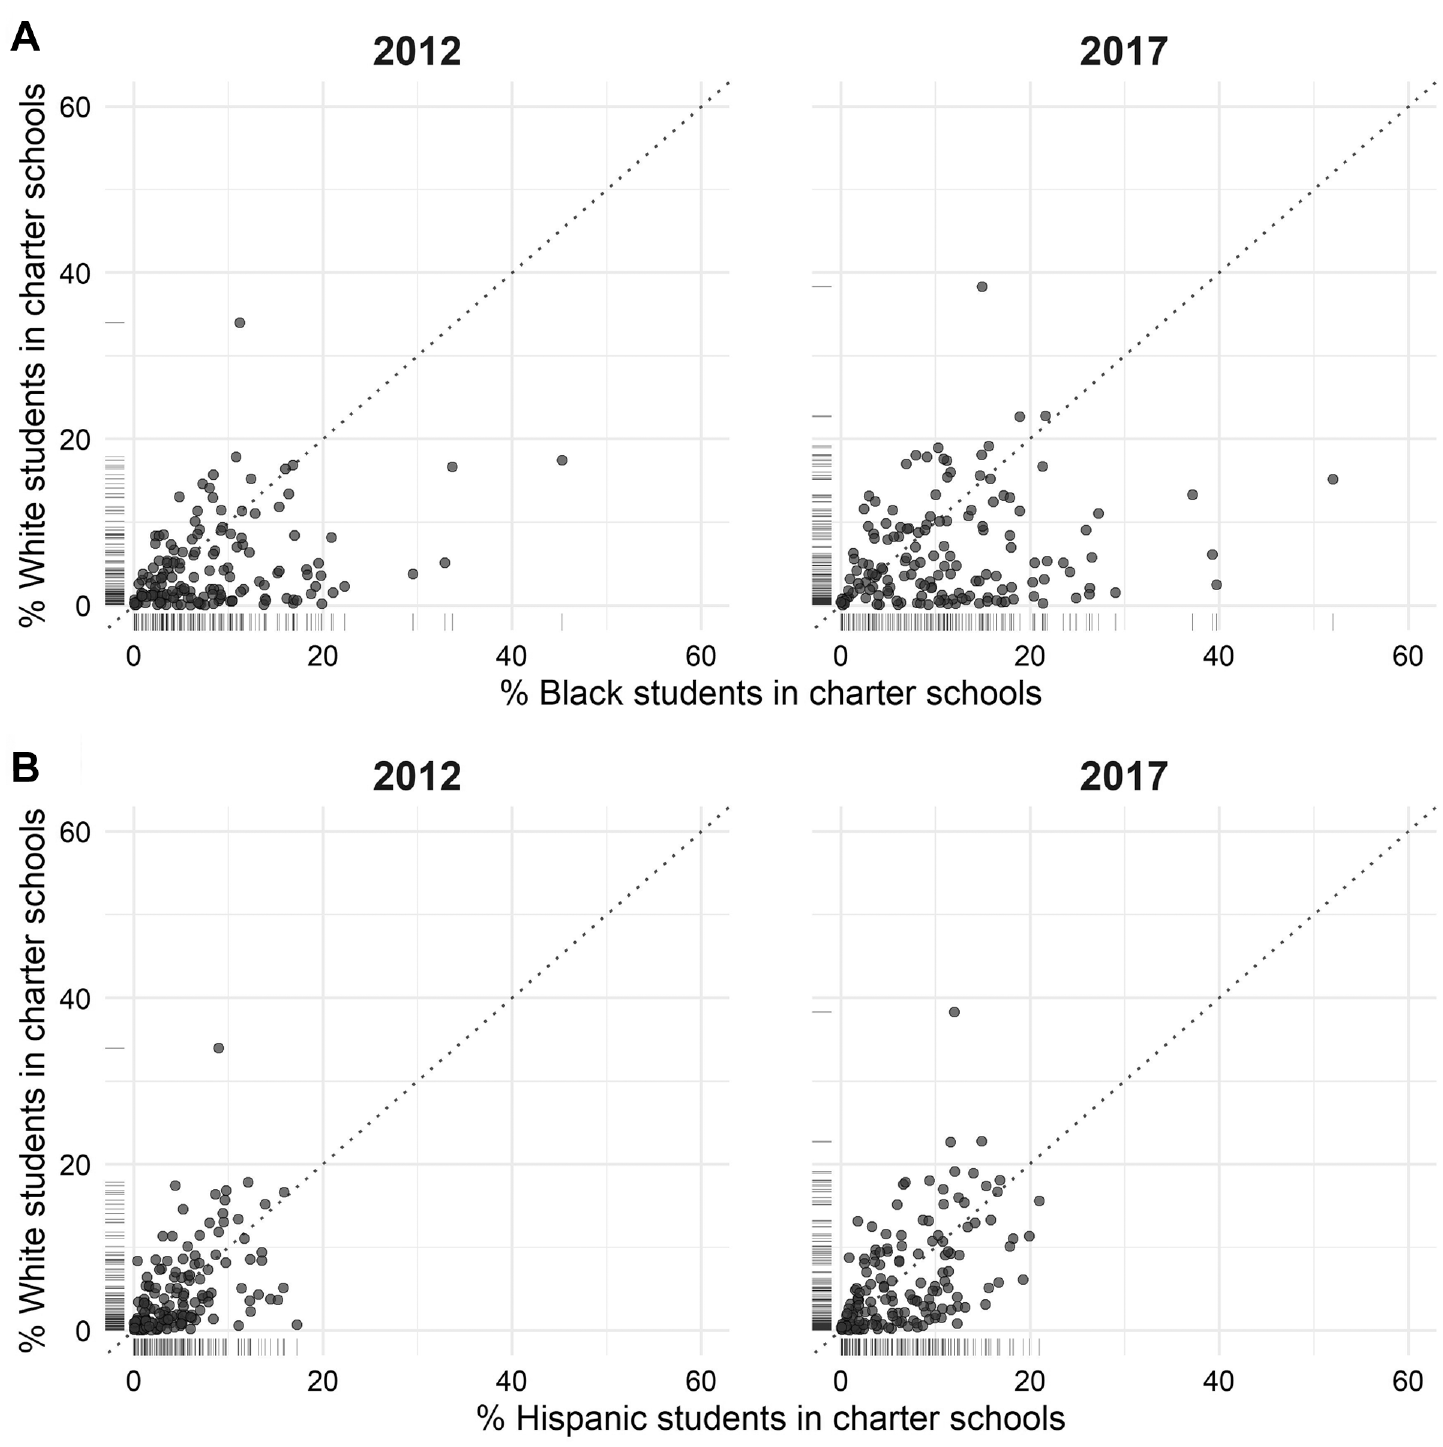
Share of Black, Hispanic, and White students enrolled in charter schools, by year.
It is clear from Table 1 that Black and White students continue to attend different schools within metropolitan areas. The dissimilarity index between Black and White students was 55.92 in 2012 and 56.56 in 2017, indicating moderate to high levels of segregation that changed little over the five-year observation period. Segregation is slightly lower between Hispanic and White students, averaging 46.60 across the two years. Over 40 percent of CBSAs in the sample had Black-White dissimilarity indices above 60, but just 8 percent had similarly high levels of segregation between Hispanic and White students.
Black and Hispanic school-age children (between the ages of 5 and 14) also experience much higher levels of spatial mismatch from relatively high-performing schools than do White children—and Black children are the most disadvantaged in this respect. Figure 2 compares the distributions of spatial mismatch for Black and Hispanic children to that of White children. The average spatial mismatch is 87.72 for Black children and 84.60 for Hispanic children, compared to 75.45 for White children. Although all three groups’ mean levels of spatial mismatch are high in absolute terms (reflecting in part the construction of the measure using census tracts, which do not all contain K–8 schools, let alone high-performing schools), there is clear separation between the distributions of Black and Hispanic children versus White children. The differences between Black and White children, between Hispanic and White children, and between Black and Hispanic children are all statistically significant. 5 The levels of spatial imbalance remain quite steady over the five-year period. Even with the increase in the availability of school choices like charter schools, neither spatial mismatch nor segregation have markedly improved. In short, there are large, statistically significant, and time-stable racial/ethnic gaps in spatial mismatch.
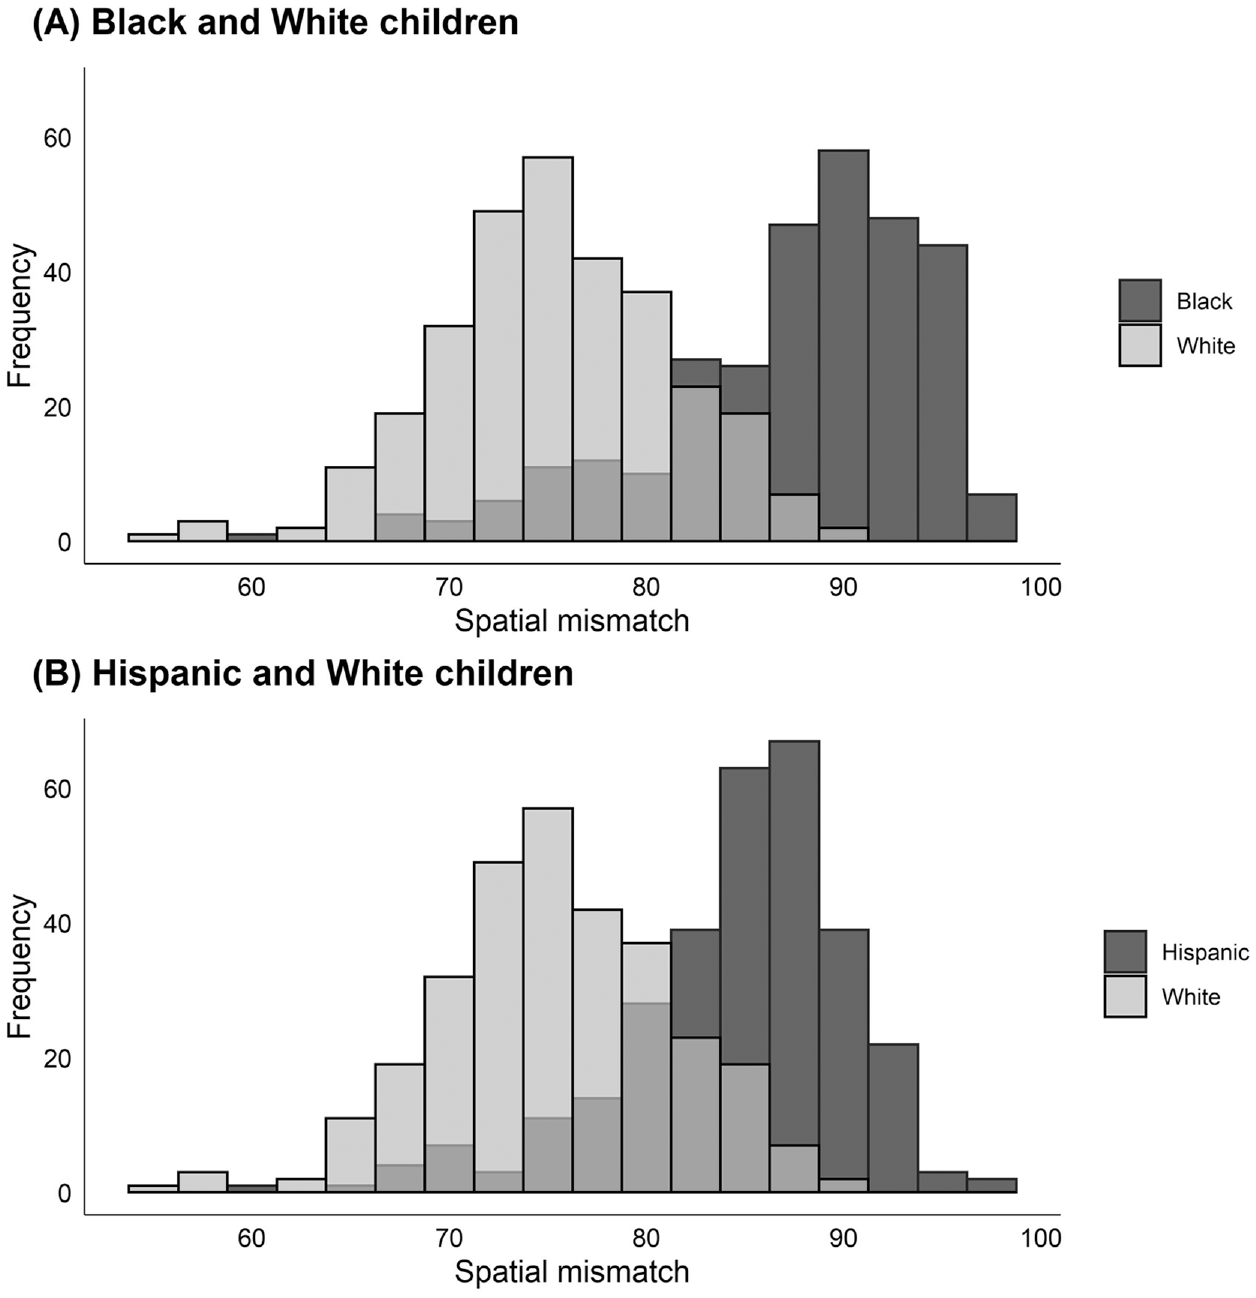
Spatial mismatch among Black, Hispanic, and White school-age children.
How closely related are segregation and spatial mismatch? As Figure 3 illustrates, this depends on the racial/ethnic group. The correlation between school segregation and spatial mismatch among Black and Hispanic children is moderate and positive (rs = .59 and .36, respectively), but it is negative and weaker (rs = –.11 and –.33) for White children. That Hispanic and especially Black children attend different schools than White children and experience higher spatial imbalance from relatively high-performing schools likely stem from the same processes of residential segregation. For White children, processes of residential segregation and the uneven distribution of quality learning environments work together to assign them to different schools than Black and, to a lesser extent, Hispanic students and to reduce their spatial mismatch from higher-performing schools. The more segregated White students are from Black or Hispanic students, the lower their spatial imbalance is from high-performing schools in their metropolitan area, on average.
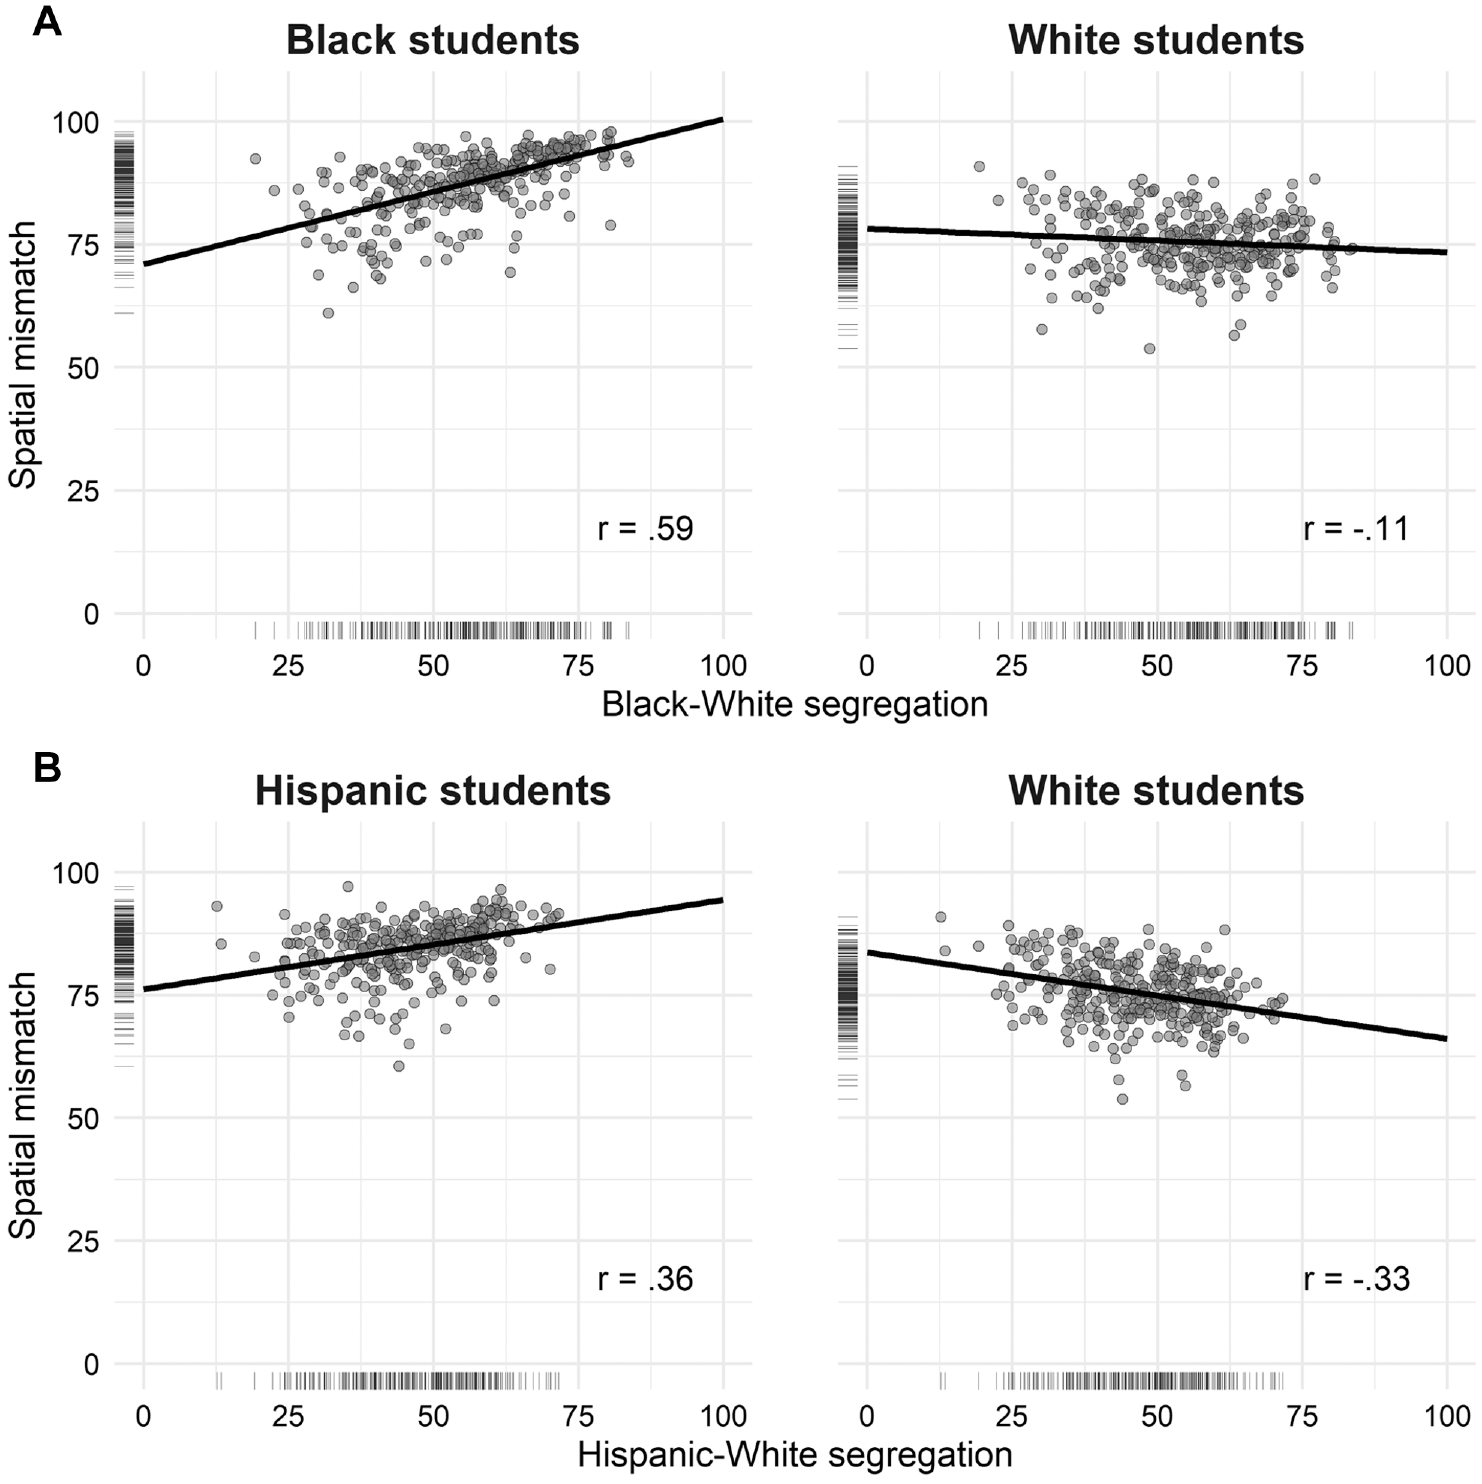
Correlation between spatial mismatch and student segregation, by race.
To further illustrate the concept of spatial mismatch, the maps in Figure 4 show the share of each tract's school-age population that is either Black or Hispanic and school locations for the Milwaukee, WI, and Colorado Springs, CO, metropolitan areas. These represent opposite ends of the spatial imbalance distribution. Segregation in Milwaukee (in which roughly half of the more than 200,000 residents ages 5 to 14 are White and about 40 percent are either Black or Hispanic) is quite high. Black-White and Hispanic-White school segregation rank at about the 99th and 95th percentiles, respectively. Additionally, as evident in Panel A, Milwaukee's high-performing schools tend to be located in tracts with lower shares of Black or Hispanic school-age residents. Milwaukee's levels of spatial mismatch for Black (97.9) and Hispanic (92.7) residents are much higher than that for White residents (69.6). On the other side of the spectrum, metropolitan areas like Colorado Springs (whose school-age population of just under 100,000 is roughly 60 percent White, a quarter Hispanic, and under 10 percent Black) show lower levels of segregation and spatial mismatch. Black-White and Hispanic-White segregation rank at about the 25th percentile. Levels of spatial imbalance from high-performing schools are also relatively lower among Black and Hispanic residents (82.6 and 82.2, respectively) and are closer to spatial mismatch among White residents (75.1). In other words, compared to Milwaukee, Colorado Springs's high-performing schools are more evenly distributed across tracts with varying shares of Black and Hispanic residents.
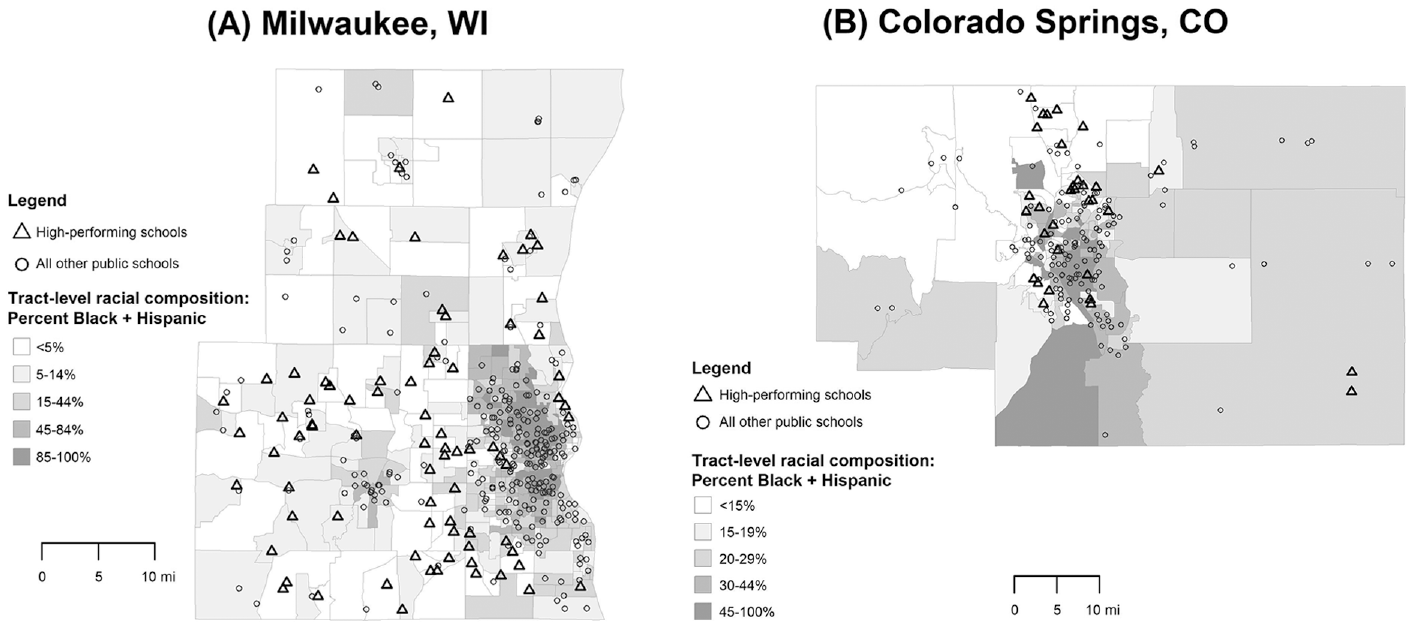
Racial/ethnic composition and distribution of high-performing public schools in two metropolitan areas.
How are these measures of segregation—of Black, Hispanic, and White students from one another and from relatively high-performing schools—related to the share of these groups enrolled in charter schools? Figures 5 and 6 provide initial, bivariate evidence for my hypotheses. Panel A in Figure 5 reveals divergent relationships between racial/ethnic segregation and the share of Black and White students attending charter schools. As school segregation increases, a higher share of Black students are enrolled in charter schools. A higher share of White students, on the other hand, are enrolled in charter schools in CBSAs where Black-White segregation is lower—that is, when they are more likely to be assigned to neighborhood district schools with Black students. The patterns with respect to Hispanic-White segregation in Panel B are similar—charter-school enrollment and segregation are positively related among Hispanic students and negatively related among White students—but appear more muted.
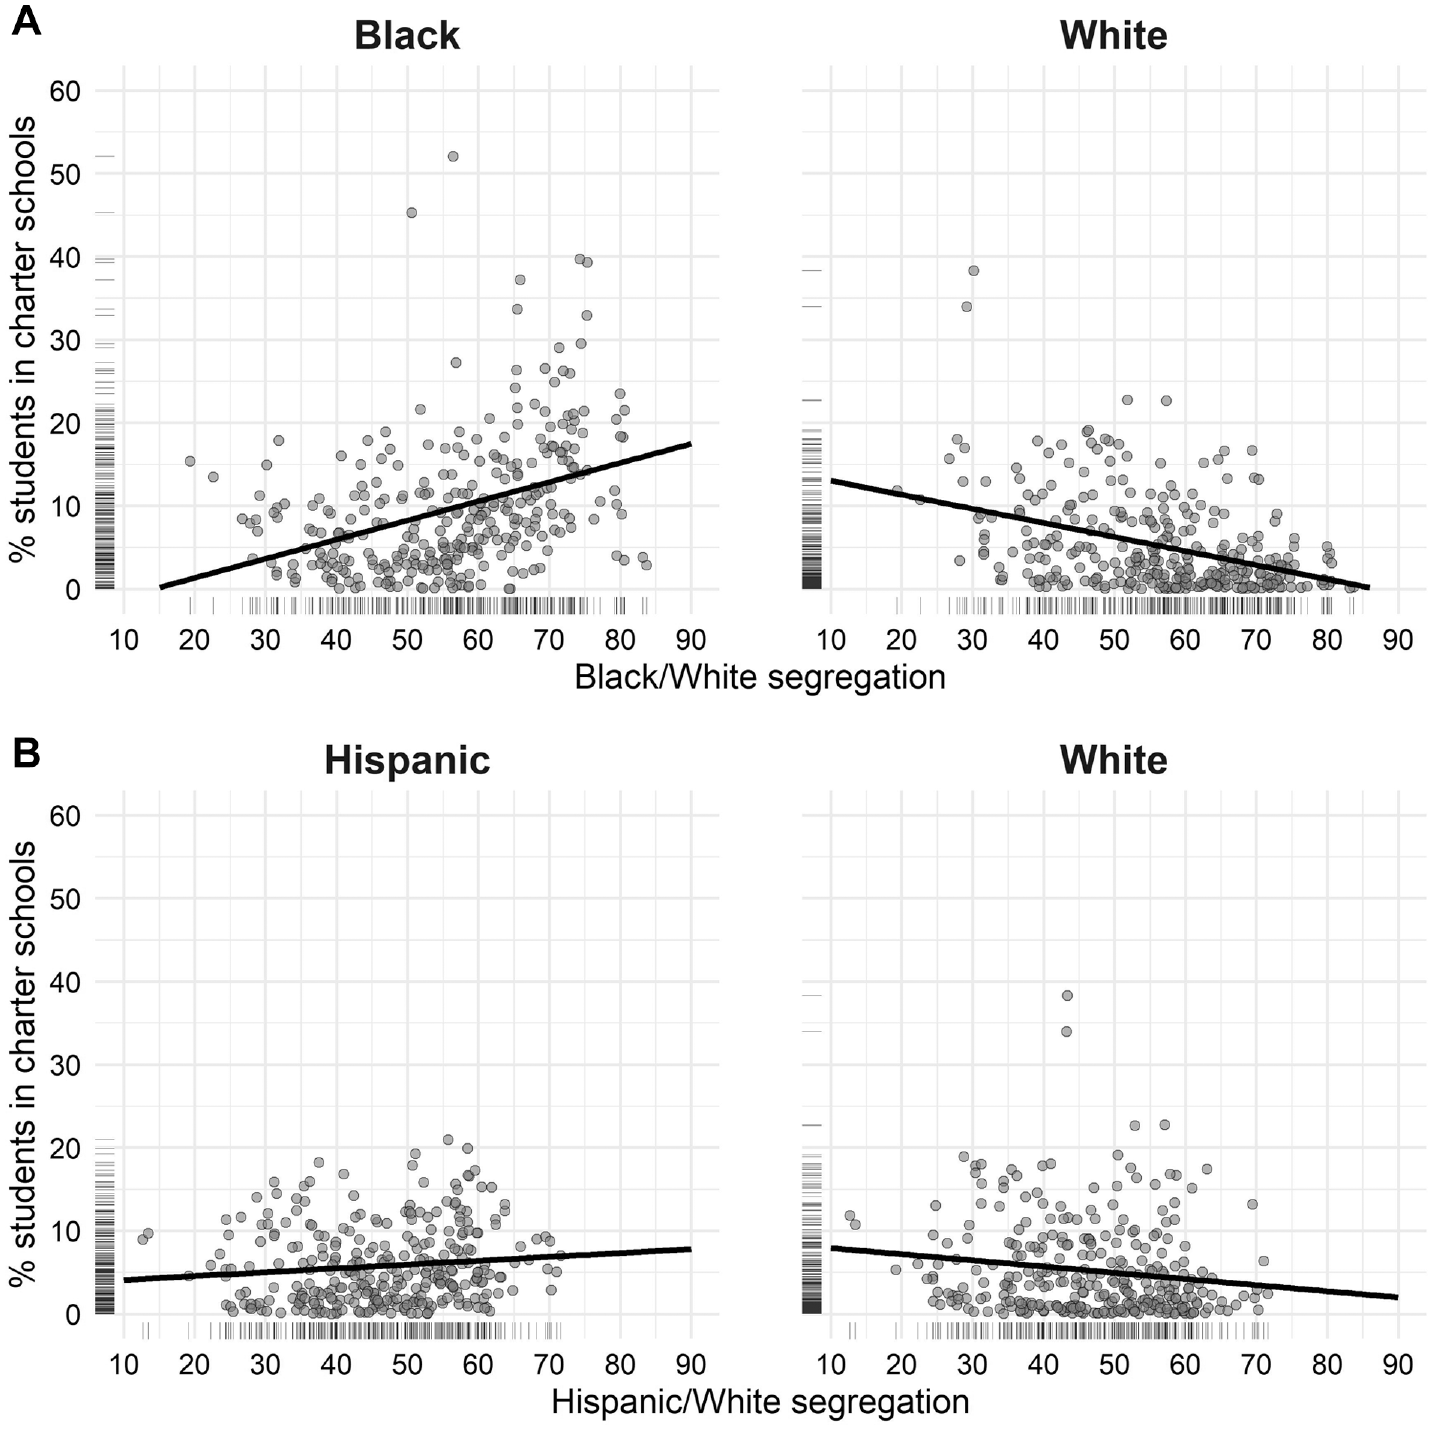
Racial/ethnic segregation and the share enrolled in charter schools, by race.
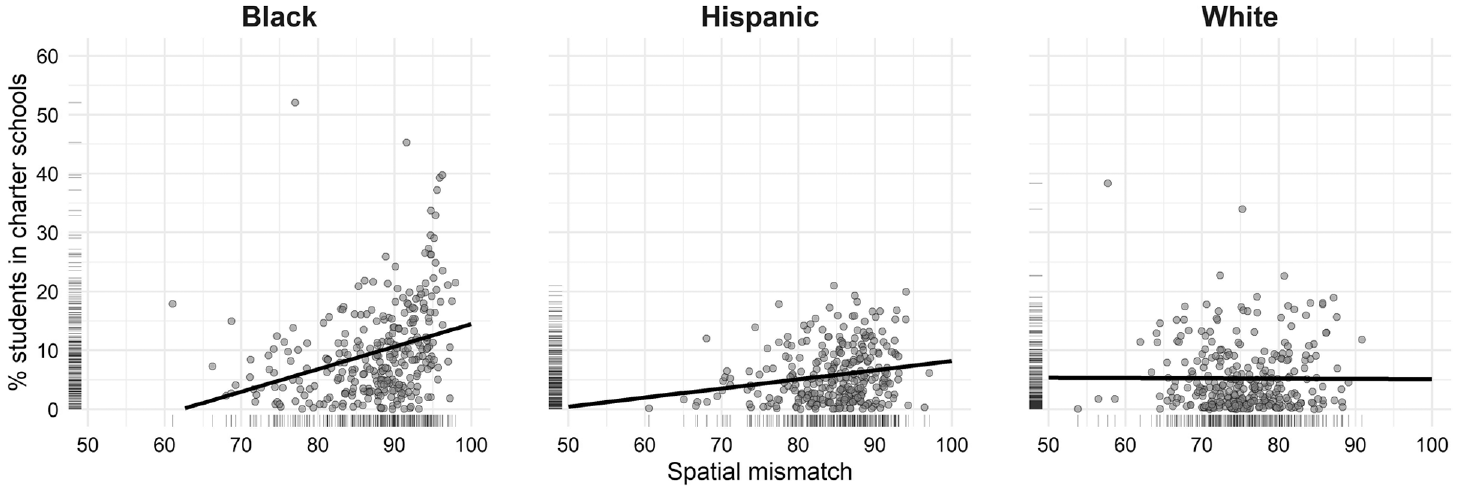
Spatial mismatch and the share enrolled in charter schools, by race.
Figure 6 suggests that spatial mismatch is positively related to charter-school enrollment for Black and Hispanic students but has no such relationship for White students. Greater shares of Black and Hispanic students are enrolled in CBSAs with higher levels of spatial imbalance from high-performing schools. White students, for whom spatial mismatch is on the whole much lower, are more likely to live in a neighborhood already served by a high-performing school, so their families may need to rely less on charter schools as a vehicle for enrolling in better schools.
Multivariable Models of Charter Enrollment
Tables 2 and 3 present estimates from the pooled cross-sectional ordinary least squares models relating measures of segregation to the share of students enrolled in charter schools. The findings are presented separately by racial/ethnic group. Table 2 focuses on the share of Black and White students enrolled in charter schools as a function of Black-White segregation, and Table 3 predicts the charter-school enrollment of Hispanic and White students using a measure of Hispanic-White segregation as a key independent variable. For the sake of parsimony, these tables do not show the estimated coefficients for the control variables (see Tables S1–S4 in the online supplement for full results).
Models 1 and 2 in Panel A of Table 2 show a positive relationship between Black-White school segregation and the share of Black students enrolled in charter schools. In Model 2, for every 1 percentage-point increase in school segregation, Black students’ enrollment in charter schools increases by 0.11 percentage points. To put that coefficient in perspective, consider two metropolitan areas: one with a relatively low level of Black-White student segregation across schools (equal to 45, at about the 25th percentile) and one with a relatively high level of segregation (equal to 65, at about the 75th percentile). Roughly 10.0 percent of Black students are enrolled in charter schools in a low-segregation CBSA, compared to 12.3 percent in a high-segregation CBSA—a difference of about 2.3 percentage points.
The relationship between Black-White segregation and White students’ enrollment in charter schools is smaller in magnitude and negative, as shown in Models 1 and 2 in Panel B of Table 2. In Model 2, for every 1 percentage-point increase in school segregation, the share of White students in charter schools decreases by about 0.09 percentage points. This confirms the hypothesis that White students’ enrollment in charter schools is lower in metropolitan areas with higher levels of segregation between Black and White students, even when controlling for other characteristics of metropolitan areas.
The share of Black students enrolled in charter schools is also positively related to a CBSA's degree of spatial mismatch (see Models 3 and 4 in Panel A of Table 2). Model 4 indicates that a 1 percentage-point increase in Black students’ spatial mismatch is associated with a 0.27 percentage-point increase in the share of Black students enrolled in charter schools. To aid in interpretation, consider again two CBSAs—one with a relatively low level of spatial mismatch among Black children (of about 84, around the 25th percentile) and one with a relatively high level of spatial mismatch (of about 95, around the 75th percentile). Approximately 10.6 percent of Black K–8 students are enrolled in charter schools in the former, while a greater proportion (13.5 percent) are enrolled in charters in the latter metropolitan area—an increase of over one-quarter. By contrast, the relationship between the share of White students enrolled in charter schools and their spatial mismatch is not statistically significant once additional CBSA-level controls are included in Model 4.
In Model 5 of Table 2, I include both segregation measures (segregation between Black and White students and the spatial mismatch between students and high-performing schools) along with the other CBSA-level controls. The relationship between Black-White segregation and Black students’ charter-school enrollment is not statistically significant. Spatial mismatch, however, remains significantly and positively related to the share of Black students enrolled in charter schools. This suggests the relationship between segregation and charter-school enrollment is mediated by spatial mismatch. Black students tend to experience higher spatial imbalance with respect to high-performing schools in CBSAs where they are also segregated from White students. But it is spatial mismatch that appears to be associated with the share of Black students enrolled in charter schools.
Neither estimate is substantially altered for White students’ charter enrollment; the association between Black-White segregation and the share enrolled in charters is negative and statistically significant, and the coefficient on spatial mismatch is nonsignificant. This confirms the lack of a correlation between the two segregation measures among White students and supports the hypothesis that enrollment in charter schools among White students may reflect the avoidance of residential assignment to schools attended by higher shares of Black students.
Turning to Hispanic students’ charter-school enrollment, Panel A in Table 3 suggests Hispanic-White segregation (Models 1 and 2) is not significantly associated with the share of a CBSA's Hispanic students enrolled in charter schools. Similar to Black students, however, a higher percentage of Hispanic students are enrolled in CBSAs where their degree of spatial mismatch is also higher (Models 3 and 4). In contrast to the relationship between Black-White segregation and White students’ enrollment in charter schools, White students appear no more or less likely to enroll in charter schools at lower levels of Hispanic-White segregation (Model 2 in Panel B). The models relating White students’ charter-school enrollment to their spatial mismatch (Models 3 and 4) are largely the same as in Table 2—save for the substitution of the percentage of students in the CBSA who are Hispanic for the percentage Black and measures of educational and poverty inequality comparing Hispanic to White residents as controls. The percentage of White students enrolled in charter schools is positively but weakly related to their spatial mismatch from high-performing schools across Models 3 through 5. Hispanic students may not be as spatially separated from White students or from high-performing schools as Black students, so the degree to which the shares of Hispanic or White students enrolled in charter schools are related to such patterns of segregation is more muted.
Conclusions
This study contributes to the growing body of research examining school and residential segregation together. Prior work shows how the expansion of school-choice policies contributes to racial/ethnic imbalances between schools and their surrounding neighborhoods, thereby deepening school segregation even as it slightly reduces residential segregation (Bischoff and Tach 2018, 2020; Candipan 2019, 2020; Rich et al. 2021; Whitehurst et al. 2017). The findings reported in this article further suggest a circular relationship. The growth of charter schools affects patterns of residential and school segregation, and current levels of segregation are related to the charter sector's public-school market share. But the share of Black, Hispanic, or White students enrolled in charter schools appears to be associated with different aspects of segregation.
The share of White students enrolled in charter schools is higher in metropolitan areas where school segregation between White and Black students is lower, a finding consistent with theories of group threat or outgroup avoidance. Black students, by contrast, experience the most severe spatial mismatch from metropolitan areas’ highest performing schools. And in CBSAs where this imbalance is especially high, a greater share of Black students are enrolled in charter schools— schools that are not limited to or assigned on the basis of the neighborhoods in which they live. Hispanic students provide an interesting liminal case: Hispanic-White segregation is lower than Black-White segregation, and Hispanic school-age children are somewhat less spatially mismatched from high-performing schools than Black children. These segregation measures are also less strongly predictive of their enrollment in charter schools.
As others have argued, school-choice policies can break the link between neighborhood and school—but often in ways that are likely to facilitate the persistence or deepening of school segregation (Candipan 2019). The link tends to be disrupted more often for White and higher-income families who are able to make use of choice options (Bifulco et al. 2009; Renzulli and Evans 2005). Although charters must generally enroll everyone who applies and run a randomized lottery in the event that applicants outnumber available seats, research has found that strategic siting, complicated admissions processes and requirements, better connected social networks, and more financial and time flexibility privilege more affluent and White families in the competition for seats (Fong and Faude 2018; Makris 2018; Makris and Brown 2020). The expansion of school choice has also imposed on families the burden of navigating growing menus of schooling options, and more advantaged families have proven more adept at accessing their metropolitan areas’ academically stronger and more selective public-school options (Roda and Wells 2013). Indeed, in an effort to attract White and more affluent families back into urban public education, following decades of flight to the suburbs and private sector, metropolitan areas and school districts have opened “prestige” charter schools. These schools feature niche instructional emphases, opportunities for parental involvement, and strong reputations (Brown and Makris 2018). They attract a disproportionate number of advantaged (mostly White) families and thus facilitate White families’ desire for schools with more White students (Billingham and Kimelberg 2013; Bischoff and Tach 2018; Denice et al. 2021).
In a similar way, this study suggests how charter schools can function as an “exit option” for White families looking to remain in the public-school system but who would prefer to avoid neighborhood public schools with higher shares of Black and Hispanic students. Charter schools are utilized by Black, Hispanic, and White families alike (and in most metropolitan areas, disproportionately by the former two groups), but the shares of these groups enrolled in charters appear related to different aspects of segregation. And as prior research suggests, Black, Hispanic, and White students enroll in different charter schools (Denice et al. 2021; Renzulli and Evans 2005; Ritter et al. 2010). Thus, segregation is not likely to be meaningfully attenuated with the expansion of the charter sector and of school-choice policies more generally.
This study is not without limitations. For instance, I rely on student proficiency rates to measure school quality. Because such measures are correlated with schools’ student composition, spatial mismatch as measured here is capturing not only differential proximity to schools that may have more resources to support student learning but also patterns of residential segregation. At the same time, although test scores are not unbiased or objective measures of school quality, they are salient to parents when they assess a school's learning environment. That is, parents take information about test scores into account when enrolling their students in schools (Denice and Gross 2016; Reback 2008), even as such metrics reflect—and parents’ use of them reinforces—patterns of segregation and achievement gaps (Gillani et al. 2021). Additionally, results were replicated when substituting a measure of spatial mismatch based on schools’ average learning rates, which are less strongly correlated with student composition (Reardon et al. 2019). Few other measures of a school's learning environment are available for the national scope of this article. Future research might consider the spatial mismatch between where children live and more qualitative, relational measures of schools’ quality, such as their climate or environment, access to tutoring and counseling, regular feedback from teachers, high expectations for students, student-teacher ratios, and (in the case of high schools) availability of high-level math courses and college preparedness (Anderson et al. 2019; Blom, Anderson, and Lindsay 2020; Cohen et al. 2009; Dobbie and Fryer 2013).
Additionally, the relatively short time frame limits the ability to track how charter enrollment responds to larger and longer-term changes in segregation and spatial mismatch within metropolitan areas. That said, during the five-year period from 2012 to 2017, the charter sector grew (from 22 to 28 schools, on average, in each metropolitan area), as did enrollment among each racial/ethnic group. Future research might compare the degree of spatial mismatch—and its relationship to charter-school enrollment—using different levels of geography, including school districts and attendance boundaries.
This study is largely focused on how the demand for charter schools (as measured by the share of students in a CBSA enrolled in them) is associated with measures of segregation. Yet supply-side factors—including charters’ tendency to open in areas not well served by the traditional public-school system and their strategic use of location to attract and retain certain types of students (Burdick-Will et al. 2013; Candipan and Brazil 2020; Makris and Brown 2020)—are also important. I included measures of the supply and clustering of charters in each CBSA, but these do not fully account for the role played by supply-side factors. The supply-side story is further complicated in urban areas that have expanded other forms of school choice (e.g., open enrollment and intra- and interdistrict transfer programs). In these places, families need not look just to charter schools to enroll in non-neighborhood public schools. This study's focus on charter schools thus likely underestimates the degree to which students and their families are exposed to and take advantage of non-local options. Still, charters remain a predominant mechanism of school choice (Farmer et al. 2020). Furthermore, while the expanding availability of public-choice options has weakened the relationship between where children live and where they attend school (Bifulco et al. 2009; Candipan 2019; Pearman and Swain 2017), this link has not been fully severed (Frankenberg 2013). Proximity remains an important barrier to access and continues to stratify students’ educational opportunities (Denice and Gross 2016; Hamlin 2018; Scott and Marshall 2019).
Finally, absent individual-level student data, I am unable to draw causal claims about the relationship between families’ neighborhood context and their choice to enroll in charter schools. However, the patterns described here, which control for a host of CBSA-level demographic and educational factors, suggest how current levels of segregation and spatial mismatch may be differentially associated with charter enrollment among Black, Hispanic, and White students. Charter schools may offer Hispanic and especially Black families living in educational deserts an opportunity to enroll their students in higher-performing schools (CREDO 2015). But to the extent that higher shares of White students enroll in charter schools when school segregation is lower and the potential to be assigned to less segregated traditional public schools is higher, as my findings and others’ suggest (Candipan 2019; Kimelberg and Billingham 2013; Roda and Wells 2013), school segregation will likely persist even as school choice expands and neighborhood segregation in metropolitan areas continues to decline.
Supplemental Material
sj-docx-1-soe-10.1177_00380407221108976 – Supplemental material for Spatial Mismatch and the Share of Black, Hispanic, and White Students Enrolled in Charter Schools
Supplemental material, sj-docx-1-soe-10.1177_00380407221108976 for Spatial Mismatch and the Share of Black, Hispanic, and White Students Enrolled in Charter Schools by Patrick Denice in Sociology of Education
Footnotes
Acknowledgements
I am grateful to the participants, three anonymous reviewers, and the editors for their constructive feedback and questions.
Authors’ Note
Prior versions of this article were presented at the Centre for Research on Migration and Ethnic Relations seminar series at the University of Western Ontario (January 2020), the Sociology of Education Association conference (February 2020), the American Sociological Association annual meeting (August 2020), and as a poster at the Population Association of America's virtual annual meeting (April 2020).
Research Ethics
This study uses publicly available secondary data on census tracts, Core-Based Statistical Areas, and schools and is thus not subject to the institutional review board for the protection of human subjects.
Supplemental Material
Supplemental material for this article is available online.
Notes
Author Biography
References
Supplementary Material
Please find the following supplemental material available below.
For Open Access articles published under a Creative Commons License, all supplemental material carries the same license as the article it is associated with.
For non-Open Access articles published, all supplemental material carries a non-exclusive license, and permission requests for re-use of supplemental material or any part of supplemental material shall be sent directly to the copyright owner as specified in the copyright notice associated with the article.