
Abstract
In this study, we examine whether students in violent neighborhoods actively avoid their local school as a form of social and physical protection. Specifically, we use 10 years of administrative data (2010–2020) from the high school choice open enrollment program in the Baltimore City Public School System to evaluate the interaction between neighborhood violence and geographic proximity when predicting choice behavior. We find that, adjusting for observed school characteristics and constant unobserved student characteristics, students from more violent neighborhoods are substantially less likely to choose their closest school than are students in safer neighborhoods; even when the closest school is listed, it is ranked lower for students from more violent neighborhoods than for students in safer ones. These findings have implications for how we think about the relationship between neighborhoods and educational opportunity in an era of choice.
Keywords
Education policy reforms over the past few decades have often focused on increasing choice for families (Berends 2021). These changes have loosened the relationship between residential patterns and school assignment and elevated the role of preferences in the distribution of educational opportunity. Sociological research on school choice dynamics has focused on the effect of these policies on school and residential segregation (Bischoff and Tach 2018), the role of student demographics in parental and student preferences (Billingham and Hunt 2016), and the effect of choice schools on achievement levels and inequality (Berends 2015). The majority of this research, however, emphasizes the distribution of schooling options rather than the role of residential conditions. Much less is known about the spatial dynamics and influence of neighborhood characteristics on students’ enrollment preferences.
A small but growing set of studies suggests enrollment patterns vary substantially by neighborhood and in somewhat counterintuitive ways (Corcoran 2018; Nerenberg 2021; Sirer et al. 2015; Yoon, Lubienski, and Lee 2018). These studies show students are actually less likely to attend their local school in the very places where we would expect the fewest economic resources for transportation and the fewest social resources needed to navigate the complex choice process. For example, students in low-income neighborhoods with high violent crime rates are less likely to attend their zoned school than are children in higher income and safer neighborhoods (Burdick-Will 2017; Nerenberg 2022). Students in high-poverty and majority non-White neighborhoods are also more likely to choose schools with fewer numbers of their neighbors or classmates (Mark, Corcoran, and Jennings 2021).
Existing explanations for why students would not attend their local school tend to focus on the uneven availability of desirable school characteristics, such as achievement scores, student demographics, or special programs, and the trade-off between “school quality” and distance. In other words, because the schools in low-income and racially isolated neighborhoods are undesirable for a number of reasons, students in those areas must travel across town to find a school that appeals to them (Denice and Gross 2016; He and Giuliano 2018). Unfortunately, this explanation does not fit the empirical patterns. Many students who attend schools outside their neighborhoods do so without any measurable improvement in school characteristics (Burdick-Will 2017; Phillippo and Griffin 2016), and low-income students seem more concerned with exiting low-performing schools than seeking out higher-performing ones (Maroulis et al. 2019).
This article takes a different approach to explain the relationship between neighborhood conditions and school preferences. Rather than focus on the characteristics of schools that pull students away, we investigate the role of neighborhood violence in pushing them out. Specifically, we use 10 years of administrative data (2010–2020) from the high school choice open enrollment program in the Baltimore City Public School System (BCPSS) to evaluate the interaction between neighborhood violence and an indicator for the closest school when predicting choice behavior. We find that, adjusting for observed school and observed and unobserved student characteristics, students from violent neighborhoods are substantially less likely to choose their closest school compared to students in safer neighborhoods; and when students do list their closest school, it is ranked lower for students from violent neighborhoods than for students in safer ones.
These findings have important implications for how we think about the geography of educational opportunity and the influence of neighborhood conditions on academic outcomes. Specifically, they call into question the idea that even with more equitable schooling options, all students would prefer to attend their closest school. Similarly, they problematize the idea that neighborhoods only affect academic outcomes directly through local school quality and suggest we need to consider indirect pathways between neighborhood disadvantage and educational opportunity. Finally, they imply that the costs of long commutes are part of the neighborhood effect on educational opportunity and need to be taken seriously as a concrete difficulty faced by students in violent neighborhoods.
Pulled Away by Specific Schools
Research shows that families of all races and income levels want to send their children to what they consider “good schools” (Rhodes and Warkentien 2017). This often includes schools with high performance rates on state test scores (Burgess et al. 2015; Denice and Gross 2016; Harris and Larsen 2015; Hastings and Weinstein 2008; Holme 2002; Lareau and Goyette 2014; Rhodes and DeLuca 2014; Weininger 2014) and higher-income and whiter student populations (Billingham and Hunt 2016; Kotok et al. 2017; Roda and Wells 2013; Saporito and Lareau 1999; Schneider and Buckley 2002). At the high school level, students also look at the academic and career opportunities a school offers, such as advanced placement classes, extracurricular programming, and sports teams (Harris and Larsen 2015; Knudson 2021; Sattin-Bajaj 2014).
All else equal, research also shows that many families would prefer to find a school with their desired characteristics nearby (Bell 2007; Burgess et al. 2015; Holme 2002; Lareau and Goyette 2014; Rhodes and Warkentien 2017). Unfortunately, “school quality” is not equally distributed across large districts. High-performing schools with more resources and more sought-after student demographics tend to be located in neighborhoods with higher-income residents (Owens and Candipan 2019). Not all schools in lower-income neighborhoods are low achieving, but patterns of residential and school segregation across the country mean that for many families, especially those with fewer resources, choosing a school often involves a trade-off between proximity and desirability (He and Giuliano 2018).
Given this uneven distribution, districts across the country have increasingly encouraged and allowed open enrollment practices that make it easier for students from any neighborhood to access a wider array of schools. This may include magnet schools with special programs or admissions criteria, charter schools, or regular schools with open-enrollment policies (Berends 2021). Many districts also offer free chartered bus service or public transportation passes to students who live beyond walking distance from their chosen school (Blagg, Rosenboom, and Chingos 2018). Because families are now less constrained by residential school assignment, the lack of desirable schools in certain areas could easily pull some students away from their local schools despite a long commute (Corcoran 2018; Sirer et al. 2015; Yoon et al. 2018).
Pushed by Neighborhood Violence
In contrast, a growing body of research on both school choice and neighborhood violence suggests the search for desirable school characteristics may not be the only reason why students avoid their local school. Students in violent neighborhoods might avoid the school closest to their home for a number of reasons. First, research shows that spending time in a violent neighborhood can be stressful because it increases your likelihood of experiencing or witnessing violence (Aizer 2008). Avoidance is therefore a key protective strategy for families in these neighborhoods (Giblin 2008). Residents avoid specific spaces and stay inside more often when they are fearful (Cobbina, Miller, and Brunson 2008; Furstenberg et al. 2000; Rosenblatt and DeLuca 2012). Students also avoid attending school when it requires walking through dangerous streets (Burdick-Will, Stein, and Grigg 2019). This type of avoidance likely extends to one's choice of school if the closest school is located in or requires traveling through a violent part of the city. Given that the closest school is also less likely to be far enough away to qualify for subsidized transportation, students are more likely to be walking to that school on potentially dangerous streets. Importantly, this mechanism does not require that the student consider the closest school itself to be unsafe, just that getting there would pose a risk.
Second, there is a social aspect to avoidance protection in high-violence neighborhoods. In a safe neighborhood, a strong sense of community might encourage students to attend the local school (Bader, Lareau, and Evans 2019); however, for children living in violent areas, residents can be wary of creating social bonds within the neighborhood due to fear they will be dragged into dangerous conflicts (Browning, Dietz, and Feinberg 2004; Chan Tack and Small 2017; Harding 2010; Sharkey 2006). In fact, people who come from places with dangerous reputations often engage in “othering” behaviors to set themselves apart from the stigmatized place (Keene and Padilla 2010). These strategies appear justified, given that young men who have close social ties to their neighbors in violent neighborhoods are more likely to be victims of violent crime than those who do not (Cwick and Doherty 2018). Avoiding the closest school may thus be a strategy used to encourage forming social bonds outside of the neighborhood and limiting social interaction with those seen as being the cause of local violence.
Finally, research shows that families often rely heavily on informal sources of information when choosing a school. For example, parents may rely on the reputations schools have within their social networks (Bader et al. 2019; Roda and Wells 2013) or make school decisions based on their own educational experiences (Bulman 2004; Condliffe, Boyd, and DeLuca 2015; Sikkink and Schwarz 2018). When making the decision on their own, students are often overwhelmed with the complexity and rely heavily on the experience of older friends and schools’ general reputations (Phillippo et al. 2021; Sattin-Bajaj 2014). This may be, in part, because valuable information about school safety (e.g., suspension rates or reported crime) is often not easily available.
This reliance on informal sources of information has three important implications for perceptions of the closest school in dangerous neighborhoods. First, students and families are more likely to have formed a concrete perception of the school closest to their house than of other schools in the district. Not only are they more likely to pass by that school in their daily activities, but they are also most likely to know neighbors with experience at those schools and to more closely associate that school with what they know (and possibly dislike) about their own neighborhood (Phillippo and Griffin 2016; Sattin-Bajaj 2014). Second, informal sources of information often have more to say about which schools to avoid than which to attend (Holme 2002; Rhodes and Warkentien 2017; Saporito and Lareau 1999), and negative reviews tend to carry more weight than positive ones (Fiske 1980). Due to the spatial stigma of particular areas, the reputation of a school close to or in a violent neighborhood is more likely to be negative than positive regardless of the school's actual performance (Smith and Smith 2006). Finally, because this is a period of intense identity formation, middle schoolers pay particular attention to how their high school choice reflects their identity and actively avoid schools known as dangerous or low performing (Phillippo et al. 2021). This may be particularly true in violent neighborhoods where social cohesion is lower (Morenoff, Sampson, and Raudenbush 2001) and students may not receive consistent messages from their social ties that create a clear “institutional compass” that helps them navigate the complicated choice process (Sattin-Bajaj 2014).
Hypotheses
Given what we know about avoidance strategies in violent neighborhoods, we expect students in higher violence neighborhoods will be less likely than their peers in safer neighborhoods to choose their closest school even after adjusting for school and student characteristics. This leads to two hypotheses:
Hypothesis 1: The probability a student will list their closest school as one of their options will decrease the higher the level of violence in their neighborhood.
Hypothesis 2: The ranking a student gives their closest school will be higher (farther from first) the higher the level of violence in their neighborhood.
Baltimore Context
Baltimore City public high schools are a good place to study the relationship between enrollment preferences and neighborhood violence for three reasons. First, all Baltimore City high schools have a ranked-choice enrollment system. There are no zoned or default schools. Instead, students submit an application ranking up to five schools (out of 25–40 participating schools, depending on the year) and then, via entry criteria, are assigned to selective enrollment schools or a lottery for oversubscribed, nonselective schools. The lack of a default option means all students must make an active choice. This provides the opportunity to explore the overall appeal of the “local” school without having to account for it being easier to enroll in than others. Second, Baltimore is a relatively small city geographically: It is an approximately 10-mile by 10-mile square with an extension around the harbor to the south. Baltimore does not provide transportation to high schools, but students who live more than 1.5 miles from school are eligible for a free public bus pass. This means students can (and do) travel across the city to any of the district's high schools (Stein et al. 2017). Finally, many neighborhoods suffer from high violent crime rates. Not only do crime rates vary dramatically across neighborhoods, but there is substantial variability in those rates from year to year (see Morgan and Pally 2016). This means there is plenty of variation across and within neighborhoods over time to detect differences in enrollment preferences.
This combination of characteristics makes Baltimore a good site for this research, but the city is by no means unique along these metrics. Ranked-choice enrollment procedures are increasingly popular in large districts, and similar programs have been established in cities like New Orleans, Washington, DC, and Denver (Wohlstetter and Zeehandelaar 2015). Similarly, although Baltimore's size makes it different from the largest urban areas in the country, it is comparable to many other midsized or small cities in offering a range of geographically accessible options. Finally, high rates of violent crime are not unique to Baltimore. In 2017, Baltimore ranked third nationwide in terms of its total violent crime rate per 100,000 residents, comparable to St. Louis, Detroit, Memphis, Kansas City, Milwaukee, and Cleveland (FBI 2019). Therefore, we have reason to believe our findings may be generalizable to other similar districts.
Data and Measures
Student data for this study come from administrative records archived at the Baltimore Education Research Consortium. These records include basic demographics, participation in programs, and academic outcomes. Choice forms document the ranked preference for every student who participated in the high school choice program.
The student records also include an address of record for each student. We use these addresses to calculate the straight-line distance between every student and every school. We then rank those distances to determine the closest possible school. We consider this to be students’ local school and the school they would most likely be zoned to if Baltimore had high school catchment areas. This is the school students are most likely to have contact with as passersby or through their social networks. It is also the school most likely to be closely tied to the reputation of their own neighborhood. In cases where multiple, colocated schools would be a student's closest option, all colocated schools are counted as the student's closest. 1
To provide a proxy for students’ socioeconomic background, we generate an index of neighborhood advantage using census data from the 2006–2010 through 2015–2019 American Community Surveys. Given the high levels of racial and economic segregation in Baltimore, individual characteristics are likely to be highly correlated with neighborhood characteristics (Brown 2021). The index includes the standardized sum of proportion of female-headed households, welfare receipt, unemployment, and poverty minus the sum of the proportion of college-educated residents, average household income, professional occupations, and homeownership. We then assigned census characteristics to students based on the census tract they lived in during the final year of the five-year census window.
We also use student address records to link students to neighborhood boundaries defined by the Baltimore City Department of Planning. We use these boundaries to aggregate annual crime data because they are well recognized and socially meaningful boundaries. The city has 278 official neighborhoods, compared to 200 census tracts. The presence of the harbor (see Figure 1) creates some unique transportation challenges for students living in the peninsula and south of the harbor. Therefore, we create a dummy variable for students living in these neighborhoods.
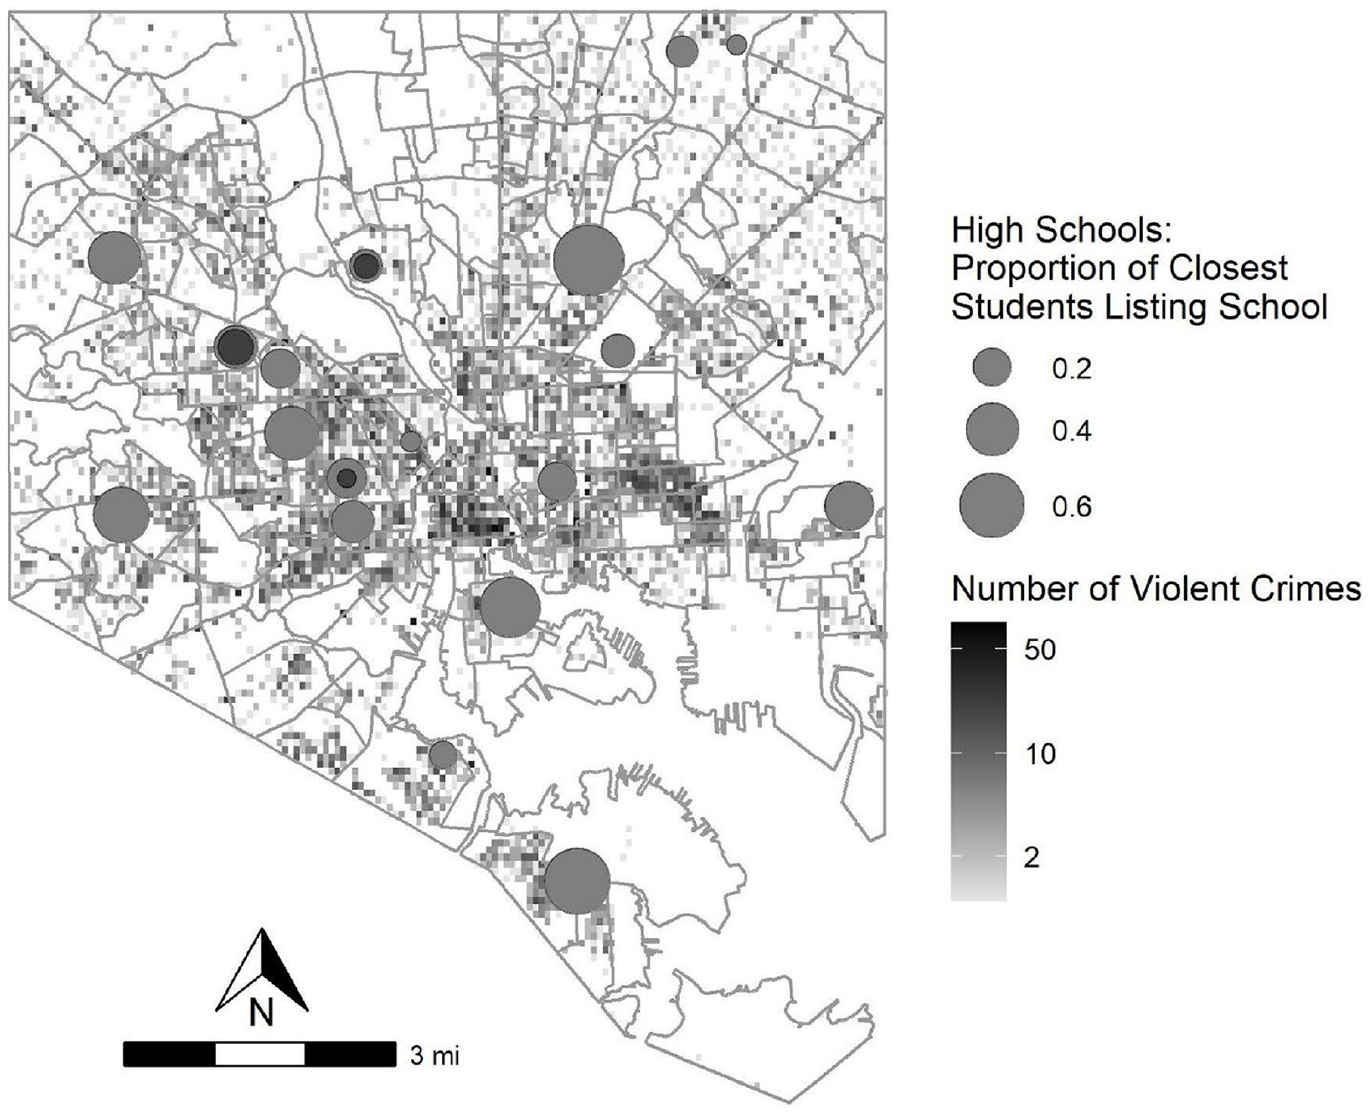
Distribution of interest in Baltimore Public High Schools and violent crime (2018–2019).
Crime data for this study come from incident reports of victim-based crimes published by the Baltimore Police Department (2020) on the Open Baltimore Data Portal for 2010 through 2019. This data set includes the date, time, location code, and description of all officially reported incidents during this time period. Violent crimes include all assaults, robberies, rapes, shootings, and homicides. Our analysis centers on the count of violent crimes within each neighborhood in each calendar year. Students select their schools and submit their applications in early January, so the prior calendar year best captures their recent neighborhood violence exposure. Given the skewed distribution of exposure to violent crime, we transform the count of neighborhood violent crimes using the inverse hyperbolic sine (IHS) function. This transformation is frequently used when modeling wealth and has the benefit of a similar interpretation as the log transformation, but it can be used when values include zero (Burbidge, Magee, and Robb 1988). This means the coefficients represent approximate percentage change in exposure rather than an increase in a specific number of crimes.
Finally, we gather a variety of measures of high school quality and available programs. All these measures are publicly available through the Maryland Report Card website and the BCPSS choice guide and are taken from the year that would be available to students while making their decisions during the winter of eighth grade. These include student racial composition and school size; measures of academic rigor, such as the algebra proficiency rate, four-year cohort graduation rate, and the college enrollment rate; and indicators for the availability of special programs at each school, including career and technical education (CTE) for STEM programs (e.g., health or engineering), CTE for non-STEM programs (e.g., construction or cosmetology), advanced placement (AP) or honors classes, English as a second language (ESOL), Junior Reserve Officers’ Training Corps (ROTC), varsity sports, and on-site childcare. During our study period, 12 schools opened and thus do not have algebra proficiency data until there are 10th-grade students to take the test or graduation and college-going rates until their first cohort finishes. Rather than drop these schools from the sample, we give those observations the mean value of the sample in that year and add an indicator variable for the years they have missing data.
Analytic Sample
We begin by taking the 48,974 eighth-grade students who submitted a high school choice form for the first time and listed at least one valid high school during the academic years 2010–2011 to 2019–2020. We include only the first submission of a choice form because we want to limit our sample to just one observation per student and we want to examine students’ preferences prior to any experience with the system. Including repeat eighth-graders’ subsequent choices does not substantively change the results. We exclude the 1,010 students who do not live in Baltimore City or cannot be found in the enrollment and address files. An additional 3,217 students cannot be found in the standardized test score files. We then exclude the four highly selective college-prep schools. Students are accepted to these schools based on prior test scores and grades instead of a lottery, and they are qualitatively different from the rest of Baltimore's high schools. The final analytic sample excludes the 3,775 students who only chose one of these highly selective schools. The overall conclusions are remarkably similar with and without excluding selective-enrollment high schools, but we feel it makes the most analytic sense to focus on the set of schools that are open to everyone. Three specialized magnet high schools (one for the arts, another for design, and a third for early college) and four charter high schools have their own admissions processes. We do not know who applied to these schools, but using ninth-grade enrollment records, we create an indicator for students who enroll in a school that does not participate in the choice program.
The final analytic sample includes 1,095,338 student–school combinations from 40,972 students living in 259 neighborhoods and choosing between 37 high schools. Schools that show up on a student's choice form have a 1 for the variable listed; schools that do not show up have a 0. A rank variable indicates students’ preference for that school, with lower numbers indicating a higher preference. Some schools have multiple programs that students can apply for. Rather than list each program separately, we include one row per school and assign it the highest ranking of any of its programs.
Methods
Students in different neighborhoods vary in terms of family background and prior academic achievement but also the distribution of nearby schools. To account for this distribution, we use a discrete response choice model (McFadden and Train 2000) and fit a student-level conditional logit (equivalent to a student fixed effect; Chamberlain 1980) that allows us to predict the probability students will choose specific schools from their available options based on the school's observed characteristics. Because options are only compared within students, this model accounts for student characteristics that are constant across all their school options, such as year of choice, race, and middle school test scores. Neighborhood violence is also constant within students because we only use the first-choice form submission for each student and only have one address per year.
To determine whether there is a difference in the likelihood of listing the closest school by neighborhood violence, we include an interaction between the closest variable and neighborhood violence. A negative coefficient will indicate that students in more violent neighborhoods are less likely to choose their closest school than students in safer neighborhoods. Before constructing this interaction, we mean-center the violence measure. This allows the main closest coefficient to represent the probability of listing the closest school at average levels of neighborhood violence and allows for easier comparison across models (Wooldridge 2015). Because this difference could be due to the spatial distribution of their options and the fact that students in more violent neighborhoods tend to have somewhat closer options than do students in safer neighborhoods, we include a measure of logged straight-line distance from students’ address to each school. 2 In subsequent models, we include all of our school characteristics that are specific to that option in the year decisions were made, including an indicator for whether the student would be eligible for a subsidized transit pass for that school. This allows us to adjust for the distribution of programs, demographics, and achievement at each school that would make it more or less popular for students across the city. The final models include an interaction between the closest school indicator and our student-level characteristics. This allows us to adjust for variation in the likelihood of choosing the closest school by different types of students.
The formal model is as follows:
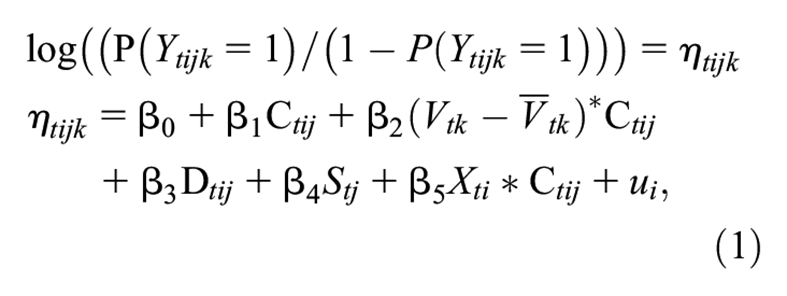
where Ytijk is an indicator for whether or not student i living in neighborhood k listed school j in their year t choice form, C tij is the indicator for whether school j is the closest option for student i in year t, V tk is the IHS-transformed measure of violent crime in neighborhood k in year t, D ti is the logged distance to school j for student i in year t, Stj are time-varying characteristics of school j in year t, Xti are the individual-level characteristics of student i during school year t, and ui are fixed effects for each student.
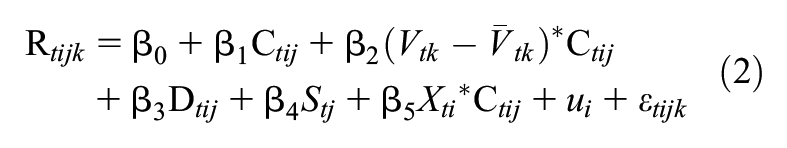
We use the same predictors to estimate a student fixed-effects regression for the ranking of each school given that it is listed on the choice form (R tijk ). ϵ tijk are the observation-level error terms. All standard errors in both models are robust and clustered at the student level.
Results
Descriptive Summary
Figure 1 maps the geographic distribution of violent crime, high schools, and the probability of listing the closest school (2018–2019). To map total crime, we divide the city into equally sized squares and calculate the number of crimes in each square. Darker shading indicates a higher number of violent crimes in that area. Central Baltimore has the highest concentration of violent crime, with pockets of violence scattered across the western and eastern sides of the city. The central portion of north Baltimore and some of the more industrial areas in south Baltimore have very few incidents of violent crime. Crime rates tend to jump at neighborhood boundaries, suggesting these lines represent real social boundaries between communities.
High school locations are represented by circles of varying sizes. Colocated high schools are shown as two overlapping circles. The distribution of schools is uneven across Baltimore. The greatest concentration of high schools is near the generally higher crime areas slightly west of central Baltimore. The edges of the city and the east side have fewer options. A handful of schools are colocated, but in general, schools are relatively far from each other. Circles for each school are sized by the proportion of their closest students who listed that school, with larger circles indicating a higher proportion of local students choosing that school. Specifically, we assigned each student to their closest school and then calculated the proportion of those students who list the school. Variation in the size of the circles indicates that some schools attract around 70 percent of their closest students, whereas others attract only one tenth of nearby students.
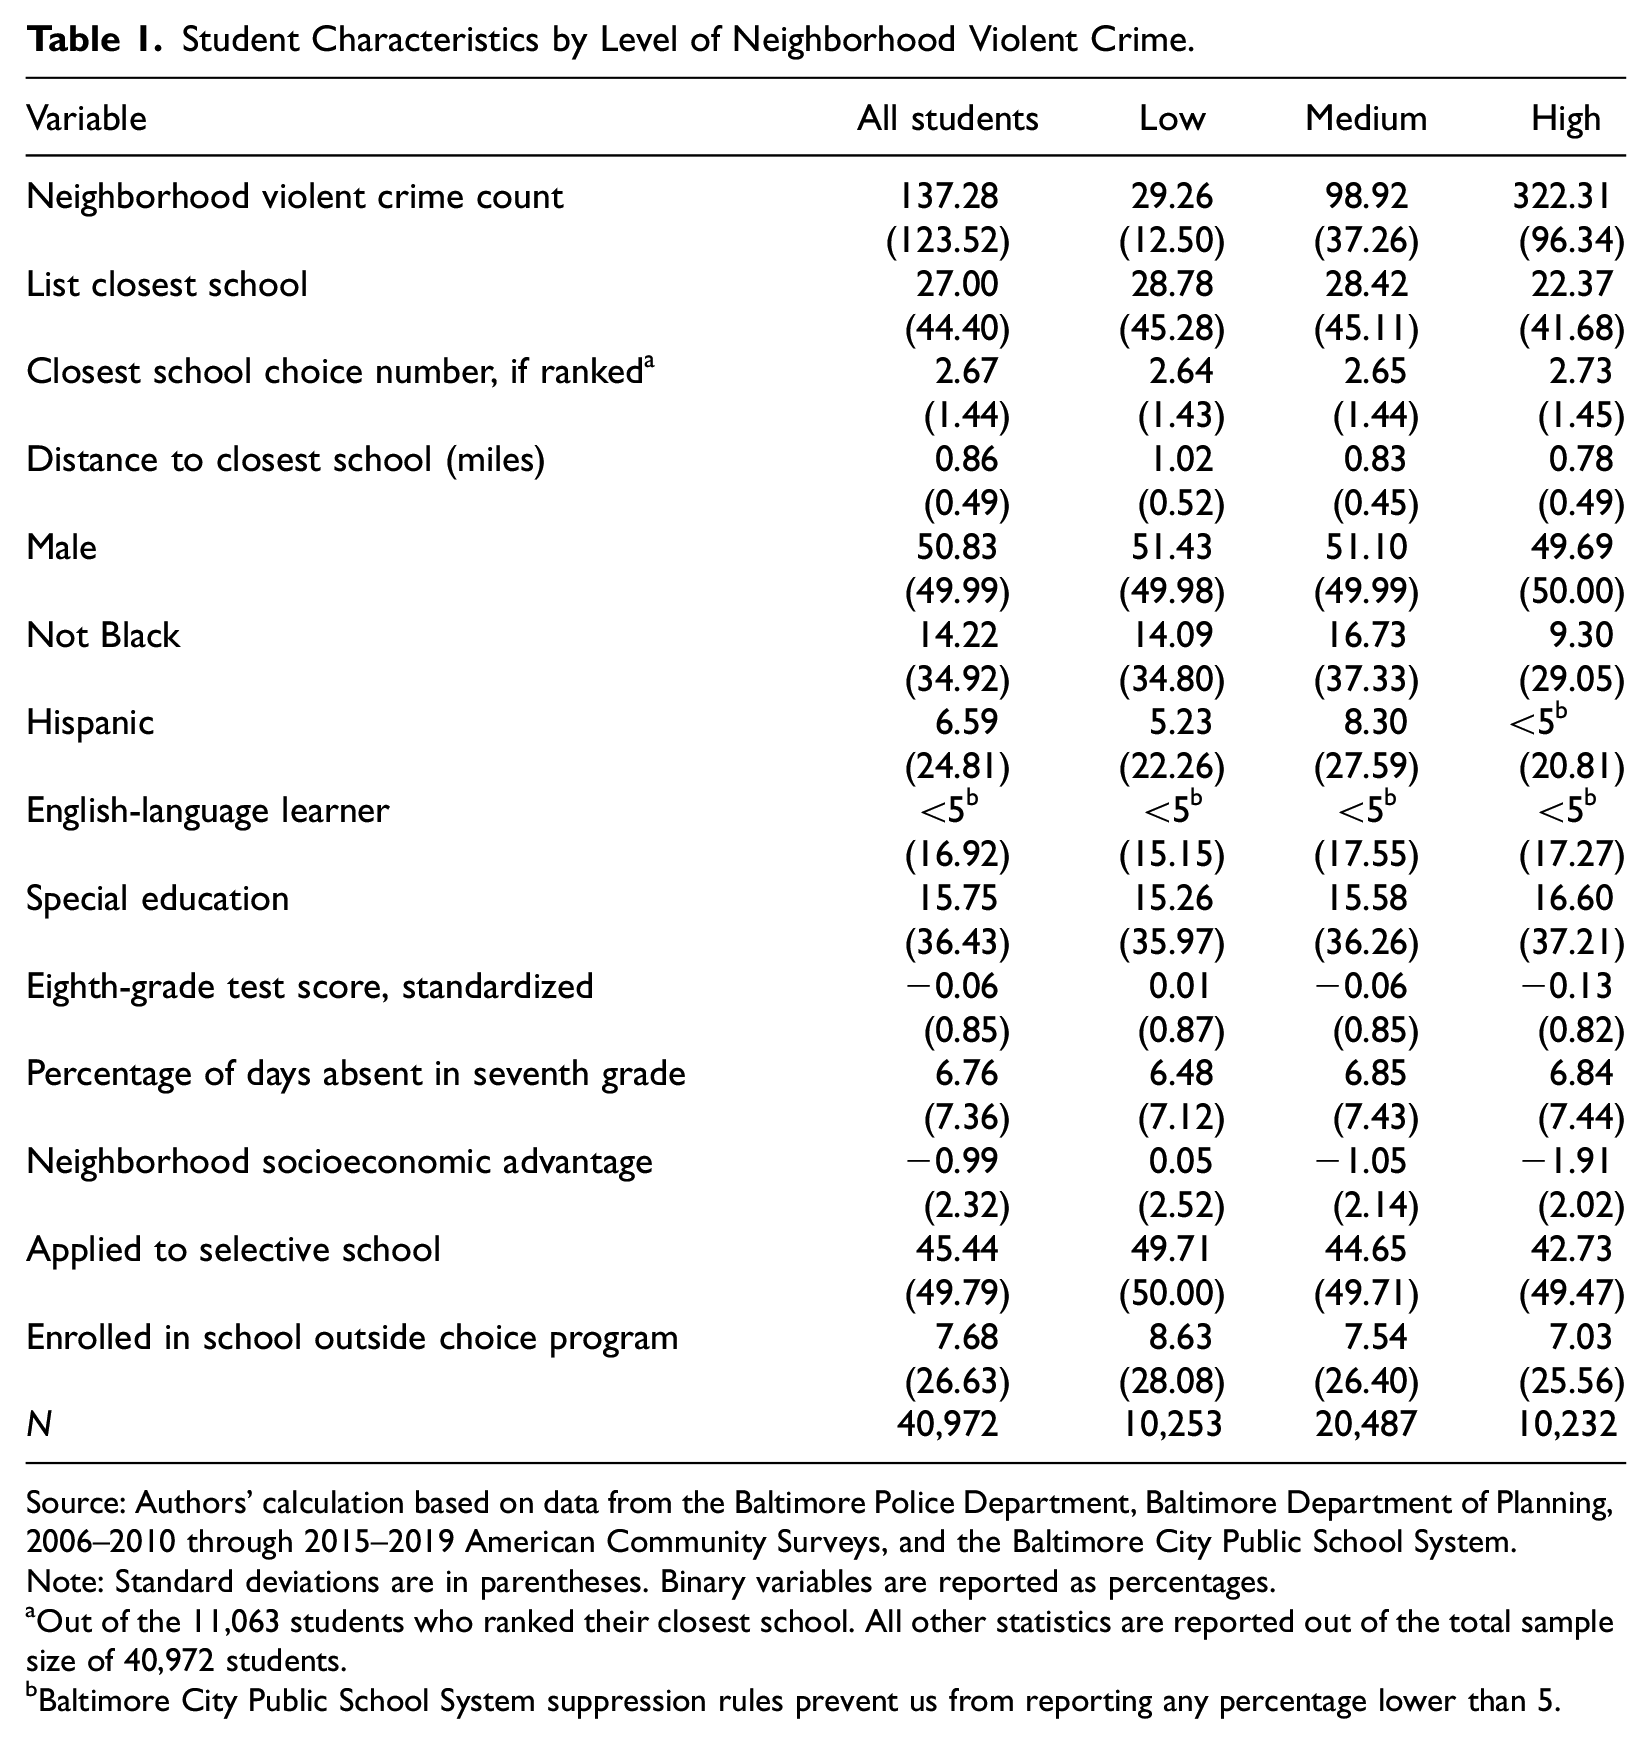
Table 1 describes the students who live in these neighborhoods in more detail. Students in the analytic sample are divided based on the level of violence in their residential neighborhood. There is wide variation in the average violence levels across neighborhoods, with students in the highest violence neighborhoods exposed to 322 violent crimes a year, on average, and those in the lowest violence neighborhoods exposed to only 29 violent crimes a year, on average. However, there is limited variation in student characteristics between the second and third violence quartiles, so we collapse them into a single column to emphasize how students living in the highest violence and lowest violence quartiles compare to those in the middle.
Student Characteristics by Level of Neighborhood Violent Crime.
Source: Authors’ calculation based on data from the Baltimore Police Department, Baltimore Department of Planning, 2006–2010 through 2015–2019 American Community Surveys, and the Baltimore City Public School System.
Note: Standard deviations are in parentheses. Binary variables are reported as percentages.
Out of the 11,063 students who ranked their closest school. All other statistics are reported out of the total sample size of 40,972 students.
Baltimore City Public School System suppression rules prevent us from reporting any percentage lower than 5.
Overall, students in the analytic sample are about evenly split between males and females, the vast majority are Black, a little less than 16 percent qualify for special education services, and fewer than 3 percent are English-language learners. Compared to students living in less violent neighborhoods, students in the highest-violence quartile are somewhat more likely to be Black, have lower standardized middle school test scores, and are somewhat less likely to list selective enrollment high schools or attend a school outside the regular choice system.
As seen in Figure 1, students in the most violent neighborhoods tend to live in areas with a denser volume of schools and therefore tend to be slightly closer to their nearest high school. However, these students are less likely to list their nearest school in their ranked choices. Only about 22 percent of students living in the most violent neighborhoods list their nearest school as one of their choices compared to nearly 29 percent of students living in the lowest violent crime neighborhoods. Similarly, if students do rank their closest school, those in high-violence neighborhoods list it somewhat higher (2.73) compared to students in low-violence neighborhoods (2.64); that is, in high-violence neighborhoods, students tend to rank their closest school slightly lower on their preference list.
Table 2 describes the variation in the schools available to students in different parts of the city. Each high school–year combination is treated as a unique observation in this table to allow for year-to-year variation in school characteristics. Similar to Figure 1, we assigned each student to their closest school and assigned each school the average level of neighborhood violence for each of these nearby students in that year. In doing so, we account for a school being the closest option for students from multiple neighborhoods, each with different levels of violent crime. As in the student descriptive table (Table 1), the 266 high school to school year combinations are divided into four quartiles based on incidents of violent crime in the school's vicinity, but the two middle categories are combined to highlight the differences in schools serving high- and low-violence areas.
School Characteristics by Quartiles, Level of Local Violent Crime.
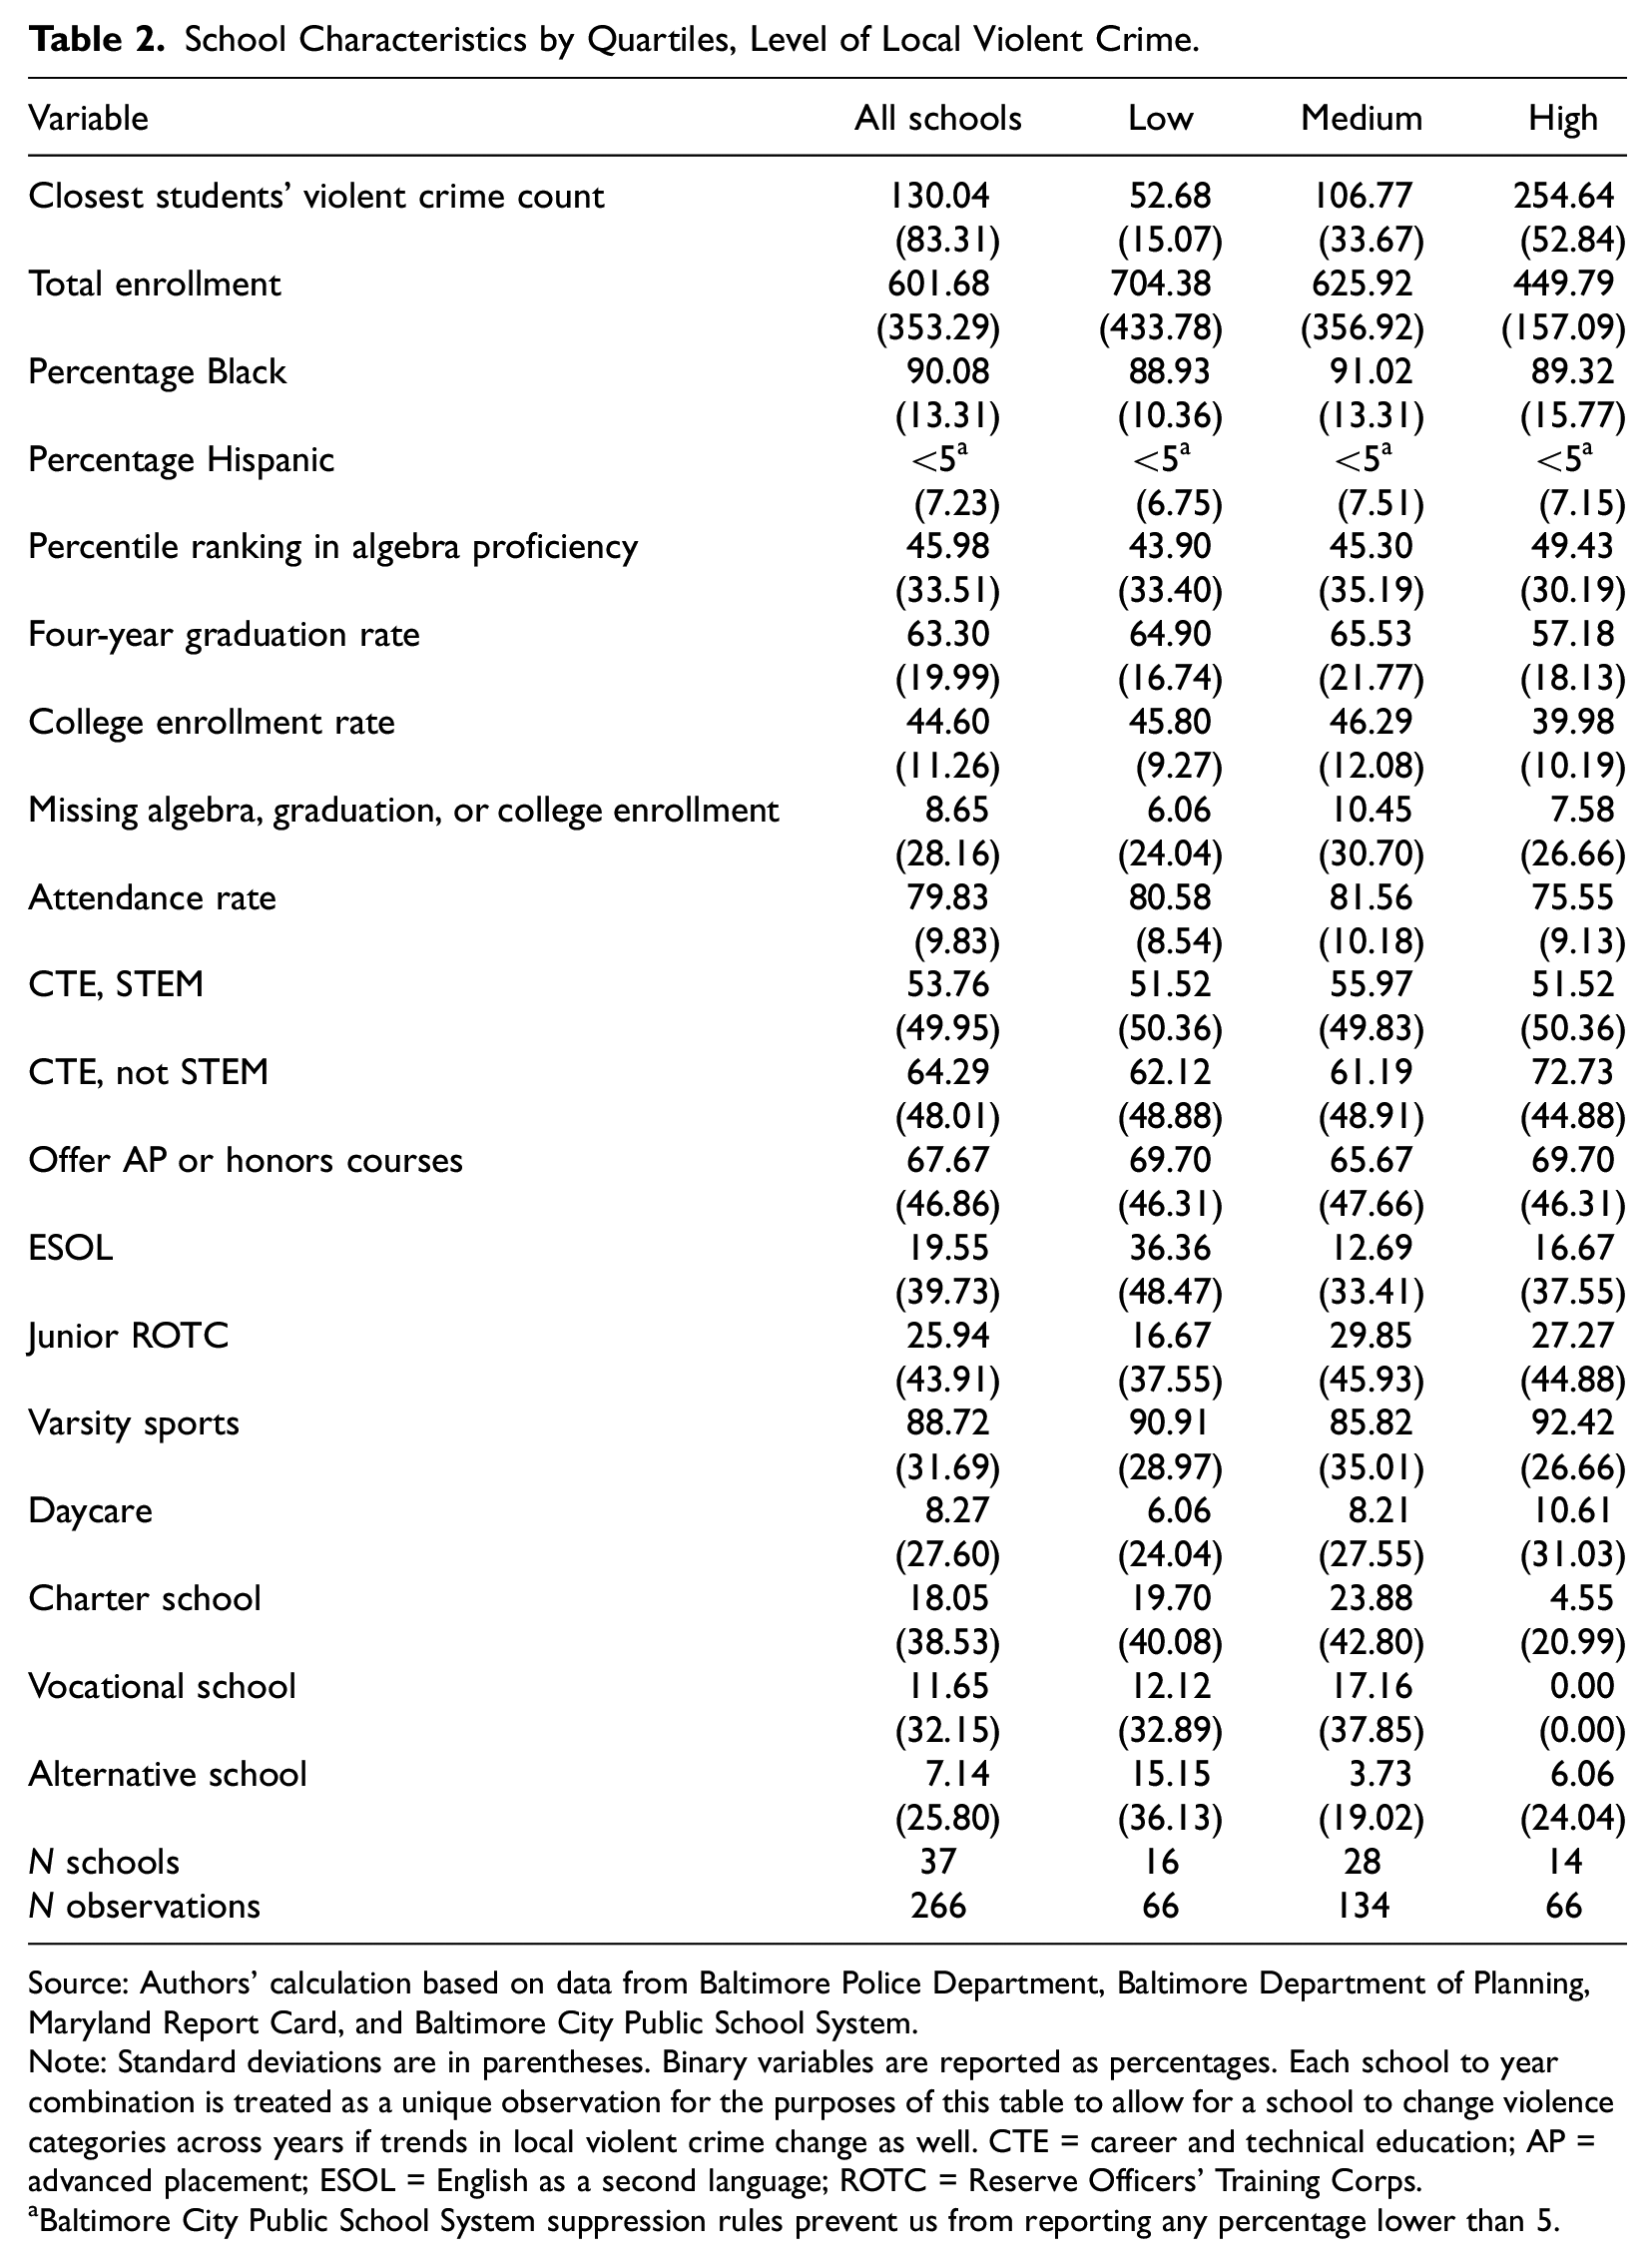
Source: Authors’ calculation based on data from Baltimore Police Department, Baltimore Department of Planning, Maryland Report Card, and Baltimore City Public School System.
Note: Standard deviations are in parentheses. Binary variables are reported as percentages. Each school to year combination is treated as a unique observation for the purposes of this table to allow for a school to change violence categories across years if trends in local violent crime change as well. CTE = career and technical education; AP = advanced placement; ESOL = English as a second language; ROTC = Reserve Officers’ Training Corps.
Baltimore City Public School System suppression rules prevent us from reporting any percentage lower than 5.
High schools in the analytic sample have a mean enrollment of 602 students. On average, these schools have an attendance rate of nearly 80 percent, a 63 percent graduation rate, and almost 45 percent of their graduates enroll in college. Of the school-years in the analytic sample, nearly 90 percent offer varsity sports, over half have a STEM-based CTE program (with even more offering a non-STEM CTE program), just over two thirds offer AP courses or an honors program, but less than a quarter offer ESOL. Just under 20 percent of these schools are charters, just over 10 percent are vocational schools, and less than 10 percent are alternative schools.
There is substantial variation in school quality and the programs offered. The schools in the highest violence quartile have the lowest average enrollment, about 450 students, compared to a mean of about 704 students for schools in the lowest violence quartile. On average, schools in the highest violence quartile have lower attendance rates, lower graduation rates, and lower college enrollment rates compared to schools in the lowest violence areas. They are nearly half as likely as schools in the lowest violence quartile to offer ESOL, and they are much less likely to be a charter, vocational, or alternative school. These schools also have a somewhat higher percentile ranking in algebra proficiency and comparable STEM CTE program and AP or honors availability and are more likely to offer non-STEM CTE programing, more likely to have a daycare, and almost twice as likely to have Junior ROTC. In other words, the mix of programs and specialties varies across the city.
Listing the Closest School
Table 3 shows the results of the choice models. Model 1 estimates whether, holding distance constant, students are more or less likely to list their closest school in safer and more dangerous neighborhoods. (As a reminder, the main effect of neighborhood violence on the outcome cannot be estimated because it does not vary within students.) In neighborhoods with average levels of violent crime, students tend to avoid their closest school (β = −0.32, p < .001), and the coefficient for the interaction term is also negative (β = −0.29, p < .001). Because coefficients in logistic regressions can be hard to interpret, we focus on the predicted probability of choosing different types of schools in different types of neighborhoods. In this model, the predicted probability a student from one of the safest neighborhoods (approximately 10 incidents per year) will choose their closest school when it is 0.86 miles away (the average distance for closest schools) is 0.18 but only 0.08 for students from very violent neighborhoods (approximately 550 incidents per year). This represents around a 10 percentage-point difference in the probability a student would list their closest school in these different neighborhoods. For reference, the predicted probability that either student would list something other than their closest school is 0.16. 3
Conditional Logistic Regression Predicting School Listing.
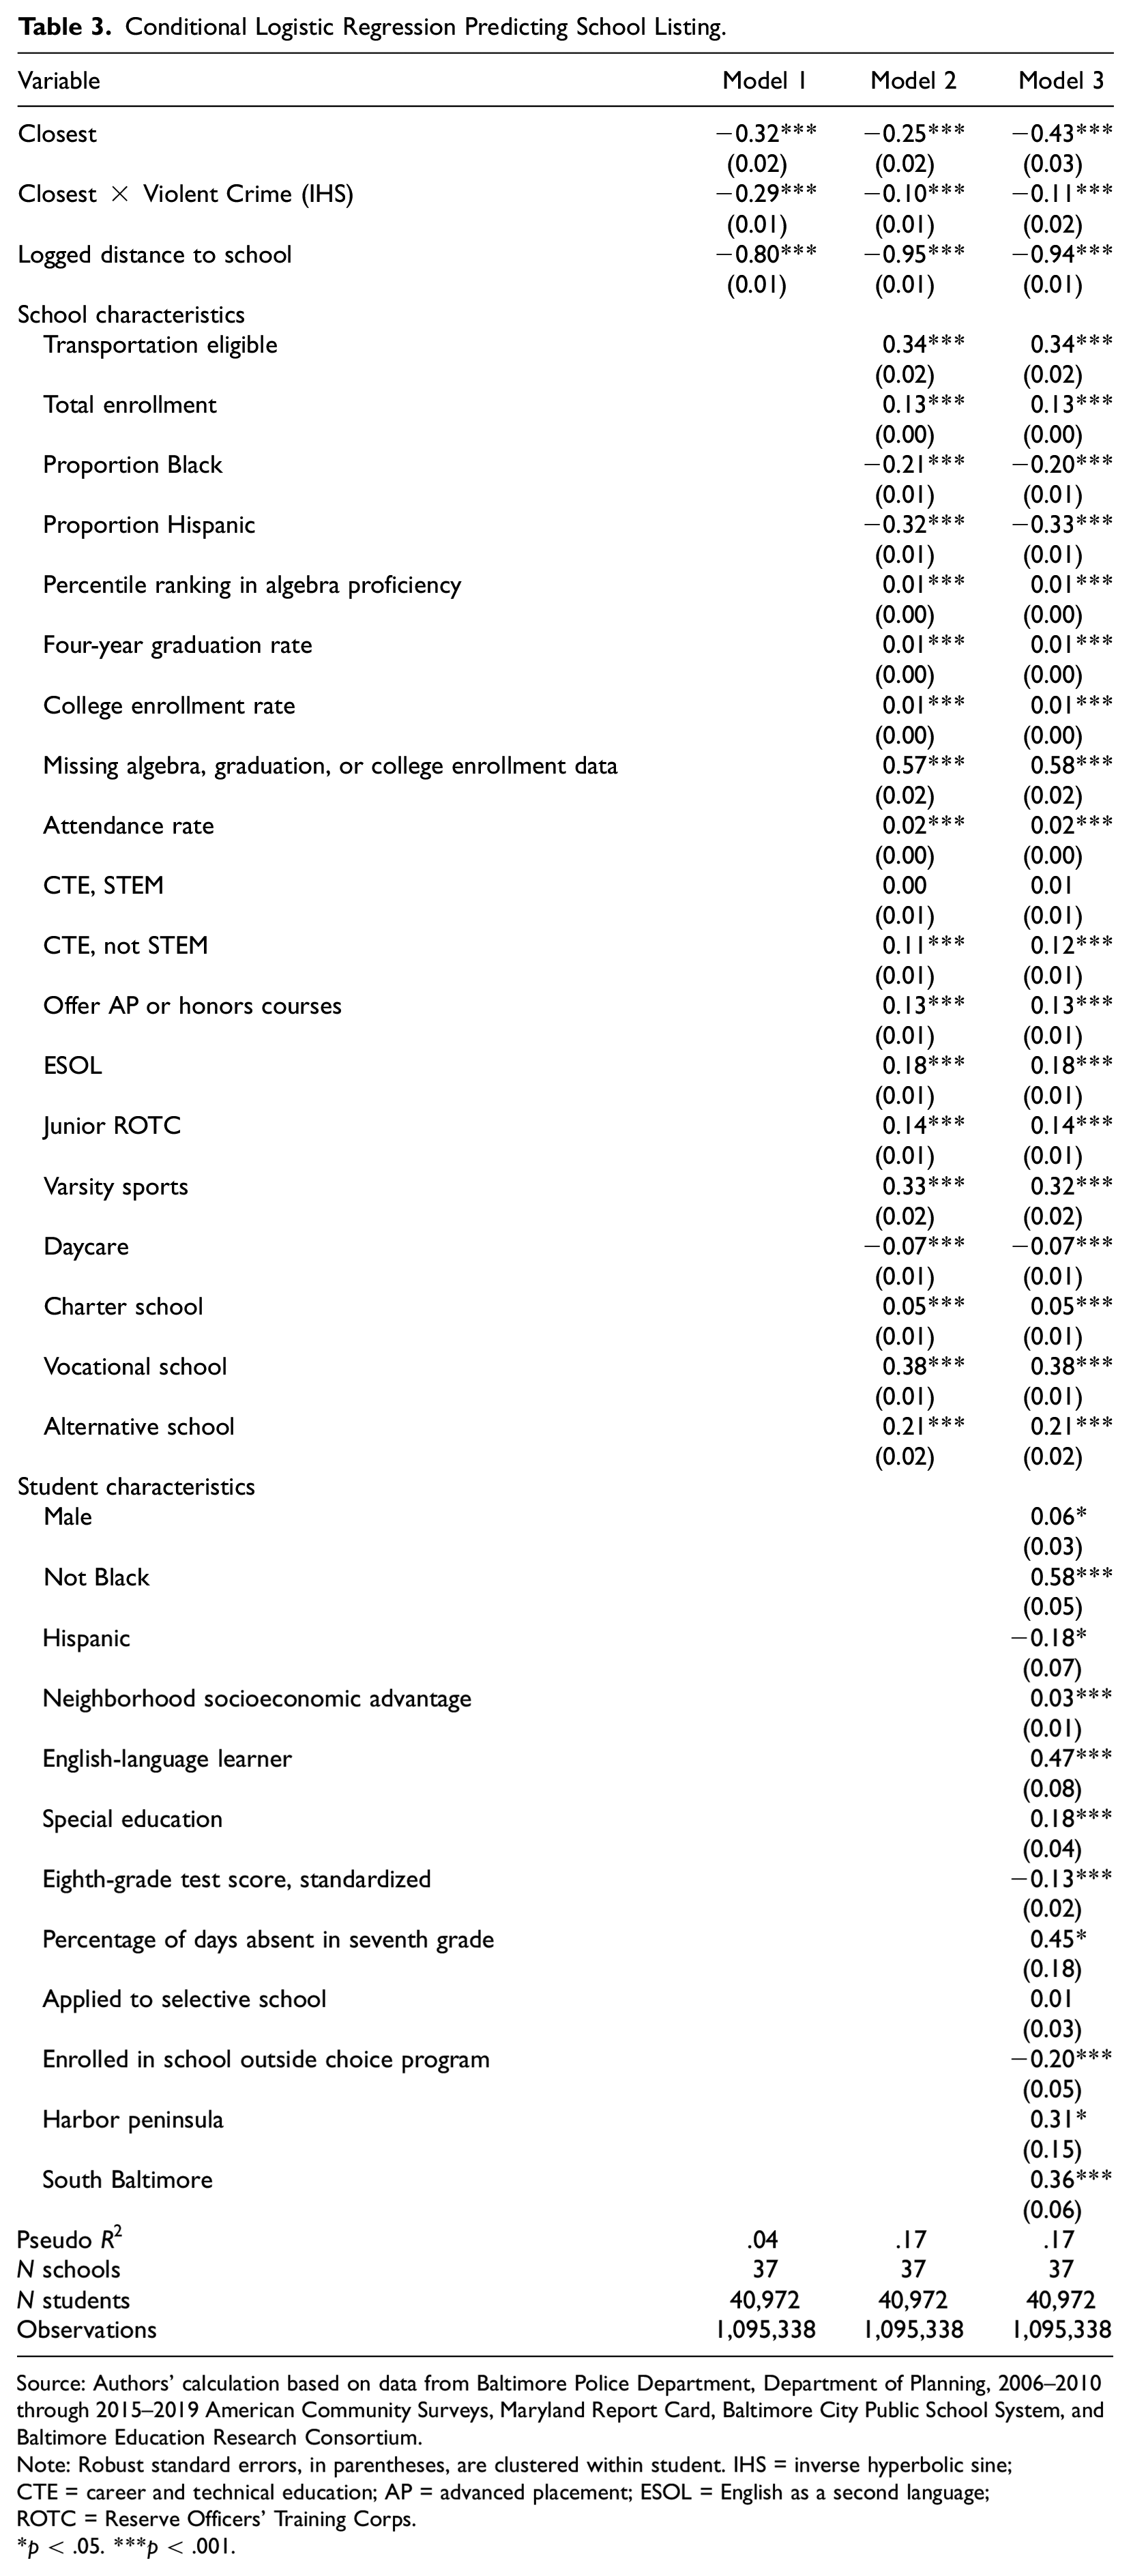
Source: Authors’ calculation based on data from Baltimore Police Department, Department of Planning, 2006–2010 through 2015–2019 American Community Surveys, Maryland Report Card, Baltimore City Public School System, and Baltimore Education Research Consortium.
Note: Robust standard errors, in parentheses, are clustered within student. IHS = inverse hyperbolic sine; CTE = career and technical education; AP = advanced placement; ESOL = English as a second language; ROTC = Reserve Officers’ Training Corps.
p < .05. ***p < .001.
The first model does not account for any school characteristics except distance. It is likely that part of the difference in preference for the closest option is due to differences in the characteristics of schools that are close to different neighborhoods. Model 2 adds schools’ observed characteristics. The magnitude of the interaction between neighborhood violence and closest school in Model 2 (β = −0.10, p < .001) is substantially smaller than that of Model 1, suggesting much of the reason why students in violent neighborhoods do not list their closest school is there are schools with more popular characteristics farther away.
An additional concern could be that perhaps students who live in violent neighborhoods are different from those in safe neighborhoods in ways that would change their choice behavior. For example, if students in safer neighborhoods are higher achieving, they may be attracted to different schools than lower achievers. Therefore, Model 3 adds an interaction between each of our individual student characteristics and the closest school. This will tell us which kinds of students are more likely to list the closest school, and we can adjust our estimate of the violence interaction accordingly. Interestingly, the coefficient for the neighborhood violence and closest interaction does not change in any meaningful way after adjusting for these interactions (β = −0.11, p < .001). To predict the probability of listing a school, we now hold both school and student characteristics at their mean. On average, this model predicts that students with average characteristics in safe neighborhoods will list their closest school with average characteristics 13 percent of the time, whereas students with average characteristics in violent neighborhoods will list their closest school with average characteristics only 10 percent of the time. For students at all violence levels, schools with average characteristics that are not the closest are more likely to show up on an average student's form (probability = 0.16).
Ranking the Closest School
Table 4 shows the same progression of models, but instead of a logistic regression predicting the probability of listing a given school, we now predict the ranking among schools that are listed. This limits the number of observations to no more than five per student, and it limits our sample to students who list a closest school; students who do not list the closest school do not contribute to the estimates because there is no within-student variation in the closest indicator. Students give their first choice a 1, so higher numbers mean the school has a lower rank. Model 1 shows the interaction between neighborhood violence and closest school and shows that adjusting for distance, every time the violent crime count doubles, the ranking of the closest school is predicted to be 0.12 (p < .001) points higher. This interaction coefficient is reduced by a little over half to 0.05 (p = .004) in Model 2, when school characteristics are added. When we add individual characteristics in Model 3, the coefficient for the neighborhood violence interaction is essentially the same (β = 0.06, p = .005). This means the average predicted rank for the average nonclosest school by the average student is 2.67. In safe neighborhoods, the comparable student would rank the comparable school 2.72, but in violent neighborhoods, the comparable student would rank the comparable school 2.90.
Student Fixed-Effects Regression Predicting School Ranking.
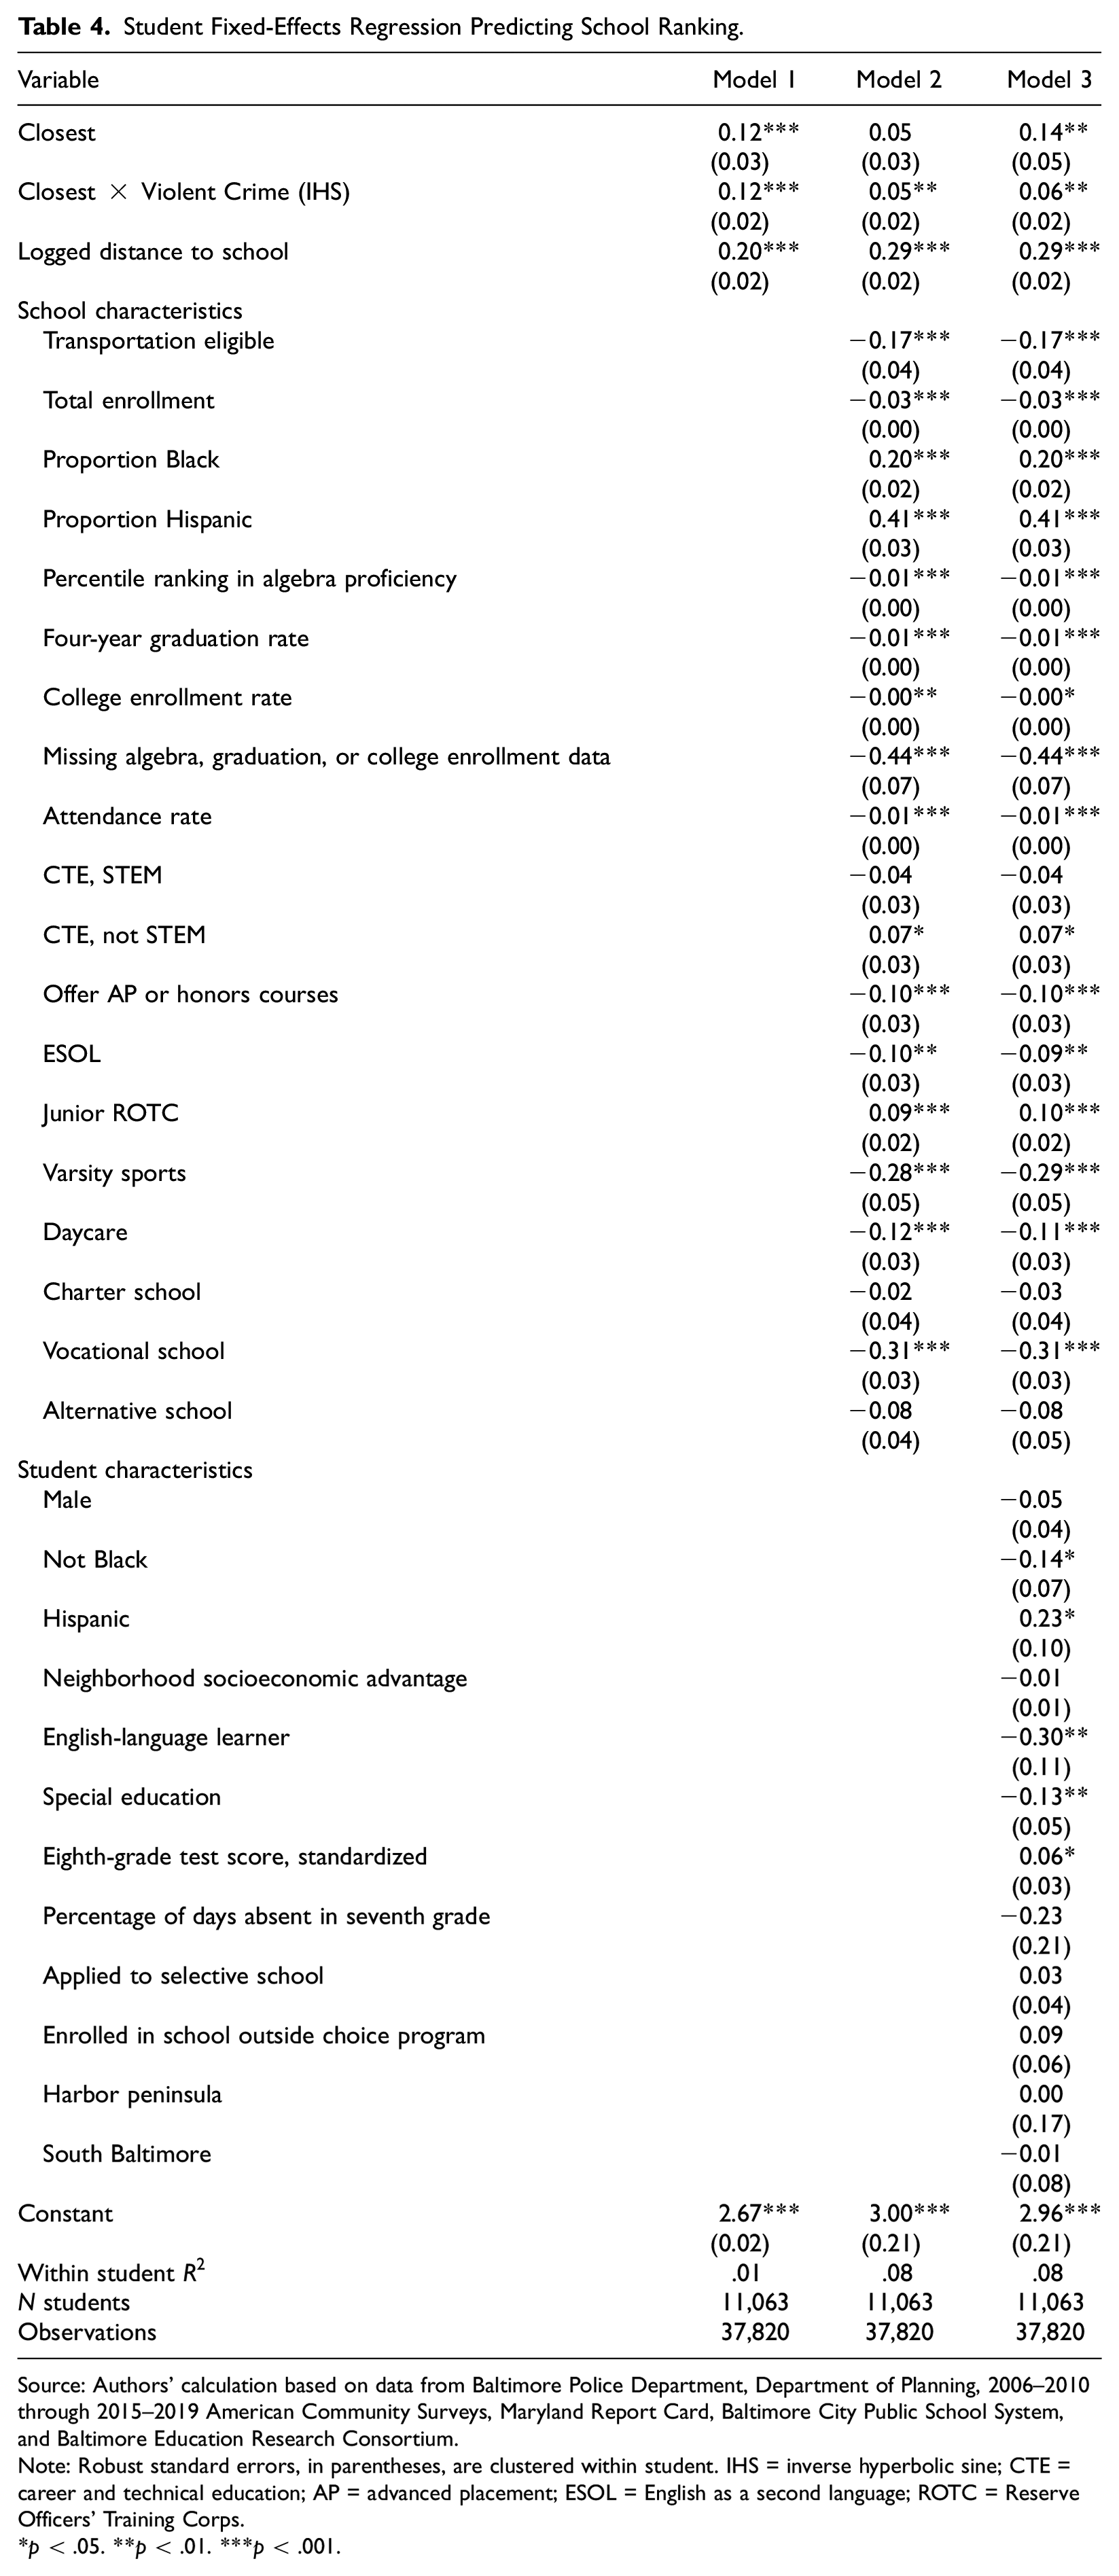
Source: Authors’ calculation based on data from Baltimore Police Department, Department of Planning, 2006–2010 through 2015–2019 American Community Surveys, Maryland Report Card, Baltimore City Public School System, and Baltimore Education Research Consortium.
Note: Robust standard errors, in parentheses, are clustered within student. IHS = inverse hyperbolic sine; CTE = career and technical education; AP = advanced placement; ESOL = English as a second language; ROTC = Reserve Officers’ Training Corps.
p < .05. **p < .01. ***p < .001.
Discussion
The results show that students who live in violent neighborhoods are less likely to list their closest school than students who live in safer neighborhoods, even after adjusting for measurable differences in school characteristics and variable choice behavior of different kinds of students. The final difference in the predicted probability of listing the closest school in the most violent neighborhoods versus the safest is around 3 percentage points for a school with average characteristics. Similarly, among students who list their closest school, those from violent neighborhoods rank their closest school, on average, 0.2 points higher than a comparable different school. In violent neighborhoods, there is a predicted difference of around 6 percentage points between listing the closest school and a comparable school that is farther away. Given that the baseline probability of choosing any school is around 16 percent, that represents a substantial difference in the likelihood that closest schools are listed. Similarly, in the most violent neighborhoods, there is an approximately one quarter of a point difference between the average ranking of the closest school and a comparable school farther away.
These numbers may at first seem small, but given that a student has very little chance of attending a school without listing it or ranking it highly, even small differences could lead to substantial differences in enrollment patterns by neighborhood. For context, 50 percent of our sample was assigned their first-choice school, with another 25 percent assigned their second-choice school. These proportions do not differ by level of neighborhood violence. Only around 13 percent of students from our sample enroll in their closest school in the fall, but among students who list their closest school and rank it first, around 65 percent end up enrolling in that school. Only 35 percent of those who list the closest school second end up enrolled there. In other words, there are real consequences to listing a school and where it is ranked on the form, and even small changes in the probability of listing and ranking are likely to have substantial consequences for the final distribution of students across schools.
It is possible that some students are drawn to specific schools for unmeasured reasons. For example, a student may choose to go to school far from their home but close to their grandparents’ house or their parent's workplace. These types of individual conveniences are not visible in these data. However, it is hard to imagine how these kinds of individual spatial relationships would be systematic enough to drive the interaction between neighborhood violence and local school preferences.
Another point that deserves some discussion is the importance of looking at the closest school rather than specifying particular distance cutoffs. We prefer the closest school for a few reasons. First, as seen in Figure 1, some neighborhoods do not have any schools nearby, and relying on a specific cutoff would mean essentially leaving them out of the analysis because there would be no variation. On the other hand, in denser neighborhoods with more schools, schools that are close by in terms of miles might feel very far away socially. In fact, research shows that in the high-poverty and dense neighborhoods of central Baltimore, which generally have more schools, perceived neighborhood scale is quite small, and residents form strong opinions about even specific block faces (Rosenblatt and DeLuca 2012). Therefore, the social and reputational aspects of avoidance are likely to operate at a smaller geographic scale in dense areas than in less dense parts of the city. Using the closest school regardless of its distance avoids imposing a fixed perception of distance on all parts of the city at once.
Empirically, the data support this geographically flexible version of social perception. Analyses with distance cutoffs (half mile, one mile, two miles, etc.) do not fit the data as well as using the closest school. Moreover, there is no meaningful interaction between neighborhood violence and the second closest school or for the overall ranking of distance for all schools. Students in violent neighborhoods seem particularly interested in avoiding their closest school rather than just going a particular distance away. This is likely the school they know the most about, pass the most often when traveling, and most of their peers would consider. Their lack of interest in this school suggests an attempt to avoid the social world in which they live as a form of protection from the physical and social dangers of neighborhood violence.
These findings have important implications for how we think about the relationship between neighborhood disadvantage and schooling experiences. Most of the existing literature on neighborhood effects implicitly or explicitly assumes that where you live has a direct relationship with where you go to school. The idea is that students from disadvantaged neighborhoods are “trapped” by social and economic circumstances in low-quality schools (Jencks and Mayer 1990; Wilson 1987). Choice and magnet programs have loosened this relationship to some degree, but many still cite local school quality as a key mechanism for the effect of neighborhood disadvantage on academic outcomes (Sharkey and Faber 2014; Wodtke, Harding, and Elwert 2011).
In contrast, these results show that students in violent neighborhoods are not trapped in their local schools. Students from these neighborhoods are actually less likely to try to stay close to home, which results in a wide range of educational experiences for students in the same neighborhood (Burdick-Will 2017; Mark et al. 2021). This means the scattering itself is a “neighborhood effect” and should be considered when we think about the consequences of living in a dangerous neighborhood. Leaving one's neighborhood for school may have some individual benefits for students, but research also shows it reduces social cohesion within neighborhoods and may limit parents’ ability to collectively supervise their adolescents (Burdick-Will 2018).
The findings also imply that we need to think about the unequal distribution of the cost of traveling long distances for school (see Weinstein et al. 2022). Research shows that long and complicated commutes are associated with lower attendance and higher transfer rates (Stein, Burdick-Will, and Grigg 2021; Stein and Grigg 2019). Reliable, safe, and free transportation may reduce some of these costs (see Trajkovski, Zabel, and Schwartz 2021), but students who attend faraway schools will spend more of their time in transit than those who attend a school nearby. When students choose a long commute because of a strong desire to attend that school, they are likely to be motivated to attend school no matter how difficult it is. However, when they are enrolled in a faraway school just because they want to avoid what is going on near their home, we should expect those students to be even more likely to disengage and not show up regularly. In other words, students from violent neighborhoods may pay a real academic price for the desire to leave their neighborhood, which students who are more comfortable with their local option do not have to face.
Finally, the findings complicate a common narrative in education reform that investing in existing schools or building a new school in low-income and non-White neighborhoods will be enough to reduce opportunity gaps (see e.g., Lipman 2013). Investing in quality schools is certainly important, and this study shows that higher-performing schools with more programs are generally more desirable. Nevertheless, these findings suggest that only investing in school buildings and ignoring the safety concerns of nearby residents may not lead families to take advantage of those investments. In other words, fixing our schools must go hand in hand with fixing the violence problem that plagues many of our communities.
In conclusion, these results remind us that the spatial structure of schooling matters in complex and indirect ways. The geographic distribution of school characteristics across neighborhoods clearly matters for educational opportunity, but so does the interaction between neighborhood and preferences. Just assuming students will default to their closest school out of either convenience or constraints means we miss the lengths that some students will go to both attend appealing schools and avoid places of peril. Similarly, just focusing on schools’ characteristics as pushes or pulls for students misses the important role that neighborhood conditions play in an open enrollment environment. Improving the academic rigor or programmatic offerings of schools will not be enough to make them broadly appealing when they are surrounded by a dangerous and stigmatized neighborhood.
Supplemental Material
sj-docx-1-soe-10.1177_00380407231197394 – Supplemental material for Anywhere but Here: Neighborhood Violence and Local School Preferences in Baltimore City
Supplemental material, sj-docx-1-soe-10.1177_00380407231197394 for Anywhere but Here: Neighborhood Violence and Local School Preferences in Baltimore City by Julia Burdick-Will, Leela Gebo and Alexandra D. Williams in Sociology of Education
Footnotes
Acknowledgements
We are grateful for feedback and assistance from the Baltimore City Schools. All errors and opinions are our own. Curt Cronister provided invaluable technical support.
Research Ethics
This project was reviewed by the Institutional Review Board and determined not to be human subjects research because the data were collected during normal educational practices and provisions were taken to protect privacy and confidentiality.
Funding
The author(s) disclosed receipt of the following financial support for the research, authorship, and/or publication of this article: This research was made possible by a grant from Johns Hopkins University and indirect support from the Baltimore Education Research Consortium.
Supplemental Material
Supplemental material for this article is available online.
Notes
Author Biographies
References
Supplementary Material
Please find the following supplemental material available below.
For Open Access articles published under a Creative Commons License, all supplemental material carries the same license as the article it is associated with.
For non-Open Access articles published, all supplemental material carries a non-exclusive license, and permission requests for re-use of supplemental material or any part of supplemental material shall be sent directly to the copyright owner as specified in the copyright notice associated with the article.