
Abstract
Social mobility in the cultural sector is currently an important issue in government policy and public discussion, associated with perceptions of a collapse in numbers of working-class origin individuals becoming artists, actors, musicians and authors. The question of who works in creative occupations has also attracted significant sociological attention. To date, however, there have been no empirically grounded studies into the changing social composition of such occupations. This article uses the Office for National Statistics Longitudinal Study to show that, while those from more privileged social backgrounds have long dominated, there has been no change in the relative class mobility chances of gaining access to creative work. Instead, we must turn to the pattern of absolute mobility into this sector in order to understand claims that it is experiencing a ‘mobility crisis’.
Keywords
Introduction
Once the preserve of academic social scientists, the study of social mobility has become a major issue in British public life. While the evidence base for changes in the overall pattern of social mobility in the UK remains contested (Goldthorpe, 2016), the perception that mobility rates are falling has taken root in political and media discourse. Within this broad concern, the arts and cultural sector has emerged as a significant area of discussion. On the one hand, creative work is thought to be, by its very nature, more open and meritocratic than other fields (Florida, 2002; Littler, 2013; McRobbie, 2015). On the other hand, prominent figures in the arts have argued that Britain’s mobility ‘crisis’ now extends to its creative industries. Speaking in 2021, Nadine Dorries, then UK Secretary of State for Culture, outlined her fears that, unlike her contemporaries growing up in 1960s Liverpool, young working-class people now have far fewer opportunities in the fashion, music and media industries (House of Commons, 2021). In doing so, she echoed the concerns of several leading actors, including Julie Walters, Michael Sheen, Julie Hesmondhalgh and Lennie James, who, in recent years, have claimed that the upwardly mobile pathways that they took into the profession are no longer available. Speaking to Sky News in 2017, Christopher Eccleston suggested that his working-class parents ‘could not have afforded to send him to drama school today’, and that he is always at a disadvantage when competing with the ‘boys club’ of ‘middle-class and public-school educated’ actors (Connick, 2017).
While the question of who produces culture is of obvious sociological interest, political and practitioner concerns about access to creative work are not currently matched within UK sociology. Here the predominant approach to issues of culture and inequality has been through the lens of taste and consumption. Although the social composition of the cultural workforce and the mechanisms of entry have recently received some attention from sociologists (Allen and Hollingworth, 2013; O’Brien et al., 2016), most research in this field emanates from cultural studies and human geography, focusing on conditions of work. Meanwhile, despite the discipline’s powerful role in shaping the field of social mobility studies, the sociological study of social mobility has yet to concern itself empirically with occupations producing culture, so that claims about changes in social mobility into cultural and creative work over time have yet to be assessed.
In this article we address this gap, using data from the Office for National Statistics Longitudinal Study of England and Wales (ONS-LS), to present the first study of trends in social mobility into British cultural and creative occupations. More specifically, we compare mobility into core creative jobs of those born between the 1950s and the 1980s to evaluate claims for the exceptionalism of the creative industries in terms of both their current and former openness to recruits from all social backgrounds.
Our analysis first shows that cultural and creative occupations are not, and have never been, exceptionally open, with access to core creative jobs by class background remaining consistently unequal since the 1970s. Second, we demonstrate the ways that gender and ethnicity, educational achievement and geography intersect with class inequalities in recruitment. Finally, we indicate how, despite the lack of change in relative social mobility chances in cultural and creative occupations over the past 50 years, shifts in the class composition of cultural jobs over time might offer good reasons why older cohorts of creative workers believe that creative occupations were once a special case. In highlighting the third element to our analysis, we stress the need to look beyond the predominant focus in mobility studies on relative mobility rates between ‘big’ occupational classes to reveal how mobility is experienced and understood in more specific occupational cultures and histories.
Social mobility is both a technically complex and highly contested issue. We therefore begin this article with a discussion of key concepts and relevant literature in this field before moving on to discuss current understandings of social mobility in cultural and creative occupations. Next, we describe the ONS-LS data and how these were used to produce our findings. We then model the association between membership, between 1971 and 2011, of core creative occupations, the broader occupational class groups defined by the National Statistics Socio-Economic Classification (NS-SEC) scheme, and a range of demographic variables. Finally, we consider the nature and significance of changes in the rates of class mobility into cultural occupations that underlie these associations.
Approaches to Social Mobility
Historically, the study of social mobility has mainly focused on the analysis of origins and destinations, or the intergenerational comparison of the social positions of individuals and their parents. Recently, economists’ work on intergenerational income mobility has become prominent (Blanden et al., 2013), and it is their finding that, between the 1980s and the early 2000s, children from richer families significantly increased their earnings advantage over those from poorer backgrounds, that has fuelled the pervasive political narrative that Britain is in the grip of a mobility ‘crisis’. Previously, the analysis of social mobility in the UK was dominated by contributions from sociology, using occupational class to index changes in social position (Goldthorpe, 2012; Miles, 2023). The sociologists’ findings have diverged not only from those of the economists but also between themselves (Buscha and Sturgis, 2018). Discrepancies in the sociological account of how common mobility is and whether it has changed over time partly reflect variations in the data sources and occupational measures employed. They also depend on which dimension of mobility is in question. Here the pivotal distinction between absolute and relative mobility comes into play.
Absolute mobility refers to the proportions of people whose adult social class (destination class) differs from that of their household when they were growing up (origin class), whereas relative mobility refers to the comparative chances of people from different origin classes ending up in the same destination classes. The distinction is crucial in the analysis of changes in mobility over time because, while absolute rates are sensitive to changes in the wider opportunity structure, relative rates provide a measure of mobility, or ‘openness’, that is independent of such changes (Goldthorpe et al., 1987).
With this distinction in mind, there is a degree of sociological consensus that, following a ‘golden age’ of mobility in the decades after the Second World War, rates of absolute upward social mobility have levelled off (Bukodi et al., 2015), but also that there has been little change in the long-term pattern of relative mobility (Buscha and Sturgis, 2018; Goldthorpe, 2016; Goldthorpe and Mills, 2008). This is because both the benefits of previously rising rates of upward mobility and the less propitious prospects signalled by their flattening out were distributed more or less equally across the population, leaving considerable inequalities in mobility chances between different class groups intact (Bukodi and Goldthorpe, 2021).
Following the agenda set by Goldthorpe and colleagues, the analyses that have contributed to this consensus have tended to focus on macro-level changes in (particularly relative) mobility between occupational aggregates or ‘big-class’ mobility (Savage et al., 2013). Exceptions include status-based, gradational approaches (e.g. Lambert et al., 2007), and – of particular interest to the study of mobility into cultural work – the ‘micro-class’ approach developed by Grusky and colleagues in the USA on the importance of particular occupational cultures and histories in shaping the dynamics of mobility processes (Grusky and Weeden, 2006; Jonsson et al., 2009).
Explanations for mobility trends point to other areas of sociological research that are relevant to our concerns in this article. In the British context, these include recent interventions on the role of education in social mobility (Mandler, 2020; Reay, 2017; Sullivan et al., 2017); geography and mobility (Friedman and Macmillan, 2017; Miles and Leguina, 2018); the relationship between broader familial networks and mobility (Chan and Boliver, 2013); and on the role of cultural resources in social mobility (Allen and Hollingworth, 2013; Friedman, 2012; Lawler, 1999; Reay, 2017). The latter body of work is important to the argument that we will develop in this article because, in addition to the mechanisms driving inequalities in mobility chances, it also draws attention to how mobility is perceived and experienced subjectively. In this respect, it is important for us to focus our analysis as much on absolute as on relative rates of mobility because it is the former that are more visible to the actors whose experiences of (im)mobility drive trends in the data, and which are therefore likely to provide the key reference points for personal and everyday understandings of mobility (Breen, 2010; Miles, 2023).
Social Mobility in Creative Occupations Research and Policy
The dynamics of cultural production and consumption, including the importance of signs and symbols in creating social divisions, are central concerns of both ‘classical’ and more recent sociology (Bourdieu, 1984; Veblen, 1899/1994; Weber, 1944). Recent research on the role of cultural preferences in class formation has been particularly influential in reviving interest in the role of elite formation in the reproduction of inequalities (e.g. Khan, 2011; Savage et al., 2015). This research can be located in the context of a broader literature on the industries and occupations producing culture, cutting across sociology, geography, cultural and media studies, and economics (Alacovska, 2017; Ashton and Noonan, 2013; Banks, 2017; Conor et al., 2015; Hesmondhalgh, 2013; McRobbie, 2015; Saha, 2017), which seeks to connect cultural production and consumption with cultural representation (O’Brien et al., 2017).
Until now, however, the occupations and industries producing cultural goods have received relatively limited attention from sociologists studying social mobility. A recent analysis of cultural occupations in the ONS Labour Force Survey (LFS) (Oakley et al., 2017; O’Brien et al., 2016) used data from 2014 onwards to demonstrate that cultural occupations are characterised by gender, ethnicity and social class inequalities. Other work using LFS data has shown that cultural occupations contain a significant over-representation of those from professional and managerial social backgrounds, which is even greater than in other parts of the professional and managerial employment sector (Friedman and Laurison, 2016).
While the mainstream sociology of social mobility has largely ignored cultural professions, there have been some notable contributions to the debate about social mobility and cultural work in the field of cultural and media studies. Banks (2017), for example, combines archival research on Britain’s film and television workforce with well-established sociological arguments to argue that it is likely there was an expansion of absolute social mobility into creative occupations during the long boom from the end of the 1950s. However, he is cautious about its impact on relative rates of mobility, given current understandings of the restrictive ways in which labour markets for these occupations operate, and raises the alarm that rates of upward mobility may now be declining.
Such concerns are both reflected in and reproduced by policy rhetoric across the political spectrum (Goldthorpe, 2016). The policy salience of social mobility is highlighted by the UK Government’s Social Mobility Commission (SMC), which now offers ‘state of the nation’ analysis of mobility prospects in key occupations and industries. In some parts of government, cultural professions are still lauded as a focal point of economic growth, open to all with ‘talent’ and skills (DCMS, 2021), but they are now simultaneously constructed as a ‘problem’ in policy for their ‘low levels’ of social mobility (Social Mobility Commission, 2021). Following suit, funding bodies and campaigning organisations in the cultural sector (Arts Council England, 2018; Eikhof et al., 2018) have increasingly turned to focus on access inequalities.
As noted in the introduction to this article, an important driver of policy interest in social mobility in creative jobs has been the intervention of high-profile working-class origin individuals in such occupations, stressing how they no longer see early career individuals from similar backgrounds in their professions, and claiming that working-class representation was much more prominent in the 1960s through to the 1980s. As Bottero (2019) demonstrates, the sense of social inequalities, and how they are experienced, is crucial to their sociological impact. It is here that this article offers a new, empirically grounded, contribution. At the same time as our analysis of stability in relative rates of mobility shows that the problem of inequality in creative work is, in fact, longstanding, we demonstrate that we can only understand creative workers’ sense of inequalities in social mobility by being attentive to the effects of changes in absolute rates of mobility.
Data and Methods
The Office for National Statistics Longitudinal Study
The standard approach to studying social mobility in the UK compares occupational information about respondents and their parents, collected in cross-sectional sample surveys or in birth cohort studies. However, the numbers of creative workers picked up in these datasets are too small for robust analysis. In this article we use the Office for National Statistics Longitudinal Study (ONS-LS). This dataset is created from a 1% sample of Census returns in England and Wales, chosen using four (undisclosed) birthdays. The ONS-LS links records from each Census from 1971 to 2011 and also connects to life event data including births, deaths and cancer registrations (although only Census data are used in our study). New LS members are added every year through births and immigration; existing members leave through emigration (including to Scotland and Northern Ireland) or death, although their data are retained.
Census data have several advantages for our study. Completion in the UK is compulsory, and compliance is very high (Office for National Statistics, 2021). Data quality is good, due to validation, which supports an achieved linkage rate of approximately 90% between Censuses (Buscha and Sturgis, 2018). The LS sample is large in size, with at least 500,000 members observed at each Census, and it is nationally and regionally representative. The data include details of other household members at each Census. We can therefore observe the occupations of members’ parents when they were children, which we use as our basis for determining class origin (taking whichever parent has the higher class position if both work) without relying on the potentially fallible memory of study members.
We defined four 10-year cohorts, born between 1953 and 1992. Members of Cohort 1 were born between 1953 and 1962. They were aged 9–18 in 1971, the first Census in which they were observed, where we record parental occupations, 19–28 at the second Census in 1981, and so on. For this, the oldest, cohort we have four observations during adulthood (they were aged 49–58 in 2011) but for the youngest cohort, born between 1983 and 1992, just one. Members were not included if they did not live with a parent at first observation, or neither parent had an occupation that could be assigned a social class category (under 10% in each cohort).
Defining Cultural Occupations
There have been various approaches to demarcating the ‘creative’ from the ‘non-creative’ industries. These range from broad definitions, including engineering and scientific occupations (Florida, 2002), to more narrow definitions, focused on occupations in the artistic and media sectors of the economy (Hesmondhalgh, 2013; Pratt, 1997; Throsby, 2008). Alongside the quest for an overall definition, much work has been devoted to thinking through the relationships between particular subsets of occupations: for example Florida’s (2002) ‘super-creative core’ in contrast to more traditional knowledge-based workers; Throsby’s (2008) concentric circles model of creative work; Hesmondhalgh’s (2013) ‘core cultural industries’; and Bakhshi et al.’s (2012) ‘creative trident’ approach, which attempts to map the presence of occupations designated as ‘creative’ within both the ‘cultural and creative industries’ (CCIs) and the wider economy. The latter is currently the preferred framework for public policy in the UK (DCMS, 2018), superseding the Department of Culture, Media and Sport’s original (1998) approach to mapping CCIs according to the production and exploitation of intellectual property.
In this article, we adopt a modified definition of ‘core cultural’ occupations, returning to the three key thinkers who have grappled with definitions of cultural occupations while engaging in critiques of the approach taken in public policy. For Hesmondhalgh (2013), the ‘cultural industries’ are those that produce and circulate symbolic goods in texts (broadly defined), an approach that includes advertising and PR, but excludes IT and computer service occupations not associated with video game production (see also Campbell, 2019). For Throsby (2008) the definition is grounded in the distinction between cultural and commercial production, meaning design and advertising are ‘related industries’ compared with the core of literature, music, performing and visual arts, and the secondary tier of film, museums and galleries, and photography. For Pratt (1997), a definition should begin with cultural products and their reproduction, including advertising (as an activity linking products and their reproduction) but excluding architecture, IT and craft occupations. 1
What is common between these three definitional attempts is the identification of a principal set of cultural occupations, which includes artists, musicians and actors, and those working in publishing, media, libraries, museums and galleries. These are the jobs that are considered to be most involved in creating, curating and presenting the culture that we consume, and are also the focus of the concerns within media, practitioner and policy circles regarding claims about their increasing exclusivity. They are, therefore, the focus of our analysis in this article. Ideally, we would consider each in turn, reflecting the distinctiveness of each field of cultural production (Bourdieu, 1984). However, for pragmatic reasons, to do with shifting occupational group classification boundaries within the Census and the number of cases required for robust analysis, an overall composite category is used here.
Coding Occupations to Social Classes
We used the National Statistics Socio-Economic Classification (NS-SEC) to code parental occupations into measures of social class origin. While this classification was developed after the first three Censuses used in our study, a look-up table has been generated, allocating earlier occupational codes (CO70, CO80, SOC90) to this scheme, 2 thus allowing us to retrospectively apply NS-SEC to the ONS-LS for the period 1971–2001. We operationalised a four-class aggregation of NS-SEC codes, separating NS-SEC I, II, III–V and VI–VII. NS-SEC classes III–V are conventionally grouped in this way as there is no significant gradient of economic disadvantage between them (Buscha and Sturgis, 2018).
We also needed to be able to classify creative occupations retrospectively. For this study we tracked the same jobs through time, rather than using contemporaneous definitions of what were then considered to be cultural occupations. We chose the closest occupational codes to the SOC2010 codes in SOC90 and CO80 (but not CO70 as the 1971 Census was only used to estimate class origin). We should acknowledge, however, that there are still potentially significant changes over time in the jobs that we can identify. For example, in SOC2010, our Media jobs include 3416 ‘Arts officers, producers and directors’. This category does not exist in CO80, 30 years earlier, and would have been subsumed in more general administrative/managerial codes. Another category affected by change over time is ‘Artists’. In the 1991 Census, this included graphic designers, who subsequently got their own occupational code (which we do not include within our core creative classification). We compared the social class backgrounds of graphic designers and artists 2001 and 2011 and found only 1–2% difference in the proportions from NS-SEC I and NS-SEC VI–VII origins. Finally, museum curators and archivists did not have a SOC code in 1991, but do thereafter. However, these form a very small number of core creatives. We are therefore confident that our analysis of change over time is not substantively affected by changes in coding.
Social Mobility and Cultural Occupations: Evidence from the Office for National Statistics Longitudinal Study
Descriptive Analysis
Table 1 shows counts of members of each cohort that ever report working in a core creative occupation. The largest subgroup consists of those that have worked as artists, musicians or performers, followed by media or publishing, with the smallest group being those in museums and libraries. The total for all core creatives is slightly less than the sum of each creative occupation, as some people report more than one core creative occupation across Censuses.
Office for National Statistics Longitudinal Study cohort sizes, by occupational group.
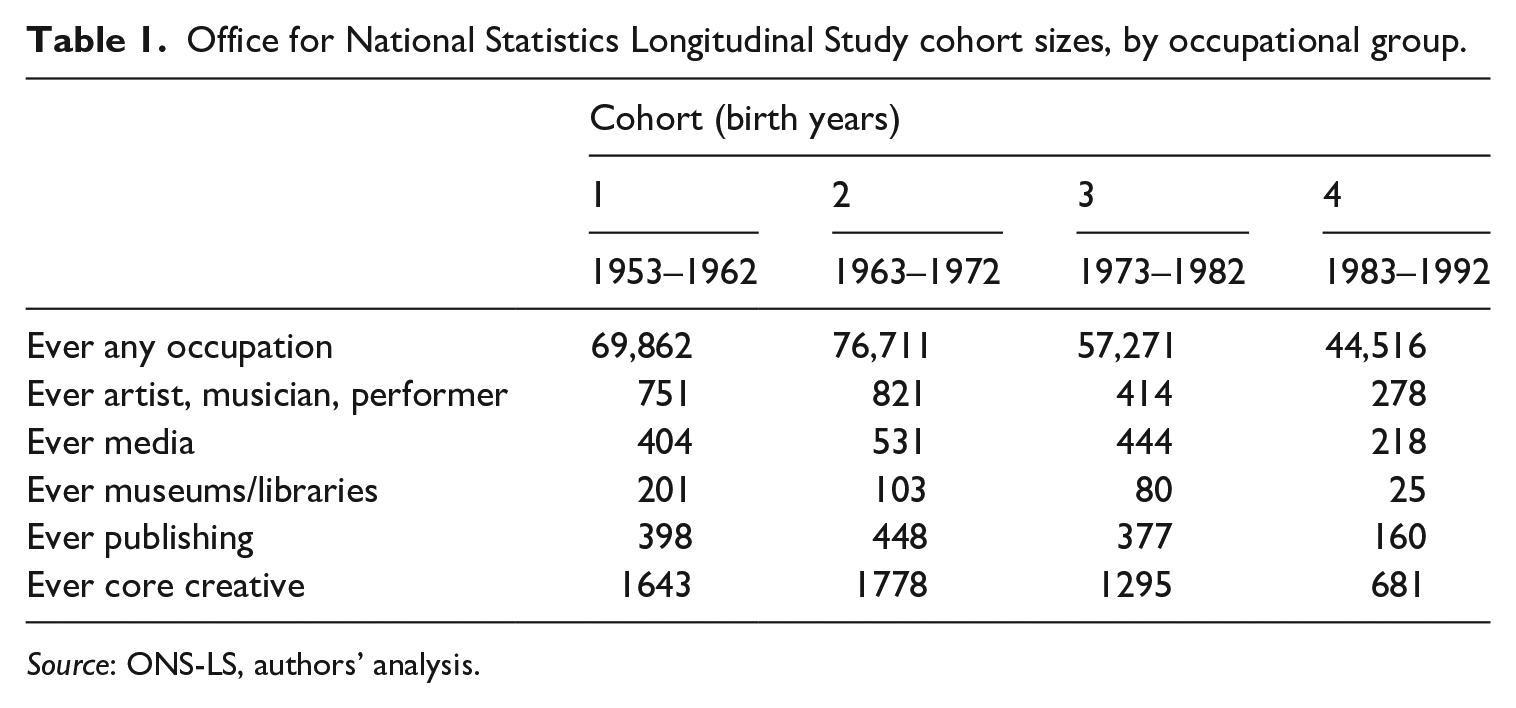
Source: ONS-LS, authors’ analysis.
Most creative occupations are classified in NS-SEC I or II by the ONS (DCMS, 2018), meaning, for working-class or intermediate origin people (NS-SEC VI–VII, III–V), entering a creative occupation represents upward social mobility. It should be noted that members of Cohort 4 had relatively fewer opportunities to have worked in any job over the course of their career, as they were aged between 19 and 28 at the 2011 Census when their occupation is recorded.
Figure 1 compares the class origins of those working at the time of each Census in core creative occupations (in the upper panel) and in any occupation (in the lower panel). The class origins of LS members of each cohort are shown at each Census observation by percentage. 3 The first observation of each cohort’s employment (and the only observation for Cohort 4), when members were aged 19–28, would not normally be considered to represent ‘occupational maturity’ (Goldthorpe et al., 1987: 52–53). To mitigate this issue, we limited inclusion for this first observation to those aged at least 24–28.
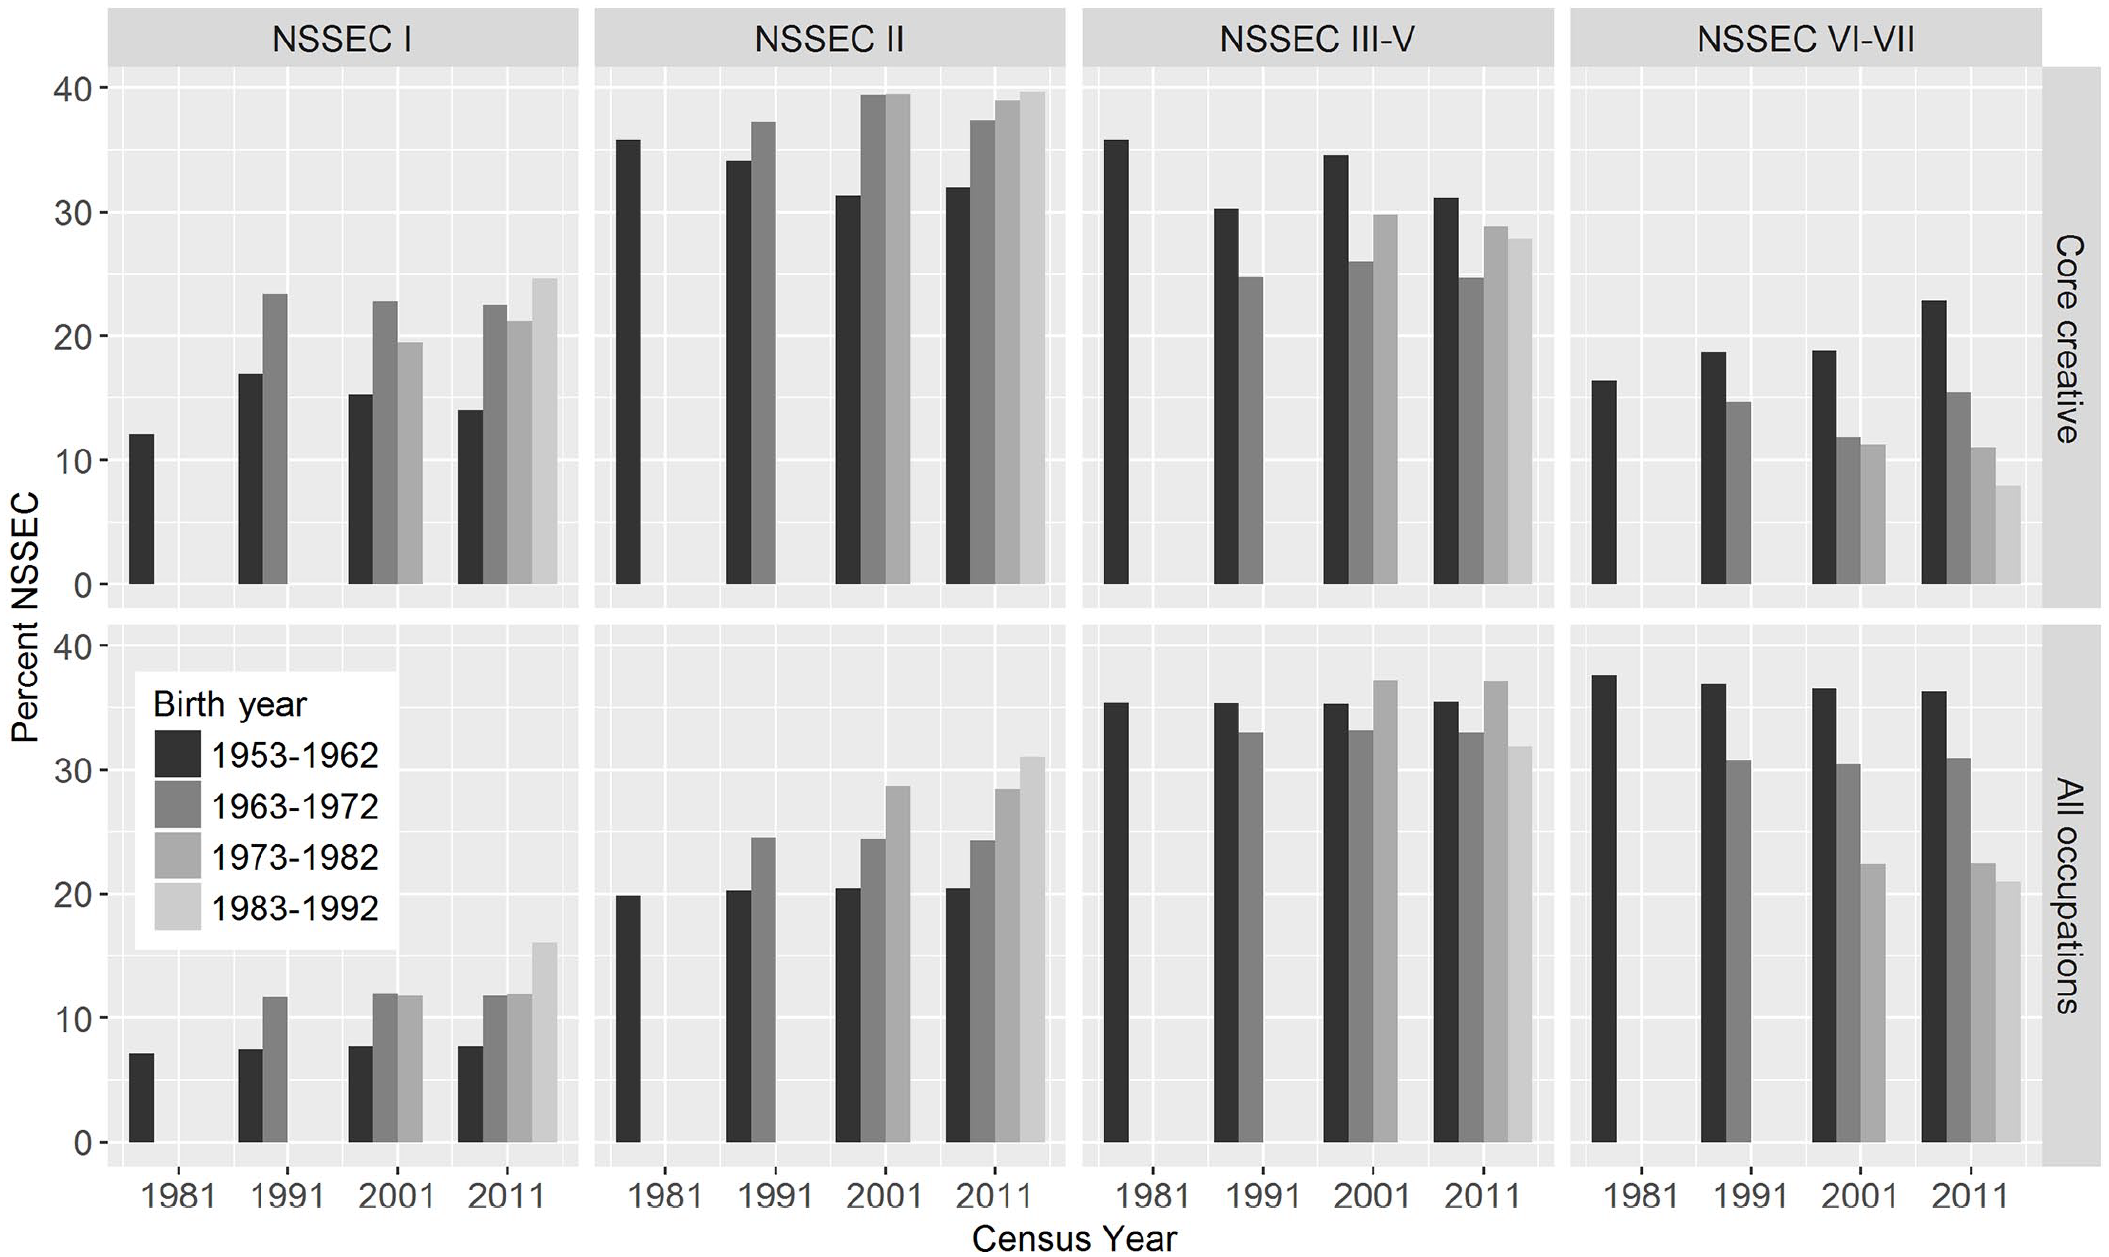
Percentage of longitudinal study members in core creative work, and in any job, by parental NS-SEC.
The proportion of workers from each class origin fluctuates slightly at each Census but is broadly stable within cohorts. In both core creative and other occupations, recruitment from NS-SEC I in Cohort 1 is consistently lower than in other cohorts. There is a noticeably larger proportion of those with NS-SEC I and II backgrounds in creative work than in the working population as a whole, illustrating the higher position of cultural occupations in the occupational class structure. There is more within-cohort fluctuation among creative workers, in particular, in Cohort 1, which, running counter to the declining mobility thesis, and in contrast to younger cohorts, appears to have a higher proportion of working-class by origin members over time. 4
In terms of between-cohort differences, there are substantial differences in class origins. The proportion of core creative workers with NS-SEC I origins more than doubles between Cohorts 1 and 4 (12.1% vs. 24.6%, among those aged in their 20s), while the proportion from NS-SEC VI–VII more than halves (from 16.4% to 7.9%). NS-SEC II, a large fraction of whose members are teachers and senior nurses, is the most common social origin for core creative workers, and the presence of these groups within this sector is relatively stable over time. The proportion of those whose parents worked in intermediate occupations in NS-SEC III–V has reduced over time, from 35.8% in Cohort 1 to 27.8% in Cohort 4. The lower panel shows a similar transformation in the class origins of all employed people to that which we can see in the core creative workforce, with a doubling of the proportion of young people with NS-SEC I parents, from 7.1% to 16.1%, and, once more, a near halving of the proportion of young people from working-class households, from 37.6% to 21%. The trends for other class origins differ slightly more between the creative sector and the rest of the working population, where there is stronger overall expansion in recruitment from NS-SEC II origins, and a weaker decline from intermediate origins.
Overall, then, the pattern of absolute social mobility into creative employment over the long term is marked by a rise in people from more advantaged class backgrounds and a commensurate fall in recruitment from those who grew up in working-class homes. However, these shifts also correspond to changes in the class origins of the overall working population, suggesting both that there is nothing particularly special about the relationship between social mobility and creative work, and that while cultural jobs appear more ‘exclusive’ in terms of their class recruitment profiles than before, this may not mean that they have become more ‘closed’ to working-class people. In other words, rising exclusivity may simply be a function of the changing shape of the UK class structure since the 1960s – in which more now start out in NS-SEC I and II households and fewer in NS-SEC VI–VII – than any increase in the relative advantage of the former over the latter.
Modelling Access to Creative Work
In order to test whether there has been any decline in the fluidity of the creative sector when it comes to issues of access by social class, we used logistic regression for the outcome of ever reporting a core creative occupation. We repeated the four-class aggregation of the NS-SEC classification above for our covariates. We also incorporated sex and education (from the question on ‘highest qualification’ in the Census), which, for parsimony, we reduced to a binary variable recording whether the LS member ever reported holding a degree.
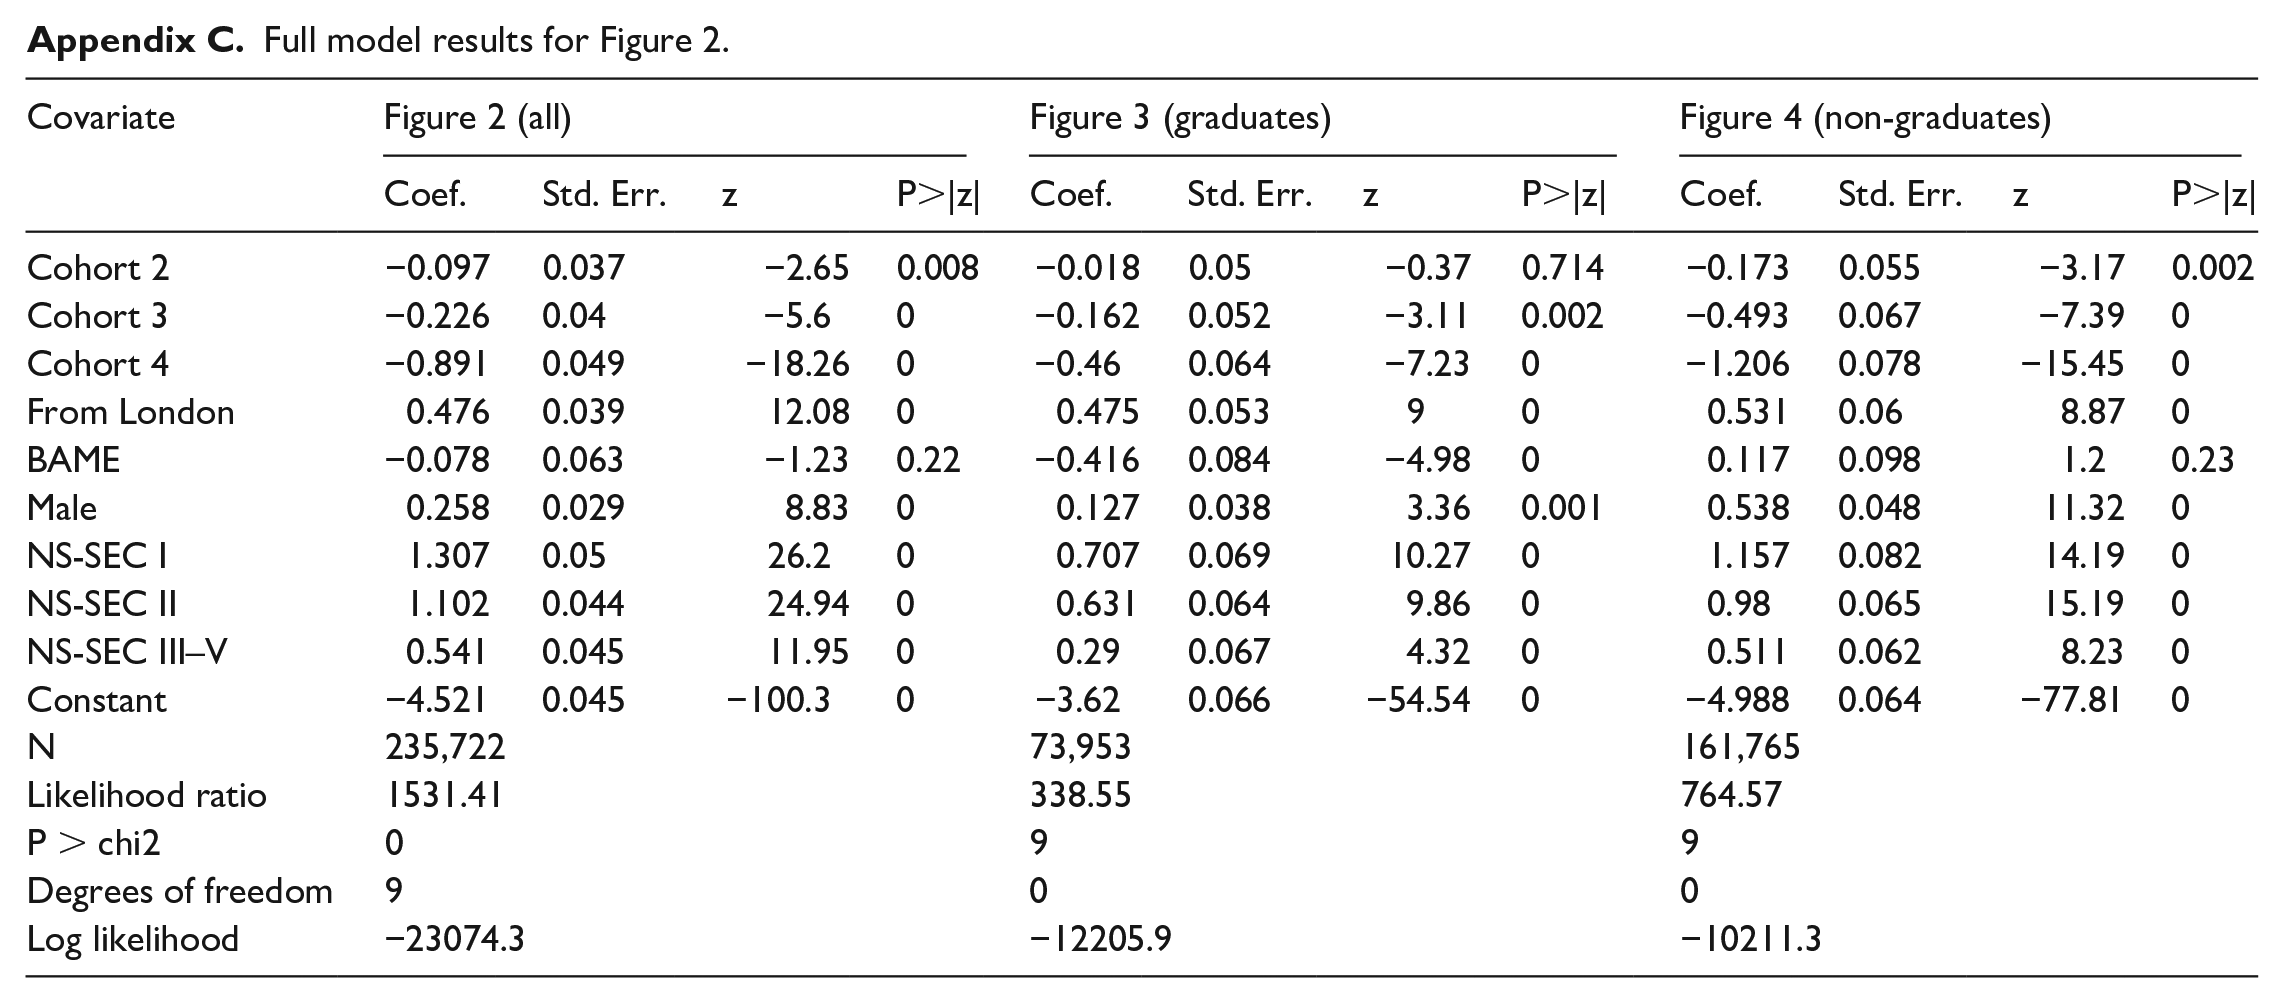
The LS data also allow us to extend the analysis in order to address two particular concerns of recent literature. First, we are able to explore the intersections between different axes of inequality in mediating access to creative work by incorporating ethnicity (Oakley et al., 2017; O’Brien et al., 2016). Identification with ethnic groups was measured in Censuses from 1991 onwards, but response categories have changed over time, and answers given were not always consistent between Censuses (in part because of the earlier lack of a Mixed category). Given this, we coded racially minoritised LS members as BAME (Black, Asian and Minoritised Ethnicity) if they had identified their ethnicity as any response other than White at any Census. This aggregation obscures possibly important differences between specific racially minoritised groups, but these are difficult to explore in a longitudinal study, due to both changes in measurement and the smaller numbers of racially minoritised participants in earlier Censuses. 5 Second, existing literature has highlighted issues associated with the concentration of CCIs in London (Oakley et al., 2017), including the ability to work for free during internships, and the disproportionate effect this may have on those seeking creative work who do not live in London. We therefore created a binary variable for whether LS respondents were living in London when observed aged 9–18. In Figure 2 we show the association between each variable and the probability of ever undertaking core creative work as odds ratios. 6 Once again, Cohort 4 is censored so that only those aged 24 or above are included. 7
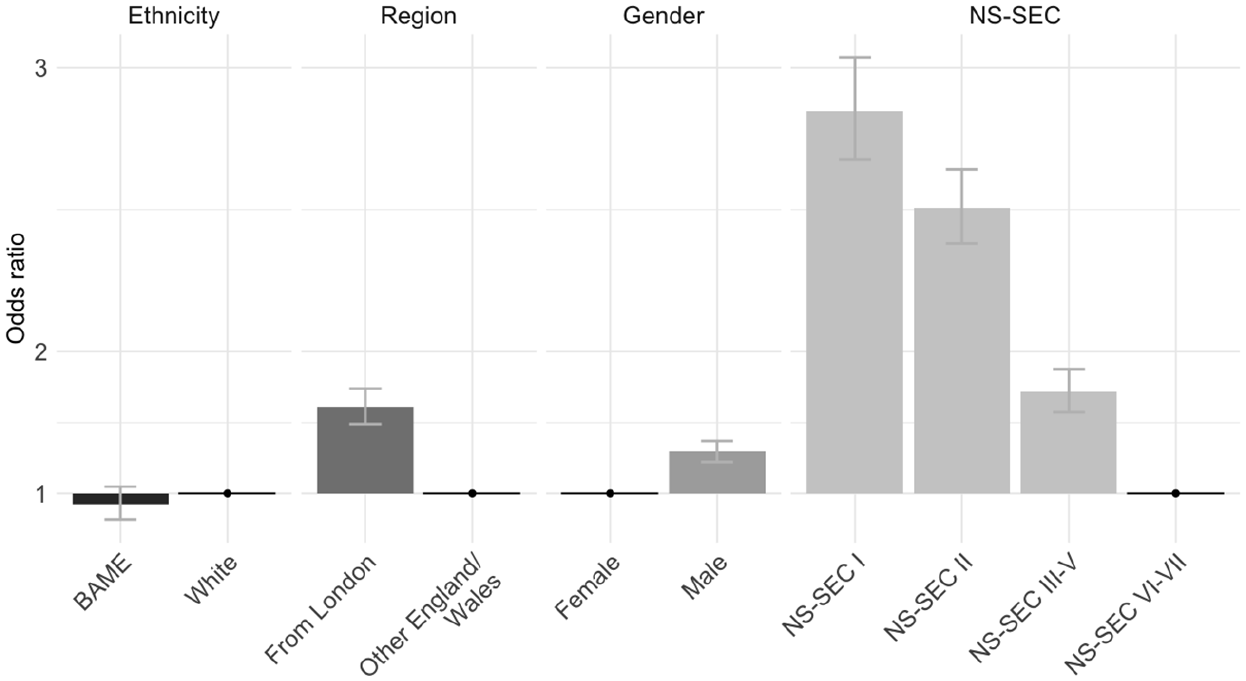
Odds ratios for covariates on probability of ever having core creative job.
These results show a strong class gradient in the odds of holding a core creative job: those from an NS-SEC I origin four times more likely than those with parents in NS-SEC VI–VII to be in creative work rather than any other occupation. 8 We tested for significant interactions between social class origin and cohort, but there were none, providing no evidence of a trend in this association. 9 Thus, despite the perception that it is becoming increasingly difficult for those from working-class origins to gain access to creative work, at no point since the 1950s has it been any easier or, indeed, harder, for them to access creative work relative to those from other class backgrounds. It has always been relatively difficult.
These results also confirm that men are significantly more likely than women to report core creative work, but racially minoritised LS members are not significantly less likely than White members to do so. Being from London is positively and significantly associated with core creative work.
Higher education is a key consideration in social mobility analysis. It has a complex relationship with social origin in mediating class destinations, being critical in accessing higher-level occupations, while also being more accessible to those from more advantaged class groups (Boliver, 2013, 2017). Moreover, education is a critical component in the social construction of cultural tastes, and therefore in mediating access to cultural capital (Bourdieu and Passeron, 1990; Chan and Turner, 2017; Reeves and De Vries, 2016). During model development, significant interactions were identified between holding a degree and class origin, gender, ethnicity and cohort: having a degree is strongly correlated with these characteristics, and these relationships have changed over time. 10 We therefore developed separate models for the probability of finding creative work for those with and without a degree, shown in Figure 3.
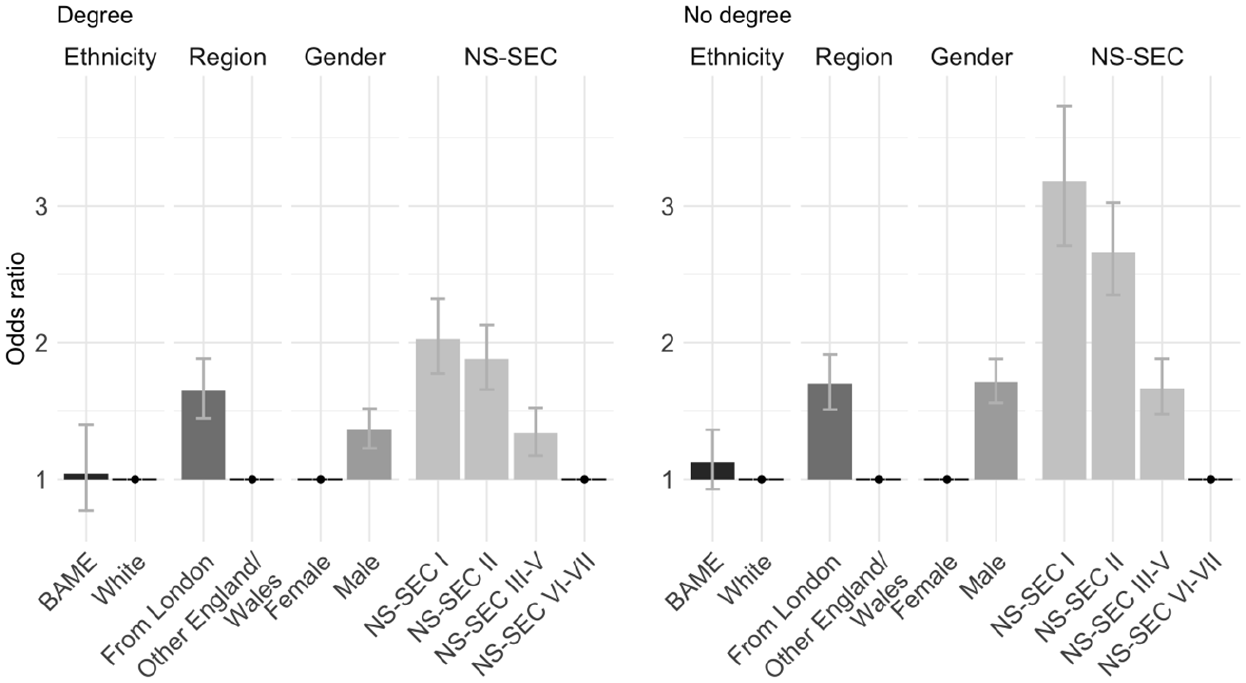
Odds ratios for probability of ever having core creative job, LS members with and without degree.
The analysis in Figure 3 reinforces many of the previous findings, while also suggesting some important qualifications. In the left-hand panel we can see that, even for those with a degree, there is a significant class gradient in the probability of gaining creative work: a graduate whose parents worked in NS-SEC I still has over double the odds of gaining creative work compared with graduates from working-class origins. Male graduates have a slight but significant advantage over female graduates, and Londoners have a larger advantage over non-Londoners. Racially minoritised graduates do not have significantly different odds of finding core creative work than their White counterparts, although this finding is not consistent with the reported experiences of creative workers from ethnic minorities, or recent Labour Force Survey analysis (Oakley et al., 2017; O’Brien et al., 2016).
For those who do not have degrees, the class origin gradient in gaining access to creative jobs is more pronounced. The odds of non-graduates from NS-SEC I backgrounds are over three times those of their working-class peers, reflecting the continuing importance of traditional – family, and school-based – networks, and accumulated cultural capital, in mediating access to desirable jobs (Bukodi and Goldthorpe, 2018). Such factors are also likely to be important in explaining the relatively greater advantage of non-graduate men over women, and continuing advantage of non-graduates from London, in gaining access to core cultural jobs.
In summary, in terms of relative social mobility, the odds of a person accessing core creative work are strongly associated with their class origin, even after qualifications are taken into account. This class advantage is in addition to the advantages in qualifications that this group also holds. There is also no evidence that this is a new phenomenon. The 1960s and 1970s were not in fact a ‘golden age’ of classless access to creative employment that has now come to an end.
However, this comparative stasis in relative social mobility stands in marked contrast to substantive absolute changes in the class origins of cultural workers that are consonant with the ‘long boom’ reported in the broader social mobility literature. In this respect, the increased odds of people with NS-SEC I and II origins accessing creative employment have combined with an increased proportion of such people in the population to substantively change the class composition of creative work. It is this development that we would highlight when explaining the perception among older members of the cultural workforce that the cultural industries are no longer as ‘open’ to all comers as they once were. Returning to the absolute mobility flows into core creative occupations by cohort in the upper panels of Figure 2, we can see that, as previously noted, the cohort of cultural workers born between 1953 and 1962 was both more working class by origin than younger cohorts, and it became more so over time 11 just as the class profile of cultural work as a whole became more middle class. Hence, the older generation’s vision of the cultural sector is shaped by two contrasting reference groups, which, together, work to shape their sense of identity as increasingly isolated recipients of a failed meritocracy.
Conclusions
In Britain there is a longstanding belief that cultural work is meritocratic; that is, it comprises a set of occupations that are recruited on the basis of talent, regardless of social origin. A recent focus on the employment profile of the cultural sector, which shows that those from more privileged backgrounds dominate, combined with political concerns that the UK is in the midst of a ‘mobility crisis’, has shaken this view. At the same time, leading practitioners who were upwardly mobile into creative jobs have lamented the loss of a ‘golden age’ of opportunities for working-class actors and artists that began in the 1960s with the rise to prominence of figures like Rita Tushingham, Michael Caine and David Hockney.
Our analysis in this article is the first to test the claim that social mobility into cultural occupations has worsened. It shows that, in fact, there has been no change in the underlying pattern of relative mobility into creative jobs. The chances of getting into creative work are profoundly unequal in class terms, but they are neither more nor less unequal than they ever have been. As across the rest of the economy, there was no ‘golden age’ of classless access to creative employment. We have also shown how issues of gender and ethnicity compound inequalities of access to the cultural sector, while the class gradient in recruitment persists net of education.
What this analysis confirms, then, is that the shifts that can be observed in recruitment into cultural work over the past 50 years have been driven primarily by changes in the shape of Britain’s – increasingly middle-class – class structure. However, they are no less sociologically important or influential because of that. In accounting for the apparent misperception of older working-class cultural workers that they were the beneficiaries of a period of social openness that has now ended, it is to the changes in absolute mobility flows that we must turn. Here, in the first-hand, lived experience, of this group of older working-class creatives, we can find good reasons for why they count themselves members of a golden generation. In doing so, we have also shown how quantitative approaches to social mobility can achieve a breadth of purchase that complements and helps to contextualise recent issues around the subjective understandings of mobility brought to light by qualitative studies.
By highlighting changes in rates of absolute mobility, we have connected our analysis to the sorts of concerns seen about the class profile of creative work in recent policy documents. But, on a final note for policymakers, it is our findings on the longitudinal pattern of relative mobility in this sector that hold the most important implications. Disquiet about the profile of working-class origin creatives is well-founded in the context of structural inequalities in the creative economy (Brook et al., 2020). Low pay and precarious work, even when mixed with autonomy, job satisfaction and the potential for prospective financial reward, are obvious barriers to access for those without economic support. The particular types of cultural capital needed to make it into creative industries (Koppman, 2016) are additional obstacles for those who do not hail from professional and managerial backgrounds. Meanwhile, higher educational qualifications, closely associated with class inequalities, also shape the demographics of the cultural workforce. Yet, the long-term stability in rates of relative mobility into creative occupations that our analysis reveals offers an important corrective to policy audiences that continue to believe that the cultural work was once a beacon of meritocracy. Structural inequalities in the creative industries are nothing new and they are deep-seated. Equally deep-rooted reforms in career support and in hiring and promotion practices are required in order to reverse these.
Supplemental Material
sj-docx-1-soc-10.1177_00380385221129953 – Supplemental material for Social Mobility and ‘Openness’ in Creative Occupations since the 1970s
Supplemental material, sj-docx-1-soc-10.1177_00380385221129953 for Social Mobility and ‘Openness’ in Creative Occupations since the 1970s by Orian Brook, Andrew Miles, Dave O’Brien and Mark Taylor in Sociology
Footnotes
Appendix
Full model results for Figure 2.
| Covariate | Figure 2 (all) | Figure 3 (graduates) | Figure 4 (non-graduates) | |||||||||
|---|---|---|---|---|---|---|---|---|---|---|---|---|
| Coef. | Std. Err. | z | P>|z| | Coef. | Std. Err. | z | P>|z| | Coef. | Std. Err. | z | P>|z| | |
| Cohort 2 | −0.097 | 0.037 | −2.65 | 0.008 | −0.018 | 0.05 | −0.37 | 0.714 | −0.173 | 0.055 | −3.17 | 0.002 |
| Cohort 3 | −0.226 | 0.04 | −5.6 | 0 | −0.162 | 0.052 | −3.11 | 0.002 | −0.493 | 0.067 | −7.39 | 0 |
| Cohort 4 | −0.891 | 0.049 | −18.26 | 0 | −0.46 | 0.064 | −7.23 | 0 | −1.206 | 0.078 | −15.45 | 0 |
| From London | 0.476 | 0.039 | 12.08 | 0 | 0.475 | 0.053 | 9 | 0 | 0.531 | 0.06 | 8.87 | 0 |
| BAME | −0.078 | 0.063 | −1.23 | 0.22 | −0.416 | 0.084 | −4.98 | 0 | 0.117 | 0.098 | 1.2 | 0.23 |
| Male | 0.258 | 0.029 | 8.83 | 0 | 0.127 | 0.038 | 3.36 | 0.001 | 0.538 | 0.048 | 11.32 | 0 |
| NS-SEC I | 1.307 | 0.05 | 26.2 | 0 | 0.707 | 0.069 | 10.27 | 0 | 1.157 | 0.082 | 14.19 | 0 |
| NS-SEC II | 1.102 | 0.044 | 24.94 | 0 | 0.631 | 0.064 | 9.86 | 0 | 0.98 | 0.065 | 15.19 | 0 |
| NS-SEC III–V | 0.541 | 0.045 | 11.95 | 0 | 0.29 | 0.067 | 4.32 | 0 | 0.511 | 0.062 | 8.23 | 0 |
| Constant | −4.521 | 0.045 | −100.3 | 0 | −3.62 | 0.066 | −54.54 | 0 | −4.988 | 0.064 | −77.81 | 0 |
| N | 235,722 | 73,953 | 161,765 | |||||||||
| Likelihood ratio | 1531.41 | 338.55 | 764.57 | |||||||||
| P > chi2 | 0 | 9 | 9 | |||||||||
| Degrees of freedom | 9 | 0 | 0 | |||||||||
| Log likelihood | −23074.3 | −12205.9 | −10211.3 | |||||||||
Acknowledgements
The derivation of 1971 and 1981 NS-SEC is provided in Bukodi and Neuburger (2009) ‘Data Note. Job and occupational histories for the NSHD 1946 Birth Cohort’ as part of the ESRC Gender Network Grant, Project 1 ‘Changing occupational careers of men and women’, Reference: RES-225-25-2001. The code was kindly provided by Erzsebet Bukodi and adapted for use in the LS by Buscha and Sturgis as part of the ESRC grant ‘Inter-cohort Trends in Intergenerational Mobility in England and Wales: income, status, and class (InTIME)’. Award Reference: ES/K003259/1. The permission of the Office for National Statistics to use the Longitudinal Study is gratefully acknowledged, as is the help provided by staff of the Centre for Longitudinal Study Information & User Support (CeLSIUS). CeLSIUS is supported by the ESRC Census of Population Programme (Award Reference: ES/K000365/1). The authors alone are responsible for the interpretation of the data.
This work contains statistical data from the ONS that is Crown Copyright. The use of the ONS statistical data in this work does not imply the endorsement of the ONS in relation to the interpretation or analysis of the statistical data. This work uses research datasets that may not exactly reproduce National Statistics aggregate.
Funding
The authors disclosed receipt of the following financial support for the research, authorship and/or publication of this article: the authors are grateful for the support of the following funding for this research: AH/P013155/1, AH/S004394/1 and AH/S004483/1.
Supplemental material
Supplemental material for this article is available online.
Notes
![]() ). From 2012 to 2017, he led the major AHRC-funded Understanding Everyday Participation (UEP) research project and is currently writing a book based on this project for Palgrave Macmillan.
). From 2012 to 2017, he led the major AHRC-funded Understanding Everyday Participation (UEP) research project and is currently writing a book based on this project for Palgrave Macmillan.
References
Supplementary Material
Please find the following supplemental material available below.
For Open Access articles published under a Creative Commons License, all supplemental material carries the same license as the article it is associated with.
For non-Open Access articles published, all supplemental material carries a non-exclusive license, and permission requests for re-use of supplemental material or any part of supplemental material shall be sent directly to the copyright owner as specified in the copyright notice associated with the article.