
Abstract
This article presents a new critical engagement with the concept of Cultural and Creative Industries (CCIs), focusing on the rationale for grouping occupations and industries under this label. We show how the definition of ‘creativity’ used to demonstrate CCIs’ economic performance remains contested and variable, particularly with regard to the inclusion of specific parts of the IT sector. In demonstrating the importance of IT to the economic narrative regarding CCIs, we then unfold a related critique, exploring patterns in cultural consumption within CCI occupations. We demonstrate how some CCI workers have distinctively high cultural consumption, others reflect their broader social class, and some, including IT workers, show lower than expected consumption. Overall, we question the coherence of the prevailing CCI category, particularly in government policy, and suggest a new mode of ‘cultural’ occupational analysis for the sociology of CCIs.
Keywords
Introduction
Cultural and Creative Industries (CCIs) are now a well-established matter of concern for policy, practice and academic institutions. In the UK, CCIs are a priority area for the industrial strategy (HMG, 2017), and there is much high-level assertion of their role both for social cohesion and economic growth. Comments by the UK’s creative industries minister on diversity in broadcasting, for instance, capture this juncture between economic and social importance: Broadcasting is special. You aren’t only major and growing employers – important as that is. What we put on our screens represents the nation. It represents us overseas. It represents us to ourselves. It represents who we are, and who we hope to be […] Broadcasting has a special responsibility to ensure every diverse voice from every part and every community of our great nation is represented, literally and figuratively. (Hancock, 2016)
In the context of social divisions and economic uncertainty following the EU referendum in 2016, the ability to play this dual role can be seen as especially important, and this form of assertion is de rigueur for both policymakers and practitioners. At the same time as CCIs have been lauded, however, they have been subject to extensive academic engagement, largely from a technical or critical point of view, although these two strands of research have intersected (e.g. O’Brien et al., 2016). Critique has covered discussions of the working conditions (Duffy, 2017; Hesmondhalgh and Baker, 2011), exclusions and workforce inequalities (Conor et al., 2015; Oakley et al., 2017; Saha, 2017), and broader social issues associated with the rise of CCIs (Banks, 2017; McRobbie, 2015).
The importance of CCIs as an object of policy and research offers much for contemporary sociology. Recent work in the sociology of culture (e.g. Childress, 2017; Duffy, 2017; Gerber, 2017) has connected CCIs to broader sociological concerns regarding work, occupations and inequalities. This article develops this agenda, demonstrating how sociological methods can offer new perspectives on existing questions from disciplines engaged with the study of CCIs, and how insights from the sociology of CCIs might connect to broader discussions of inequality (Hanquinet, 2017). We connect technical discussions of CCI definition with critical literature on inequalities in CCIs, arguing that debates over the inclusion of particular industrial sectors, specifically forms of IT consultancy, have the effect of masking clear differences in the occupational basis of the CCIs. While this argument has been established by Campbell (2014) and O’Brien et al. (2016), here we build on this approach, counterposing patterns of cultural taste and consumption with narratives of economic success, based on analysis of data from the UK’s Department for Culture, Media and Sport (DCMS). This juxtaposition shows a core of ‘cultural’ industries (Hesmondhalgh, 2012) which have similar levels of economic performance, but whose workers (compared to the other CCIs, or the wider population) have distinctive patterns of cultural consumption. This ‘core’, however, does not include the part of the IT sector which drives much of the ‘good news’ on CCIs regarding high levels of Gross Value Added (GVA) and employment growth. Patterns of cultural taste and consumption in this sector are shown to be slightly below those in similar (i.e. NS-SEC 1 and 2) occupational classes.
This analysis has clear implications for policy and practice, and also contributes to recent academic debates, reinforcing the position of researchers seeking to disaggregate the ‘cultural’ from the ‘creative’ industries (Bakhshi and Cunningham, 2016; Hesmondhalgh and Baker, 2011; McRobbie, 2015), as well as casting further doubt on the sustainability of definitions of CCIs that subsume cultural activity within the long boom in IT. Finally, the article contributes to McRobbie’s (2016) call for a new sociology of creative industries, demonstrating the value of specifically sociological methods and analysis to the problematic concept the CCIs have become, as well as the importance of CCIs to broader sociological questions associated with socio-economic inequality.
To substantiate this argument, we begin by reviewing existing research on CCIs, establishing their sociological importance as well as setting up an engagement with technical debates on defining CCIs. We then explore the economic performance of CCIs under the various definitions employed by DCMS. This demonstrates the dominance of the IT sector within a narrative framing CCIs as being especially important economically. We then adopt an occupational analysis of data on taste and cultural consumption, showing the exceptionality of this IT sector in comparison to other CCIs, suggesting a new lens through which to focus arguments as to the coherence, or otherwise, of this group. We conclude with policy implications and possible approaches for further research.
Sociology and CCIs
The sociology of CCIs has bloomed in the last decade. While discussion of ‘cultural’, and then ‘creative’, industries has a longer lineage in geography and cultural and media studies (e.g. Bianchini and Parkinson, 1993; Garnham, 1990, 2005; Hesmondhalgh, 2002; McRobbie, 2002; Pratt, 1997), CCIs are now well established as an area of sociological concern. The subject has seen recent special issues focused on gender (Conor et al., 2015) and inequality (O’Brien et al., 2017), with labour and work in CCIs at the forefront of sociological discussions (e.g. Randle et al., 2015; Thompson et al., 2016; Wright, 2005). Sociological approaches have questioned, for instance, the impact of CCIs with regard to urban transformation (Miles, 2005), critiqued funding for cultural organisations within the creative economy (Alexander, 2018) and critiqued the global flow of expertise associated with promoting CCIs for economic development (Prince, 2014).
As the sociology of CCIs has developed, parallel work within the sociology of culture has framed the CCIs as important for sociology more generally. De La Fuente (2007) has focused on key developments in the sociology of art, outlining four lines of emerging scholarship united around the importance of art objects and artistic techniques. This outline is important for the question of how specific sociological techniques might contribute to the study of art, in the context of other disciplinary approaches. However, this understanding of the sociology of art does not specifically foreground work and occupations. This element is, however, seen in analysis by Childress (2017), Duffy (2017) and Gerber (2017) of the relationships between cultural production, representation and consumption. Focusing on specific occupations, these works demonstrate the increased salience of CCIs as objects of study for sociology.
The closest linkage of sociological concerns and CCIs is demonstrated by McRobbie (2016). CCIs featured as a core case study in McRobbie’s contribution to the 50th Anniversary special issue of Sociology, suggesting the importance of sociology to what McRobbie (2016: 935) calls ‘creative industries studies’. Here, sociological approaches are offered as both a means of ‘re-differentiating’ CCIs, unbundling this cluster of quite different industrial sectors and occupations, and a way of applying qualitative approaches to understanding occupational conditions and the experience of ‘creative’ or ‘cultural’ labour. Here we offer a parallel approach, supporting the ‘re-differentiation’ of CCIs, and showing how more quantitative methods (but not ‘big data’, of the variety McRobbie critiques) can also serve this agenda.
Critiquing CCIs
McRobbie’s engagement foregrounds questions of definition, and this is implicit in much other recent sociology of CCIs. The performative aspect of definition has been considered by many (e.g. O’Brien, 2014); that is, the fact that the very category of CCIs has been brought into being by a series of discussions as to their content, which have in turn underpinned their importance to academic, policy and practice agendas. Part of our goal here is to further critique these decisions around inclusions (or exclusions) that shape the influence of CCIs as a category.
Studies of cultural work and labour have also brought critique into discussions about CCIs, drawing attention to inequalities of gender (Conor et al., 2015), ethnicity (Saha, 2017; Wang Yuen, 2016) and social class (O’Brien et al., 2016). This literature has foregrounded the shared occupational cultures of CCIs based in the precarious nature of the labour market, both in how money is made and careers are sustained (e.g. Schlesinger and Waelde, 2012), and the vocational commitments necessary to pursue work in such precarious conditions (e.g. McRobbie, 2015). The implications of this critical tradition have been to question the distribution of the economic ‘good news’ from CCIs, asserting the importance of powerful somatic norms (Friedman and O’Brien, 2017) driving benefits to able-bodied white men from affluent social origins. This critical tradition is important here because it establishes the sense of shared occupational cultures that is important to our analysis of the creation of economic value and cultural consumption. As we demonstrate, thinking about CCIs through the lens of cultural consumption can reinforce a sense of shared occupational cultures and practices. These cultures and practices, however, do not unify the entire sector, and notably do not apply to the IT sector, yet this is the sector that has driven much of the economic impact of CCIs, and debates over its inclusion, or not, have been crucial to policy and practice narratives.
The critical tradition is thus important in thinking about the unity and potential of CCIs. In this context, researchers (e.g. Florida, 2002; Hesmondhalgh, 2018; O’Brien et al., 2016) have connected discussions of the nature of cultural work with technical, definitional discussions of the CCIs more generally. In Florida’s case this connection was part of establishing the narrative of a ‘creative class’ broad enough to encompass much elite or professional activity with US cities. The more critical work has aimed to either question the coherence of CCIs as a category (Campbell, 2011; O’Brien et al., 2016) or to preserve a core ‘cultural’ element within the definition and the associated study of occupations (Hesmondhalgh and Baker, 2011).
What these various conflicting engagements and definitions demonstrate is the continued lack of clarity as to the meaning and potential of CCIs. This is problematic for policy debates, whereby incoherent and inappropriate statistics are cited in public and policy discussions (DCMS, 2016a). It is also problematic for academic research, as there is the risk of competing research perspectives flattening out what are, essentially, different objects of inquiry.
Making Money and Making Culture
The case for the economic importance of the ‘creative industries’ within the UK has generally been made with reference to data on GVA and employment levels pertaining to a varying group of Standard Industrial Classification (SIC) and Standard Occupational Classification (SOC) codes deemed to adequately represent the sector. Statistics derived from these have been collated in ‘Creative Industries Economic Estimates’, regularly published until 2016. Such statistics have formed the basis of regular celebratory statements which have gained wider traction such as: ‘The UK’s creative industries are now worth a record £84.1 billion to the UK economy, figures published today reveal. British films, music, video games, crafts and publishing are taking a lead role in driving the UK’s economic recovery’ (DCMS, 2016b). While the use of SIC and SOC codes to represent these industries can be seen as something of a blunt instrument due to the difficulties for such trans-national coding schemes in keeping pace with developments in industry and employment types, these codes nevertheless do capture relevant data to some extent.
As highlighted above, many (e.g. Campbell, 2014; Tremblay, 2011) have noted problems with the commonality of the industries grouped together in this way. While we can see how figures on economic output in the statement above are linked specifically to industries such as ‘film, music, video games, crafts and publishing’, the single industry sector which contributes most to the figure cited is actually none of these, but rather ‘IT, Software and Computer Services’. For clarity, this category is not largely influenced by the ‘video games’ sector which is mentioned, which is responsible for under 5% of the sector’s overall GVA, but rather includes organisations ‘such as Capita, Logica, Misys and Siemens’ (Campbell, 2014: 999), conducting ‘the planning and designing of computer systems which integrate computer hardware, software and communication technologies’ (ONS, 2009: 189).
This misalignment between data and claims-making was acknowledged in the Economic Estimates published in 2011. At this point, SIC codes relating to ‘Computer consultancy activities’ and ‘Business and domestic software development’ were removed, with an explanation that the activities ‘captured [by these codes] were more related to business software than to creative software’ (DCMS, 2011: 9). The annual release in 2011 thus concluded that, although smaller, such an alteration resulted in ‘GVA estimates [… which are] a more accurate representation of the current UK Creative Industries’ (DCMS, 2011: 10).
This amendment, and the resultant reduction in magnitude of the statistics used to support the economic importance of CCIs was, however, soon reversed by further work which sought to clarify the most appropriate measurement techniques. The SIC codes removed in 2011 returned in more recent figures due to a consideration of the ‘creative intensity’ of the industries under consideration. This concept is based on a model delineating: (1) creative occupations within creative industries; (2) non-creative occupations in creative industries; (3) creative occupations outside creative industries. The higher the proportion of creative occupations within an industry, the higher the ‘creative intensity’.
The 2016 DCMS Economic Estimates Methodology (2016a: 7) identifies NESTA’s ‘Dynamic Mapping of the Creative Industries’ report (Bakhshi et al., 2013) as the source of a ‘replicable methodology’ to define creativity with regards to the three categories listed above. This report (Bakhshi et al., 2013: 6) rightly identifies that, despite the increasing prominence of CCIs, no consistent definition of creativity had yet emerged, leading to situations such as those above where IT can be seen as ‘creative’ in some senses, and so included in data reports, or not ‘creative’ in the same sense as film, music and so on, and so not included.
To rectify this situation, NESTA propose five criteria by which creativity can be identified (Bakhshi et al., 2013: 24), although the summary given of these criteria indicates that some questions regarding definition remain: Of course, each of these five criteria are problematic when considered in isolation, and they do not offer hard and fast rules for determining whether an occupation is or is not ‘creative’. […] But occupations which score positively on all or most of the indicators, we believe, are very likely to function as an economic resource that the creative industries require. (2013: 25)
Given the importance of definition to the scale of statistical data in relation to creative industries’ economic output, we may be cautious about the conclusion of ‘replicability’ regarding a method described in this way, offering no ‘hard and fast rules’.
This nevertheless is the core of the definition used in the 2016 Economic Estimates, with industries deemed to meet a 30% threshold of ‘creative intensity’ ‘considered as candidates for inclusion’ (DCMS, 2016a: 7) within the creative industries grouping. Crucially, the positioning of this threshold at 30% allows SIC codes within the ‘IT, Software and Computer Services’ category back in to the ‘creative industries’ data reporting process. The crucial ‘computer consultancy activities’ category, which alone is responsible for more than a quarter of the GVA attributed to the creative industries, falls slightly above the 30% ‘creative industry’ threshold. (It should be noted that, despite their ‘creative intensity’ being lower than 25%, museums and libraries are also deemed worthy of inclusion ‘after consultation’.)
Following Campbell (2014), then, we can consider whether the story of the potential success of CCIs continues to be, at least in part, the story of the success of IT consultancy, aligned with a narrative around the need to promote the arts, thus giving a misleading picture of the potential benefits to be drawn from more cultural work. Figure 1 shows GVA for the UK as a whole, plotted against (1) the GVA solely of the IT-related part of the ‘creative industries’ grouping, and (2) the GVA of the remaining, non-IT-related, creative industries.
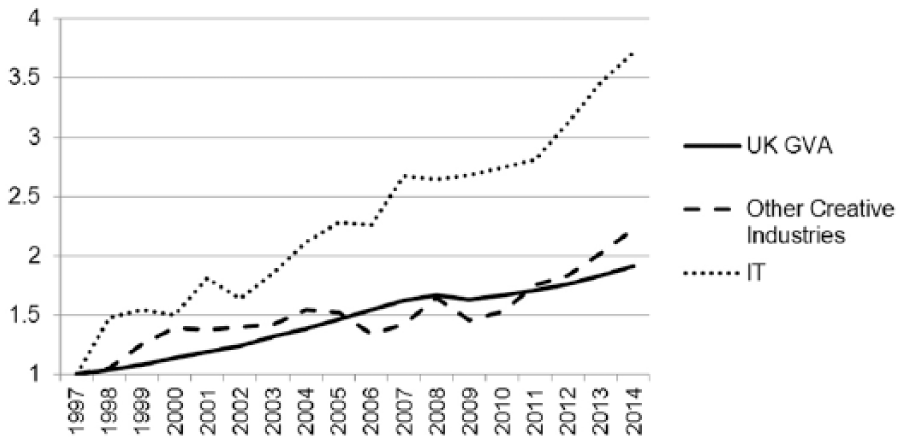
UK vs Creative Industry GVA growth (1997 baseline).
A consistent outperformance of the UK as a whole is clear for the IT-related creative industries. The picture for the ‘other’ industries is somewhat more variable, and tracks overall UK GVA more closely. Without computer consultancy and other business-related IT data, therefore, the narrative of CCIs of exceptional size and growth could not be made in such a robust manner. It should also be noted that ‘IT, Software and Computer Services’ is consistently the biggest subsector in the creative industry grouping, in terms of GVA, number of enterprises and employment levels, and that figures from the Inter-Departmental Business Register show its percentage share of the overall category has consistently increased year-on-year from 2012–2016.
Cultural Tastes by Occupation
Key elements of the ‘good news’ about CCIs, then, have been driven by those sections of the CCIs that have been subject to most debate. Computer consultancy and other business-related IT activities have been contested, most obviously by Hesmondhalgh (2012), as being distinct from other cultural industries as they do not originate or circulate social symbols or texts. They have also been shown to have a very different character in terms of occupational cohorts, who are much more male and ethnically diverse than other CCIs (O’Brien et al., 2016).
Here we add to this critique by considering shared occupational cultures within the CCIs. As discussed above, shared occupational cultures are crucial to critical perspectives on CCIs. Researchers describe precarious, individualised, but also autonomous and potentially rewarding, labour conditions as a shared experience common to CCIs. These shared experiences of CCI labour markets translate into shared cultures of work.
We adopt a different perspective on shared culture which compliments existing work. Recent US research has shown the importance of cultural tastes and knowledges in explaining entry and success in elite professions (Rivera, 2015). These insights have been applied to CCI work in the USA by Koppman (2016), who has shown the crucial importance of shared repertoires of taste and cultural capital to hiring practices. Having the ‘wrong’ tastes, or at least not having the right set of cultural expertise, can thus be a way of organisations sorting out people who are considered to be not ‘like them’ and thus not an appropriate hire. While these barriers may be associated with cultural interests, given how cultural engagement is socially patterned in both the USA (Lizardo and Skiles, 2012; Peterson and Kern, 1996) and the UK (Taylor, 2016a), they are also likely to replicate broader social inequalities of class, race and gender.
Based on this research, we might thus expect a shared occupational culture to have associated shared patterns of taste, or at least shared orientations to cultural consumption. For example, Warde and Bennett (2008) have shown the commonalities of cultural interests and orientations to culture within senior professionals in the UK. We might therefore expect this taste and consumption aspect of occupational culture to be especially important in those areas of economy and society that are tasked with producing texts, signs and symbols, whether as intellectual property (DCMS, 1998) or otherwise.
Analysing Cultural Consumption: Methods
We investigate this issue using data from the Taking Part Survey (TPS). TPS is an annual face-to-face survey administered by DCMS. It is nationally representative for England, and has run each year since 2005/2006, with response rates varying between 55.0% (in 2006/2007) and 63.3% (in 2011/2012) (DCMS, 2016c). TPS was used to measure the UK Government’s Public Service Agreement 21, Indicator 6 concerned with increasing the number of people who participated in culture and sport (DCMS, 2010). Although this is no longer a key indicator, biannual releases are still published on a wide range of measures from TPS, and these have National Statistics status.
One historic issue with TPS is its focus on measuring participation in, and attendance at, cultural activities of specific interest to government policy, rather than any broader definition. While not as narrowly defined as the US Survey of Public Participation in the Arts, until recently, for instance, respondents were asked numerous detailed questions about their engagement with visual art, and a single question on video games (Taylor, 2016a, 2016b). Nonetheless, it is the best source of data to understand cultural consumption in England, and possibly the best single survey on cultural consumption in the world.
TPS is useful here for two reasons. First, due to levels of detail. Taking attendance at events as an example, the survey includes 18 different items for particular event types which are asked consistently across waves. Second, it has large sample sizes; the first wave had around 28,000 respondents, and more recent waves have had around 10,000 respondents. There are sufficient numbers, therefore, working in different occupational subgroups within the broad CCI grouping to enable distinctions to be made between jobs within the sector, rather than simply distinguishing all CCI workers from all non-CCI workers. Put another way, the numbers working in each of these occupational groups would be too small to generate meaningful comparisons within a single wave of data, but this can be achieved by combining data across multiple waves.
Here we use multiple correspondence analysis (MCA) to consider cultural consumption. Popularly associated with the work of Bourdieu, but used by both Bourdieusian and non-Bourdieusian researchers into cultural consumption (e.g. Bennett et al., 2009; Reeves, 2012), MCA is a technique for the analysis of categorical data, wherein a smaller number of dimensions is derived from multiple categorical variables, illustrating patterns of similarity or dissimilarity across these variables. This analysis therefore generates continuous variables (or ‘dimensions’), and the positions of the original variables in the analysis are plotted on these dimensions. Categories with high levels of overlap among participants are mapped closely together in these dimensions: for example, if most opera-goers also attend the ballet, these two items will be spatially closer together.
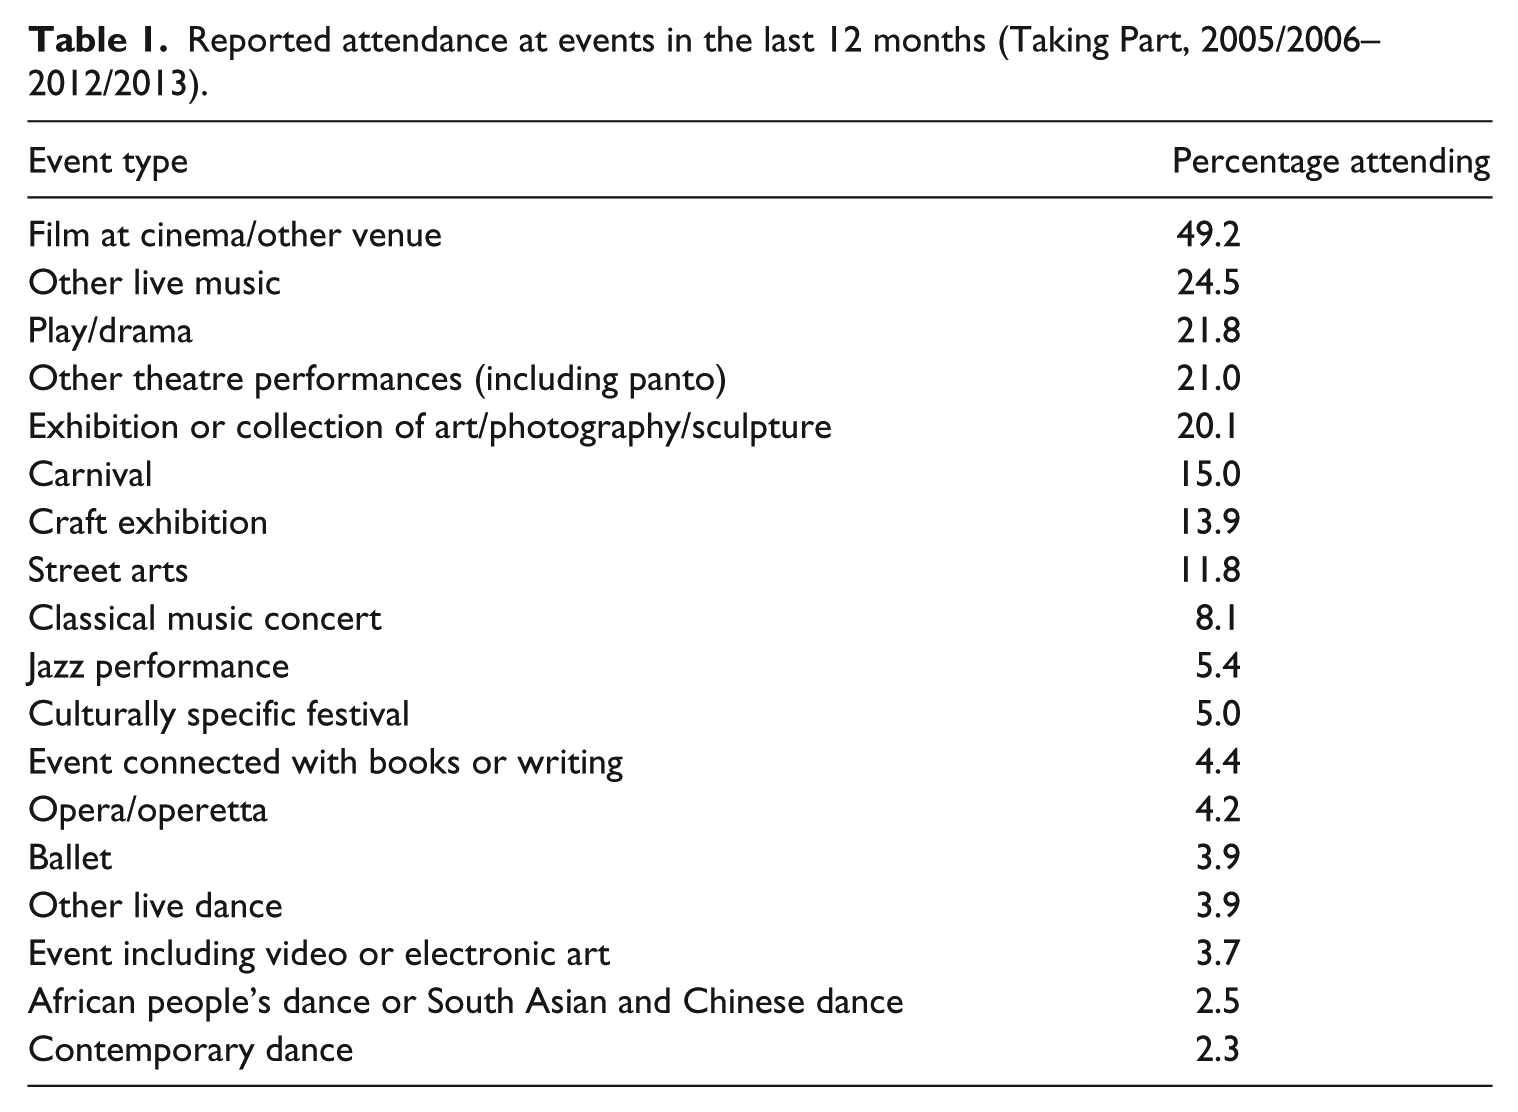
The variables used for MCA are the 18 variables in the ‘arts attendance’ section of TPS present in each wave. Respondents are asked, ‘In the last 12 months, have you attended any of these events?’, and are presented with a list of activities, randomly ordered. While this is an imperfect measure of cultural consumption – for example, it excludes watching television, playing sport and many activities not directly associated with the national Arts Councils – it has two key benefits. The first is that, unlike the participation section of TPS, most of the activities are attended by at least 5% of the population. In comparison, under 1% of survey respondents practise ballet, under 2% write music and so on. The second is that it measures how participants report actually spending their time, as questions ask whether respondents have been to particular events in the preceding 12 months; this can be contrasted with much research using MCA which instead focuses on expressed tastes and preferences. The activities, and the proportion participating in each activity, are summarised in Table 1.
Reported attendance at events in the last 12 months (Taking Part, 2005/2006–2012/2013).
The MCA findings below add two supplementary variables to further understand the patterns in the data. The first supplementary variable is a 10-class version of the NS-SEC schema. The second supplementary variable includes individual categories for groupings within cultural and creative jobs. In considering these variables, we are able to identify how different occupational groups’ cultural consumption varies, while also being able to identify the extent to which people working in creative jobs are different not only from the general population, but also from the socio-economic class from which they are drawn. Put more simply: while people working in ICT might have higher levels of cultural consumption than the general population, these levels of cultural consumption may be in keeping with others working in middle-class jobs.
Table 2 shows the classification of cultural and creative jobs in TPS against their three-digit SOC codes, with sample sizes, and the proportion in NS-SEC groups 1 and 2.
Three-digit SOC codes of CCI occupations, corresponding Ns and percentage in those jobs classified in NS-SEC 1 and 2 (Taking Part, 2005/2006–2012/2013).
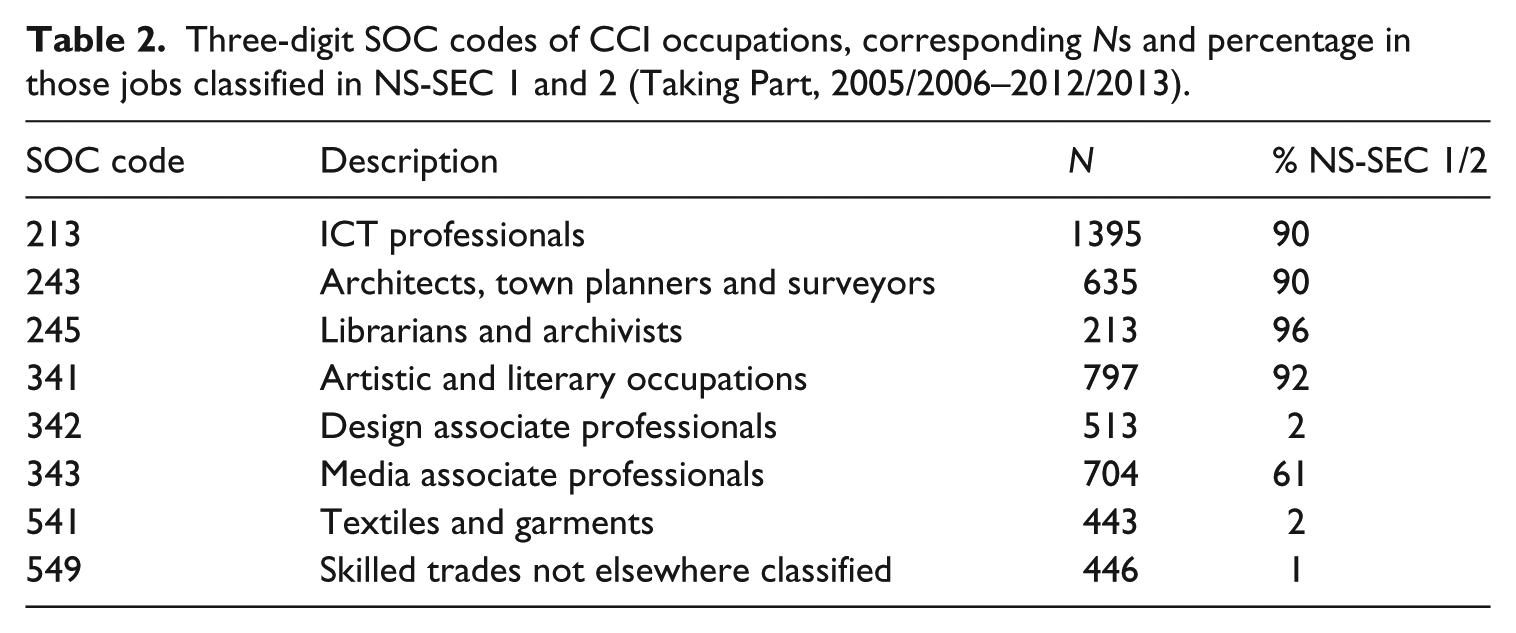
As the final column in Table 2 demonstrates, these groups are quite varied. Almost all of those working in ICT, architecture, planning and surveying, libraries and archives, and artistic and literary occupations are classified as being in managerial and professional jobs. By contrast, 61% of those working in the media, and only 1–2% of people working in design, textiles and garments, and other skilled trades are (cf. Oakley et al., 2017; O’Brien et al., 2016).
We extend this analysis through the use of regression. One problem with MCA is that it can only report gross rather than net effects of particular variables associated with social stratification on cultural consumption. As Chan and Goldthorpe (2007a: 321) note, ‘it can give little indication of whether these associations are all of comparable importance or whether, perhaps, one is dominant, another spurious, and so on’. In using regression, we are able to identify whether occupations’ cultural consumption is typical of the social classes from which they are drawn, and more generally whether their cultural consumption is distinctive net of other variables known to predict cultural consumption, such as social status and educational attainment.
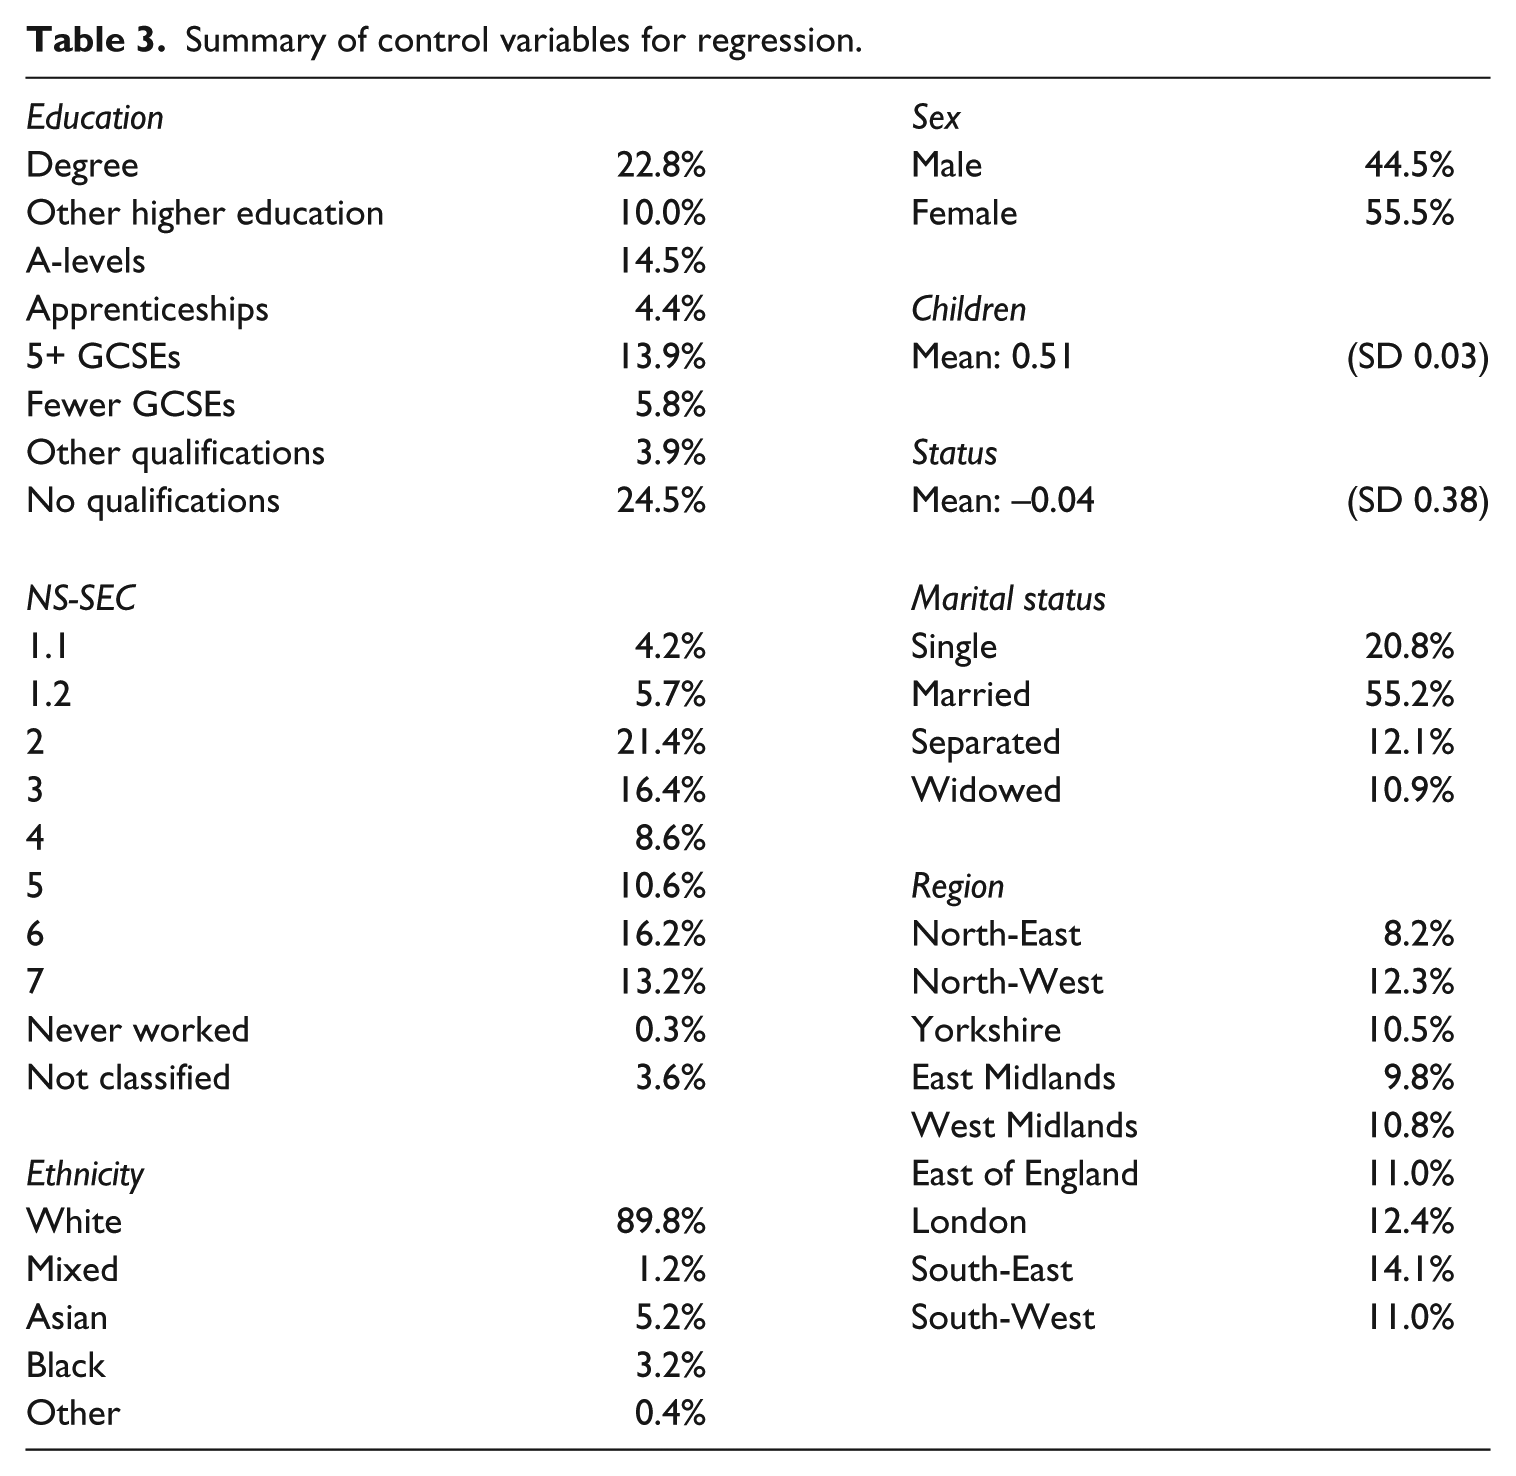
In deriving a set of potential confounding variables, we follow both Chan and Goldthorpe (2007b) and Bennett et al. (2009), with these projects having slightly different focuses, on cultural consumption and cultural tastes respectively. Both include measures of educational attainment as key predictors of cultural consumption, while also incorporating measures of gender and ethnicity. Reflecting the different data sources used, Chan and Goldthorpe also use region of England, marital status and family structure. The crucial difference between the two is in Chan and Goldthorpe’s measure of social status in the Weberian sense, based on social interactions, which they find to be a better predictor of cultural consumption than social class. This is a crucial difference in this context: people working in artistic and literary occupations may not be well paid, or classified in NS-SEC 1 occupations, but their jobs are high-status on this scale. The variables used in the regression are summarised in Table 3.
Summary of control variables for regression.
Our definition of groups within CCI occupations follows DCMS’ own definition (DCMS, 2016a: annex B). While detailed four-digit SOC codes are not available in TPS data to maintain anonymity, three-digit codes are available which enable the process of distinction within CCIs described above to take place. While, for example, we are not able to distinguish between artists, actors, dancers and musicians, we are able to treat them as a single ‘artistic and literary occupations’ group and distinguish this group from other CCI subgroups. We limit our use of data to the first eight waves of TPS: 2005/2006 to 2012/2013 (subsequent waves of the survey contain only NS-SEC social class data, and do not contain SOC code data). This provides a total sample size of 123,122. Pooling waves in this way entails the assumptions that the relationships between activities do not change between waves, nor do patterns of cultural consumption by NS-SEC and CCI group. (Running analyses for separate waves does yield almost identical results, albeit with much wider confidence intervals due to smaller sample sizes.)
MCA and regression are conducted in Stata 14.2 (StataCorp, 2015), while graphics are generated using the ggplot2 and ggrepel packages in R (Slowikowski, 2016; Wickham, 2009).
Results
MCA results are summarised in Table 4. These results indicate that only the first two dimensions should be considered; the first dimension is overwhelmingly the most important in terms of summarising information from all the variables, at 91% of the overall inertia, while the second accounts for 2.2% of the inertia.
Principal dimensions and inertias from MCA.
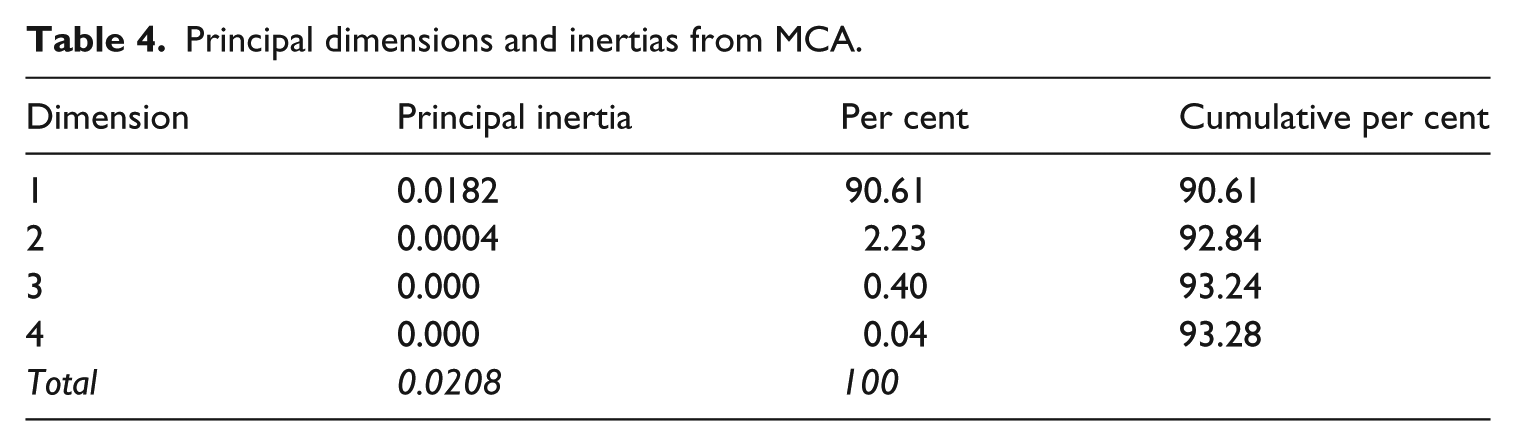
Figure 2 projects cultural attendance data into two-dimensional space. Common to MCA, the positive end of the x-axis is associated with not participating in activities. The N of 123,122 is the number of respondents across all waves of TPS referred to above.
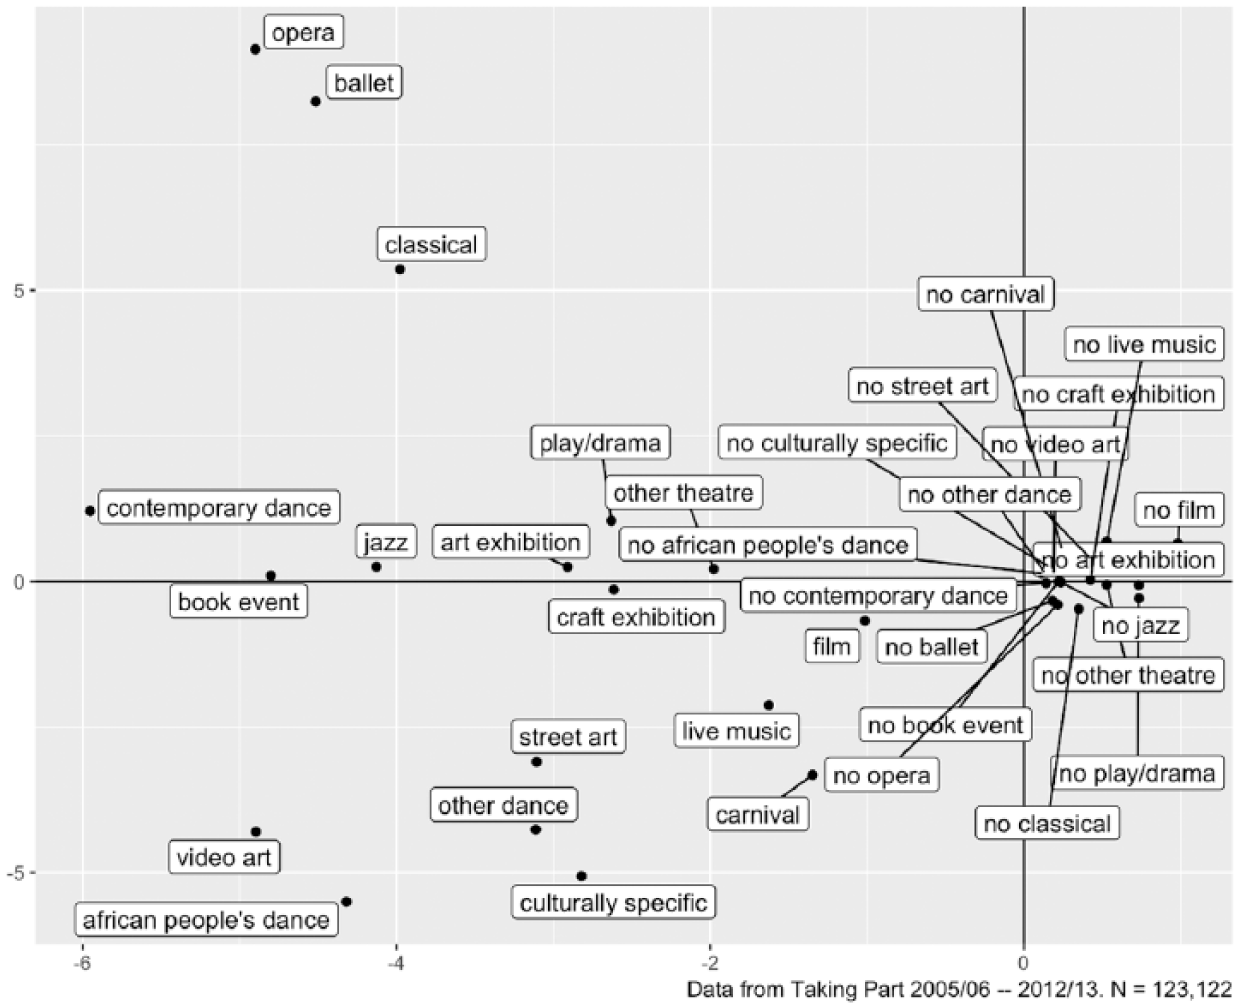
MCA based on the arts attendance module of TPS.
These results show that current attendance at cultural events in England shows similar patterns to previous analyses of this topic (e.g. Bennett et al., 2009). The main distinction, as seen on the x-axis, distinguishes activity from inactivity; every activity on the right-hand side of the origin is a value where a respondent has not done an activity, while the opposite is the case on the left-hand side. The values furthest to the left of the plot generally represent those activities that have fewer people participating in them, representing more unusual examples of cultural consumption. The main way in which people are distinguished from one another is therefore whether, and how much, they attend, rather than what they attend.
The y-axis distinguishes more classical from more contemporary activities. In the upper half we see opera and ballet; in the lower half video art, and culturally specific festivals. The activities with positive values on this dimension generally take place in silence or close to it, while those with negative values take place in noisier and less formal settings (with the exception of video art). The secondary way in which people are distinguished from one another is therefore whether they attend events that are more classical or more contemporary (acknowledging that this second ‘dimension’ is a less effective distinction than the first).
In order to understand how cultural consumption varies across different CCI occupations, and different occupational groups, Figure 3 reports the coordinates of each NS-SEC and CCI group in the dimensions from Figure 2.
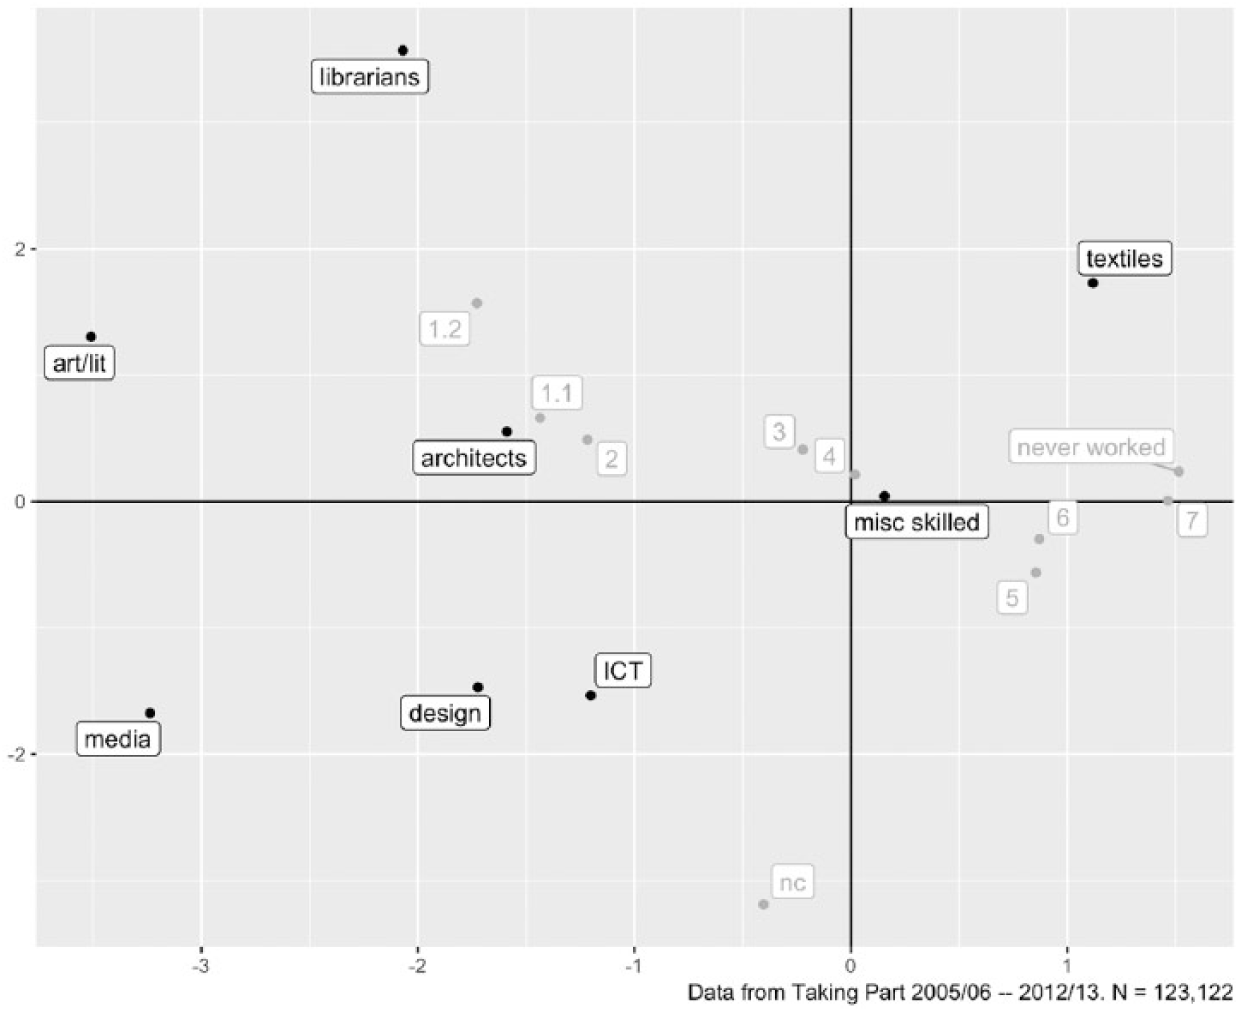
Projections of occupational variables into MCA.
Again, the relationship between social class and cultural consumption is similar to that seen in other studies (Bennett et al., 2009). While NS-SEC is not a hierarchy, it can be seen very clearly here that there is most cultural consumption among those working in jobs classified as NS-SEC 1, showing further to the left of Figure 3 (although senior professionals’ consumption is greater than senior managers’), while there is least among people in unskilled manual jobs and those who have never worked, on the right. On this first dimension, the largest differences are between people in managerial and professional jobs (NS-SEC 1 and 2) and those in intermediate jobs and small account workers (NS-SEC 3 and 4), while there is a smaller difference between them and those in more traditionally working-class jobs (NS-SEC 5–7); cultural consumption is highest among people in managerial and professional jobs, lower among people in intermediate jobs and lowest of all among people working in traditionally semi-routine and routine jobs. The differences between NS-SEC groups on the second axis are smaller, with two exceptions: senior professionals skew more towards classical forms (with higher scores on the y-axis), while those whose occupations cannot be classified (largely students) skew more towards contemporary forms.
The differences between overall NS-SEC classes are far smaller than those seen between CCI workers. Those working in artistic and literary occupations, and in media associate occupations, have far higher rates of attendance than even managers and professionals, let alone the overall population. Their consumption is also vastly more classical; by contrast, those working in the media have higher rates of consumption of contemporary forms. While those working in libraries and archives do not have as high rates of consumption as their artistic, literary and media equivalents, their overall cultural consumption (measured by the x-axis) is still noticeably broader than managers and professionals more generally. What is noticeable about librarians and archivists, however, is their high score on the y-axis, implying that their moderately high cultural consumption is driven predominantly by attending classical forms such as ballet, opera and classical music.
These groups can be contrasted with the other CCI occupations. The remaining two groups that largely consist of managers and professionals, architects and ICT professionals, have overall rates of consumption not particularly distinguishable from managerial and professional jobs more generally. Architects tend towards the more classical (top left quadrant), while IT professionals tend towards the more contemporary (lower quadrant); in this way, architects’ cultural consumption is almost exactly what would be expected from any managerial and professional worker, while IT professionals’ cultural consumption is slightly lower than would be expected.
By contrast, while designers’ overall consumption is only marginally greater than that of architects’ and ICT professionals’, this should be put in the context that designers are far less likely to be classified as being in managerial and professional jobs in the first place. Their cultural consumption is moderately high, but compared with the people working in intermediate jobs with whom they are grouped, their cultural consumption is unusually high.
These groups are also very different from the two major groups classified as working in crafts: textiles workers, and other miscellaneous skilled workers. While these groups suffer most definitionally from concatenating CCI workers with people working in other sectors – not all of the miscellaneous skilled workers are actually working in CCI jobs – it is striking here that these groups’ cultural consumption is low. Those in miscellaneous skilled trades have barely higher consumption than people in other working-class jobs, while those in textiles have low consumption, albeit in more classical forms.
We can thus conclude that TPS data demonstrate that the groups with distinctive cultural consumption are artistic and literary professionals, media professionals, librarians and archivists, and designers. The cultural consumption among other CCI occupations is similar, or lower, to what could be expected for the social class they are in.
We finish with the regression framework, in which we explore the distinctiveness of different occupations’ cultural consumption more systematically, allowing us to understand how much this distinctiveness is driven by other factors. Figure 4 reports regression coefficients for ordinary least squares (OLS) models for the two MCA dimensions referred to above. The points represent the coefficients associated with each variable, while the lines on either side represent 95% confidence intervals. Where lines do not overlap, coefficients can be considered to be significantly different from one another at the 95% level. N here is somewhat smaller due to missing observations on control variables.
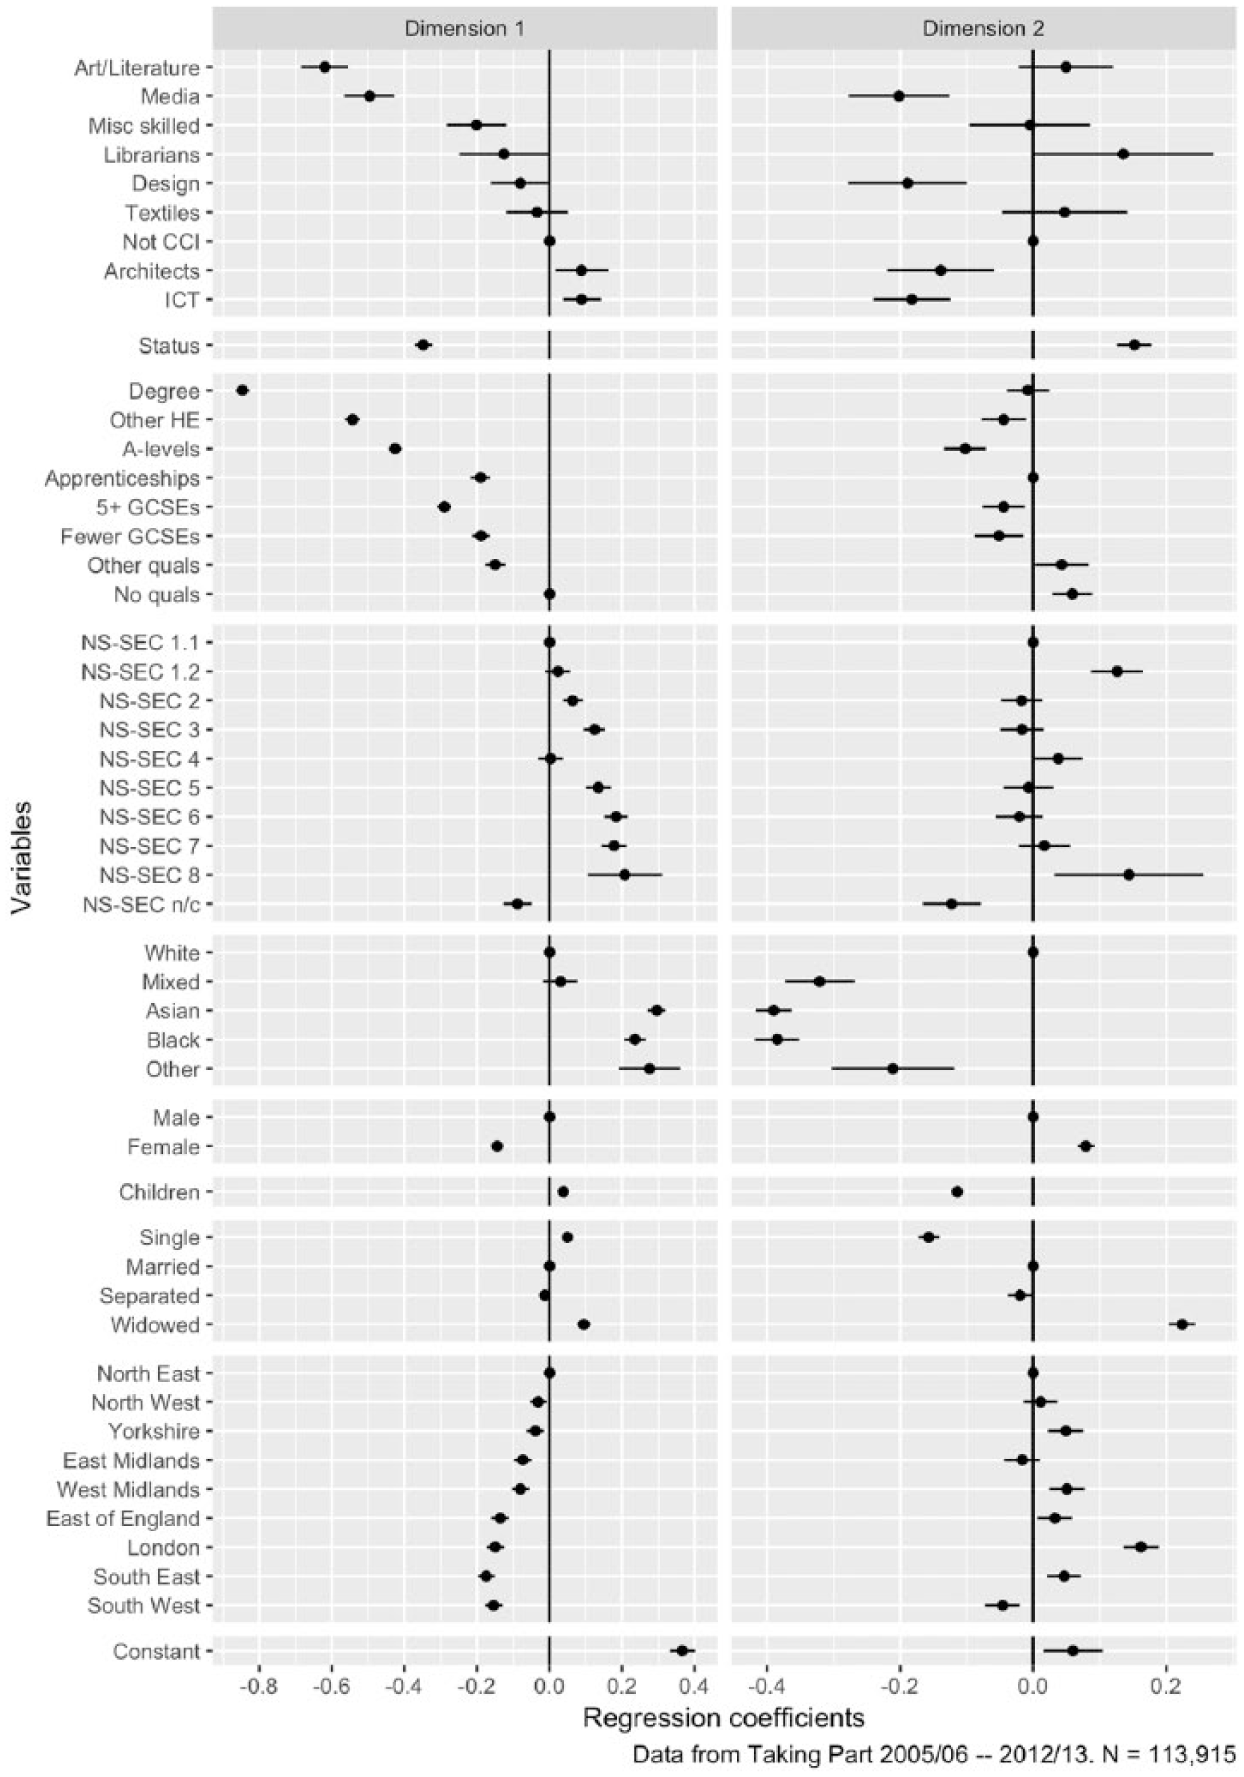
Regression results for dimensions 1 and 2 from MCA.
These results show that the relationships between our potential confounder variables and cultural consumption are largely consistent with what is seen in other research – the largest differences are between those with degrees and those with no qualifications; social status predicts differences in both volume and type of cultural consumption; white people’s cultural consumption is greater than that of black and minority ethnic (BME) people, except those with mixed ethnicities; women’s cultural consumption is greater than men’s; cultural consumption is highest in the South and so on. The existing literature on the relationships between cultural consumption and different demographic variables is reinforced.
These results also show that much of what is distinctive about cultural workers’ cultural consumption persists net of these potentially confounding variables; people working in artistic and literary occupations are not distinctive solely because they are highly educated, there is something unusual about these jobs themselves. People working in artistic and literary occupations, and in the media, have vastly higher cultural consumption than would be predicted from their social status and education, while those working in libraries and archives, and in other skilled trades, also have higher cultural consumption than would have been expected otherwise. Those working in architecture and in IT have lower cultural consumption than would have been expected otherwise.
Having controlled for social status in particular puts the results on the second dimension into a different light. People working in higher-status jobs – which those working in the CCIs disproportionately are – have more classical consumption than people working in lower-status jobs, even when education and social class have been controlled for. There are implications for this in understanding the cultural consumption of people working in the CCIs: although people working in archives and libraries, in artistic and literary occupations, and in textiles, have higher classical consumption than would be predicted by the other variables, these differences are not significant at the 95% level. By contrast, although architects are above the intercept in Figure 3 – with more classical consumption than average overall – their high social status means that, when everything else is controlled for, their consumption is more contemporary than would have been expected.
Conclusion: The Social Life of the Creative Industries
Writing in 2002, Florida heralded the rise of a culturally engaged ‘Creative Class’ that would provide the basis for economic growth and urban transformation in post-industrial cities. Fifteen years later, summarising changes in the sociology of cultural consumption, Hanquinet (2017) concluded that patterns of deep engagement across a range of cultural forms constituted a new dividing line of distinction in society. These two moments, from two different approaches to CCIs, provide a route towards conclusions. On the one hand Florida’s (2002) work was celebratory of the potential for creative work, which has been embedded in much policy discourse, particularly in the UK. On the other, the cultural field continues to provide a stark example of social divisions, particularly when, as we have argued, it is viewed in the context of the occupations that are supposedly central to the creative economy.
We have shown the distinctions between the economic performance of CCI sectors, with one, IT, being the main driver of the ‘good news’ of CCIs’ economic impact. By analysing cultural consumption patterns of CCI occupations, we reinforce this difference, showing those occupations are also less engaged in cultural consumption. This finding presents a dilemma for those voices from the arts and cultural sectors wishing to make the economic case for government support and investment. The sector must, therefore, be cautious as to the weight it gives economic narratives.
DCMS (2017) has recently begun gestures towards disaggregation of economic impact statistics, in recognition of the distinctions between IT and other ‘cultural’ industries (Bakhshi and Cunningham, 2016). However, there is little sign of meaningful travel away from previously established discourses (DCMS and BEIS, 2018). There is thus the risk of continued blurring of the important symbolic role of other CCI professions, which often aligns with a reality of low pay cultural work, as mainstream sociology has been at pains to demonstrate.
Ironically, interventions to widen the ‘pipeline’ into these especially precarious occupations may be justified via narratives of exceptional economic performance. Moreover, the specific taste patterns identified above speak of unequal division in cultural consumption within CCIs, again obscured by the inclusion of IT. We see the presence of a subgroup of highly culturally engaged workers, but these occupations are not those driving exceptional economic growth in CCIs, and demonstrate that cultural distinction, by taste, associated with working in these jobs, poses continuing questions for narratives around the universality and openness of CCIs.
Alongside the need for policy to rethink the aggregation of CCI statistics and continued interventions which uphold unequal patterns of cultural consumption, there are several implications of this analysis for sociological thinking and further research. First, it provides further empirical support for McRobbie’s call for a ‘re-differentiating’ of CCIs. If there is to be an unbundling of this category, then it is clear that sociologically informed research will be crucial to establishing new and more coherent understandings. Relatedly, we must consider the ‘social life’ (O’Brien, 2014) of any subsequent new methods of understanding. Rethinking CCIs must be careful to avoid the problems outlined with current understandings, particularly as sociological thinking has well observed the problems with the celebratory narratives of CCIs so popular with artistic and cultural policy voices (e.g. Campbell et al., 2017; Conor et al., 2015; Miles, 2005).
Finally, this analysis shows the value of thinking about CCIs as occupations, as well as industrial sectors. There is a rich tradition of this work within qualitative and ethnographically driven sociology, and bringing together the approach outlined in this article with these individual occupational studies will have rich potential for future research. Most pressing will be the potential for this research to inform new industrial strategies for CCIs, which otherwise run the risk of promoting unequal and exclusive occupations based on economic performance data derived from industrial sectors with which they have little in common.
Footnotes
Acknowledgements
We are grateful to the anonymous referees for their helpful comments.
Funding
This work was supported by AHRC grant AH/P013155/1, ‘Who is missing from the picture? The problem of inequality in the creative economy and what we can do about it.’