
Abstract
Analyzing social media networks is crucial for understanding and uncovering common interests and characteristics among users within human societies. In this context, we simulated a simple application of human interaction in social networks, which involves users following others based on text similarity. We then investigated the effects of various machine learning (ML) algorithms employed in the applications to be used as recommendations to decision-making users. A novel agent-based social network simulator called distributed system and multinode processing is developed to assess the parallelization of the ML algorithms (i.e., K-means clustering, cosine similarity, support vector machine, multilayer perceptron) using bag of words (BoW) term frequency-inverse document frequency vectorization by evaluating their performance when executed in parallel across distributed heterogeneous resources. In addition, this simulator compares the effects of BoW with the Doc2Vec model on network structure by observing the differences in detected communities and resulting network graphs when a selected user follows the recommendations produced by an employed algorithm. Three real datasets were used in the experiments: Twitter, Scientific Research Papers, and Retail. This work’s contribution is a unique in-house agent-based simulator developed to analyze the impact of common ML algorithms, including supervised and unsupervised learning, on social networks.
Keywords
1. Introduction
Social network analysis (SNA) explores the fundamental structure of social networks by examining the ties established between the social entities and patterns of interaction between social actors in social networks. Tabassum et al. 1 reviewed common tasks of SNA to uncover the users’ social interaction within a network using link analysis and community detection methods. Bedi and Sharma 2 explained how detecting communities is helpful in real-life scenarios, such as finding a common research area in collaboration networks or providing recommendations to similar users in social networks. Through SNA, we can also gain valuable insights into how users make decisions within a network. The decisions users make can directly impact the structure of the social network. For instance, the tendency of users to follow others who share similar interests could potentially result in the creation of closely connected communities within the network. Li et al. 3 proposed a model that uses social influence and contextual information to model decision-making behavior within social networks. In addition to the users, the structure of a social network can be changed by applications such as recommender systems when establishing new recommended connections among its users. Recommender systems use complicated algorithms, including collaborative filtering, which are out of the scope of this paper. In this work, we are interested in common machine learning (ML) algorithms used in many social network applications, including simple content-based (CB) recommender systems that only process the text of the tweets, titles of the papers, or transaction texts to learn user preferences for similar users. Choosing an appropriate ML algorithm to be integrated into a recommender application has a notable impact on the recommendation items and performance of the recommender system. Portugal et al. 4 conducted a systematic review of the use of ML algorithms to help recommender system developers recognize the algorithms and understand their applications.
In this work, we examine ML algorithms such as K-means clustering, cosine similarity, support vector machine (SVM), and multilayer perceptron (MLP) when using the bag of words (BoW) vectorization, as they are used in the applications to analyze the text data represented as a vector of word counts. The Doc2Vec model is considered in a different category, as with feature representations of texts, it captures words’ semantic and syntactic qualities. Each algorithm within these two categories with a distinct representation of text data generates recommendations based on the similarity of the content. The choice of using K-means clustering, cosine similarity, SVM, MLP, and so on, with BoW and Doc2Vec models as commonly used ML algorithms and analyzing how they can change the network structure and the resulting communities of the network are open questions. In this work, an essential question is how the network graph structure and number of detected communities would differ after users of Twitter, Scientific Research Papers, and Retail networks follow the recommendations provided by a social network application employing the algorithms mentioned above. Recommendations can create new communities within a graph structure, where users are represented as vertices. These communities are clusters of vertices that share similar characteristics. For example, the recommendation could be a publication venue from a Scientific Research Papers dataset, a followee from a Twitter dataset, or a retailer from a Retail dataset. These recommendations, derived from the user’s similarities, can create a new connection with a particular user within the community or social network graph.
To address these questions, a novel social network simulator, distributed system and multinode processing (DSMP), is developed to study the impact of different algorithms on the structure of social networks, including the formation of communities, the spread of information, and changes in the network properties. An important feature of social networks is that data are distributed on different sources or servers, referred to as computing nodes in this work. Thus, DSMP is designed to simulate a simple application using the algorithms above to find text similarity in Twitter, scientific literature, and Retail datasets. The parallelization for each algorithm is achieved by adding computing nodes and parallel processing of the replica of each application when used with distributed data on these nodes. The achieved speedup (i.e., parallelization) is mainly the result of distributed data processing on simulated social network nodes, which is the real data of Twitter, Scientific Research Papers, and Retail datasets collected for the experiments. We measured and compared the total time of running applications on multiple nodes, knowing that the difference between the total time of processing the same data results from using each specific algorithm. Therefore, the parallelization factor explained in Section 4.2 is the speedup gain for the same application when using each specific algorithm discussed in this work. This work’s main contribution is using simulation of social networks and a related application that can be summarized as follows:
We use simulation to study the parallelization capability and network side effects of the wide range of ML algorithms when employed in the applications using text processing by Natural Language Processing (NLP) in social networking by simulating the users and algorithms in the distributed environment.
We simulate a simple text similarity application for social networks to study the effects of accepting recommendations provided by that application using specific ML algorithms (i.e., the K-means clustering, cosine similarity, SVM, MLP, and Doc2Vec) in forming the social networks among the users.
We develop a framework for the simulation of social networks and ML-based applications for parallel processing of text data within a network graph structure. This framework (called DSMP simulator) also enables real-time community detection when users follow recommendations.
Since the beginning of building the DSMP simulator, multi-agent-based modeling software has been used, which is an effective tool for two reasons: First, agents can simulate users and their complex environment of social networks. Agents can thus simulate users’ changing interests and their dynamic social graph. For example, agents simulate users who remove their followers or followees on Twitter, which results in their friendship network changing dynamically, or agents can simulate authors’ networks submitting their scientific papers in different journals and changing their co-authors or venues by receiving recommendations, as discussed in our previous work. 5 In the current version, the multi-agent tool is used to simulate distributed environments such as social networks where the data are distributed on different resources or nodes. In the future, it will be used to enhance users and applications of the simulated social networks, as explained.
We used parallel recommendation application execution of Artificial Neural Network (ANN) MLP; each processing node contains an MLP algorithm, which is trained by 70% of the entire dataset in the training phase and generalizes the model on the remaining 30% of the dataset in the test phase. 6 The timing performance of distributing a given dataset and applying the multi-processing nodes for the MLP algorithm is to validate the scalability of the proposed framework. The MLP algorithm used is a neural network with one hidden layer containing 10 hidden neurons, which is implemented with Neuroph, 7 a lightweight and flexible Java neural network framework that supports common neural network architectures. This framework facilitates the development of neural networks with a well-designed, open-source Java neural network library. The activation function used in the MLP implemented with the Neuroph Java library in the simulator is the SIGMOID function, and the learning rate and maximum error hyperparameters are configured to 0.1 and 0.01, respectively.
This paper is organized as follows: Section 2 reviews some related works. In Section 3, the methodology is explained. Section 4 shows the results of this study. Section 5 includes the conclusion.
2. Related works
2.1. Social network simulation
Despite the widespread interest in social network simulation, there remains a scarcity of in-depth works exploring the simulation of social networks. While some research has been conducted to simulate social networks by hiring small groups and recording their interactions, the literature remains limited, and this provides an opportunity for researchers to make significant contributions to this field. The work below is the most closely related to the software tools that can be used for the simulation of social networks and their applications. Simulation research in this area could lead to a better understanding of social networks and the impact of ML algorithms on these networks.
NetSim 8 is an R package to simulate the changes in social networks and to study the impacts of individuals within a network on the overall network structure. The relationship between the individuals and the network structure in social networks, including homophily or social influence, is simulated in the NetSim. Individuals’ behaviors, habits, and beliefs are examined to observe their impacts on those they are connected with in social networks. On the other hand, the DSMP social network simulator applies different ML algorithms to identify any changes in a network’s structure by forming new connections between vertices and variations in the network features. By observing how the network structure changes in response to these algorithms, our work develops a better perception of underlying processes that drive these changes and how social networks function.
2.2. Recommender system simulation
RecSim 9 is an open-source configurable platform for authoring simulation environments that aims to broaden Reinforcement Learning methods. The main components of RecSim are a user model, a document model, and a user-choice model by which a recommender agent interacts with a set of recommendable items and a group of users to make recommendations. These recommendations are constructed based on the features of users and documents. The user response to the recommended documents leads to the choice of the document by the user, which can depend on the document’s features such as document topic and document quality and user’s features (e.g., interests, personality, demographics). When a document is used by a user, the user’s state changes. For example, the user’s interest in a document’s topic might decrease or increase, or the user’s satisfaction can rise/drop depending on the document’s quality. Although the DSMP simulator does not focus on the simulation of recommender systems, it can evaluate the major algorithms used in recommender systems by simulating a simple text similarity application.
2.3. Scalability of recommender systems and ML algorithms
There are not many similar works to ours that provide scalability for the simple recommendation algorithms by parallel running the applications on multiple nodes.
The works in the literature used different methods for improving the scalability of recommender systems, which employed ML algorithms. The implementation of scalability is not achieved by parallelization and is considered by changing the algorithm and application models in these works. For example, a hybrid recommender system combining CB and co-citation-based (CcB) recommendations was presented in the study by Kanakia et al. 10 which uses Microsoft Academic Graph (MAG), titles, and abstracts of research papers. The CcB recommendation method employed papers’ citation information, which is very difficult to collect. Hence, to tackle this problem, the CB approach applied the metadata of a paper, including title, keywords, and abstract, to create word embeddings with Word2Vec. Finally, the CcB and CB techniques were merged to build a single set of recommendations for papers. The computation time and storage requirements were also considered when recommendations were generated to ensure scalability, as the MAG adds plenty of new papers every week. Enhancing the scalability can then be performed by adding K-means clustering in the CB recommendation approach for this enormous corpus size.
In most works, the scalability of ML algorithms is achieved by parallelizing the ML models and using them in recommendation systems. Although the parallelization of ML algorithms is out of the scope of our work, one of the software that uses parallelization to provide ML scalability is discussed next.
DistBelielf is a software framework developed by Google for training deep neural networks using large-scale distributed computing clusters. It facilitates model parallelism within a single machine (using multithreading) and across multiple machines (via message passing), handling the intricacies of parallelism, synchronization, and communication. The DistBelief framework employed model and data parallelism to handle the computational demands of training large-scale deep neural networks. For large models, users can distribute the models across multiple machines to allocate computations for different nodes to separate machines. The advantages of distributing a deep network across multiple machines depend on the model’s connectivity structure and computational requirements. Models with a substantial number of parameters or requiring significant computational resources tend to benefit from increased access to CPUs and memory until communication costs become the limiting factor. This framework trained a model with more than one billion parameters, achieving superior performance compared to the state-of-the-art in the ImageNet object recognition challenge. 11
Our work only considers improving scalability by running a parallel replica of a simple recommendation application when using the same ML algorithm on multinodes with distributed data. The developed DSMP framework is a new simulator that takes into account the parallelization of different ML algorithms by adding multi-processing nodes when dealing with large social network data. By distributing the dataset across multi-processing nodes, the execution time speeds up, and the parallelization factor improves, allowing for faster and more efficient processing of social network applications (e.g., recommender systems) on large datasets.
2.4. Effects of recommender systems algorithms on network structure
Sibley and Crooks 12 investigated the impact of recommendation systems on the structure of online social networks. They proposed a technique for constructing online social networks by linking individuals based on their real-world networks and recommendations from friends of friends. The networks created were scrutinized to evaluate the effect of varying ratios of link recommendations on specific network properties, including clustering, modularity, average shortest path length (geodesic), average eccentricity, network diameter, and degree distribution. An agent-based model, which included 10,000 nodes, was developed using Python and the NetworkX package. The results indicated that as the ratio of links based on recommendations increases, online networks tend to become more clustered yet dispersed. Moreover, a higher proportion of recommendation-based links led to more clustered, distinct, and scattered communities, implying that link recommender systems based on mutual connections could lead to fragmentation in online social networks.
Ferrara et al. 13 measured how link recommendation algorithms affect the structure of social networks by applying five algorithms over time to different synthetic networks. In particular, the focus was to understand whether link recommendation algorithms positively or negatively impact minority groups in social networks. Directed networks were considered, and for each vertex, the recommendation algorithm suggested a ranked list of k vertices with which a specific vertex was not yet connected. However, every time a new connection was made, one random link was removed from the vertex receiving the recommendation to avoid a remarkable increase in the edge density of the network. Evaluation metrics such as clustering coefficient and in-degree distribution were evaluated before and after each round of recommendation to check their changes in certain types of networks. Results indicated that the clustering coefficient increases as the networks become more interconnected by applying all the recommendation algorithms. Moreover, the algorithms employed make popular people more popular to a high degree of vertices. This is commonly referred to as popularity bias in the networks; the rich get richer effect or cumulative advantage.
The DSMP social network simulator recommends new connections to a selected user when applying different algorithms using the BoW or Doc2Vec model. The recommendations are made based on the similarity between the texts of tweets/titles/texts of users/papers/customers by measuring the similarity between two feature vectors generated by each method. When new connections are made in the network, its structure transforms, leading to changes in the network properties.
2.5. Using ML algorithms in community detection
K-means clustering, an unsupervised ML method, was used to uncover the hidden community structure among countries affected by the COVID-19 pandemic using the COVID-19 dataset. 14 The COVID-19 dataset, collected from the official website of Johns Hopkins University, included the number of cases reported between January 22, 2020 and August 15, 2020. The optimal number of clusters was determined to be six and seven as the input. The study examined how factors like geographical location and demographic information correlate with the detected communities. The findings gained from community detection could guide public health strategies, enhance pandemic management, and assist policymakers and health officials in designing precise interventions and allocating resources effectively.
In recent years, there has been significant progress in studying deep learning techniques for community detection, particularly their advantages in handling high-dimensional network data. 15 Deep learning techniques provide flexible solutions for effective community detection by (1) capturing nonlinear network properties, such as edge relations between vertices, (2) creating a simplified representation of a network that preserves complex structures, and (3) improving community detection using diverse information. These methods enhance the effectiveness, efficiency, robustness, and applicability of community detection. Compared to traditional community detection methods such as hierarchical clustering and modularity optimization, new techniques offer greater flexibility and allow leveraging larger volumes of data during preprocessing.
The novelty of this work is that it uses simulation to find the effects of common algorithms (e.g., K-means clustering, SVM, MLP) employed in the text similarity detections of social networking in simple recommender systems and community detection applications. This work is not about introducing a new community detection algorithm or a new method for analyzing network evolution. Therefore, as the simulator explained next in the contribution of our work, we developed and implemented simple methods and added them to the proposed simulator of social network applications, focusing on parallel and distributed text processing on multiple nodes.
2.6. Comparison with existing works
As discussed above, our work focuses on the simulation of the common ML algorithms used in social network applications. Examples of social network applications that use our targeted ML algorithms are recommender systems, community detection, finding influential users, and so on. Since it is impossible to simulate all these complicated applications in our developed simulator (DSMP), we implemented a simple application that recommends similar users using NLP methods that employ ML algorithms. In the parallelization of the application, we assumed there is minimum communication between nodes when the replicas of ML models are running in parallel. Then, in the end, the result will be merged as a recommendation list by the application.
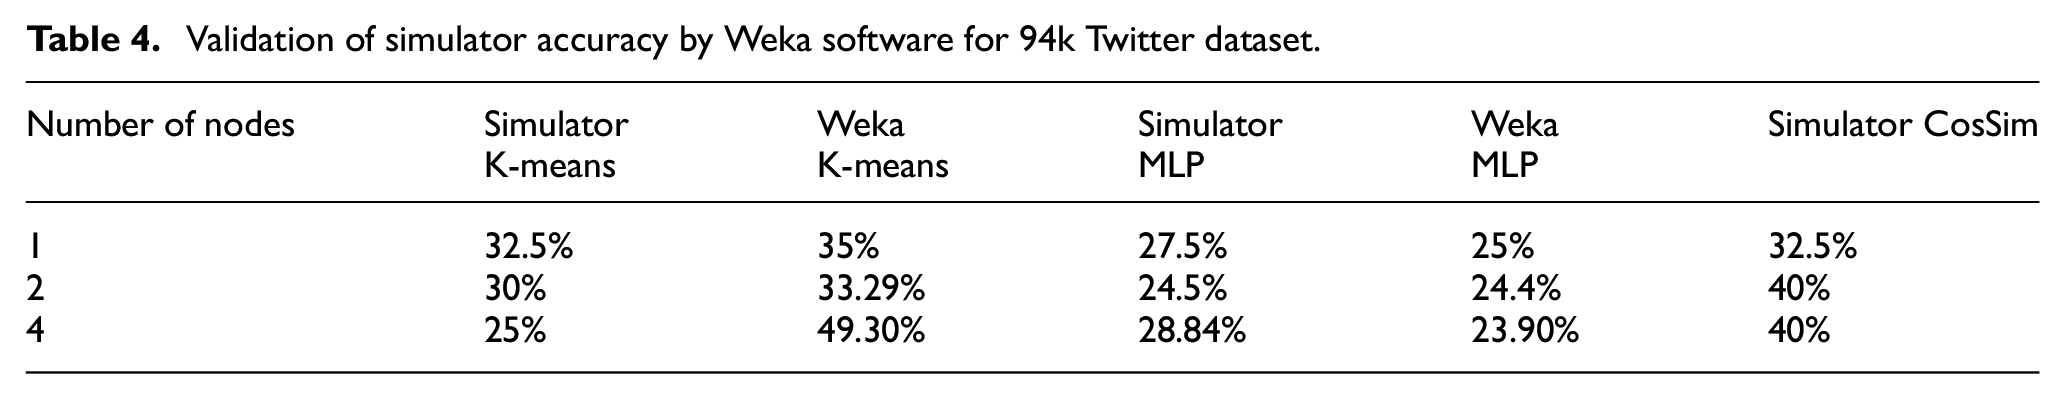
Therefore, since there is no simulator for social networking in this section, we used the comparative studies of the discussed frameworks with the DSMP simulator in Table 1. In addition, a comparison of similar algorithms with Weka software is added to this paper for the purpose of validating simulation in Section 4. Weka is used to validate the simulated algorithms because some of its Java-based libraries were applied to implement MLP and SVM in the DSMP simulator. In Table 4, we showed that the accuracy achieved on the same datasets is identical in both the DSMP simulator and Weka when using the same implemented algorithms.
Comparative study of similar simulation frameworks.
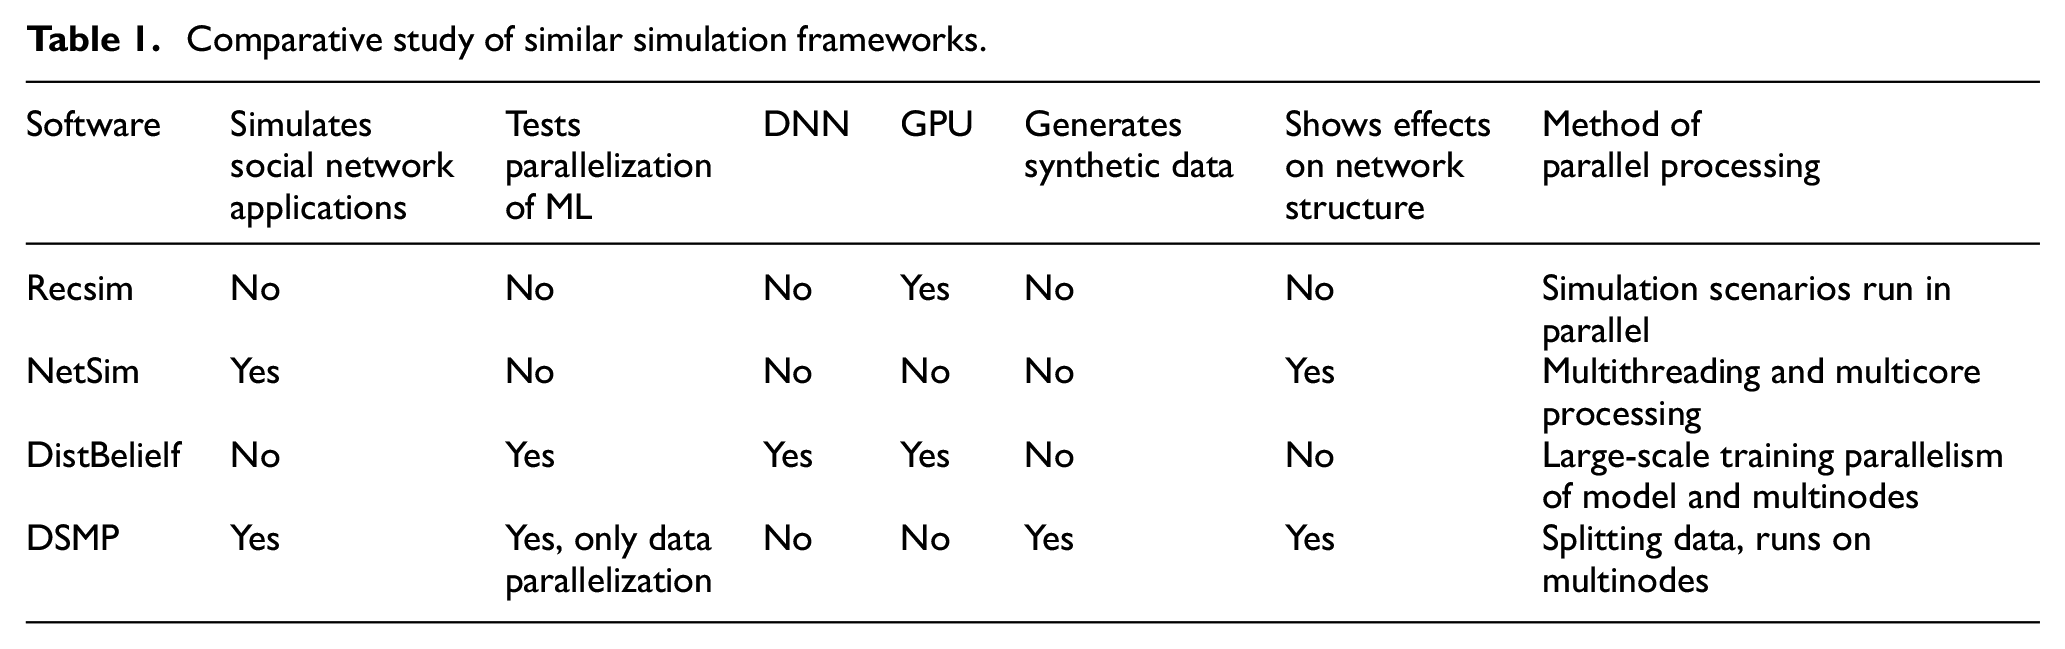
Table 1 presents a comparative study of these simulation frameworks.
3. Methodology
3.1. Dataset
The datasets used are all real datasets collected for this work. Table 2 summarizes the datasets used in the experiments.
Datasets feature summary.
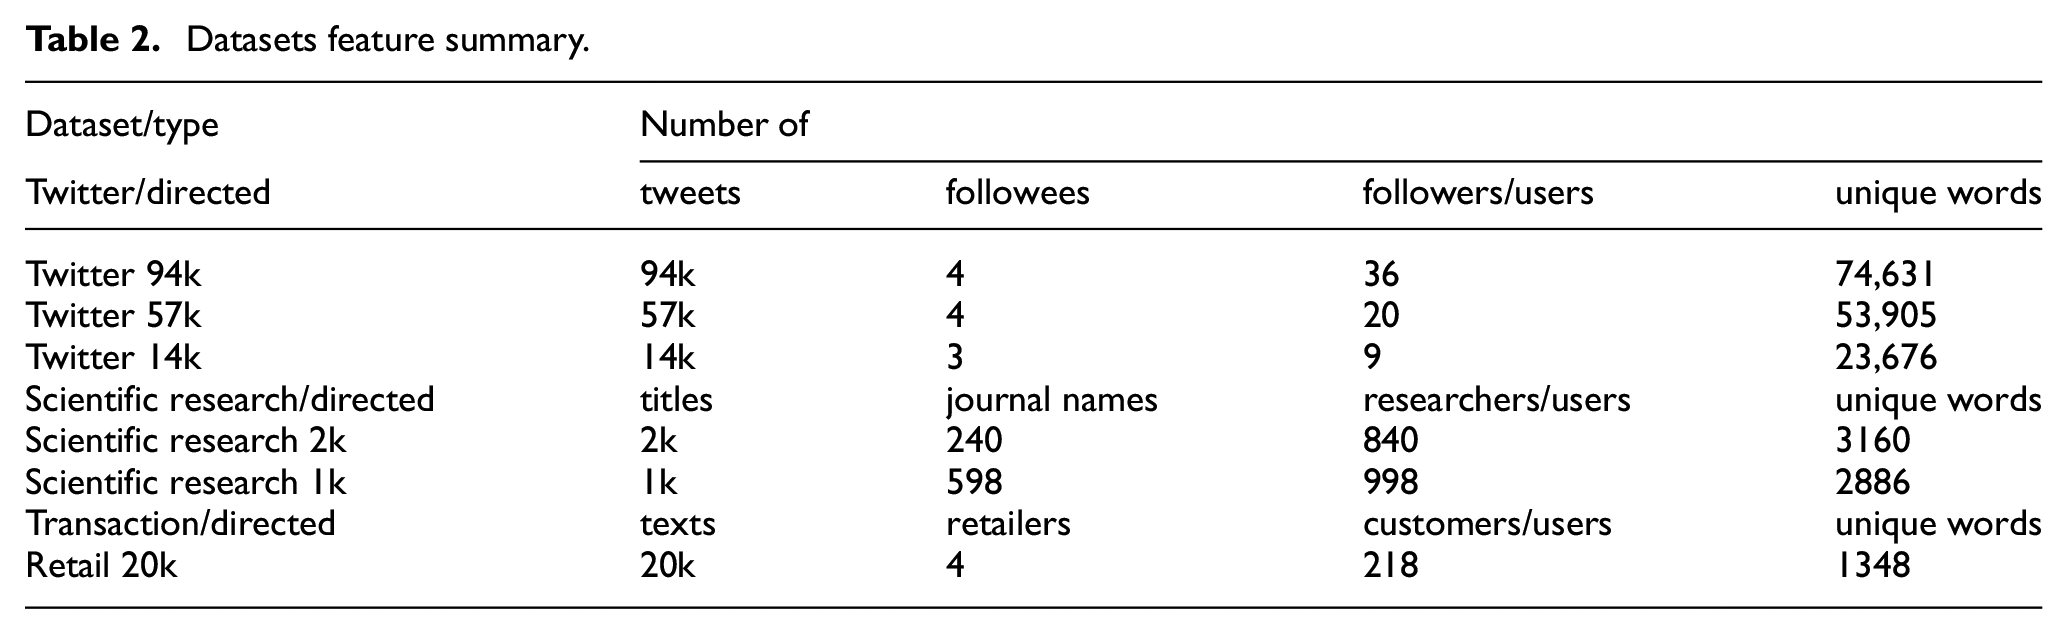
A considerable amount of time was spent manually curating the datasets, ensuring they were tailored to fit the work objective. Therefore, we aimed to gather datasets that are not necessarily large in size but have a large number of features and diverse structures, such as those from Twitter, Scientific Research Papers, and Retail, to facilitate subsequent application in ML algorithms and enhance model performance.
3.2. The framework of DSMP social network simulator
In Li and Abhari’s 16 study, we generated artificial social networking text data for the first version of the developed multi-agent simulator to test the parallelization of two developed unsupervised algorithms (i.e., cosine similarity and K-means clustering) with the large data. In Banihashemi and colleagues’s5,17 study, we implemented the second version of the simulator and simulated the users following the recommendations from two unsupervised cosine similarity and K-means clustering algorithms and made the DSMP simulator an open-source software together with its tutorial available in the study by Abhari. 18 It provided insights into how communities within these networks evolve when users adhere to recommendations generated by the simulator. The simulation scenarios showed that users accepting the recommendation of the cosine similarity algorithm resulted in higher modularity and the number of communities in social networks when simulating the followee decision-making process. This fact, along with the continuation of our research, has led us to identify the main research directions: To use the simulator to examine the parallelization of the supervised ML algorithms, including a wide range of algorithms, and examine their effects on the structure of social networks with the different number of users and complexities (i.e., the networks of the authors of the Scientific Research Papers and the venues of their papers versus Twitter users and Retail customers). Thus, in this work, we enhanced the agent-based simulator to include supervised ML algorithms in the third version of the simulator and conducted new experiments to evaluate how they are different in affecting the users’ decision-making process in social networks in comparison with unsupervised algorithms.
The study of algorithms’ effects on network structure is conducted by examining the resulting graphs and analyzing the community structures within them. To analyze the structure of the network, we aim to determine whether the number of identified communities (Ck) increases or decreases as the network graph (G) expands in terms of the number of vertices (V) and the number of edges (E), particularly when users adhere to the recommendations given by the algorithm. Community detection can be defined as a function that assigns each vertex to the subgraph Gi, where i = 1, 2, …, K, and K is the number of communities as depicted by Equation (1):

A novel social network simulator is developed to suggest potential connections for users within social and Scientific Research networks. It utilizes algorithms like K-means, cosine similarity, SVM, MLP, and Doc2Vec to provide top-N recommendations. The source code of the simulator program includes the Java libraries from the Gephi Toolkit project package. This toolkit, which is a JAR file, embeds essential modules of the Gephi software, such as Layout, IO, and Graph, into the simulator. Gephi, 19 an open-source software for network visualization and analysis, allows the creation of new vertices and edges in the graph, adding new edges to the existing graph and visualizing the state of the directed graph at all time intervals. A unique ID identifies each vertex, and an edge is a link created from the source vertex to the target vertex. Moreover, the state of the graph is exported to GML text-based, TXT standard text document, and Graph Exchange XML file formats to specify vertices and edges of the graph as well as edge directions for examining the connections between vertices and detecting communities among the users of these networks. Utilizing the Louvain community detection algorithm 20 that is implemented in the Gephi library allows us to observe structural changes in the network. These changes occur when a new follower–followee relationship is established on Twitter, a new paper–publication venue relationship is formed in a Scientific Research Papers, or a new customer–retailer relationship is made in the Retail dataset based on the recommendations provided. In the network graph, a relationship link is established based on the text similarity of their tweets, titles, or texts. This similarity is determined by the specified ML algorithms. This new link is formed in addition to the existing connection between the current followee, publication venue, or retailer and the target user, researcher, or customer. JADE (Java Agent Development Framework), an open-source platform for the implementation of multi-agent systems 21 developed for the simulation of the distributed environment of the DSMP simulator, 18 comprises multiple agents, such as controller agent, organizing agent, user agent(s), recommender agent(s), and starter agent. Each agent plays a part in the model and is built with JADE. However, the DSMP social network simulator uses only the distributed feature of the JADE multi-agent system and reports the parallelization factor by focusing exclusively on the execution time. This considers that each ML algorithm uses different approaches to maintain similar accuracy between single processing node and multi-processing nodes. Recommendations by parallel processing nodes are merged into a ranked list based on similarity so that each user can follow the recommendation.
Figure 1 illustrates the steps involved in the workflow of our proposed DSMP social network simulator framework. This process begins with the Initialization phase, where parameters of the system’s graphical user interface (GUI) are configured by selecting one of the datasets, the number of nodes, and the algorithm. Next, the selected dataset is used by the algorithm to generate a followee/journal publication venue/retailer. The result of this recommendation is then used in the Community Formation and Detection phase to identify distinct partitions known as communities.
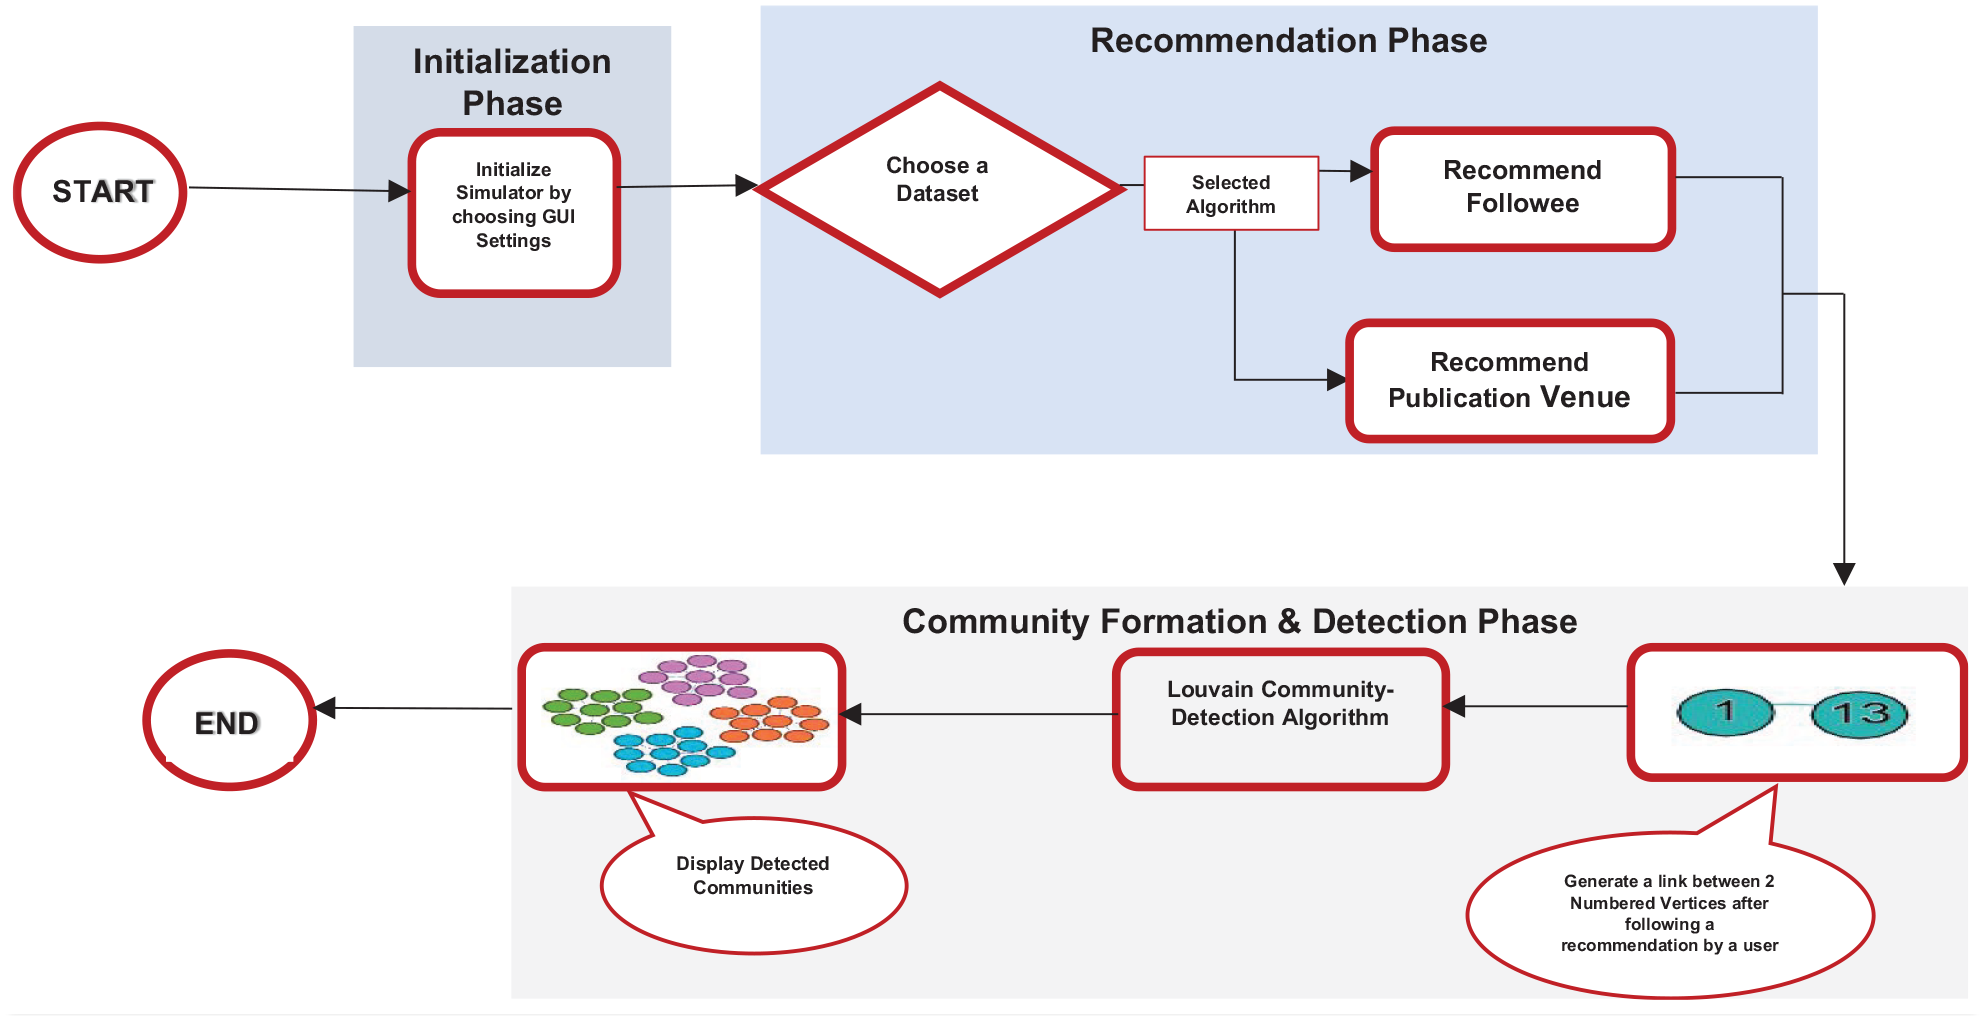
Schematic representation of the DSMP simulator workflow.
Figure 2 represents the GUI of the DSMP social network simulator, which allows interaction with its buttons, input fields, and menus for initial parameters’ configuration, as previously indicated, to display the recommendations and timing results. The “Recommendations for User” window provides top-N recommendations based on the selection in the “Top Recommendations” input field. The “Timing Results” window displays the text processing (TP) timing, the chosen algorithm timing, and the total timing in milliseconds. Furthermore, this window shows the improvement ratio in timing for TP, term frequency-inverse document frequency (TF-IDF), and the selected algorithm compared to the previous run when each simulation is completed. Version 3.0, the latest contribution to the DSMP social network simulator, incorporates significant advancements and enhancements, such as adding additional algorithms using the BoW and the Doc2Vec model in this tool. The source code of the latest program is publicly accessible in the study by Abhari. 18
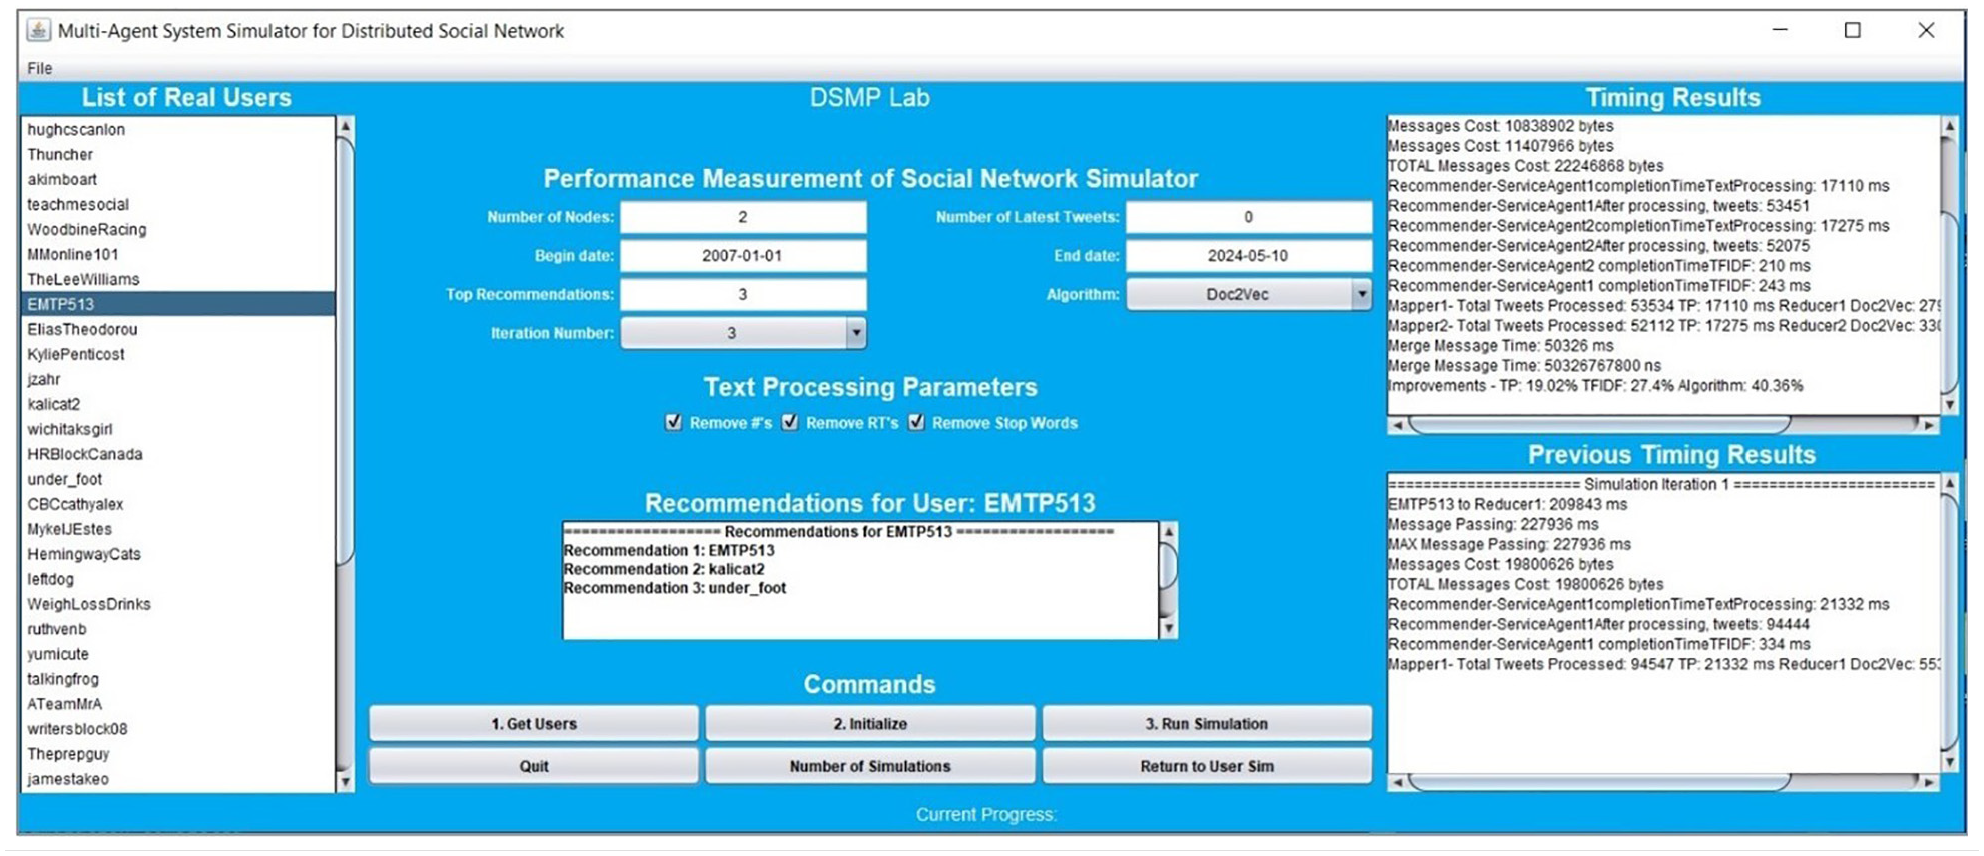
DSMP social network simulator GUI (version 3.0).
Algorithms analyze social networks using Twitter tweets, research paper titles, and transaction texts to simulate connections based on the assumption that similar publication venues, follower, and retailer patterns indicate network similarity. The simulator emulates a distributed processing environment akin to cloud computing, allowing for the parallel execution of an ML algorithm. This setup enables testing the parallelization and accuracy of the algorithms in use. In Banihashemi’s 17 study, each processing node represents a recommender agent that applies MLP as a classifier using 10-fold cross-validation by splitting the dataset into 10 parts, setting one group as a test set and the remaining groups as training sets for each run. There is a slight decrease in the accuracy of each dataset when run with a single node, compared to the accuracy achieved when the simulator is run with two or four nodes. The parallelization factor, which is the ratio of the time taken as the number of nodes increases compared to one node, also shows a significant increase. In addition, the accuracy of the K-means clustering and cosine similarity algorithms is tested on multi-processing nodes of the simulator, and the results are almost consistent with those obtained when run on a single node. In contrast to Banihashemi et al.’s 6 study, where MLP was implemented using the Neuroph library, this paper utilizes the Weka library for MLP implementation.
Paragraph vectors, or Doc2Vec, is an unsupervised framework that determines the continuous distributed vector representation of sentences, paragraphs, and documents. This algorithm is trained by stochastic gradient descent and back propagation. Doc2Vec has two models: the distributed memory model (PV-DM) and the distributed bag of words (PV-DBOW). In PV-DM, some consecutive words are given to predict a centered word, whereas in the PV-DBOW, the paragraph ID is inputted to predict randomly sampled words from a document. 22 The DSMP social network simulator uses PV-DM and cosine similarity to find similar documents and provides the top-N most similar ones to a given user.
3.3. Preprocessing algorithms
The original text of the tweets, paper titles, and transaction texts was processed using a text preprocessing algorithm according to each dataset in use. This process involved removing both datasets’ photos, punctuation marks, and URL links from the text. Only alphabetical characters were retained, so hashtags and accompanying words were deleted. The text was then stripped of stop words and converted to lowercase. Following this, a second text preprocessing algorithm was applied to the text of the tweets, the titles of research papers, and transaction texts. This step ensured the validity of the algorithms used to identify similar items within a given dataset based on text similarity. In the context of the Twitter and Retail datasets, followees/followers/customers were treated as users and tweets/transaction texts as items. However, in the Scientific Research Papers dataset, the users were identified as researchers and the items as publication venues/papers.
Each tweet, title, or transaction text from a user or researcher is considered a separate document. To represent a user or researcher as a single document, all the processed tweets, titles, or texts, which were initially individual documents associated with a particular user or researcher, are compiled into a single document. Aggregating short messages on social networking websites is also used in the study by Hong and Davison. 23 Document vectors will be generated after the tweets, titles, or texts from a user or researcher have been consolidated into a single document. These vectors will contain TF-IDF values. The cosine similarity, an unsupervised learning algorithm, determines the similarity between users and researchers. This algorithm operates by taking feature rating vectors from two distinct users or researchers and calculating the angle between these vectors, thereby determining their similarity. Vectors that are completely similar result in a value of 1. The K-means clustering algorithm is employed once the terms in each document vector have been assigned a TF-IDF weight. Initially, three documents are randomly selected to serve as the seed, resulting in the formation of three clusters of similar documents. The cosine similarity metric is used as the distance measure in this experiment for K-means clustering, which calculates the similarity of document vectors and is detailed in the study by Li and Abhari. 16 Similarly, for other algorithms, including SVM and MLP, the BoW method with TF-IDF vectors is used to calculate the similarity between users and researchers.
4. Experimental results
The simulations were run by configuring parameters, which included setting the number of nodes to 1, 2, or 4, setting the number of top-N recommendations to 3, selecting one of the developed algorithms (K-means clustering, cosine similarity, SVM, MLP, or Doc2Vec), and employing six distinct network datasets—containing three real Twitter datasets, two real Scientific Research Papers datasets, and one Retail dataset. Upon providing the top 3 recommendations to a given user, one of the recommended options will be selected and followed randomly by the user, considering the same likelihood of following each of the three recommendations generated by the employed algorithm in the simulator. The simulations were run on a computer with 4.0 GHz and 16 GB RAM. The machine’s Operating System was Windows 10. Java and Python were installed on the machine to enable the simulations to run.
4.1. Validation of the simulator
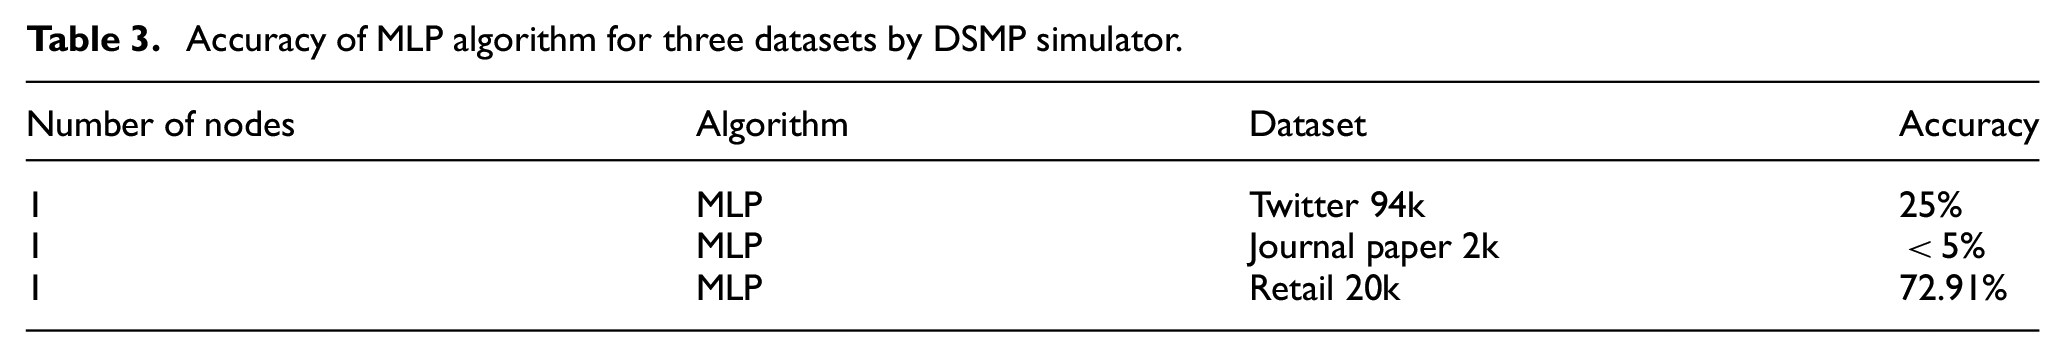
One of the essential factors that shows classification quality is the accuracy of the applied ML algorithm. It represents the proportion of correctly predicted instances compared to all predicted instances, serving as an indicator of correctness. We used accuracy in this section to see how the classification performance of the used algorithm changes with the differences in datasets. We compared the reported accuracy of the same algorithm (implemented by the same library) employed by the DSMP simulator and Weka to validate the simulator. So first, the accuracy of MLP reported by the DSMP simulator for three different datasets: 94k Twitter, 2k Scientific Research Papers, and 20k Retail, as shown in Table 3. It is observable that the accuracy of the Journal paper dataset is less than that of the Twitter dataset, and the accuracy of the Twitter dataset itself is less than that of the Retail dataset. This proves that the Doc2Vec method, which considers semantic meaning, generates more communities with the Retail dataset. In simple terms, similar items (text) in the Retail network follow the same retailer. Therefore, Doc2Vec, which captures the meaning of similar words, can categorize this dataset more effectively.
Accuracy of MLP algorithm for three datasets by DSMP simulator.
Furthermore, the accuracy of the 94k Twitter dataset for K-means clustering, MLP, and cosine similarity algorithm has been validated using the Weka software, as presented in Table 4.
Validation of simulator accuracy by Weka software for 94k Twitter dataset.
4.2. Results for parallelization of algorithms
The three real 14k, 57k, and 94k Twitter datasets, two real 1k and 2k Scientific Research Papers datasets, and one real transaction Retail dataset were used by the newly developed third version of the DSMP social network simulator in this section. The simulated text similarity application provides the top 3 similar users to a given user; one of the suggested options is selected and followed randomly by the user, considering the same possible probability of following each of the three recommendations generated by the algorithm employed in the simulator. Each application replica is performed on parallel nodes to measure the scalability by distributing an equal number of training data across multiple nodes to enable faster training for each ML algorithm. The average time running the application to recommend similar users to one user is measured three times using parallel heterogeneous computing nodes and compared with running the application on one node in the following tables for a specific algorithm.
Table 5 shows the running time in milliseconds for the K-means clustering algorithm for two Journal paper datasets and three Twitter datasets when the number of processing nodes increases from 1 to 2 and 4 nodes. It is manifested that the processing time decreases with an increase in the number of processing nodes.
Running time of K-means clustering on all the datasets.
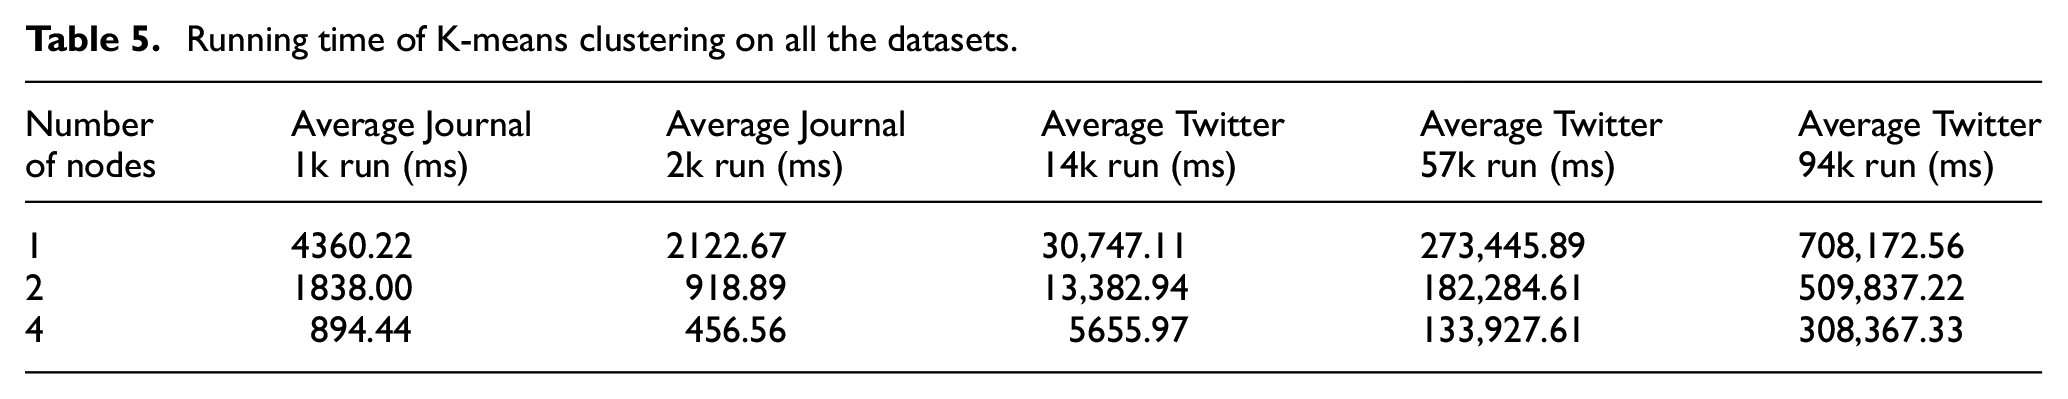
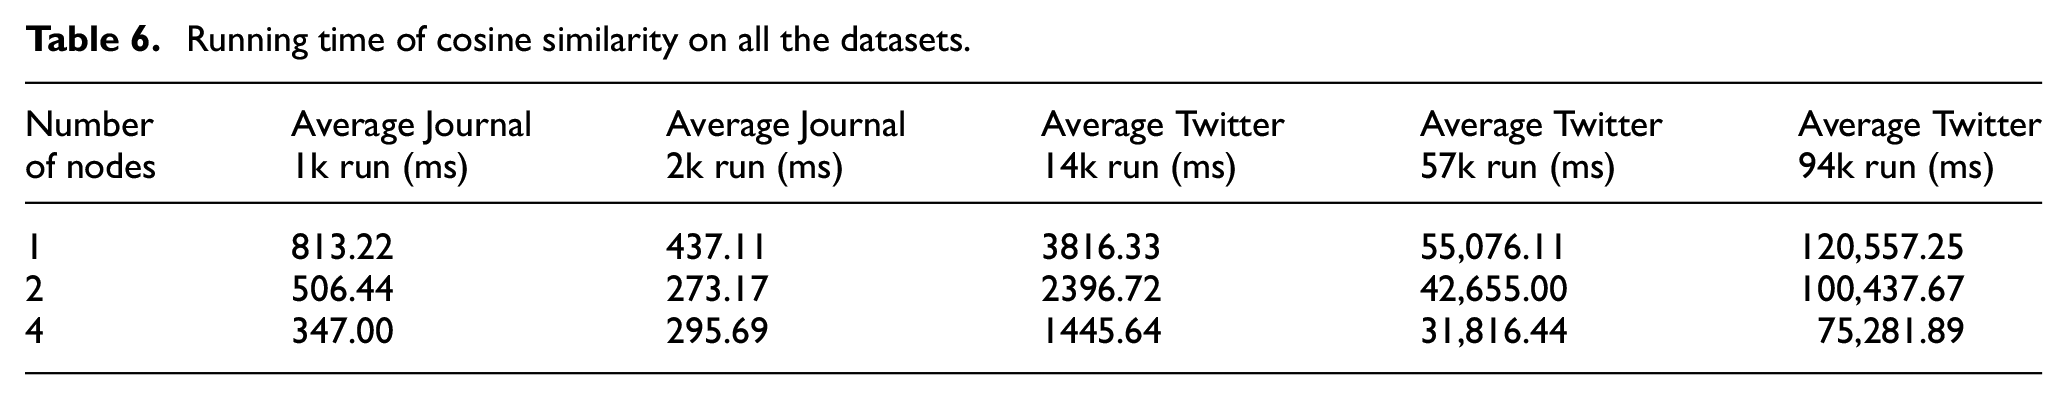
Table 6 displays the running time in milliseconds for the cosine similarity algorithm for two Journal paper datasets and three Twitter datasets when the number of processing nodes increases from 1 to 2 and 4 nodes. With the growth in the number of processing nodes, the running time reduces.
Running time of cosine similarity on all the datasets.
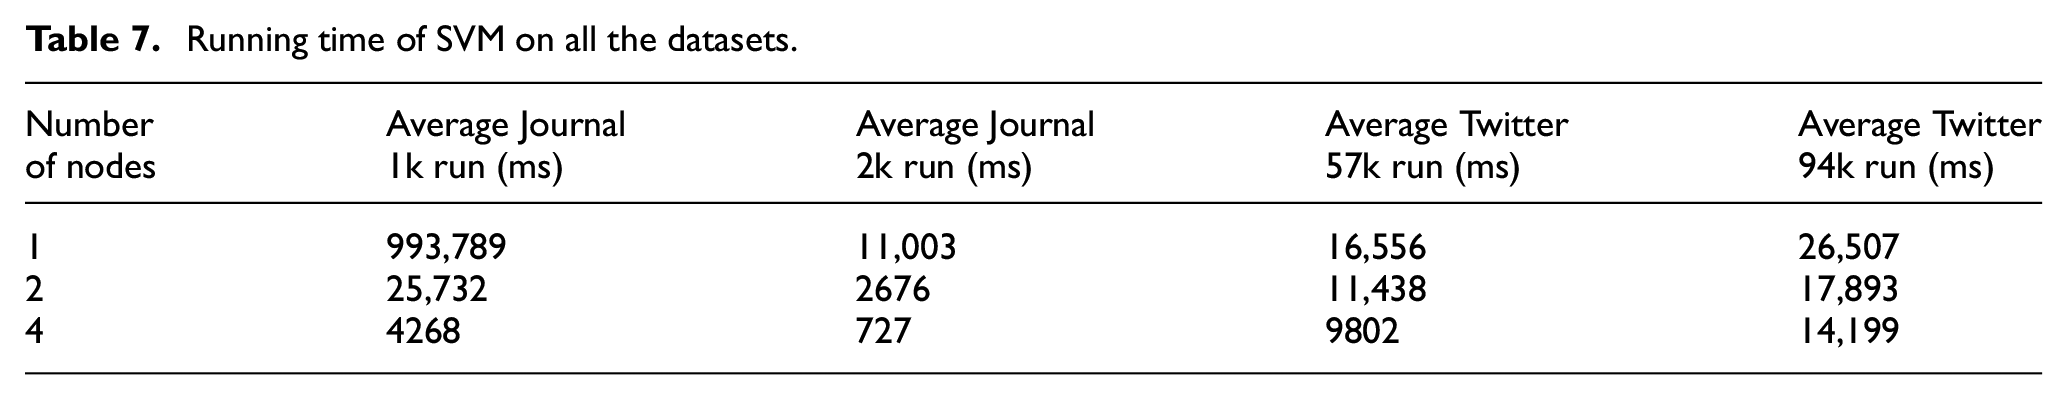
The running time in milliseconds for SVM is presented in Table 7 for two Journal paper datasets and two Twitter datasets when the number of processing nodes increases from 1 to 2 and 4 nodes, respectively. It is observable that as the number of processing nodes increases, there is a decrease in the execution time. As Twitter 14k is the dataset with the smallest training data (i.e., the number of users), some of its results do not apply and are not included.
Running time of SVM on all the datasets.
The following graphs present the running time for each node when the SVM algorithm is applied in the simulator. Figures 3 and 4 are presented as representative graph samples to maintain brevity.
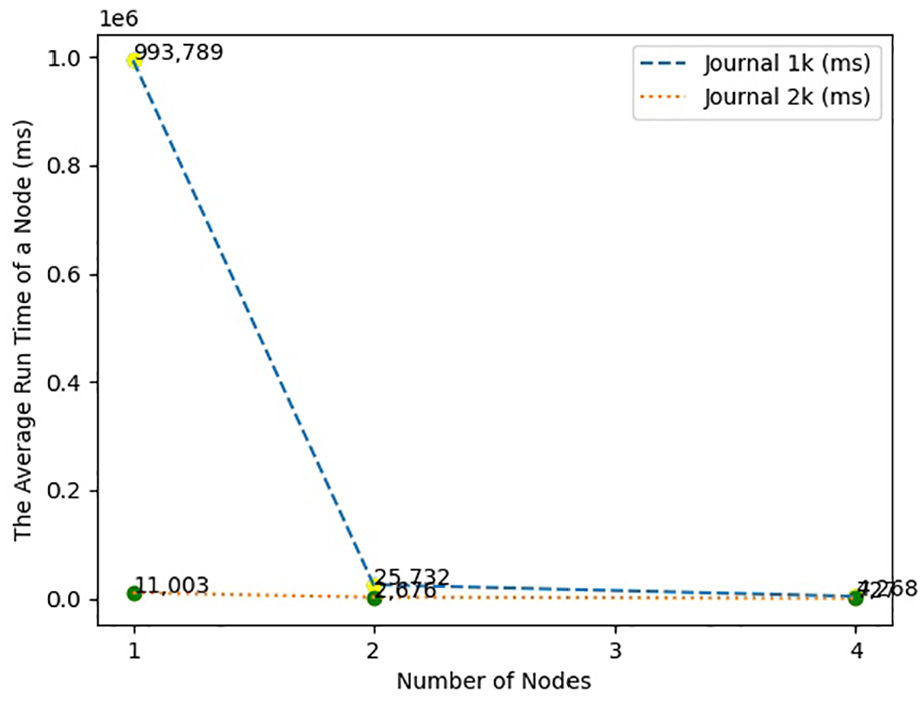
The average running time with the increasing number of nodes for Scientific Research Papers datasets with SVM.
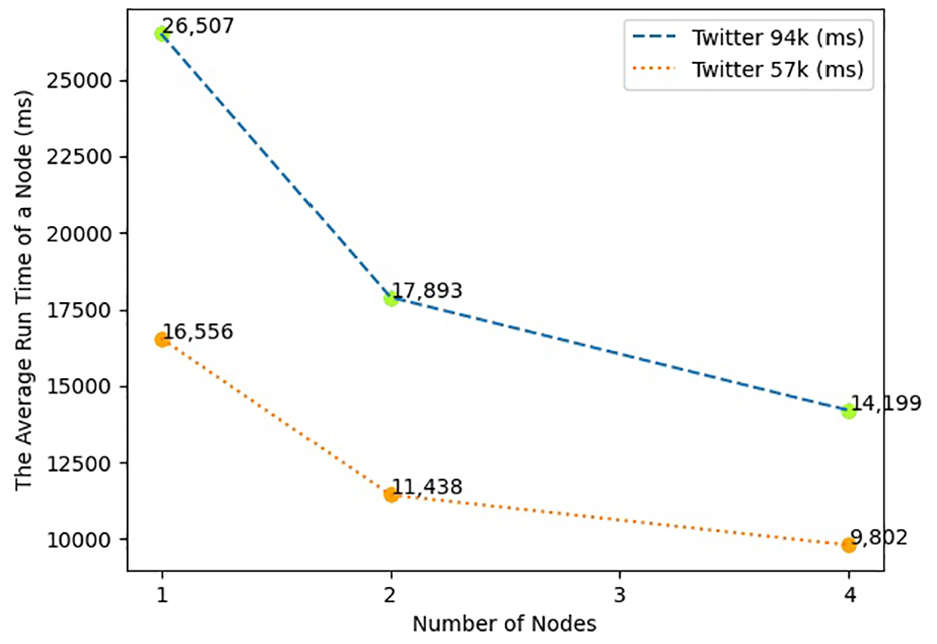
The average running time with the increasing number of nodes for Twitter datasets with SVM.
Table 8 shows the running time in milliseconds for the MLP algorithm for two Journal paper datasets and two Twitter datasets when the number of processing nodes increases from 1 to 2 and 4 nodes. It can be noticed that with an increase in the number of nodes, the processing time drops. The MLP algorithm cannot be applied to Twitter 14k as a unary dataset.
Running time of MLP on Journal paper dataset.
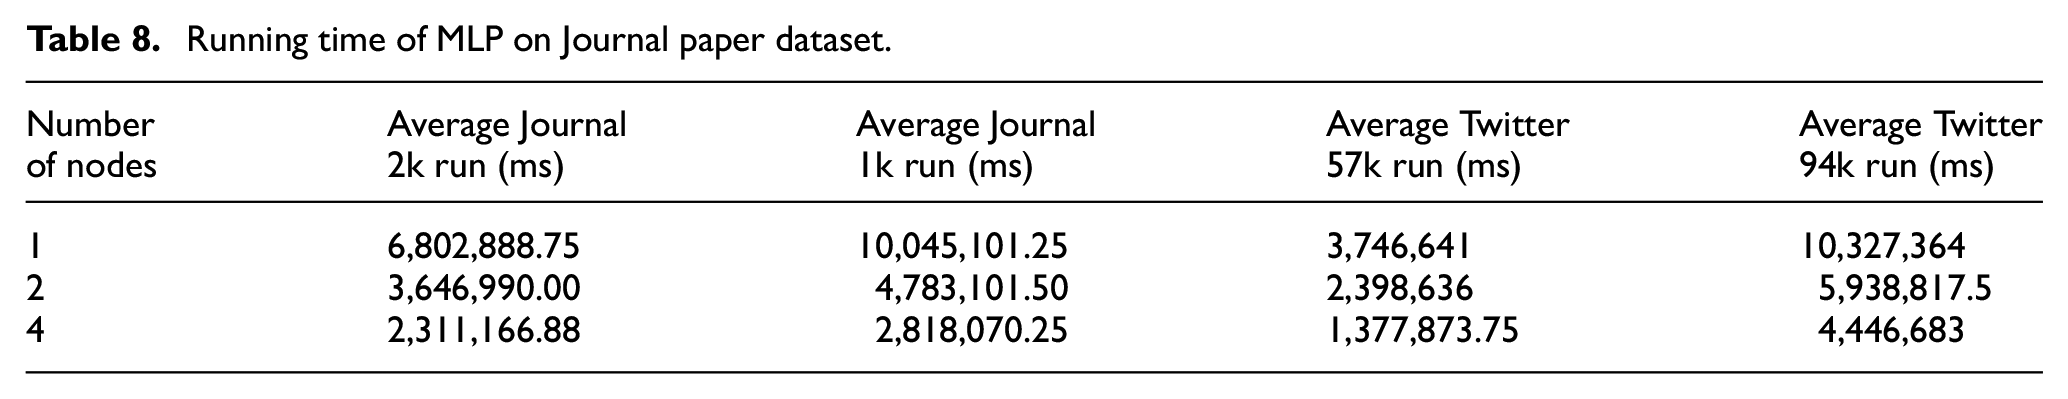
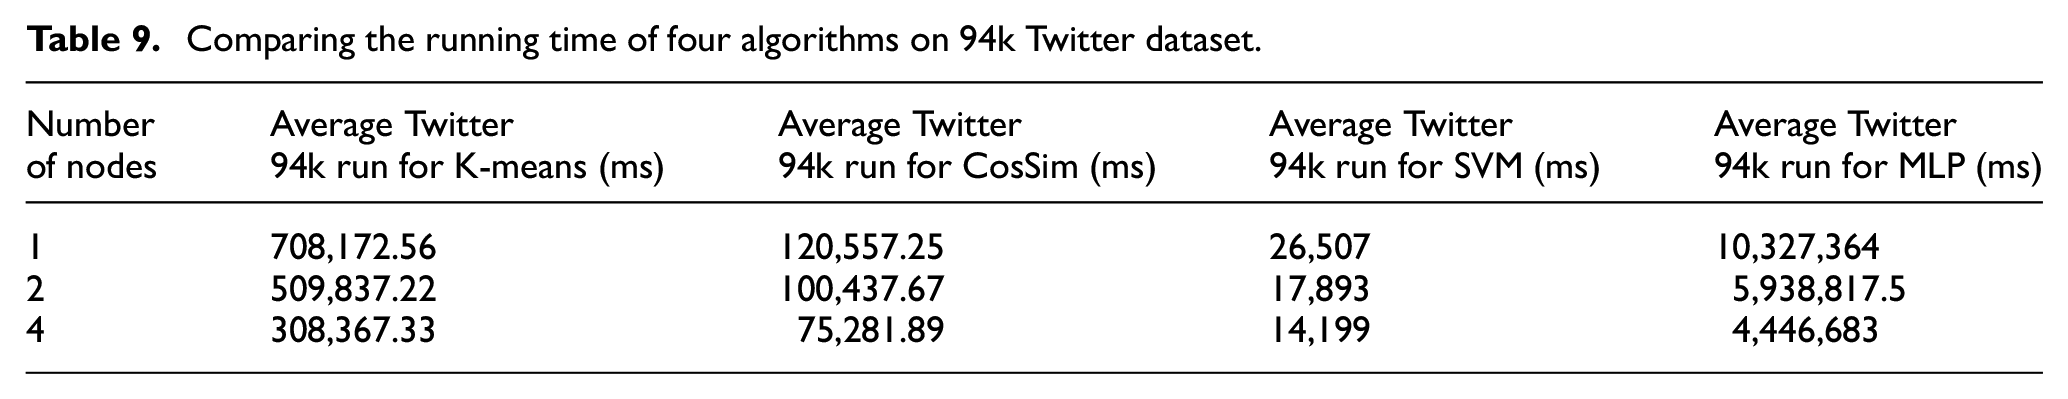
Table 9 draws a comparison between K-means clustering, cosine similarity, SVM, and MLP algorithms and their processing time on one node to two and four nodes when the 94k Twitter dataset is used. With an increase in the number of processing nodes for all the algorithms, there is a decrease in the running time. However, the SVM algorithm takes the least time compared to the other three algorithms.
Comparing the running time of four algorithms on 94k Twitter dataset.
The parallelization factor of K-mean clustering, cosine similarity, SVM, and MLP algorithms is illustrated in Table 10. The parallelization factor of these four algorithms is within the range of a minimum of 16.68% and a maximum of 56.94%. The parallelization factor is calculated by taking the ratio of timing result as the number of nodes increases compared to one node, as shown in Equation (2):
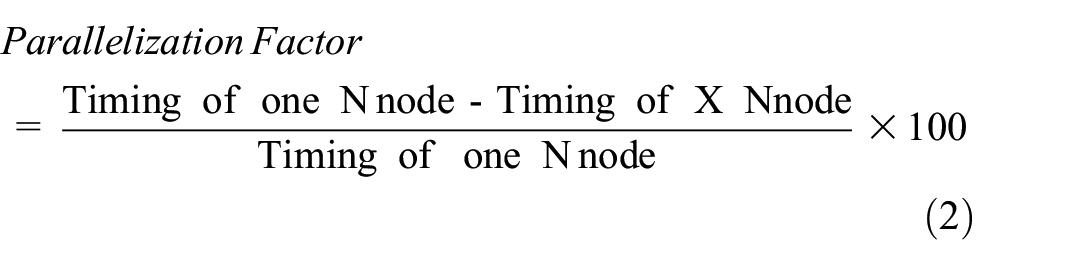
Parallelization factor of four algorithms for 94k Twitter dataset.
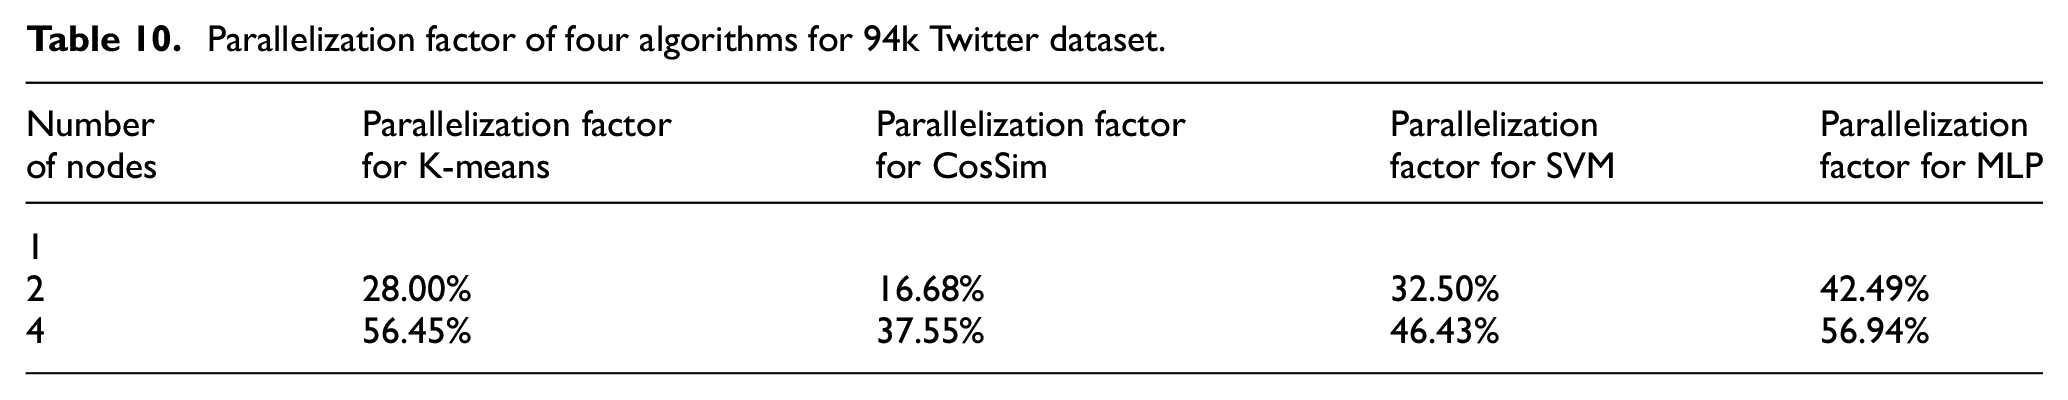
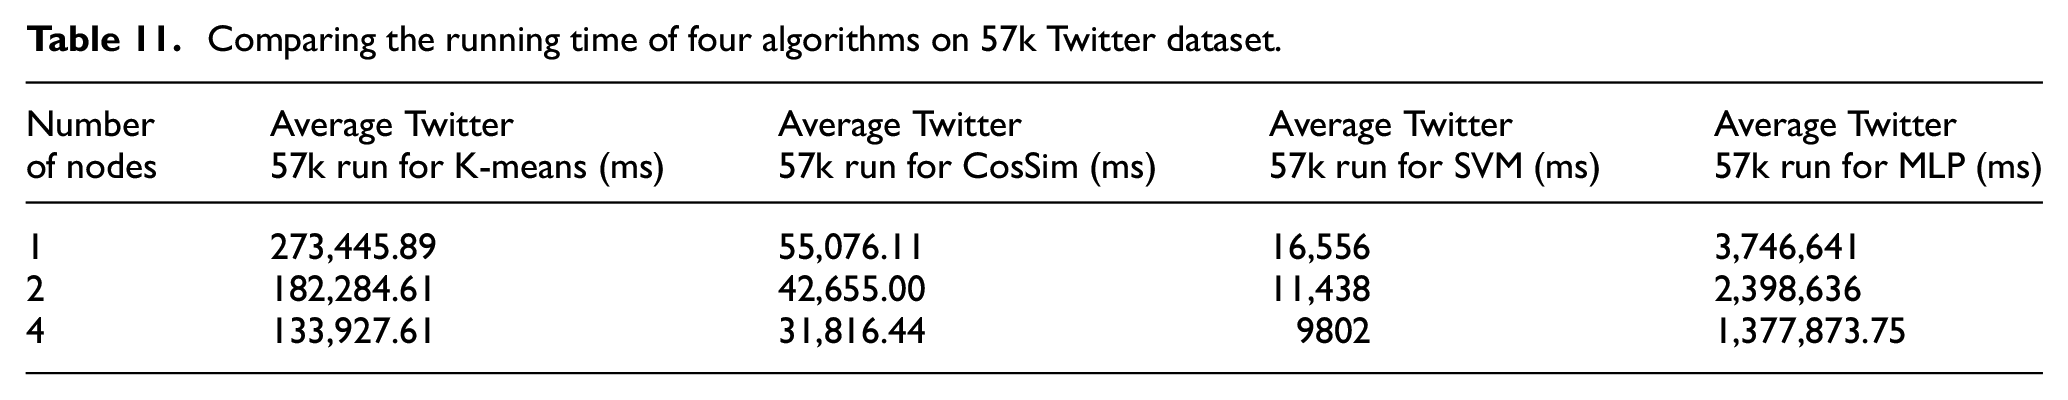
Table 11 compares the running time of four algorithms: K-means clustering, cosine similarity, SVM, and MLP on one node to two and four nodes when the 57k Twitter dataset is applied. The parallelization factor of these algorithms for the 57k Twitter dataset is displayed in Table 12 accordingly. It is observable from Table 12 that the parallelization factor range is between a minimum of 22.55% and a maximum of 63.22% for the 57k Twitter dataset. The SVM algorithm shows a higher parallelization factor by having the shortest running time among the group of algorithms using BoW vectorization, as presented in Tables 9 and 11.
Comparing the running time of four algorithms on 57k Twitter dataset.
Parallelization factor of four algorithms for 57k Twitter dataset.
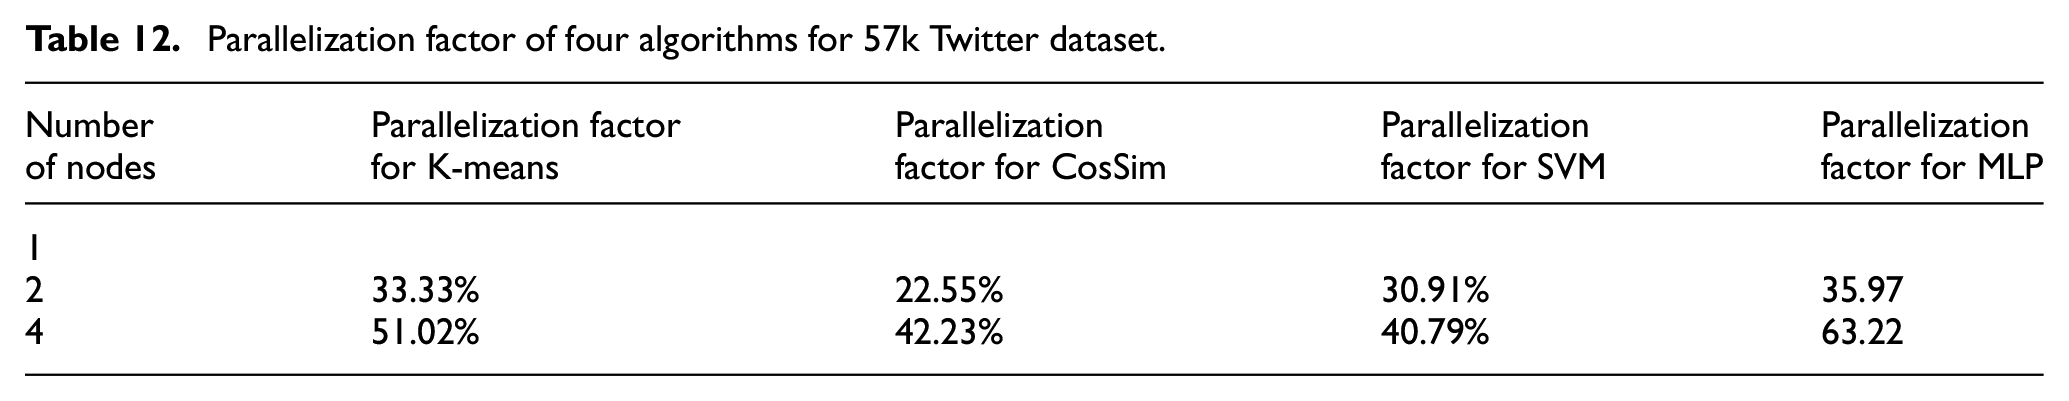
Table 13 presents a comparison between K-means clustering, cosine similarity, SVM, and MLP algorithms and their processing time on one node to two and four nodes when the 2k Journal paper dataset is used. With a growth in the number of processing nodes for all the algorithms, there is a drop in the running time. However, the cosine similarity algorithm takes the lowest time compared to the other three algorithms.
Comparing the running time of four algorithms on 2k Journal paper dataset.
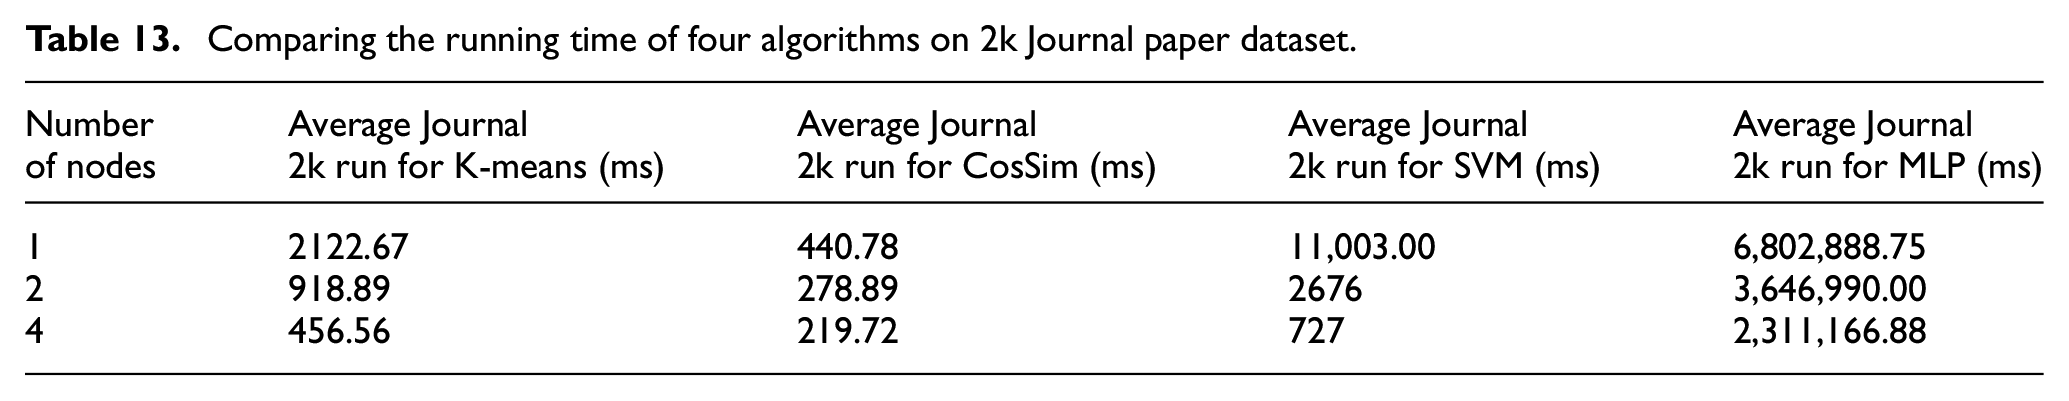
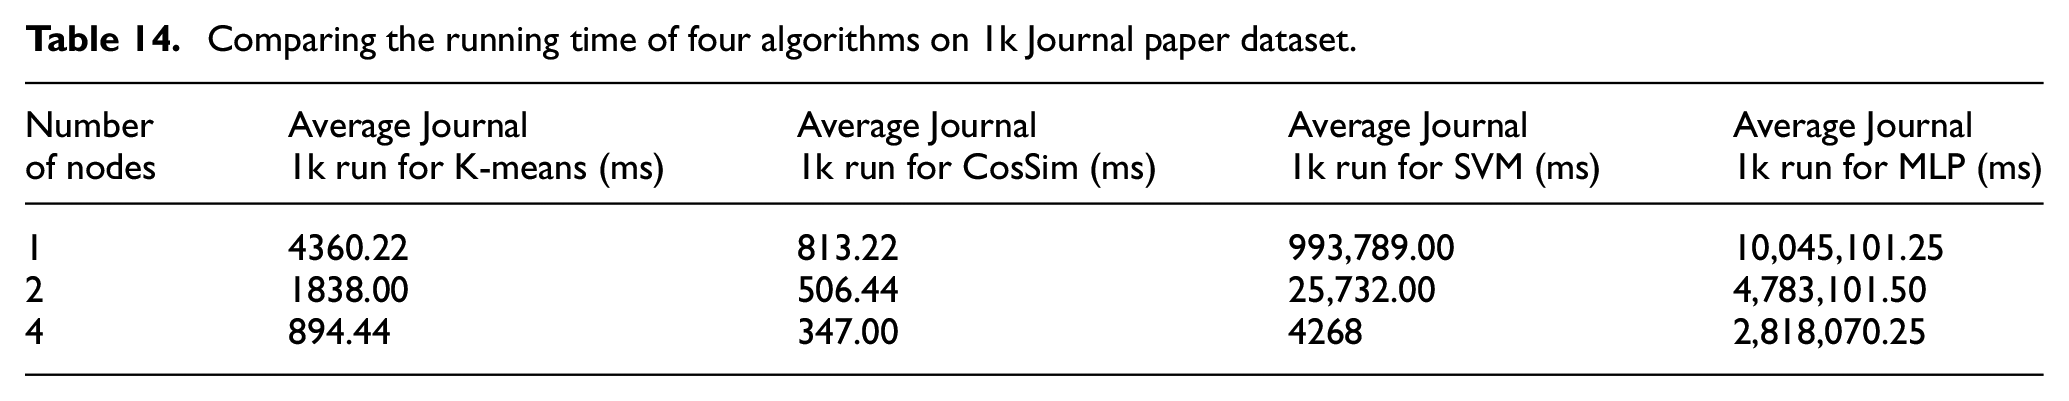
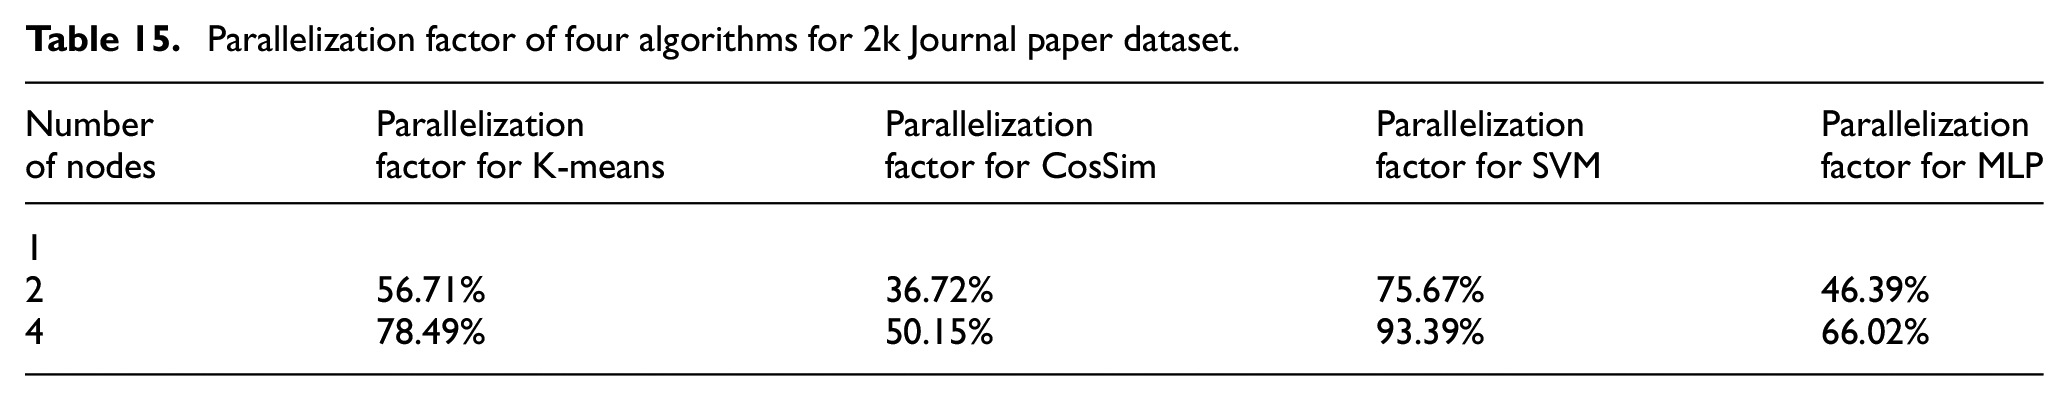
Table 14 compares four algorithms: K-means clustering, cosine similarity, SVM, and MLP, and their processing time on one node to two and four nodes when the 1k Journal paper dataset is applied. With an increase in the number of processing nodes for all the algorithms, there is a decrease in the running time. It is noted that the cosine similarity algorithm consumes the least amount of running time of all these four algorithms. The parallelization factor of these four algorithms is illustrated in Tables 15 and 16 for 2k and 1k Journal paper datasets, respectively, which fall in the range of 36.72% to 93.39% for the 2k Journal paper dataset and within the scope of 37.72% to 99.57% for 1k Journal paper dataset. The SVM algorithm obtains the highest value, confirming that in the group of algorithms using BoW vectors, parallelization of this algorithm is more effective when large datasets are used. This might be because SVM’s training time increases with large training data, as mentioned by Cervantes et al. 24 The scenario of splitting data simulated for parallelization can help the scalability for processing the Journal paper dataset, which has more users (i.e., training data). However, this method may not be helpful with less training data.
Comparing the running time of four algorithms on 1k Journal paper dataset.
Parallelization factor of four algorithms for 2k Journal paper dataset.
Parallelization factor of four algorithms for 1k Journal paper dataset.

In the group of ML algorithms with BoW vectorization, MLP achieved a higher parallelization factor (i.e., the speedup achievement by adding more processing nodes) for Twitter datasets, and SVM demonstrated a better parallelization factor for Scientific Research Papers datasets.
4.3. Results for effects on networks’ structure
The simulator creates the new network structure when one of the three recommendations is accepted and followed by all users in any of the tested datasets. The simulation of the application for one computing node is conducted for all users of the three datasets. For each dataset after users accepted the recommendation, the resulting structure of the network, which is measured by the number of communities (can be overlapping) and other network statistics, is discussed in this section.
4.3.1. Graphical results for Twitter datasets
Figures 5–8 display the effects in the number of detected communities when the 14k Twitter dataset is used before receiving any recommendations, after following the recommendations provided by the simulator, run by the K-mean clustering, cosine similarity, and Doc2Vec algorithms, respectively. Figures 9–12 show the effects in the number of detected communities when the 57k Twitter dataset is used before receiving any recommendations, after following the recommendations provided by the simulator, run by the K-mean clustering, cosine similarity, and Doc2Vec algorithms, respectively. Furthermore, Figures 13–16 illustrate the effects in the number of detected communities when the 94k Twitter dataset is used after following the recommendations provided by the simulator, run by the K-mean clustering, cosine similarity, and Doc2Vec algorithms correspondingly.
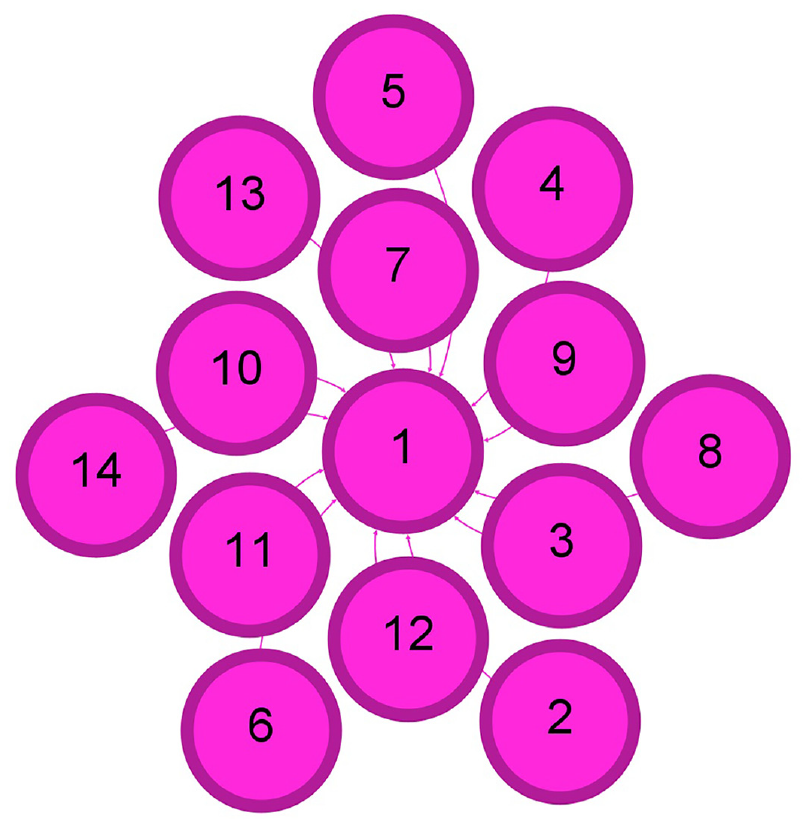
Illustration of the one community for 14k Twitter dataset before following any recommendations.
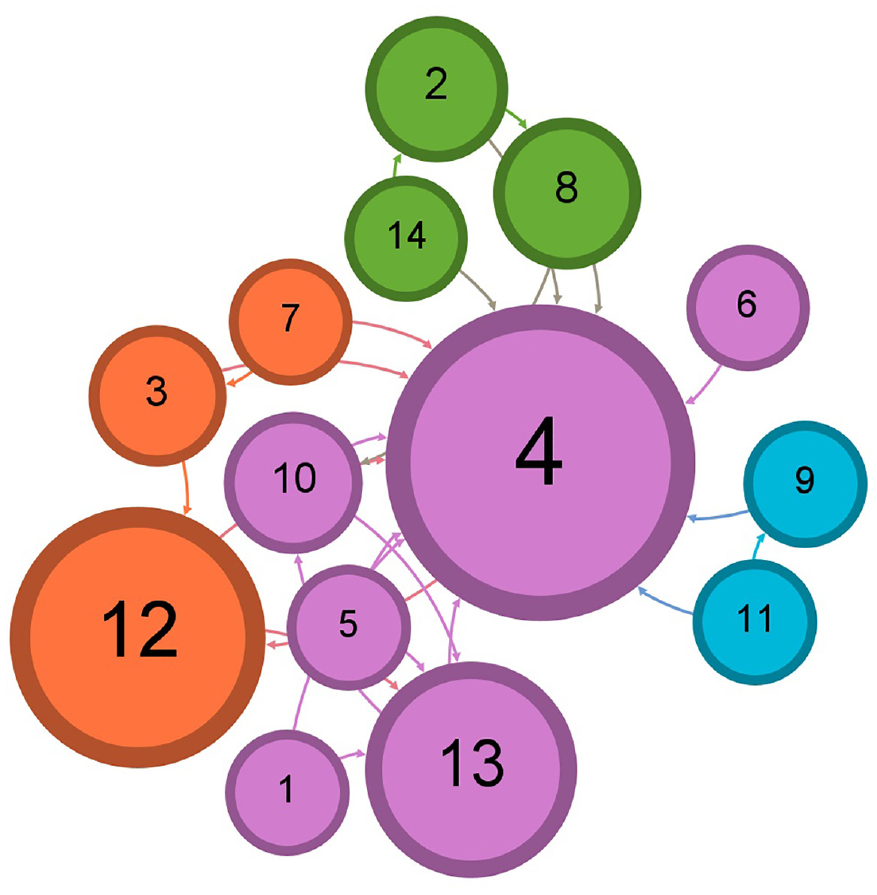
Illustration of the four communities for 14k Twitter dataset after accepting following the recommendation by K-means clustering.
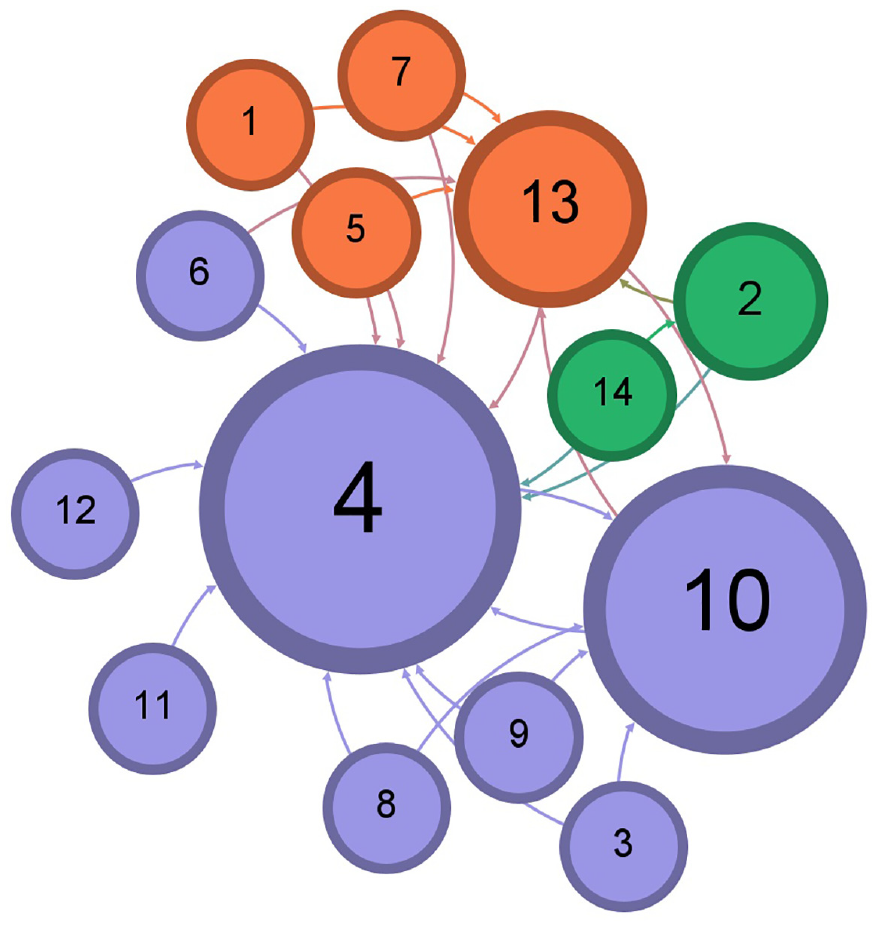
Illustration of the three communities for 14k Twitter dataset after accepting following the recommendation by cosine similarity.
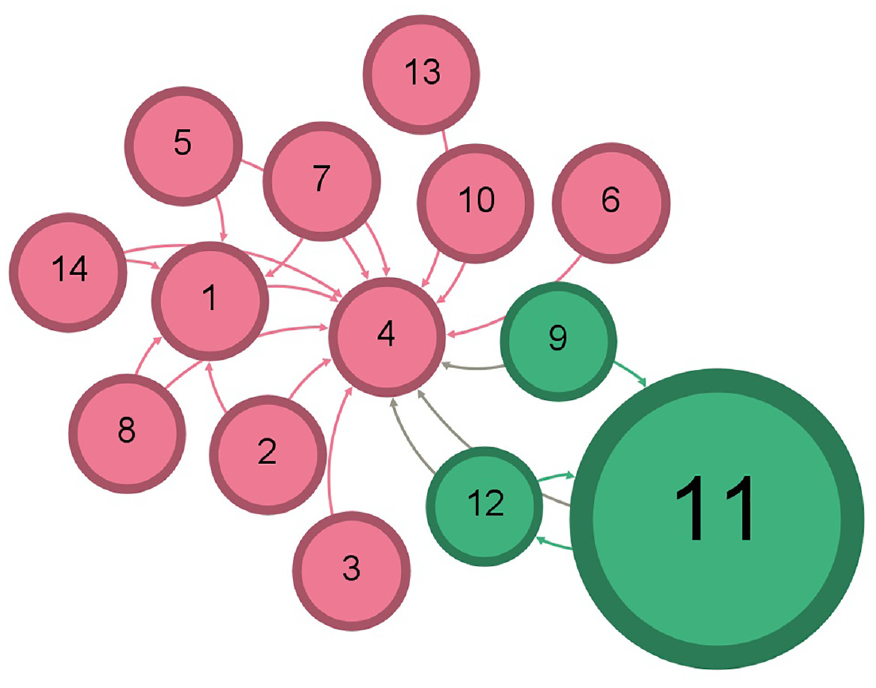
Illustration of the two communities for 14k Twitter dataset after accepting following the recommendation by Doc2Vec.
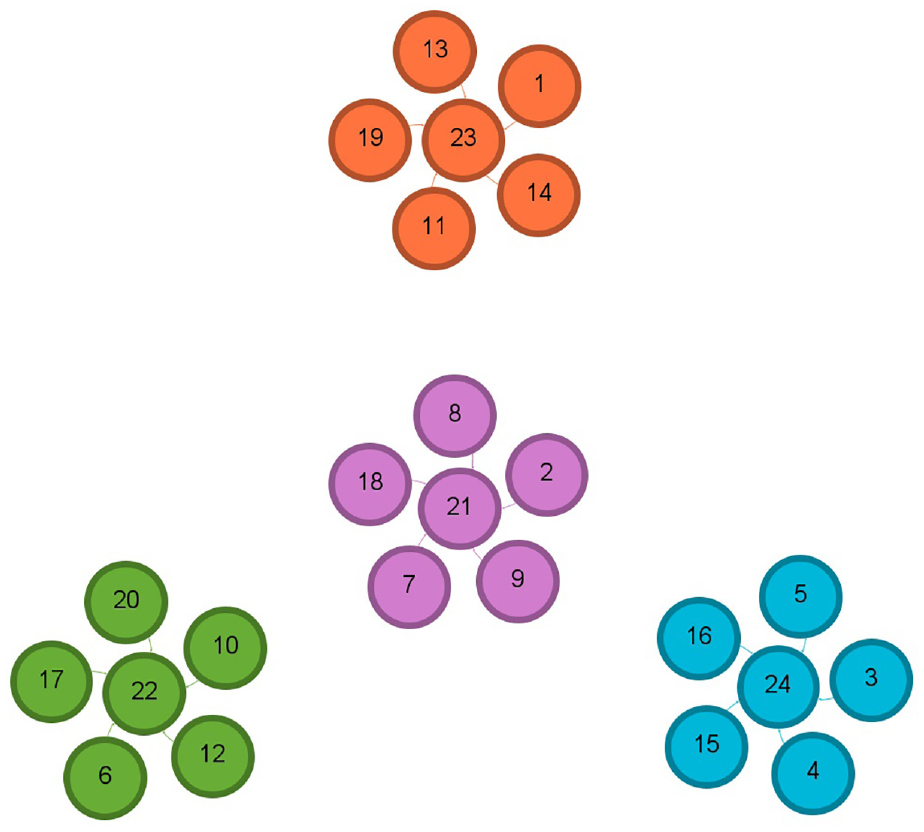
Illustration of the four communities for 57k Twitter dataset before following any recommendations.
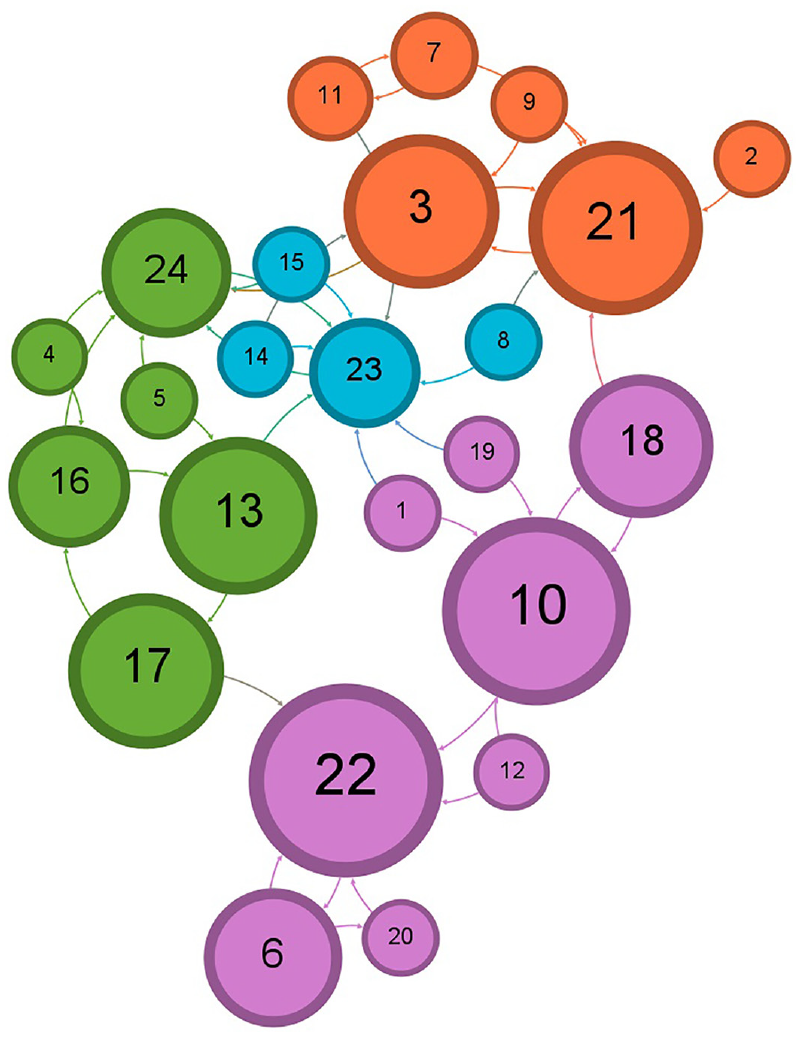
Illustration of the four communities for 57k Twitter dataset after accepting following the recommendation by K-means clustering.
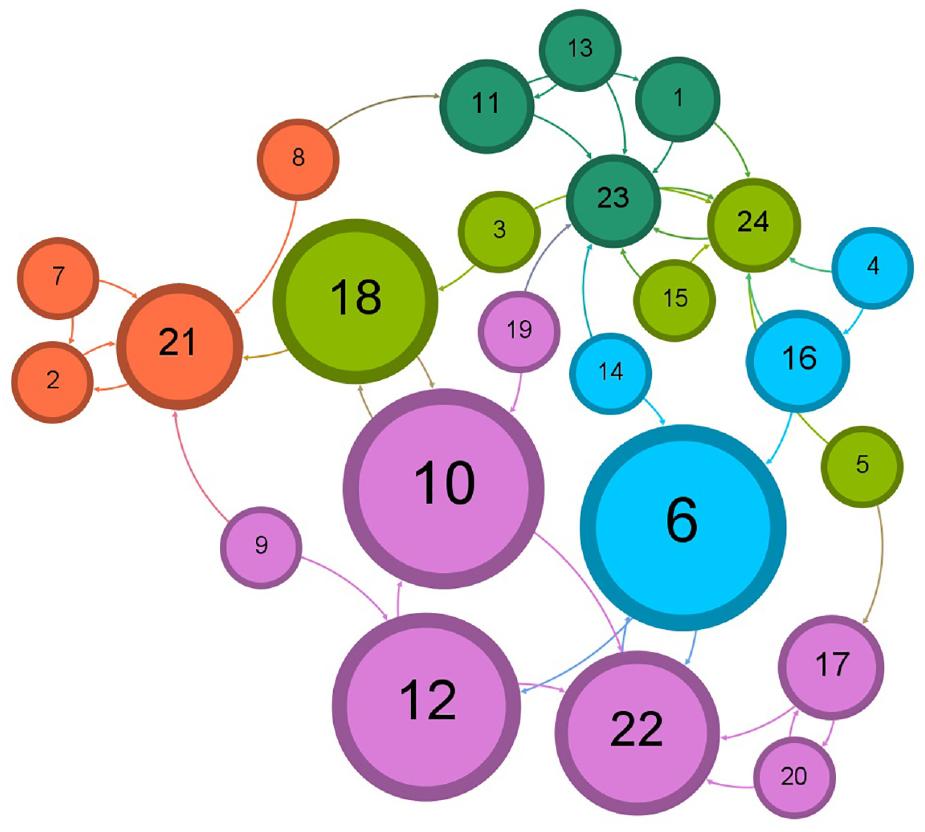
Illustration of the five communities for 57k Twitter dataset after accepting following the recommendation by cosine similarity.
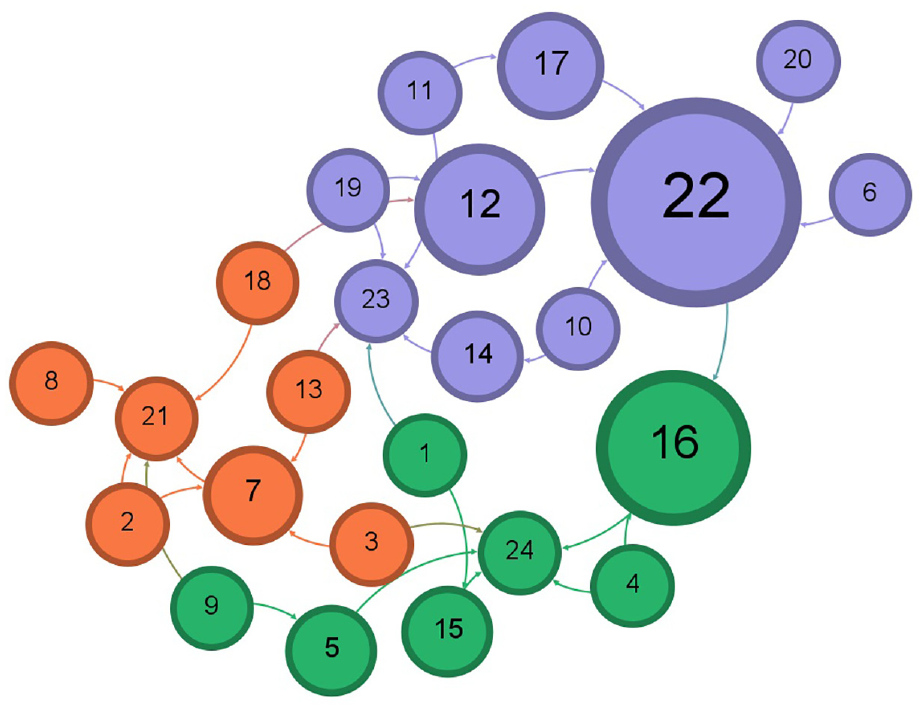
Illustration of the three communities for 57k Twitter dataset after accepting following the recommendation by Doc2Vec.
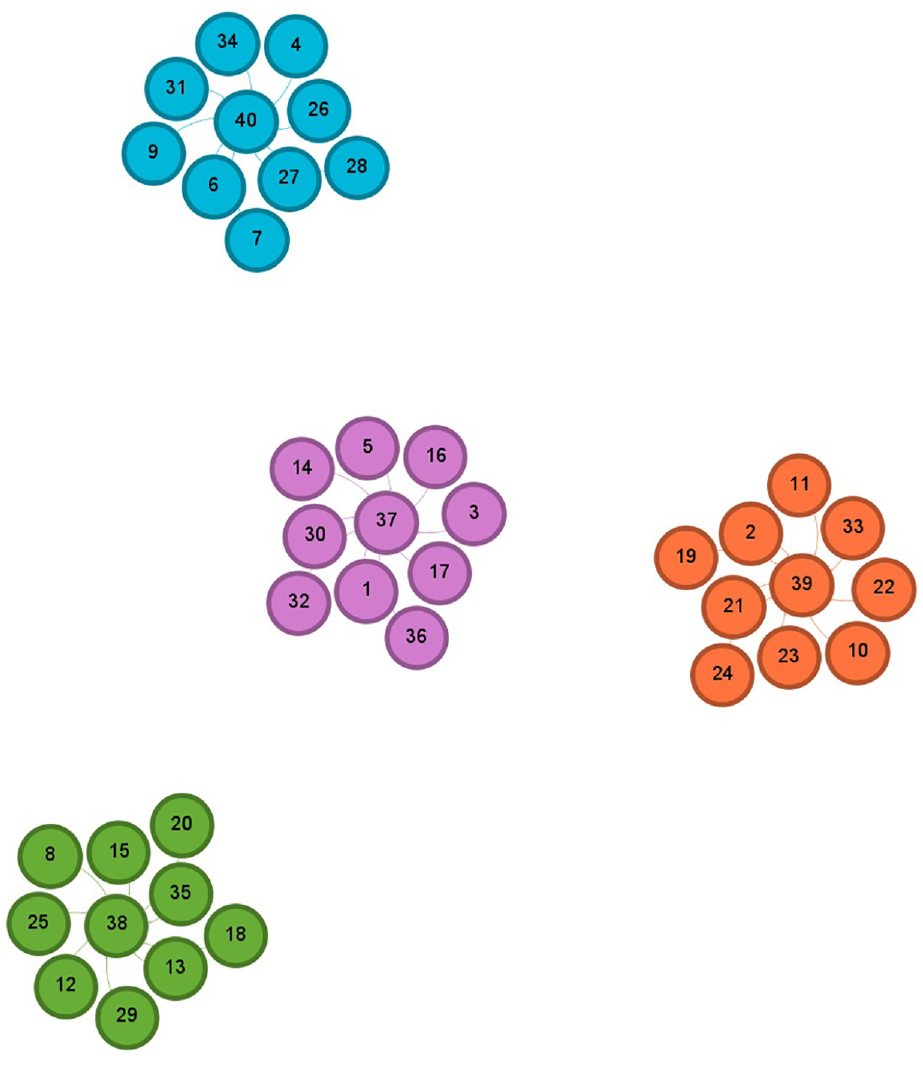
Illustration of the four communities for 94k Twitter dataset before following any recommendations.
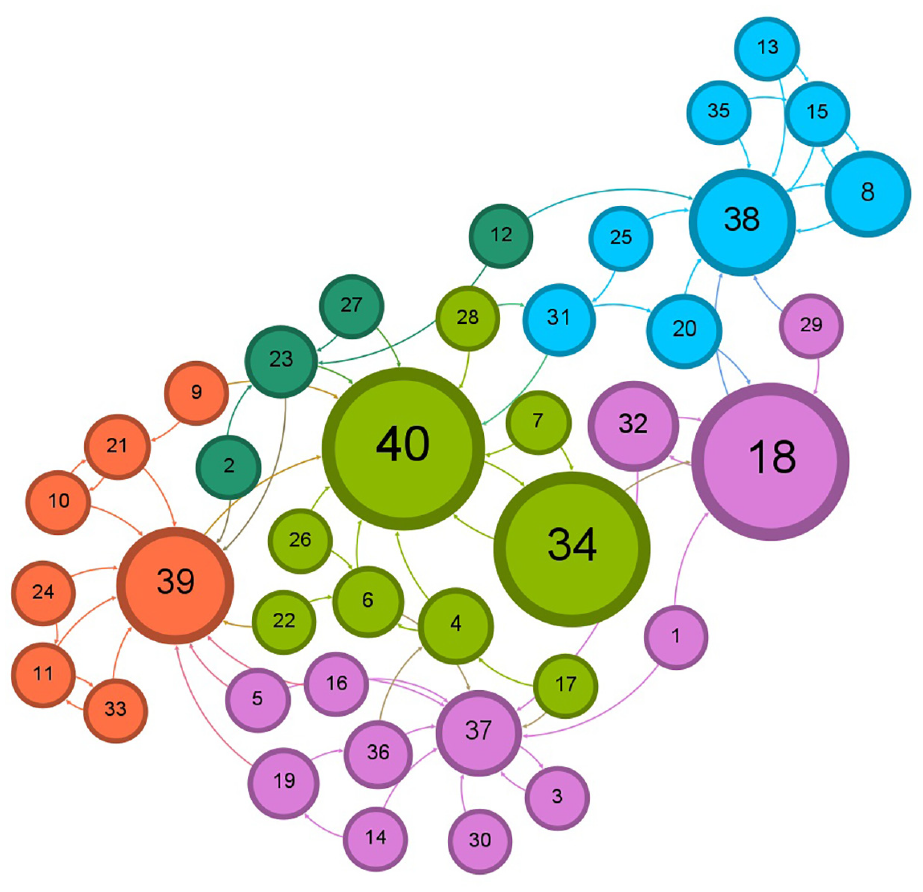
Illustration of the five communities for 94k Twitter dataset after accepting following the recommendation by K-means clustering.
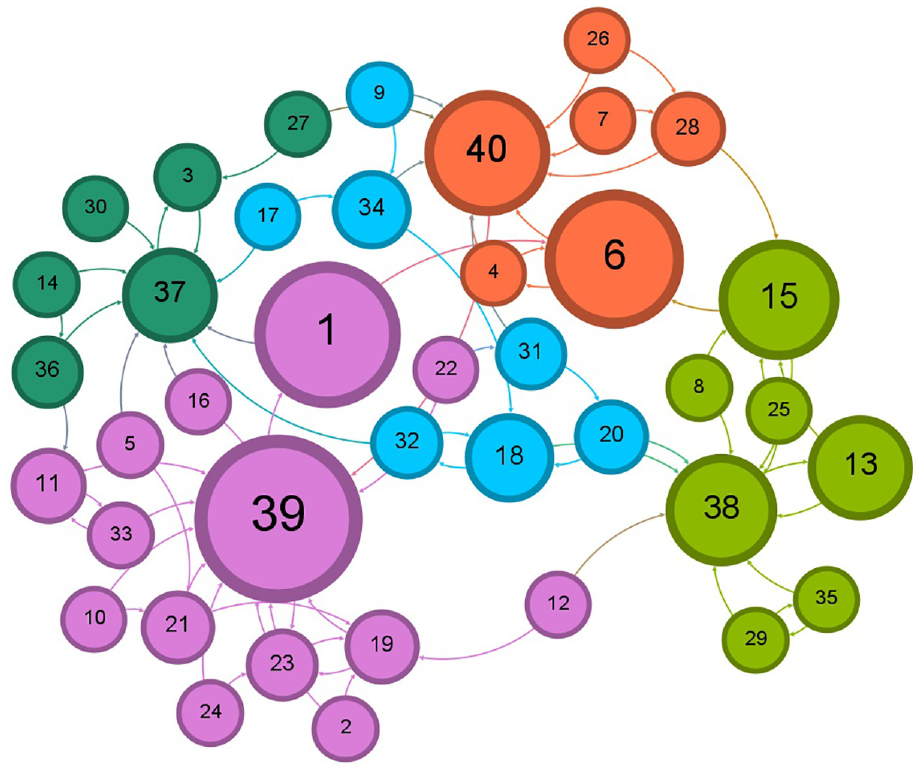
Illustration of the five communities for 94k Twitter dataset after accepting following the recommendation by cosine similarity.
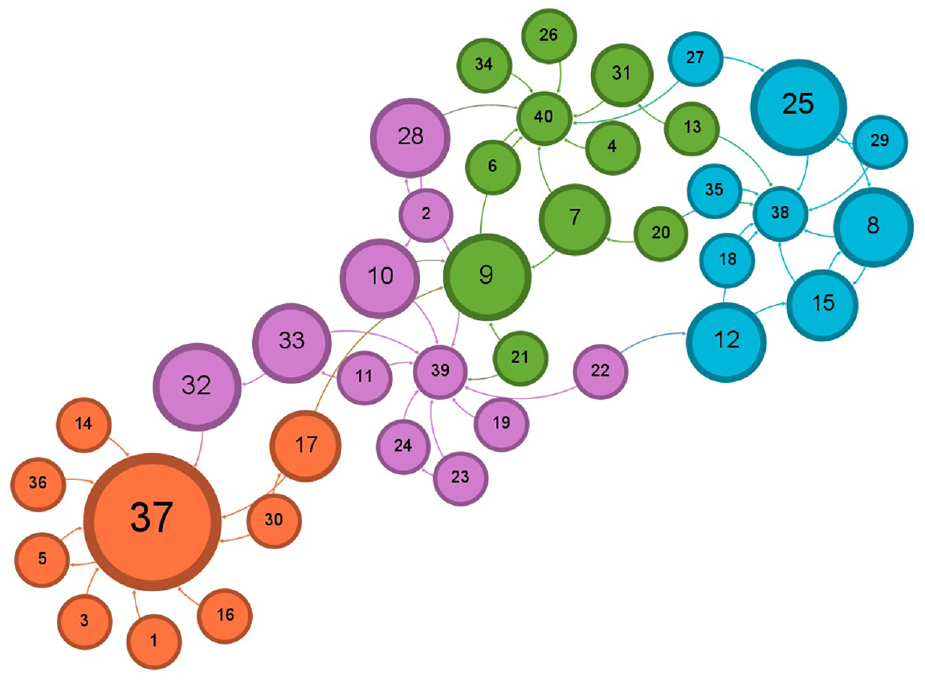
Illustration of the four communities for 94k Twitter dataset after accepting following the recommendation by Doc2Vec.
The layout of a resulted network graph for any of the applied datasets has been shaped by a selection in the layout palette of the Gephi visualization tool to explore better and determine the features and pattern for resulted detected communities in a network and to avoid vertex overlapping and improve the overall appearance of a graph. Each color represents a particular community after running the Louvain method to calculate the modularity, and a modularity class is created for every vertex. Therefore, the colors of vertices vary according to their modularity class. The labels of vertices differentiate users’ names, including a follower–followee in Twitter datasets or a researcher in Scientific Research Papers datasets, assigned with a unique number. The size of vertices has been scaled and ranked based on the betweenness centrality metric, representing smaller vertices with lower betweenness centrality and bigger vertices with higher betweenness centrality value. That is to say, the betweenness centrality determines the number of times a vertex lies on the shortest path between other vertices as the most efficient path between two vertices in a network. 25 The bigger vertices with a higher betweenness centrality measure act as bridges between vertices in each network graph and can help identify the users/researchers who influence the flow of information, resources, or interactions as key connectors, providing resources or spreading information between different parts of these networks. This points to the fact that vertices with a higher value of betweenness centrality can facilitate and promote faster spread of information in the Twitter network, whereas publication venues can be recognized more quickly in Scientific Research networks. The small-world effect in networks is defined by two measures: the length of the shortest path and the clustering coefficient. A small-world network is characterized by a small value for the shortest path and a high clustering coefficient. Thus, a small-world network can propagate information across vertices through a few long-distance connections. A small-world network combines the high clustering feature of a regular network while having a short path length between vertices found in random networks. 26
4.3.2. Graphical results for Retail dataset
Figures 17–19 demonstrate the detected communities for the 20k Retail dataset before following any recommendations received by the algorithm in use and after following the recommendations by the SVM and Doc2Vec methods, respectively.
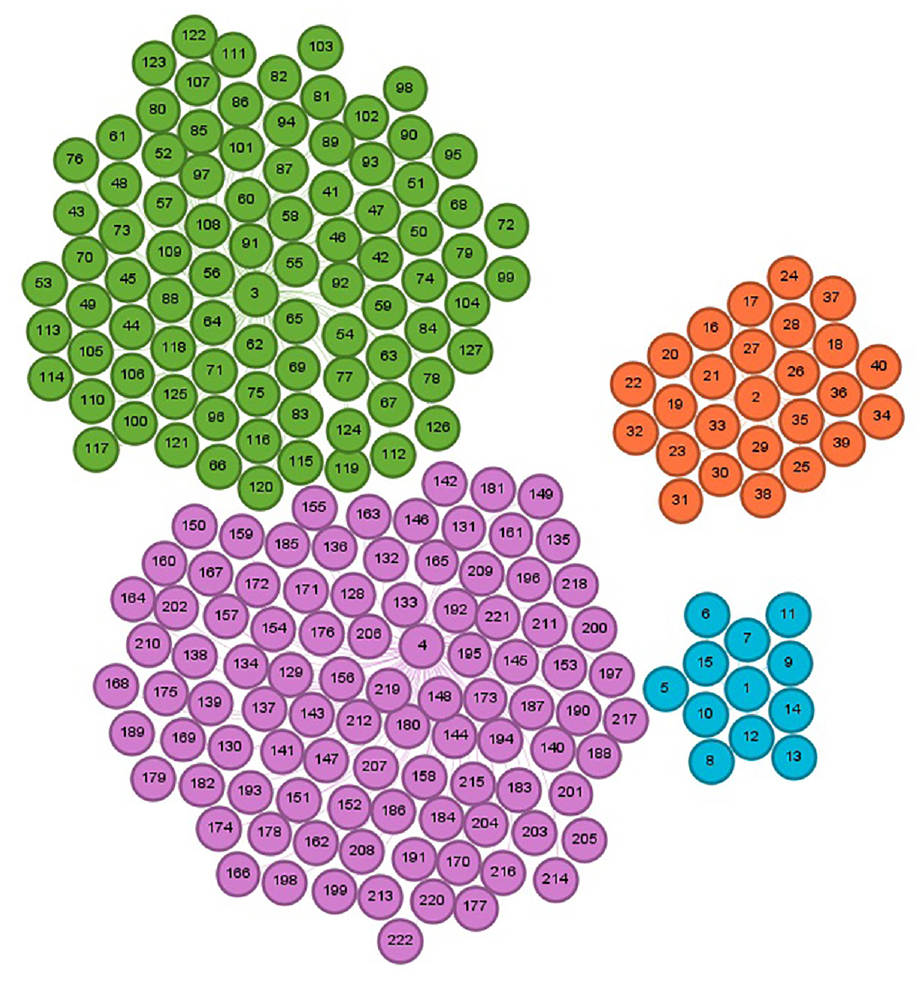
Illustration of the four communities for 20k Retail dataset before following any recommendations.
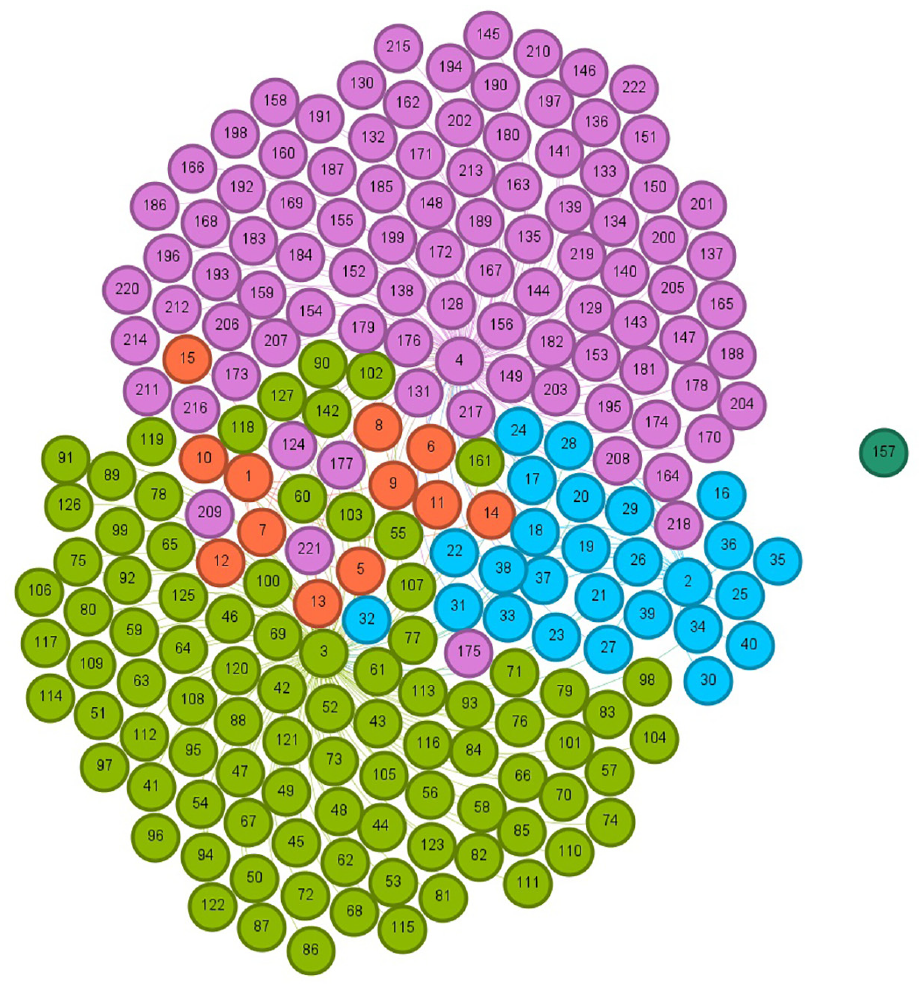
Illustration of the five communities for 20k Retail dataset after accepting following the recommendation by SVM.
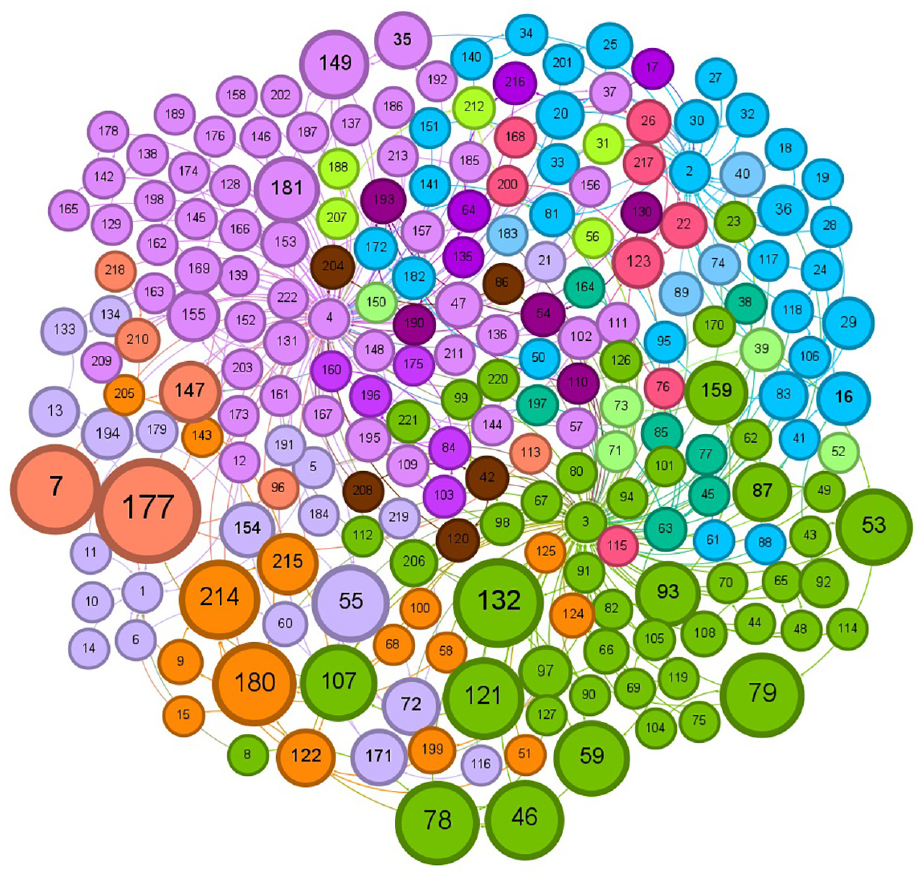
Illustration of the 15 communities for 20k Retail dataset after accepting following the recommendation by Doc2Vec.
4.3.3. Graphical results for Scientific Research Papers datasets
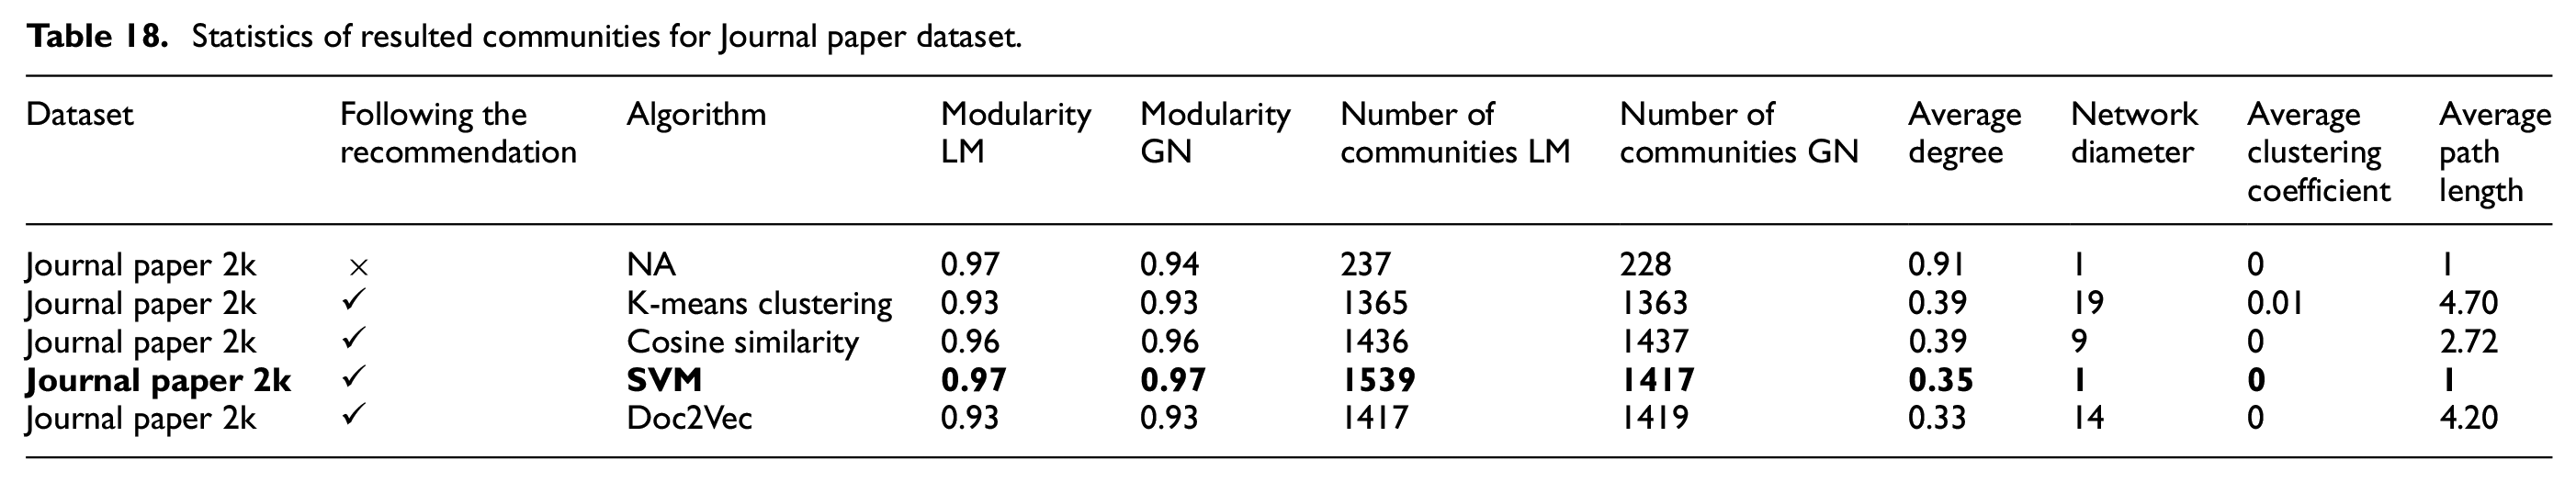
Figures 20–24 illustrate the evolution of detected communities in the 2k Scientific Research Papers dataset. Figure 20 depicts 237 communities before receiving any recommendations. Subsequently, Figure 21 displays the impact of the K-means clustering algorithm’s recommendation, increasing to 1365 communities. Figure 22 shows the application of the cosine similarity algorithm leading to 1436 communities. Figure 23 reveals the outcomes of the SVM algorithm, reaching the highest value of 1539 communities. Finally, Figure 24 illustrates the communities detected by the Doc2Vec method, totaling 1417 communities in the network.
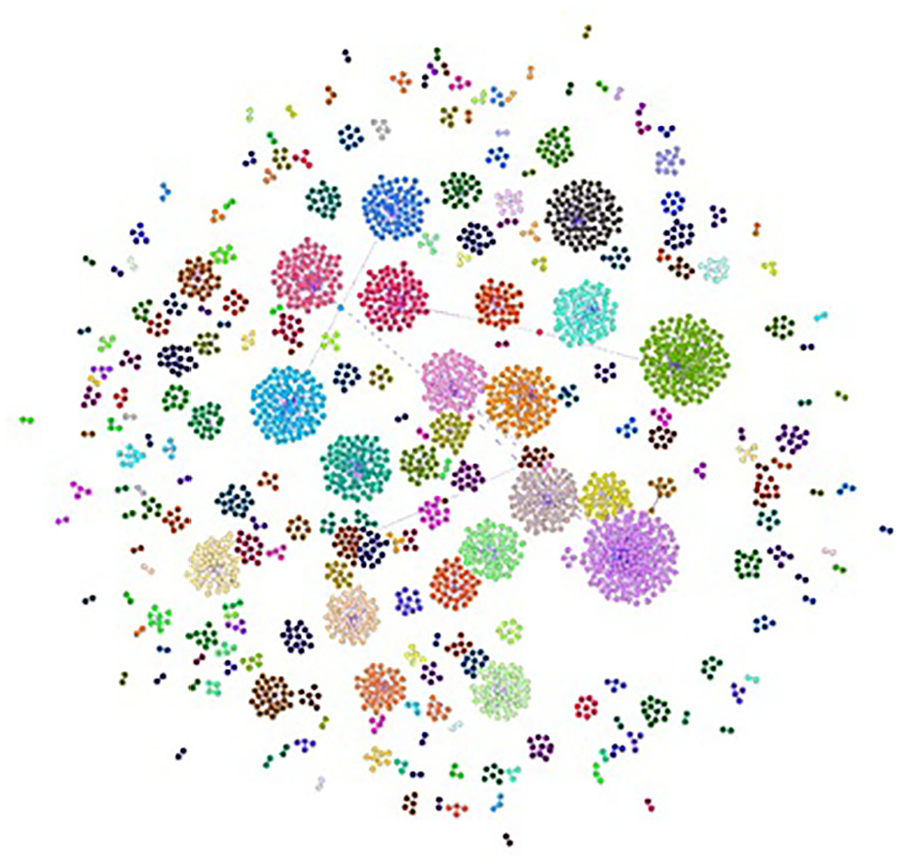
Illustration of 237 communities for 2k Journal paper dataset before following any recommendations.
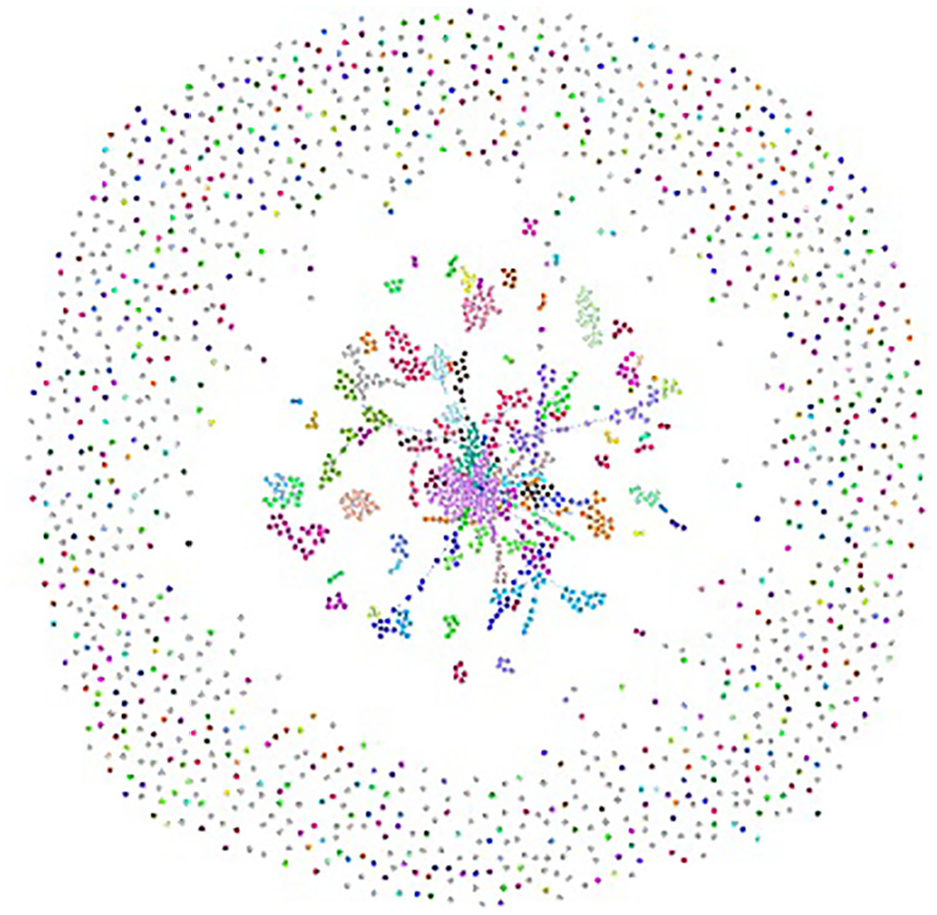
Illustration of 1365 communities for 2k Journal paper dataset after accepting following the first recommendation by K-means clustering.
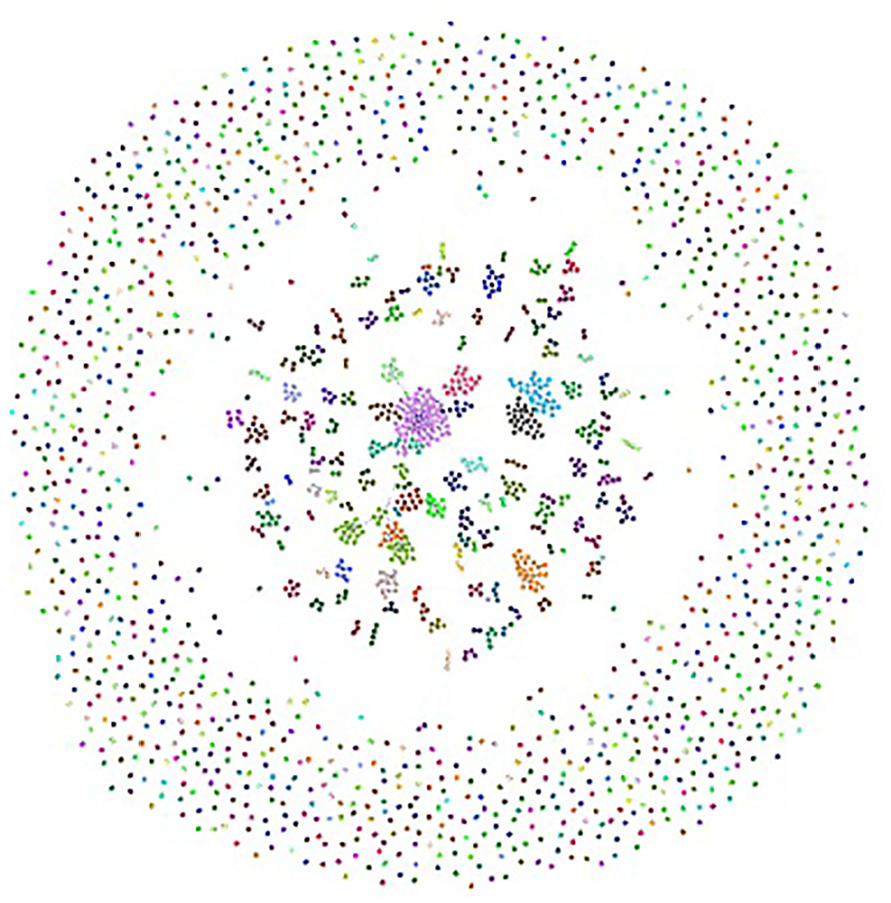
Illustration of 1436 communities for 2k Journal paper dataset after accepting following the first recommendation by cosine similarity.
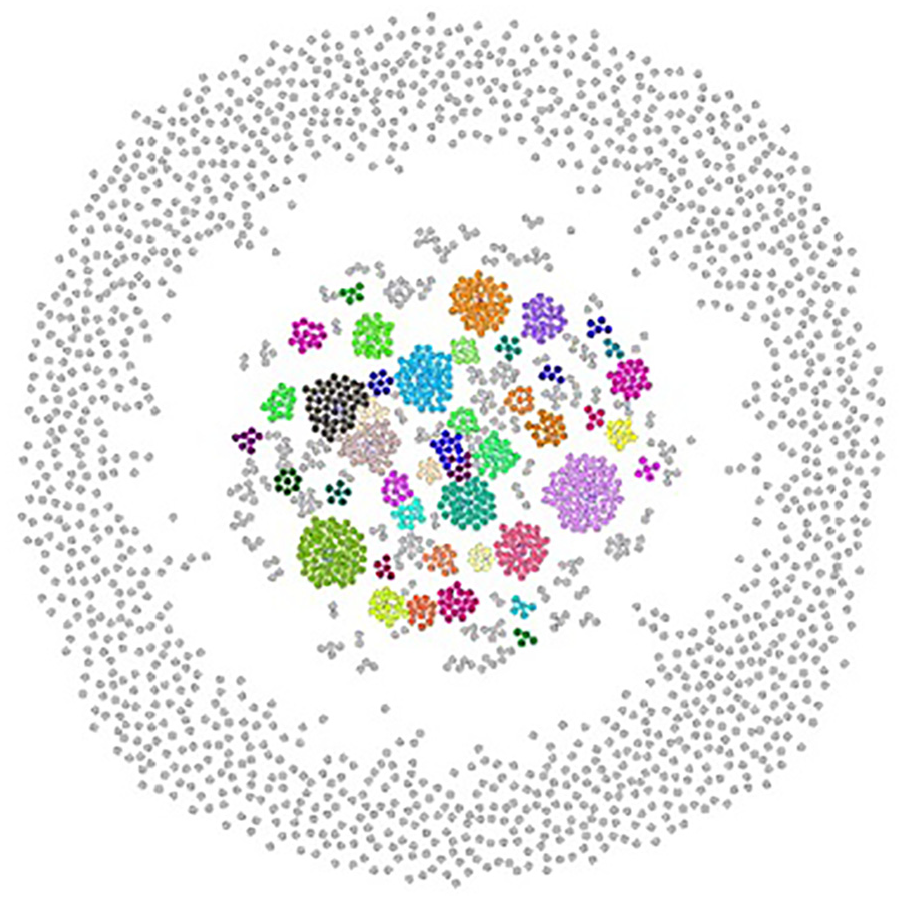
Illustration of 1539 communities for 2k Journal paper dataset after accepting following the first recommendation by SVM.
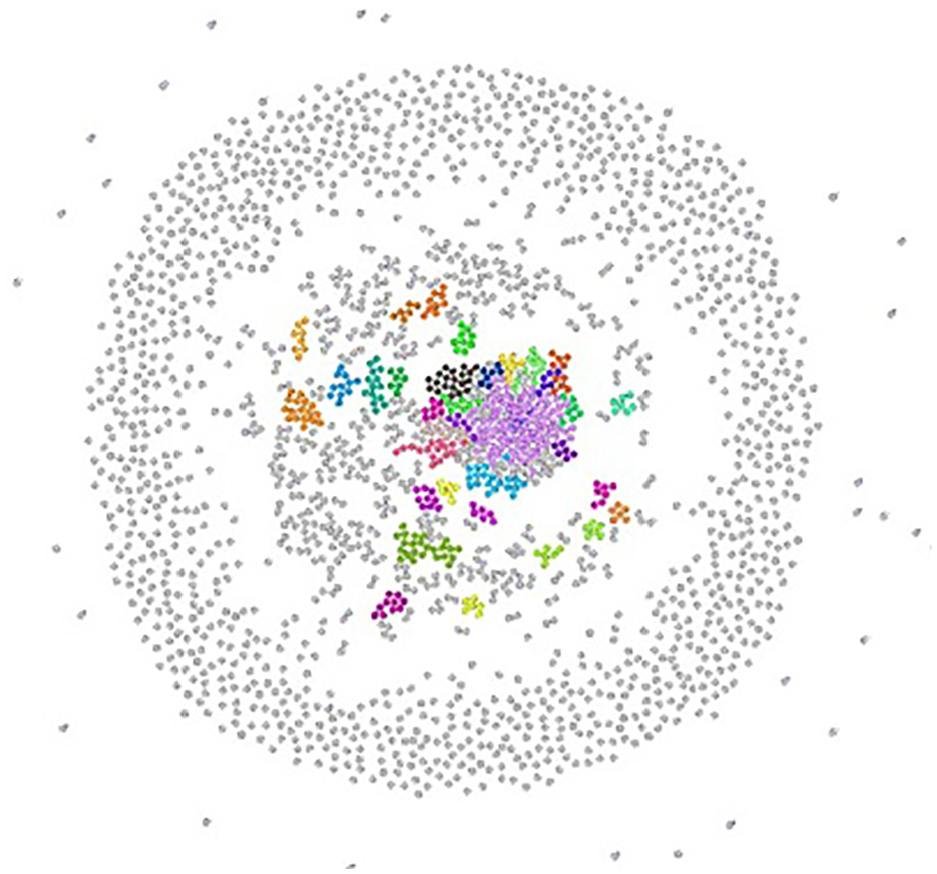
Illustration of 1417 communities for 2k Journal paper dataset after accepting following the first recommendation by Doc2Vec.
4.4. Detected communities results
Tables 17 and 18 display the statistics of resulting communities run by K-means clustering, cosine similarity, SVM, MLP, and Doc2Vec algorithms in the DSMP social network simulator for each Twitter, Scientific Research Papers, and Retail datasets after following the recommendation. It can be seen that when the modularity value increases, the number of communities decreases more or less for each Twitter dataset. The SVM algorithm presents the same values for modularity degree and number of communities for 57k and 94k Twitter datasets, given that it does not apply to the 14k unary Twitter dataset when the Louvain community detection method is applied. Doc2Vec method demonstrates the greatest value for modularity with the lowest number of communities for all 14k, 57k, and 94k Twitter datasets compared with K-means clustering, cosine similarity, and MLP algorithms with the Louvain method. To address the issue of excluding the 14k Twitter unary dataset, which resulted in conclusions regarding the negligible number of communities and the degree of modularity, the 2k and 1k Scientific Research Papers datasets were incorporated into this study. These two Scientific Research Papers datasets include a significantly larger number of users than Twitter datasets, providing a more comprehensive analysis. The SVM algorithm demonstrates greater modularity value and number of communities compared to K-means clustering, cosine similarity using BoW vectors, and the one using the Doc2Vec model in the 2k Scientific Research Papers dataset applying the Louvain method. To sum up, the algorithms using BoW vectors show greater values for the number of communities and modularity degree compared to the Doc2Vec method for all the Twitter and Scientific Research Papers datasets with the Louvain method. The average degree attains its topmost value for K-mean clustering and cosine similarity algorithms, which shows a larger number of connections for each vertex and a high level of collaboration among the users of these networks. The network diameter defines the longest shortest path between any two vertices in a network to find how closely connected different parts of a network are. The maximum value of the network diameter is obtained by K-means clustering and cosine similarity algorithms for all Twitter and Scientific Research Papers datasets.
Statistics of resulted communities for Twitter and Retail datasets.
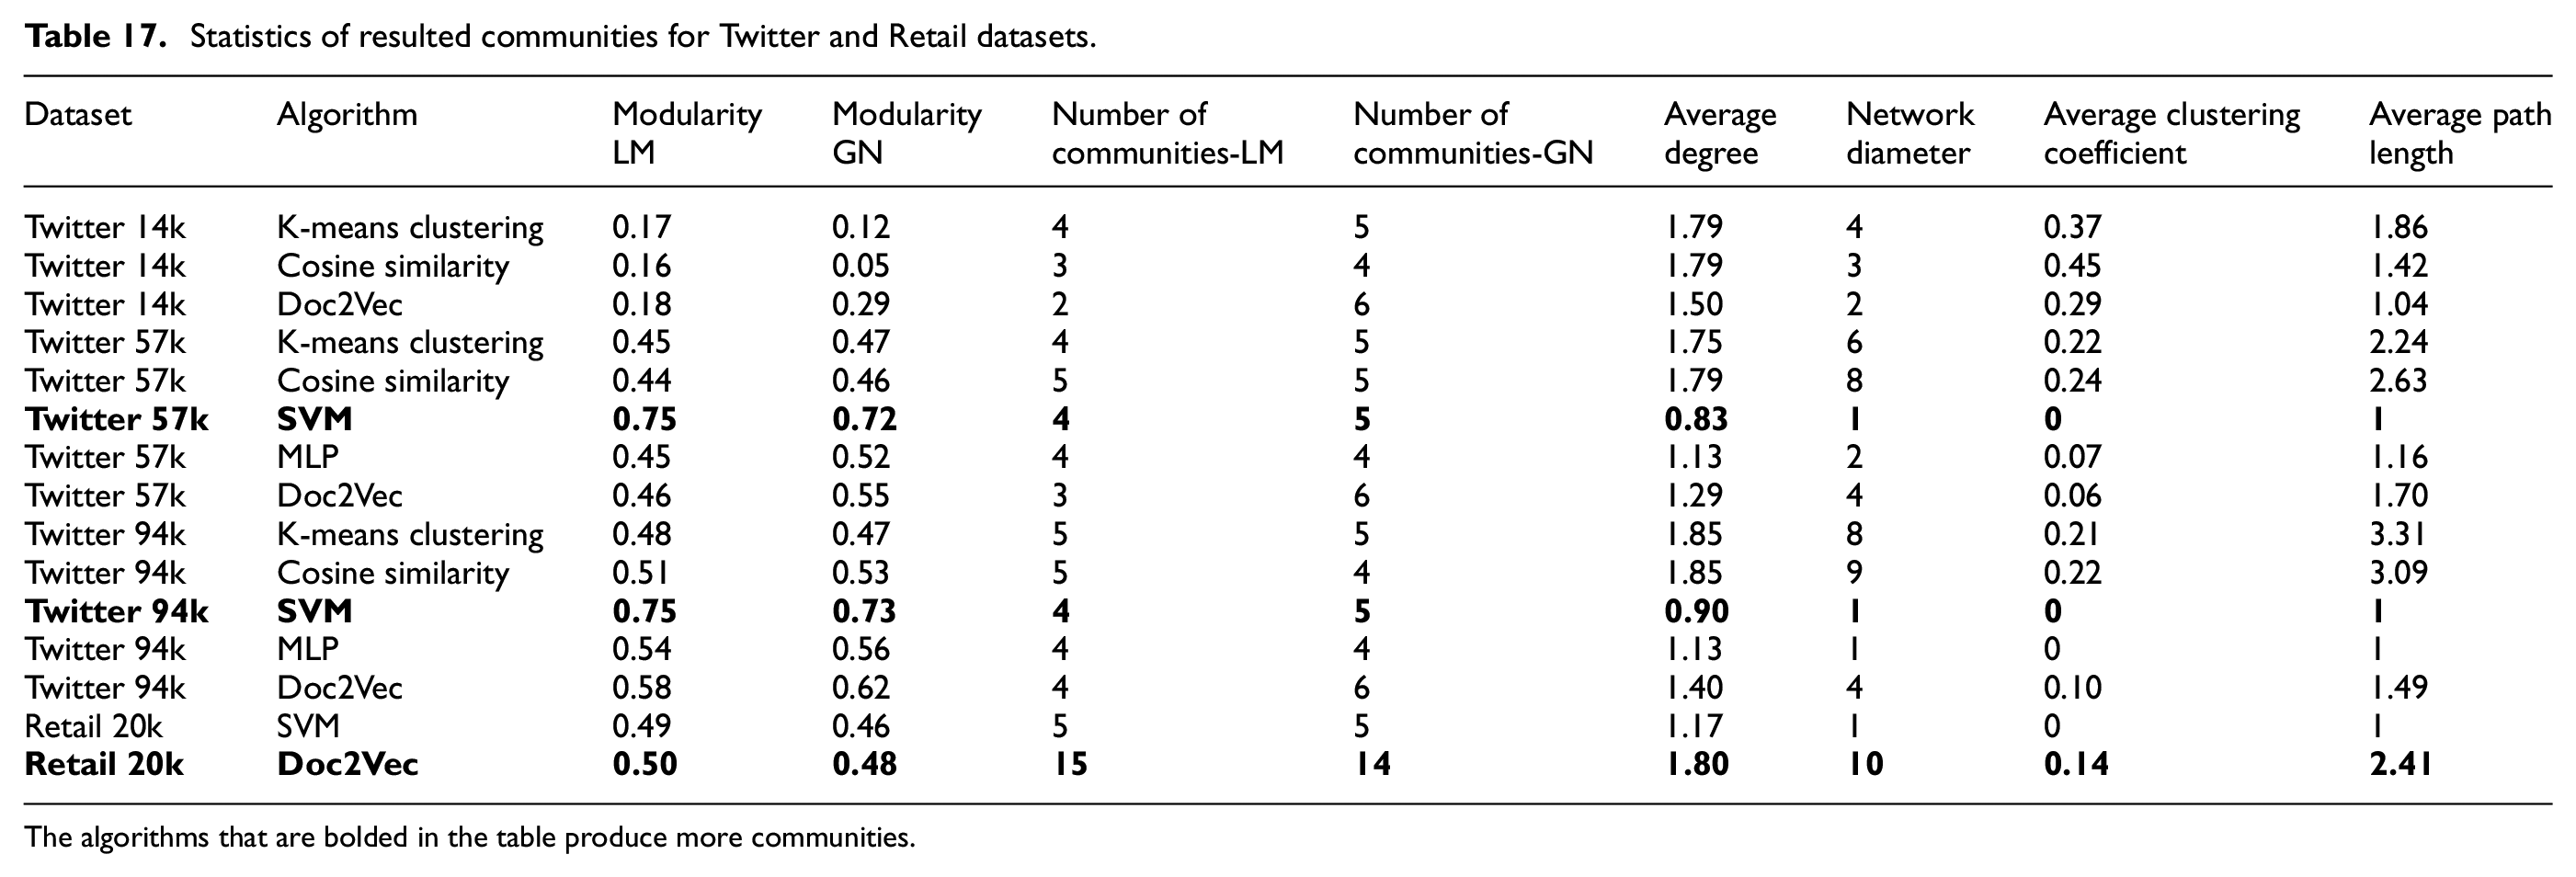
The algorithms that are bolded in the table produce more communities.
Statistics of resulted communities for Journal paper dataset.
Since the results of community detection algorithms are not deterministic, and to verify the results of the Louvain algorithm implemented in the simulator, the Girvan–Newman community detection method was also included in our experiments (as shown in Tables 17 and 18). The statistics of detected communities by Girvan–Newman closely align with the achieved result by the Louvain community detection method, except it detects a greater number of communities for the Doc2Vec method with the Retail dataset. The reason is that in the Retail dataset, the text similarity among users who follow the same followee is higher compared to the other datasets. Since Doc2Vec considers the semantics of the text beyond just similar words, it detects slightly more communities than the other two types of datasets, as shown by the Girven–Newman method. However, the modularity degree remains nearly consistent for the Louvain and Girvan–Newman community detection methods for all the Twitter and Scientific Research Papers datasets.
This observation is also confirmed by the results of Table 3, which show the accuracy of each dataset and indicate inherent similarities between the text in each dataset. The accuracy in the Retail dataset is higher, which explains why the Doc2Vec method, which considers semantic meaning, generates more communities with the Retail dataset. In simple terms, similar items (text) in the Retail network follow the same retailer. Therefore, Doc2Vec, which captures the meaning of similar words, can categorize this dataset more effectively.
The effect of existing text similarity in a dataset on community formation after simulation can be confirmed by the Scientific Research Papers dataset, which has the largest number of users with the lowest accuracy (i.e., text similarity), as shown in Table 3. Table 18 shows that SVM generates more communities than the others and is slightly better than Doc2Vec, which takes advantage of lexical meaning in similar texts. We have used the Doc2Vec model extensively in analyzing different Scientific Research Papers datasets in our previous works. 27 – 29 In these previous works, the datasets used were different and the text of the body of each paper was used for the classification, and Doc2Vec performed well. However, in this work, for the Journal paper datasets, only the text of the titles of the papers is used for training the Doc2Vec model. Because the similarity between the title text is low (as shown by accuracy in Table 3), Doc2Vec cannot properly categorize the papers of the Journal paper datasets used in this work in the groups of papers with similar titles.
The maximum value of network diameter is obtained by K-means clustering and cosine similarity algorithms for all the Twitter and Scientific Research Papers datasets. This indicates that there are pairs of vertices far apart from each other in terms of the number of connections between them as a result of some loosely connected communities to each other. The K-means clustering and cosine similarity algorithms obtain almost the highest average degree across all the Twitter and Scientific Research Papers datasets, denoting the increased level of connectivity in these networks.
The findings with used datasets indicate that ML algorithms using the BoW-TF-IDF model obtain a larger degree of modularity, together with a greater number of communities, when applying the Louvain community detection method compared to the Doc2Vec model for Twitter and Scientific Research Papers datasets. On the other hand, Doc2Vec obtained a higher value of modularity and a greater number of communities for only one of the datasets (i.e., Retail). Furthermore, algorithms with BoW vectorization gain a higher average degree, implying that the network produced after users follow recommendations is well connected in our datasets. This means that the community will be denser in the long run, and information can be transferred quickly between users if they follow the recommendations provided by ML algorithms and BoW vectors in the social networks similar to the datasets examined in this work.
5. Conclusion
This paper describes the enhancements made to our novel social network simulator, enabling it to simulate a typical NLP application that uses supervised ML algorithms to recommend similar users in social networking. Through simulations, we analyze the effects of these algorithms on the social network structure and the benefits of running the application in a parallel and distributed manner. In our previous works, we used the proposed social network simulator (i.e., DSMP simulator) to generate artificial social network data (e.g., synthetic tweets). In the enhanced version of the DSMP simulator introduced in this paper through the new sets of simulation experiments, we study the parallelization and effects of a wide range of ML algorithms: K-means clustering, cosine similarity, SVM, MLP when using BoW vectorization, and a Doc2Vec method. These experiments also focus on the change in communities and network graph structure by simulating a common text similarity application used in social networking.
The simulated application determines the similarity between Twitter tweets, titles of Scientific Research Papers, and transaction texts, thereby recommending similar users influencing social networks’ structure. Regarding the parallelization of the algorithms, in the simulated scenario of dividing data among multiple heterogenous nodes, the results are as follows: MLP and SVM algorithms demonstrated a higher speedup gain for the Twitter and Scientific Research Papers datasets, respectively. The parallelization factor shows how much the distributed algorithms are sped up when employing multiple nodes.
For analyzing the effects of each algorithm on social network structure, in each simulation run, the network evolves when the recommendation is followed by a selected user, forming new connections within each network. These new connections impact the overall structure of a network, leading to changes in community formation and network properties. The SVM algorithm achieved more training accuracy among the group of algorithms and holds the highest value of modularity when examining all the Twitter and Scientific Research Papers datasets when both the Louvain and Girvan–Newman community detection methods are applied. The Doc2Vec method showed a greater number of communities only for the Retail dataset.
In summary, we found that the number and quality of generated communities rely on the quality of classification of that dataset data, which is different in each dataset and depends on the accuracy of the ML algorithm used in the application. This means that with the continued improvement of AI and ML algorithms and the advancements of their parallelization and scalability, the community will be denser in the long run, and information can be transferred quickly between users if the important social networking applications, including recommendation systems, continue to employ ML algorithms.
The future directions of this work are to implement more state-of-the-art algorithms (e.g., transformers) and community detection algorithms into the simulator and to study their impacts on the structure of social networks and the parallelization of applications. The multiagent-based design of the simulator will be used to enhance user interactions in social networks to emulate more complex behaviors than merely following other users based on similarity.
Footnotes
Funding
This research is partly funded by the Natural Sciences and Engineering Research Council of Canada (NSERC). The development of the DSMP simulator would not have been possible without the help of all the members of the DSMP lab.
Author biographies
![]() .
.