
Abstract
Background
Sleep stage identification is critical in multiple areas (e.g. medicine or psychology) to diagnose sleep-related disorders. Previous studies have reported that the performance of machine learning algorithms can be changed depending on the biosignals and feature-extraction processes in sleep stage classification.
Methods
To compare as many conditions as possible, 414 experimental conditions were applied, considering the combination of different biosignals, biosignal length, and window length. Five biosignals in polysomnography (i.e. electrocardiogram (ECG), electroencephalogram (EEG), electromyogram (EMG), electrooculogram left, and electrooculogram right) were used to identify optimal signal combinations for classification. In addition, three different signal-length conditions and six different window-length conditions were applied. The validity of each condition was examined via classification performance from the XGBoost classifiers trained using 10-fold cross-validation. Furthermore, results considering feature importance were examined to validate the experimental results in terms of model explanation.
Results
The combination of EEG + EMG + ECG with a 40 s window and 120 s signal length resulted in the best classification performance (precision: 0.853, recall: 0.855, F1-score: 0.853, and accuracy: 0.853). Compared to other conditions and feature importance results, EEG signals showed a relatively higher importance for classification in the present study.
Conclusion
We determined the optimal biosignal and window conditions for the feature-extraction process in machine learning algorithm-based sleep stage classification. Our experimental results inform researchers in the future conduct of related studies. To generalize our results, more diverse methodologies and conditions should be applied in future studies.
Introduction
The number of people with sleep-related disorders is increasing continuously, while the underlying causes can be diverse.1–3 To date, and especially during the coronavirus disease 2019 (COVID-19) pandemic, the prevalence of sleep disturbances has widely increased, affecting various subpopulations. Al Maqbali et al. 4 in a meta-analytic study examined the psychological impact of stress and sleep disturbances associated with the COVID-19 pandemic on nurses working in hospitals. The authors suggested that in the context of the COVID-19 pandemic, experiences of sleep disturbance and depression among nurses were found to be higher than those related to previous Middle East respiratory syndrome and severe acute respiratory syndrome pandemics. Deng et al. 5 investigated rates of sleep disturbance in college students in a systematic review. The prevalence of sleep disturbances and associated risk of mental illness was found to be increased in association with the duration of the ongoing pandemic as well as higher age. Contrary to the aforementioned previous studies, however, Ara et al. 6 conducted a web-based survey to identify sleep disturbance during the COVID-19 lockdown in the general population, including 1128 individuals from Bangladesh. They found various factors, such as working from home or doing online classes, to be linked with the presence of sleep disorders during the pandemic.
The classification of sleep stages is important when examining sleep disorders and disturbances. Various methodologies have been applied to measure the depth or stage of sleep. Haythornthwaite et al. 7 attempted to develop a sleep diary assessment for patients with chronic pain based on diverse categories of questions for evaluation (e.g. difficulties falling asleep, early awakening, and quality of sleep). Currie et al. 8 collected sleep reports from patients with alcohol-dependency to evaluate sleep problems. They found similar difficulties falling asleep among alcoholics with short-term and long-term abstinence.
In recent research, physiological data collected from participants have been widely used to overcome biases associated with self-reports in the form of sleep diaries. Yong et al. 9 conducted polysomnography studies including 124 participants with Parkinson's disease, and revealed altered sleep architecture and reduced sleep duration in these patients. They analyzed variations in several biosignals, including electroencephalogram (EEG), electrooculogram (EOG), electromyogram (EMG), and electrocardiogram (ECG). In addition, Goyal et al. 10 identified risk factors related to obstructive sleep apnea in COVID-19 patients using a polysomnography dataset. Data from EEG, EOG, EMG, and body position were used to compare apnea levels and sleep depth.
In previous studies, machine learning algorithms have widely been used to find latent patterns in multiple biosignals and variables. Arslan et al. 11 used machine learning classification models to automatically score sleep stages using multichannel data from polysomnography. The framework proposed by the authors showed superior performance in sleep stage classification compared with other models used in previous studies. Furthermore, Satapathy et al. 12 proposed machine learning models for the classification of sleep stages. Their systems focused on sleep irregularities based on abnormal sleep patterns. They used a polysomnographic dataset and evaluated the performance of their model. The respective framework achieved a higher classification accuracy than the models proposed previously.
Similar to the existing studies mentioned above, we confirmed that diverse biosignal data in the context of polysomnography can be applied to develop sleep stage classification using machine learning models. In addition, we reviewed several studies related to feature extraction conditions and types of biosignals. Wongsirichot and Hanskunatai 13 compared four machine learning algorithms (k-means clustering, k-nearest neighbor, support vector machine, and multilayer perceptron) based on four biosignals (EEG, muscle movement, ECG, and thoracic respiratory efforts) in a polysomnography dataset. The authors determined that the classification performance of the machine learning algorithms changed with the combinations of biosignals. Based on their results, they suggested the importance of investigating the optimal features for sleep-level detection. The influence of EEG features on machine learning classifiers was validated by Satapathy et al. 14 Twelve features were calculated from the EEG signals in polysomnography datasets. The classification performances of the machine learning algorithms were compared in three different sets of feature conditions (of 12, 9, and 5 features). Each result for the three feature conditions showed different performance through combinations of EEG features. Santaji et al. 15 applied three different epoch lengths (of 1, 2, and 10 s) in the EEG feature-extraction process to identify the effects of EEG signal length on the sleep scoring performance of machine learning classifiers. The authors verified that the classification performance of three classifiers (decision tree, support vector machine, and random forest) can be altered based on the feature extraction conditions. Based on associated studies, including the aforementioned three studies, we evaluated the classification performance of machine learning algorithms using several combinations of biosignals (i.e. ECG, EEG, EOG left (EOGL), EOG right (EOGR), and EMG) in this study. Furthermore, different combinations of windows and signal lengths during feature extraction were compared. Finally, the performance of each model was validated by examining feature importance.
Methods
Overview
To compare the influences of different biosignals and several conditions for feature extraction on the performance of machine learning algorithms for sleep stage classification, we composed a five-step research scheme. First, a total of five biosignals (ECG, EEG, EMG, EOG from left-eye-movements, and EOG from right-eye-movements) were extracted from the polysomnography dataset (sleep heart health study dataset). Second, 64 features were calculated from the 5 previously selected biosignals, with diverse window and signal length conditions. Third, utilizing the extracted 64 feature sets, we created all possible combinations based on the biosignals (e.g. combinations with two signals: ECG + EEG or ECG + EMG). Fourth, each dataset of predefined conditions was used to train and evaluate the machine learning classification algorithm (XGBoost classifier). Finally, the classification performance of the XGBoost classifier was evaluated using four performance indices. In addition, the feature importance results of the experimental conditions with the highest classification performance are based on the trained algorithms. A detailed depiction of the present research scheme is presented in Figure 1.

Overview of the research scheme. ECG: electrocardiogram; EEG: electroencephalogram; EMG: electromyogram; EOGL: electrooculogram left; EOGR: electrooculogram right.
Data source
An open-source polysomnography dataset from the sleep heart health study (SHHS) was used.16,17 The SHHS is a multicenter cohort study conducted by the National Heart Lung and Blood Institute in the United States aiming to investigate cardiovascular and other consequences of sleep-disordered breathing. A total of 9736 participants (mean age: 40 years) were tested for associations between sleep-related breathing and the risk of heart disease, stroke, and hypertension. In addition, the respective dataset was collected over two cycles. The first cycle (SHHS visit 1) included surveys from 6441 participants enrolled between November 1, 1995, and January 31, 1998. Second-cycle surveys (SHHS visit 2) were conducted from January 2001 to June 2003 including 3295 participants. The final included datasets included polysomnography and survey data. In the case of polysomnography datasets, several collected biosignals were saved in EDF file format. One EDF file was used per participant. Consequently, 9736 EDF files were included in the SHHS dataset. Each biosignal in EDF files was labeled with sleep level scores in 30 s intervals. A total of six sleep level scores were included in polysomnography datasets (e.g. awake level and 1 ∼ 5 levels based on the sleep depth). For the survey results datasets, each response to the survey questions was included in two Excel files (i.e. SHHS1.xlsx and SHHS2.xlsx). The detailed subcategories of the variables of the SHHS dataset are listed in Table 1.
Categories of variables in the SHHS dataset.
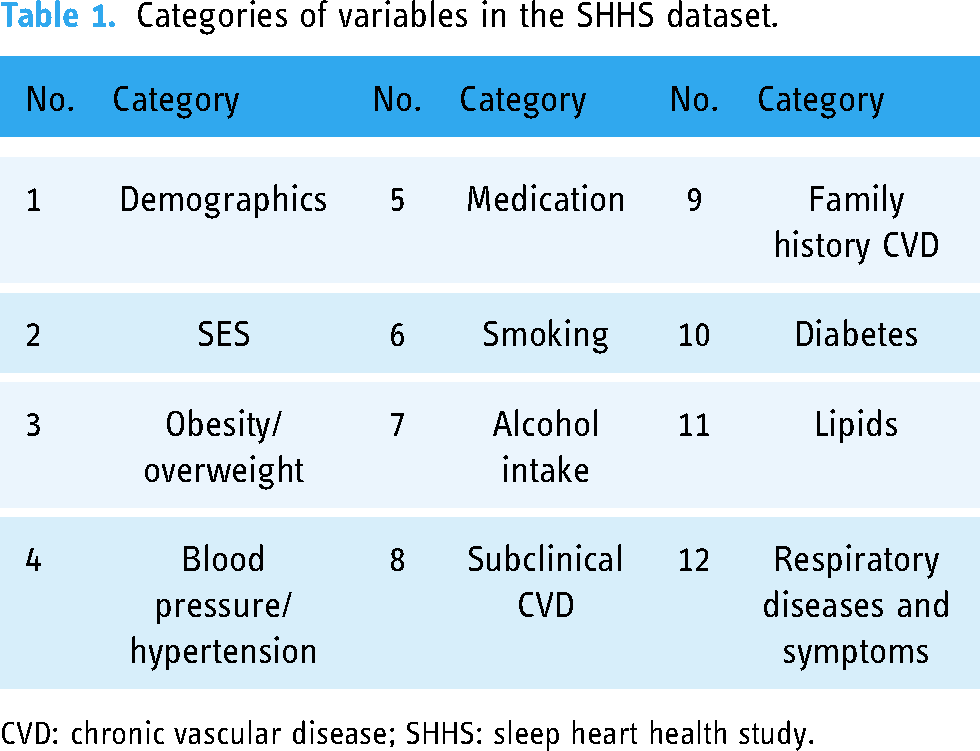
CVD: chronic vascular disease; SHHS: sleep heart health study.
Feature extraction from biosignals
An overview of the feature-extraction process is shown in Figure 2 . Among the two categories of data (i.e. biosignal and survey data) in the SHHS dataset, besides survey data we only used five biosignals (ECG, EEG, EMG, EOGL, and EOGR) from the polysomnography dataset. To examine the influence of signal length and window length during the feature-extraction process on classification, we created 18 conditions (i.e. 3 signal length conditions × 6 window length conditions = total 18 conditions). In the case of signal length, 3 length conditions were applied (60, 90, and 120 s). Sliced signals were used for feature extraction based on 6 window-width conditions (15, 20, 30, 40, 50, and 60 s). Before feature extraction, we extracted consecutive intervals of the biosignals with the same sleep labels to apply the aforementioned conditions considering each biosignal (e.g. 2 min lengths of biosignals with the same sleep level, i.e., 4 intervals with 30 s lengths and the same sleep score level). The sampling frequencies of each of the five different biosignals were also considered in the feature-extraction process. For example, ECG signals were measured at a sampling frequency of 250 Hz. Based on the sampling frequency of the ECG signals (250 Hz), 15,000 samples were sliced into 60 s signal length conditions. The overall feature-extraction process is depicted in Figure 2. Additionally, to validate the diverse features extracted from the 5 biosignals, we extracted 64 features from the signals. Detailed lists of the features are listed in Appendices A and B (additional descriptions of each feature are included in Appendices C and D). Furthermore, 23 combinations of biosignals were used to validate the usability of each signal. The combinations are listed in Table 2. As a result, we evaluated the classification performance from 414 conditions (23 combinations of biosignals × 18 conditions in signal and window lengths = 414 conditions) in this study. To reflect the characteristics of the biosignals as much as possible, samples of all biosignals utilized in this study were normalized to a range of 0 to 1 before feature extraction.

Example of feature-extraction process (15 s length window and 120 s length ECG signals). ECG: electrocardiogram.
Combinations of five biosignals in the SHHS dataset.

ECG: electrocardiogram; EEG: electroencephalogram; EMG: electromyogram; EOGL: electrooculogram left; EOGR: electrooculogram right.
Machine learning algorithm for validation
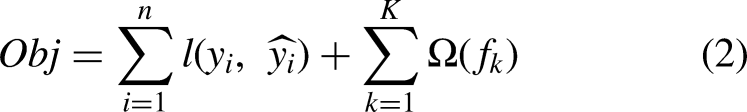
Among various machine learning classification algorithms, we selected extreme gradient boosting (XGBoost) classifiers based on previous studies on similar research topics.18–20 These supervised algorithms can be used for both regression and classification problems. In our cases, we applied the XGBoost algorithm to classify sleep stages. Because these algorithms are ensembles of decision tree models, the classification and regression tree (CART) algorithm is the basis of the XGBoost algorithms. Predicted values from multiple CART algorithms (i.e. the decision tree model) were summarized to calculate the final prediction. The final prediction of the XGBoost algorithm is calculated using the following equation: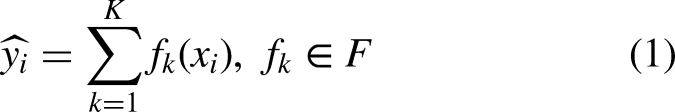
Evaluation metrics
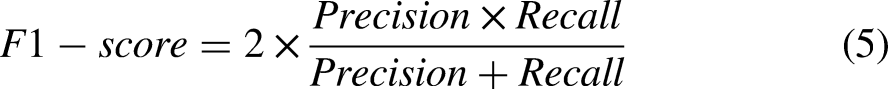
To evaluate the classification performance of the XGBoost classifiers, we utilized four evaluation metrics (precision, recall, F1-score, and accuracy). To obtain the four aforementioned metrics, we obtained confusion matrices from the trained classifiers. From each confusion maix, true positive (TP), false positive (FP), true negative (TN), and false negative (FN) were calculated. The TP and TN values indicate the ratio of samples correctly classified. FP and FN denote the ratio of the incorrectly classified samples. Finally, we obtain four evaluation indices using the following equations:


Tools
XGBoost classifiers were built, and data preprocessing was performed using Python (version 3.7.1; scikit-learn, version 2.4.1) and R (version 4.0.3).
Results
Classification performances of machine learning classifier
Based on the extracted features, 414 final datasets for the experimental conditions were used to apply the XGBoost classifier model. In each final dataset, an average of 1,200,000 rows was included with features of signal combinations. For example, in the case of a dataset with a 120 s length signal and a 15 s length window from ECG signals, the dimension of the dataset was (1,233,053, 18). Here, 1,233,053 denotes the number of rows, and 18 indicates the number of ECG features in the dataset.
Using the aforementioned 414 datasets for evaluation, we compared the classification performances between the 414 experimental conditions to determine the optimized window and biosignal length for sleep stage identification. Among the tested experimental conditions, classification performance of “EEG + EMG + ECG” with 40 s window and 120 s signal length showed the highest evaluation metric values (precision: 0.853, recall: 0.855, F1-score: 0.853, and accuracy: 0.853). Table 3 and Appendices E, F, G, H, and I present the full results.
Averaged classification performances with features from a 40 s length window.

ECG: electrocardiogram; EEG: electroencephalogram; EMG: electromyogram; EOGL: electrooculogram left; EOGR: electrooculogram right.
Feature importance of experimental condition with best classification performances
To validate model performance in terms of features important for classification, we examined feature importance considering the trained classifiers. The feature importance considering the model with the highest classification performance (i.e. “EEG + ECG + EMG” condition with 40 s window and 120 s signals) was examined. Ten different sets of results on feature importance were compared because 10-fold cross-validation was used for model training and evaluation. For important features from top 1 to 4 ranks, the same trends were confirmed. Only features extracted from EEG signals (“DELTA,” “Higuchi_Fractal_Dimension,” “Petrosian_Fractal_Dimension,” and “Detrended_Fluctuation_Analysis”) were included in the top four features. Features extracted from other signals (ECG and EMG) showed different rank trends considering importance results. Results considering feature importance from the top 1 to 10 features are detailed in Table 4.
Top 10 feature importance of EEG + ECG + EMG condition with 40 s window and 120 s signals.

ECG: electrocardiogram; EEG: electroencephalogram; EMG: electromyogram; EOGL: electrooculogram left; EOGR: electrooculogram right.
Discussion
In this study, we tested the classification performance of XGBoost classifiers under diverse conditions to determine the optimal window and signal conditions for sleep stage classification. Before conducting our research, we attempted to propose reasonable evidence regarding our research topics (i.e. identifying optimal signal and window conditions for sleep stage classification with machine learning algorithms). First, in the case of two keywords related to machine learning and sleep stage classification, Surantha et al. 21 utilized an extreme learning machine and support vector machine (SVM) to classify sleep stages with diverse class conditions. Aboalayon et al. 22 compared five supervised classification machine learning algorithms (decision tree, neural network, k-nearest neighbors, naive Bayes, and SVM) for sleep stage classification tasks.
Second, regarding optimal feature extraction conditions (third keyword), Satapathy et al. 23 validated 12 statistical features from input biosignals to find optimal feature sets in sleep-level identification. The usability of each feature was verified using the accuracy results of the random forest algorithms. Santaji and Desai 24 extracted nine EEG features, including time and frequency domain features, to detect rapid eye movement (REM) sleep and non-REM sleep stages. In addition, different conditions for the amplitude and frequency ranges of EEG signals were used in the feature-extraction process. For several EEG features with various conditions, the utility of each feature was compared with the performance of machine learning algorithms. Based on the aforementioned studies, we concluded that our research aims were appropriate.
To construct a research scheme for our study, we considered several previous studies with similar research topics. Şen et al. 25 applied five different machine learning classification algorithms (random forest, feed-forward neural network, decision tree, support vector machine, and radial basis function neural network) to identify the sleep levels. Their study consisted of three stages: feature extraction from EEG signals, feature selection, and classification using machine learning algorithms. In the first stage, 41 features in 4 different categories (time, nonlinear, frequency-based, and entropy) were extracted from the EEG signals. Among 41 features, the highest effective features were selected with associated 5 algorithms (“fast correlation based filter,” “mRMR algorithm,” “fisher score algorithm,” “t-test algorithm,” and “ReliefF algorithm”) in the feature selection stage. In the last stage, five machine learning classifiers were used to compare the classification performance in sleep scoring.
Ugi et al. 26 proposed a sleep stage classification framework with a machine learning classifier in two classes (awake and sleep). Four phases were included in their research (“segmentation and filtering,” “feature extraction,” “estimation,” and “performance check”). The ECG signal collected from each participant was segmented using 30 s epochs and filtered using a finite impulse response filter at a band frequency of 0.05 ∼ 35 Hz in the first phase. In the second phase (feature-extraction process), three ECG features (mean, variance, and standard deviation) were extracted from each segment signal with 30 s length. The three extracted features were applied to the SVM classifiers for sleep stage classification in the estimation phase. Finally, the classification performance of the optimized SVM models was evaluated using three metrics (accuracy, precision, and recall).
Satapathy and Loganathan 27 suggested a classification methodology that uses dual-channel EEG signals for automated sleep staging. Their research was composed of three steps (“feature extraction from EEG signals,” “feature selection,” and “classification with machine learning algorithms”). In the first step, linear and nonlinear features are extracted from the input signals. In the second step, the optimal features were selected from the extracted feature sets using the ReliefF weight algorithm. Random forest classification model was trained and evaluated using a 10-fold cross-validation strategy in the final step.
Similar to previous studies, including those mentioned above, we included several common steps (“feature extraction from biosignals,” “classification with machine learning algorithm,” and “performance evaluation with metrics”) in our research scheme. However, in our research, we focused on validating the influence of window length and biosignals in the feature-extraction process. To compare the effects of window length and biosignal length in feature extraction, 6 window length conditions (15, 20, 30, 40, 50, and 60 s) and 3 biosignal length conditions (60, 90, and 120 s) were used. Additionally, a total of five biosignals (ECG, EEG, EMG, EOGL, and EOGR) and their combinations were utilized to check the optimal combination of biosignals in sleep stage classification. Furthermore, unlike previous studies that compared several machine learning classifiers, only a single machine learning algorithm was used in this research to concentrate on the effects of the signal and window length for classification. Among the diverse set of choices of available machine learning classifiers, based on previous studies, we utilized XGBoost classifiers. Siyuan et al. 28 compared three machine learning algorithms (XGBoost, AdaBoost, and SVM) in sleep staging research. In their experimental results, XGBoost classifiers showed better performance (accuracy: 90.6%) than AdaBoost and SVM classifiers, which have been widely applied in related studies. In addition, Choi et al. 29 used XGBoost classifiers to develop a framework for detecting extreme drowsiness using short-time segment EEG signals. The authors showed the possibilities of these algorithms for classification with a relatively insufficient biosignal length.
To interpret our experimental results, we compared our results with those of previous studies. First, the condition with EEG + EMG + ECG, 40 s window, and 120 s signal length showed the best classification performance (precision: 0.853, recall: 0.855, F1-score: 0.853, and accuracy: 0.853) under all experimental conditions. Choi et al. 29 observed similar trends (accuracy: 0.788, sensitivity: 0.788, and specificity: 0.787) in the classification performances of the XGBoost classifiers in similar research settings. Similar to our study, the authors have only applied filtering methods without detailed preprocessing steps. They extracted features in a 2 s window from EEG signals. Additionally, their framework classifies binary classes (extremely drowsy and normal). Hei et al. 30 also suggested an XGBoost algorithm-based sleep stage classification framework with similar performance levels (average accuracy: 0.830). They used similar research designs as that in this study. They applied only filtering methods to preprocess the EEG and EOG signals. Furthermore, each feature was calculated using a 30 s window.
Second, in three biosignals (EEG, ECG, and EMG), we compared the relative importance of each biosignal through the performance of other combinations (e.g. EEG + EMG or EEG + ECG) in the same window and signal length. In the case of combinations with two biosignals, the ECG + EMG condition showed precision: 0.446, recall: 0.463, F1-score: 0.452, and accuracy: 0.463, whereas, conditions including EEG (EEG + EMG and EEG + ECG) showed better performance (EEG + EMG showed precision: 0.829, recall: 0.829, F1-score: 0.831, and accuracy: 0.835 / EEG + ECG had precision: 0.840, recall: 0.839, F1-score: 0.842, and accuracy: 0.844) than ECG + EMG conditions. Similarly, the best performance was observed in the EEG condition of a single biosignal (precision: 0.814, recall: 0.816, F1-score: 0.817, and accuracy: 0.822). Bin Heyat et al. 31 compared the performance of several combinations of ECG, EMG, and EEG signals. The EEG signal conditions exhibited the best classification performance under the experimental conditions.
Finally, in feature importance results, four EEG features (“DELTA,” “Higuchi_Fractal_Dimension,” “Petrosian_Fractal_Dimension,” and “Detrended_Fluctuation_Analysis”) were commonly included in the top 1 to 4. It is associated with trends related to the aforementioned results that EEG signals are most important for classification. Furthermore, the delta wave of the EEG signal is related to sleep.32,33 These results further support the validity of the present results.
Strengths and limitations
This study has several strengths and limitations. As regards the strengths, the diverse combinations (i.e. 414 experimental conditions) of 5 biosignals and feature extraction conditions (signal and window length) were compared to determine the optimal conditions for sleep stage classification. Second, we validated our results using the feature importance of the trained XGBoost classifiers with the highest classification performances. However, our study also had some limitations. First, we used only one machine learning algorithm (i.e. XGBoost classifier) to investigate the optimal conditions for sleep levels. Although only one algorithm was applied, this algorithm has been widely applied in previous studies and has attained higher performance than that of other algorithms. Second, other latent patterns in biosignals for sleep stage classification can be identified using other data-driven algorithms (e.g. deep learning algorithms). Third, rather than using all six stages, different sleep stage combinations can be applied to find meaningful features for classification (e.g. classify stages between awake and stage 1). We considered that our experimental results can be used as a preliminary data for associated studies. Furthermore, we plan to examine other sleep stage conditions and patterns in future studies.
Conclusion
Accurate sleep stage classification is critical for various fields, including medicine and psychology. In this study, we compared several window lengths and biosignal conditions in feature extraction to determine the optimal combination of biosignals and respective conditions for sleep stage classification using machine learning algorithms. To examine the influence of each condition on the classification performance, 414 experimental conditions, including different biosignal combinations, were applied. We found that EEG, ECG, and EMG combinations with a 40 s length window and 120 s signal length show the best classification performance (precision: 0.853, recall: 0.855, F1-score: 0.853, and accuracy: 0.853) considering all evaluation metrics used in the present research setting. In addition, we found that the importance of EEG features was higher than that of ECG and EMG features based on the present results. Moreover, we validated the importance of EEG features for sleep stage classification by comparing the results with those of previous studies. In conclusion, we confirmed that our results are reasonable in terms of both quantitative (i.e. classification performance) and qualitative aspects (i.e. feature importance). Our research can provide appropriate evidence regarding window and signal length for researchers who want to conduct similar studies. Furthermore, to generalize our experimental results, we will conduct additional analyses in future studies.
Supplemental Material
sj-docx-1-dhj-10.1177_20552076231163783 - Supplemental material for Validation of the influence of biosignals on performance of machine learning algorithms for sleep stage classification
Supplemental material, sj-docx-1-dhj-10.1177_20552076231163783 for Validation of the influence of biosignals on performance of machine learning algorithms for sleep stage classification by Junggu Choi, Seohyun Kwon, Sohyun Park and Sanghoon Han in Digital Health
Footnotes
Acknowledgements
Contributorship
JC and SK contributed to the conception, and design of the study. JG, SK, and SP contributed to the acquisition of data. JC, SK, SP, and SH contributed to the analysis and interpretation of the data. JC contributed to the drafting of the manuscript.
Declaration of conflicting interests
The authors declared no potential conflicts of interest with respect to the research, authorship, and/or publication of this article.
Ethical approval
Not applicable.
Funding
The authors disclosed receipt of the following financial support for the research, authorship, and/or publication of this article: This work was supported by the The Yonsei Signature Research Cluster Program of 2021 (grant number 2021-22-0005).
Supplemental material
Supplemental material for this article is available online.
Guarantor
SHH.
References
Supplementary Material
Please find the following supplemental material available below.
For Open Access articles published under a Creative Commons License, all supplemental material carries the same license as the article it is associated with.
For non-Open Access articles published, all supplemental material carries a non-exclusive license, and permission requests for re-use of supplemental material or any part of supplemental material shall be sent directly to the copyright owner as specified in the copyright notice associated with the article.