
Abstract
In this paper we develop an approach to modeling and simulating the process of infection transmission among individuals and the effectiveness of protective counter-measures. We base our approach on pedestrian dynamics and we implement it as an extension of the Vadere simulation framework. In order to enable a convenient simulation process for a variety of scenarios, we allow the user to interact with the simulated virtual environment (VE) during run time, for example, by dynamically opening/closing doors for room ventilation and moving/stopping agents for re-positioning their locations. We calibrate and evaluate our approach on a real-life case study—simulating COVID-19 infection transmission in two kinds of scenarios: large-scale (such as the city of Münster, Germany) and small-scale (such as the most common indoor environments—classrooms, restaurants, etc.). By using the tunable parameters of our modeling approach, we can simulate and predict the effectiveness of specific anti-COVID protective measures, such as social distancing, wearing masks, self-isolation, schools closing, etc.
Keywords
1. Motivation and introduction
When an infectious disease is new, decision-makers (e.g., public health authorities, hospitals, and especially municipalities) try to answer the two most important questions: how does the infection spread, and what measures are necessary and effective to mitigate it? For example, SARS-CoV-2 often starts locally, but it spreads quickly and globally. This makes mitigating the virus very challenging for governments: they must determine the proper guidelines to be applied in time to reduce the spread of the virus.
Unfortunately, lack of reliable data often prevents effective anti-infection measures. The number of people infected is difficult to determine on a daily basis, as symptoms do not occur until a few days after infection. In addition, infection statistics are not available early on in a pandemic, so it is difficult to know how many people have become infected and how many people are already immune to the disease.
Modeling and simulation are useful approaches to answering the questions about the spread of infectious diseases. By adapting the models to a specific infection disease and the conditions of the environment (generally by tunable parameters), the actual situations and developments can be described and analyzed. Furthermore, computer simulation can offer viable means for hypothesis testing, evaluating best- and worst-case scenarios, and assessing the effect of different measures on outbreaks of disease.
Traditional models for describing the dynamics of disease development divide the population into several categories: Susceptible (S), Exposed (E), Infected (I), and Recovered (R). This leads to four classes of pandemic models: SI, SIS, SIR, and SEIR.1,2 A major problem with traditional models, especially for predicting the virus transmission, is that they are static. Usually, they contain fixed values for several parameters, while ignoring other key parameters. Important limitations are for example: (a) the contact duration among individuals is considered constant; (b) social distancing between individuals is neglected; and (c) the isolation of infected persons is not taken into account: they are viewed as still infectious. These restrictions strongly limit these models’ ability to represent real-life pandemic scenarios.
In this paper, we aim at improving the simulation of infection transmission, by developing a modeling and simulation approach based on pedestrian dynamics. The goal of our approach is to be able to model and simulate potential guidelines for dealing with pandemics that can be defined by governments and municipalities.
Our use case in the paper is the COVID-19 pandemic in Germany. In particular, we evaluate our modeling and simulation approach regarding the most important protective measures that restrict contacts between people3,4: (a) closing restaurants, bars, discos, pubs, and similar facilities; (b) social distancing, hygiene rules, and wearing masks; and (c) closing schools, universities, etc.
The practical benefit of our modeling and simulation approach is that it can predict the likelihood of an infected individual transmitting the infection to others in the most common environments (e.g., restaurants), and to elucidate to what degree closing schools, social distancing guidelines, and wearing masks can help to limit the spread of the virus.
We make the following novel contributions in this paper:
We introduce the new concept of behaviors, in particular we model the infection transmission behavior in the Susceptible-Infected-Recovered (SIR)-form and we implement it on top of the agent-based Vadere simulation framework. 5
We simulate social distancing, self-isolation, contacts restriction and using masks, and we test the influence of these protective measures in different scenarios.
We model infected people’s speaking volume and its influence on spreading of viral particles. This allows us to investigate the effectiveness of controlling individuals’ speaking behavior (in particular, singing) for limiting virus spread.
We substantially improve the level of user interactivity in our simulation environment: we allow the user to change the state of the simulated environment during simulation run time, for example, change room ventilation by opening/closing doors, moving/stopping agents, etc. Thus, we can simulate various scenarios in real time.
We extend the interactivity possibilities of the topography creator in the Vadere framework: in particular, we allow the user to add a city map and scale it in the GUI, in order to visualize large-scale scenarios in addition to small-scale scenarios.
Our simulation produces three kinds of output for experts and decision makers: (a) the effective reproduction factor
We validate and evaluate our approach in extensive experiments on virtual environments (VEs) of different scale: large-scale—city of Münster in Germany in 40 scenarios, and small-scale—offices, classrooms, restaurants, and large buildings (e.g., concert halls) in 60 different scenarios.
In the remainder of the paper, the related work is discussed in the next Section 2. We describe our concept of behaviors in Section 3 where we model the infection transmission and protective measures, and their implementation in the Vadere framework. In Section 4, we introduce and implement simulation interactivity in VEs. In Section 5, we evaluate our approach by running experiments on different SARS-CoV-2 transmission scenarios that confirm the adequacy and precision of the results predicted by simulation as compared with real-life pandemic curves. We summarize our findings in Section 6.
2. Related work
The availability of accurate information early in the development of a pandemic is important for epidemiological modeling, that is, representing the possible interactions between misinformation spread and disease outcomes.6–8 Despite advances in understanding previous pandemics (influenza, SARS, etc.), simulating the spread of the newest SARS-CoV-2 virus remains challenging. In reference, 9 effective strategies for controlling the spread of misinformation among individuals during an influenza pandemic were proposed in order to reduce communicable disease burdens in future diseases.
However, since the start of the COVID-19 pandemic, the available data has been and are still noisy and uncertain. In addition to limited and unbalanced global data, the reporting standards for new infections have not been standardized yet, resulting in statistical errors, particularly in underdeveloped regions and countries. One of the most important ways to overcome this challenge is to develop sophisticated, user-interactive, adaptable, and simple-to-use simulation models that can accept changes smoothly and with minimal effort.
Mathematical models of airborne disease infection transmission in indoor environments are often based on the classic work of Wells 10 and Riley et al. 11 These models have been used to describe the spread of airborne pathogens such as tuberculosis, measles, influenza, H1N1, and recently SARS-CoV-2.12–16 Such models reflect a situation in which one or more infected individuals stay in the same room with other individuals who are susceptible to infection, and predict the probability of a susceptible individual becoming infected. However, these models rely on a few simple assumptions, for example, that virus particles are distributed uniformly in the environment; they also ignore the dynamics of movements between individuals, which has a significant impact on the probability of infection transmission.
Paper 17 improves the Wells-Riley model by introducing a distance proximity to quantify the impact of social distancing on the probability of infection. However, this method does not take into account the location of infected persons, nor does it consider the changing distance between the infected and susceptible persons in the room over time. This prevents the analysis of individuals’ dynamic behavior in the room, which has a direct impact on analyzing the effectiveness of in-door protective measures, for example, social distancing.
In another attempt to overcome the previous limitations, the authors in Guo et al. 16 calculate the spatial distribution of infection probability based on a single airflow calculation in a room, taking into account that the locations of infected individuals are statically distributed in the room with different position arrangements. However, this method is unsuitable for scenarios involving crowding in a small space; it also ignores the effect of the most common protective measures, such as the use of masks, which has a direct impact on the probability of infection transmission. The probability of infection is determined by the exposure of a susceptible individual to an infected individual, which is determined by the dynamics of individual movements and proximity to each other in a room.
The mathematical model developed by RAND Corp. 18 combines information from epidemiology, economics, and a qualitative regulatory analysis to assess the effects of various protective measures. However, it ignores the effect of room ventilation and the infected person’s speaking volume on the probability of infection transmission. Taking all these influencing factors into account when selecting model parameters remains a challenge for mathematical modeling. 19
Paper 20 presents a discrete-event mathematical model that explores how virus transmission occurs in indoor environments. The replication machinery of the SARS-CoV-2 based on Discrete EVent Specifications (DEVS) is described in Ayadi et al. 21 Such models require an additional effort to design a VE with a complex system of rooms and doors—using external tools, for example, Autodesk—and are thus limited to simulating small-scale scenarios. Agent-based simulations allow for considering control-sensitive parameters in order to estimate their effects on infections, in particular on reproduction number, transmission rate, and pandemic control after implementing certain protective measures. In Gomez et al., 22 a city-scale, agent-based approach simulates the transmission dynamics of SARS-CoV-2 with implemented social distancing to represent this measure’s effectiveness in mitigating the spread of the virus. However, no simulations have been conducted to determine how global interventions, environmental factors, and other relevant policies and measures influence the dynamics of the COVID-19 pandemic. Paper 23 reports the effectiveness of isolation, social distancing, and school closures with different levels of compliance, but it does not consider the effectiveness of wearing masks as a globally applied measure and the impact of an infected individual’s speaking volume on spreading virus particles in a room. New approaches are developed by governmental bodies to understand the virus behavior and its attack mechanisms, including the use of high-performance computing in CityCOVID by Argonne National Lab 24 and the proprietary framework by MITRE Corp. 25
We aim at improving the previous approaches as follows. We combine simulation of infection transmission behavior at the city scale and at the small indoor VE scale among individuals. Our approach allows the user to anticipate the effectiveness of various levels of compliance with globally applied protective measures such as social distancing, self-isolation, school closures, wearing masks, and controlling speaking volume. Last but not least, the user can interact with the VE and change the state of interactive elements, such as opening a door in a closed room to allow agents to exit outdoors or ventilating the room, both of which have a direct impact on the probability of at least one individual being infected.
3. Modeling infection transmission behavior and protective measures
We present our approach to modeling the disease spread as an extension of the Vadere simulation framework. 5 The original Vadere framework models walking behavior of people (agents) using various locomotion models that were calibrated and validated against empirical real-life observations.26,27 Dynamic agent behavior is simulated in a 2D plane by means of the topography visualizer for various locomotion models.
A topography in our simulation approach is a combination of the following five kinds of simulation elements:
Agents have circular shapes and move with particular acceleration or slow-down from a source to the target according to a particular locomotion model.
Obstacles can be drawn by the user as particular geometric shapes; the agents try to avoid them. Obstacles can also be walls of a VE structure, for example, a building.
Sources are areas in which agents exist individually or in a group. Instead of creating agents in a source area, the user can also position them at a particular place.
Targets are areas that agents may attempt to reach.
Target changers are areas where an agent’s target is changed if the agent passes through such an area.
Figure 1 shows how we extend the Vadere framework. The original Vadere has two layers (boxes with dashed borders and an orange background) that control the dynamic of agents’ movements: the locomotion model layer and the decision making layer. However, they do not provide agents with personal behaviors such as health status (e.g., susceptible, infected, or recovered in pandemics).
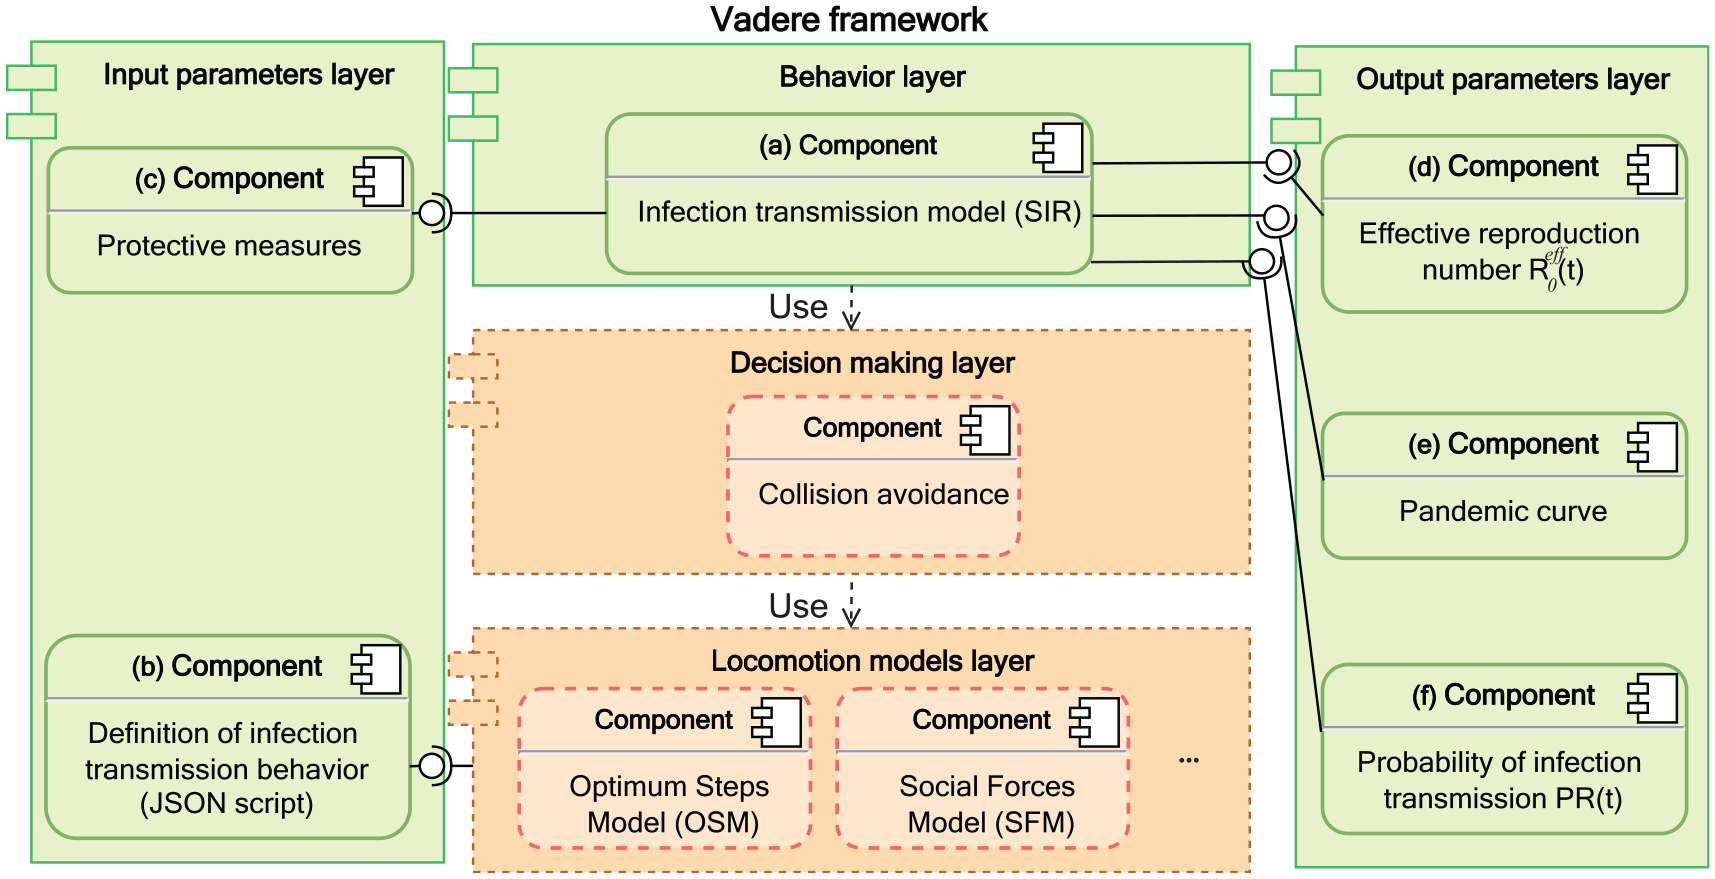
UML component diagram: our infection transmission model on top of the Vadere framework and its parameters.
In our approach, to simulate the disease spread, we introduce three new layers (boxes with solid borders and a green background): the behavior layer, the input parameters layer, and the output parameters layer. The behavior layer implements a general concept of agent behavior which models an individual’s behavior, for example, walking, stopping, or infection transmission behaviors. In the behavior layer, we model the infection transmission behavior on top of the locomotion models that control agents’ movement.
Each layer contains one or several components. Component (a) implements our infection transmission model that captures the continuous spread of a pandemic in a SIR form.
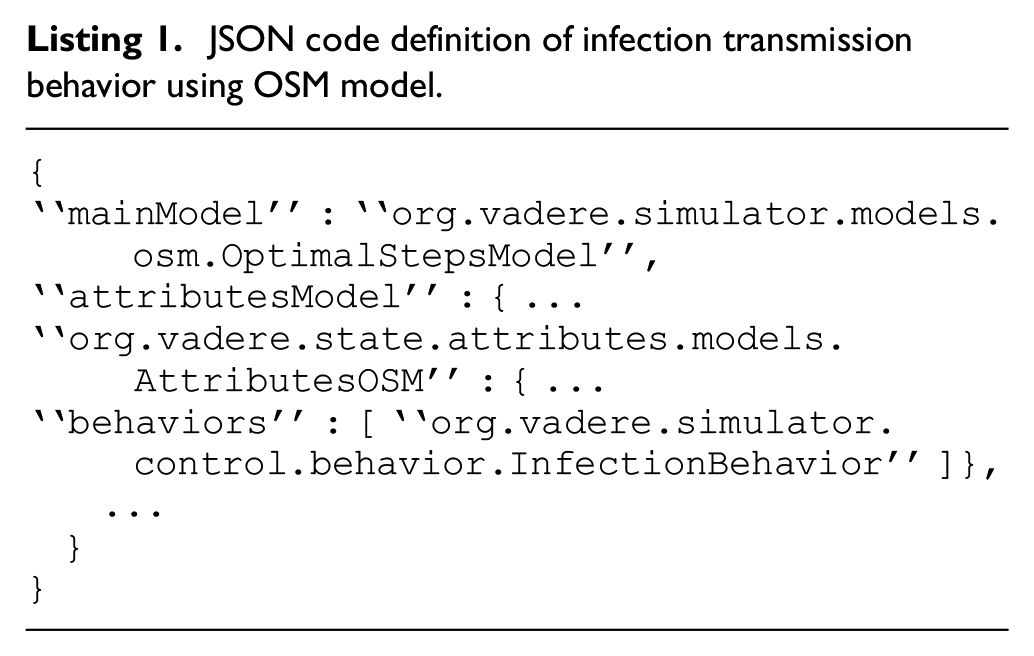
In the input parameters layer in Figure 1, component (b) provides the model definition in the JavaScript Object Notation (JSON) format 28 that allows the behavior to be compatible with the selected locomotion model, which in this paper is the Optimal Steps Model (OSM), 26 as shown in Listing 1.
JSON code definition of infection transmission behavior using OSM model.
Component (c) refers to the module of the protective measures that provides the input parameters to our infection model. In the output parameters layer in Figure 1, components (d), (e), and (f) refer to the classes that provide the simulation outputs, namely: the effective reproduction number
Table 1 represents the input parameters of our model; some of them are provided by the user while others (like
Input parameters of our infection transmission model.
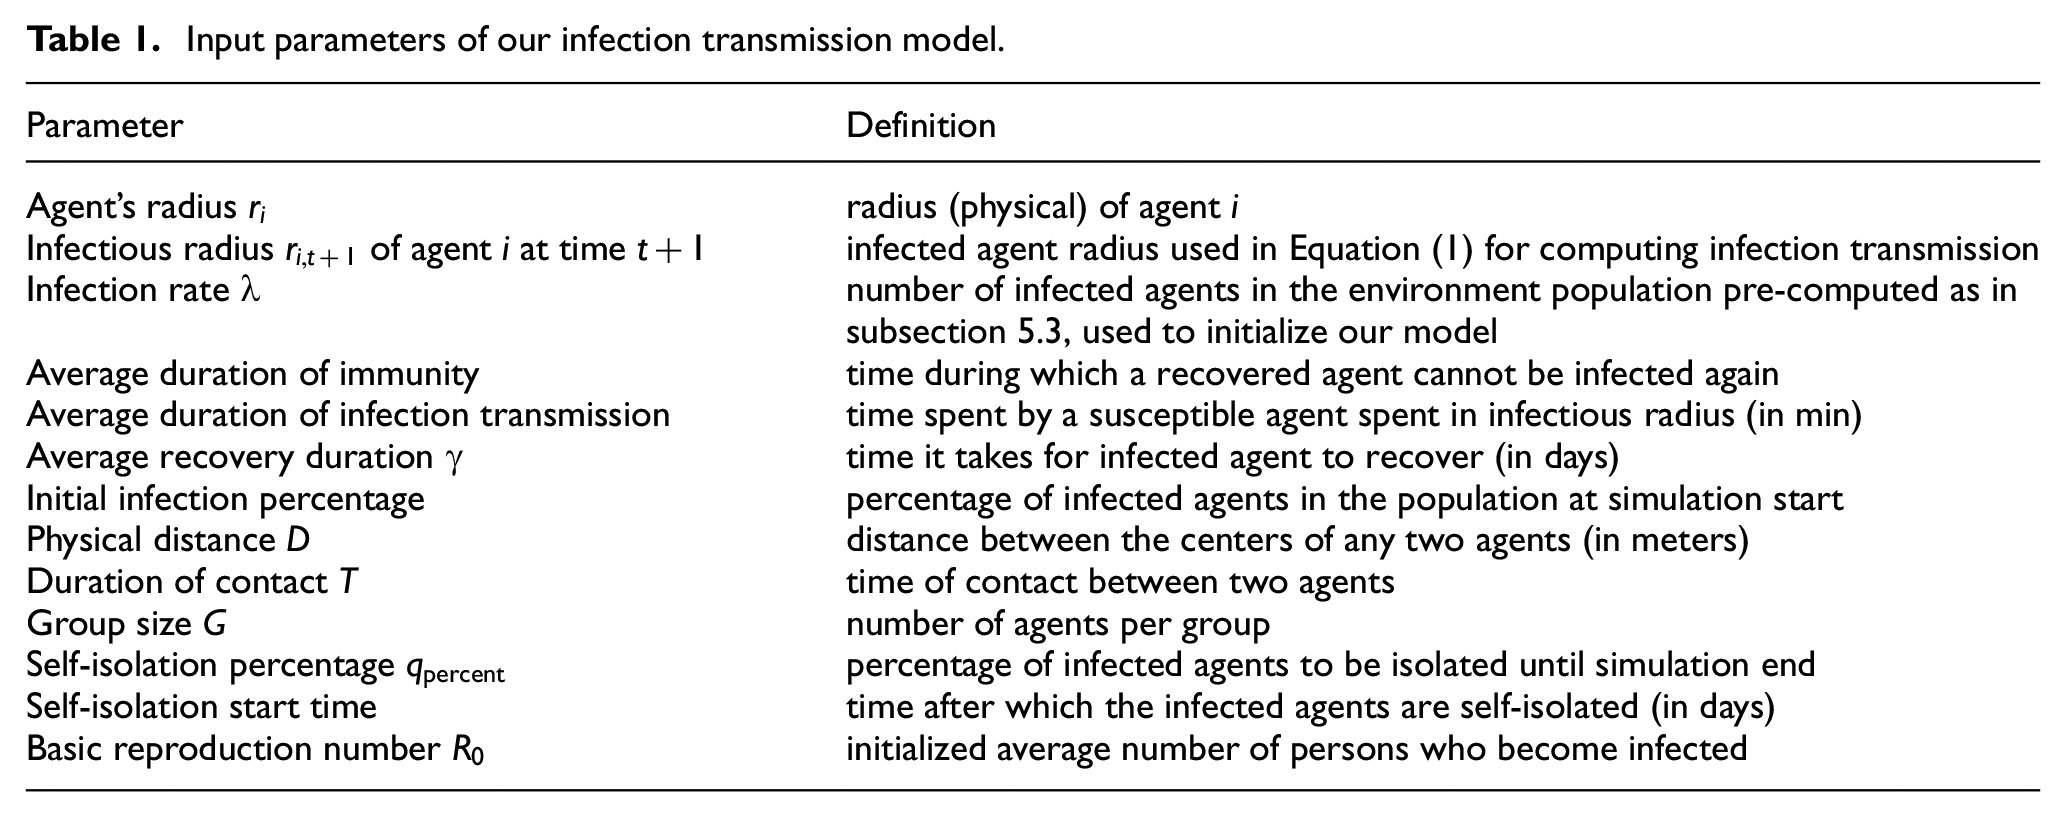
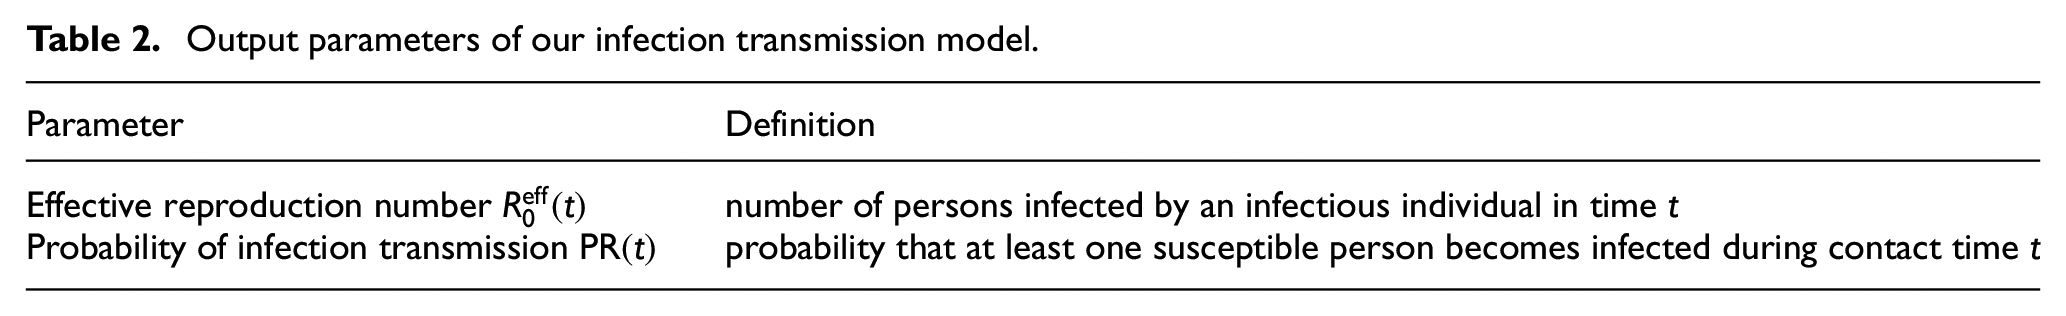
Table 2 represents the output parameters of our model; they are computed as the result of simulation.
Output parameters of our infection transmission model.
In the following, we describe our simulation that relies both on the OSM model and Vadere’s decision-making layer responsible for avoiding collisions of agents.
3.1. Modeling infection transmission
Figure 2 shows the state diagram of our infection transmission model: it is of the SIR type. At the first simulation step, the population is divided in two classes—susceptible and infected—based on the parameters (percentages) defined by the user. At next steps, susceptible agents may become infected if infection transmission conditions are met or they remain susceptible until the end of the simulation. Infected agents can recover and become immune after the average recovery duration. Recovered agents remain immune for the immunity duration (parameter in Table 1). Then their status is changed back to susceptible, and they can become infected again.
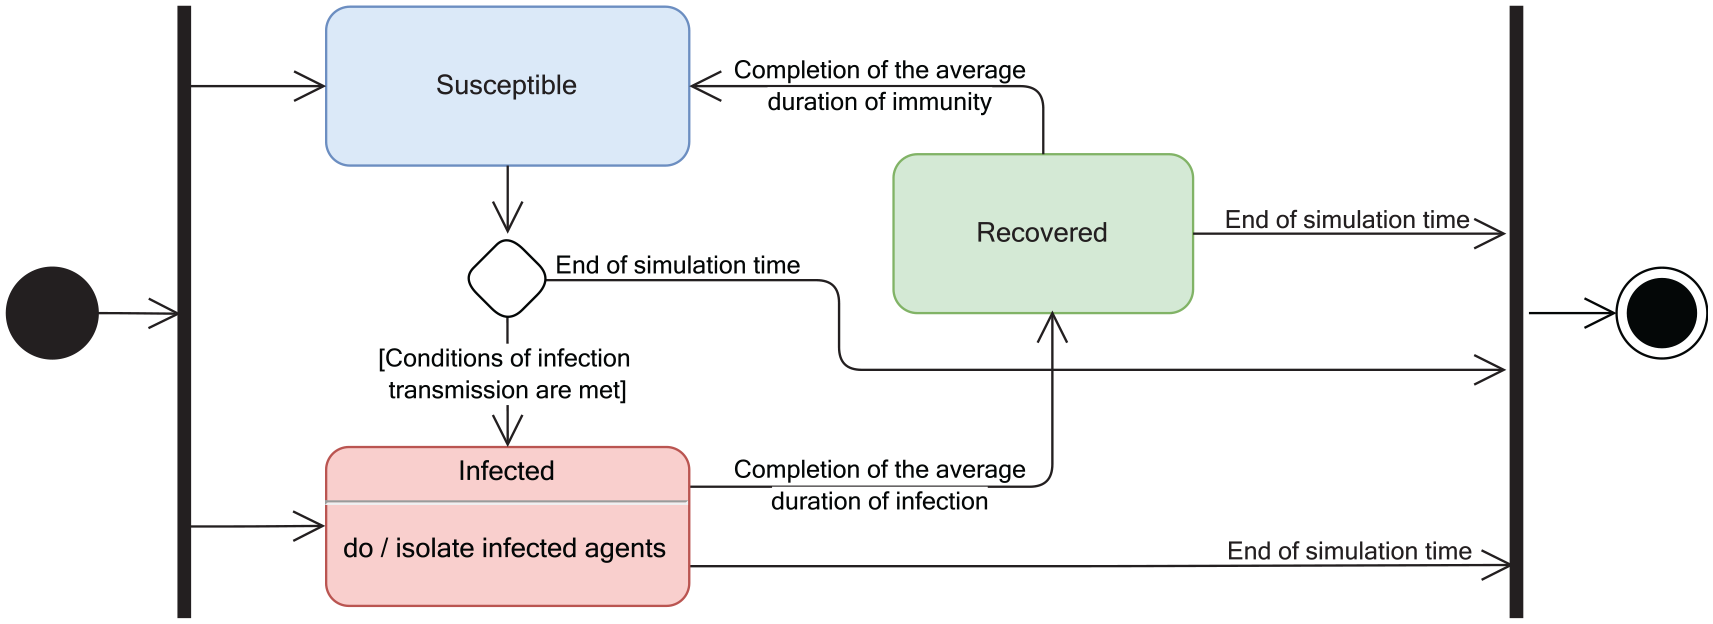
State diagram of our infection transmission model.
In our approach, in each time step
Whenever a susceptible agent (S) has contact with an infected agent (I) for an average duration of time
The infectious radius

where
Additionally, the status of an infected agent (I) can be changed to recovered (R) after this agent either (a) spends the average duration of recovery time
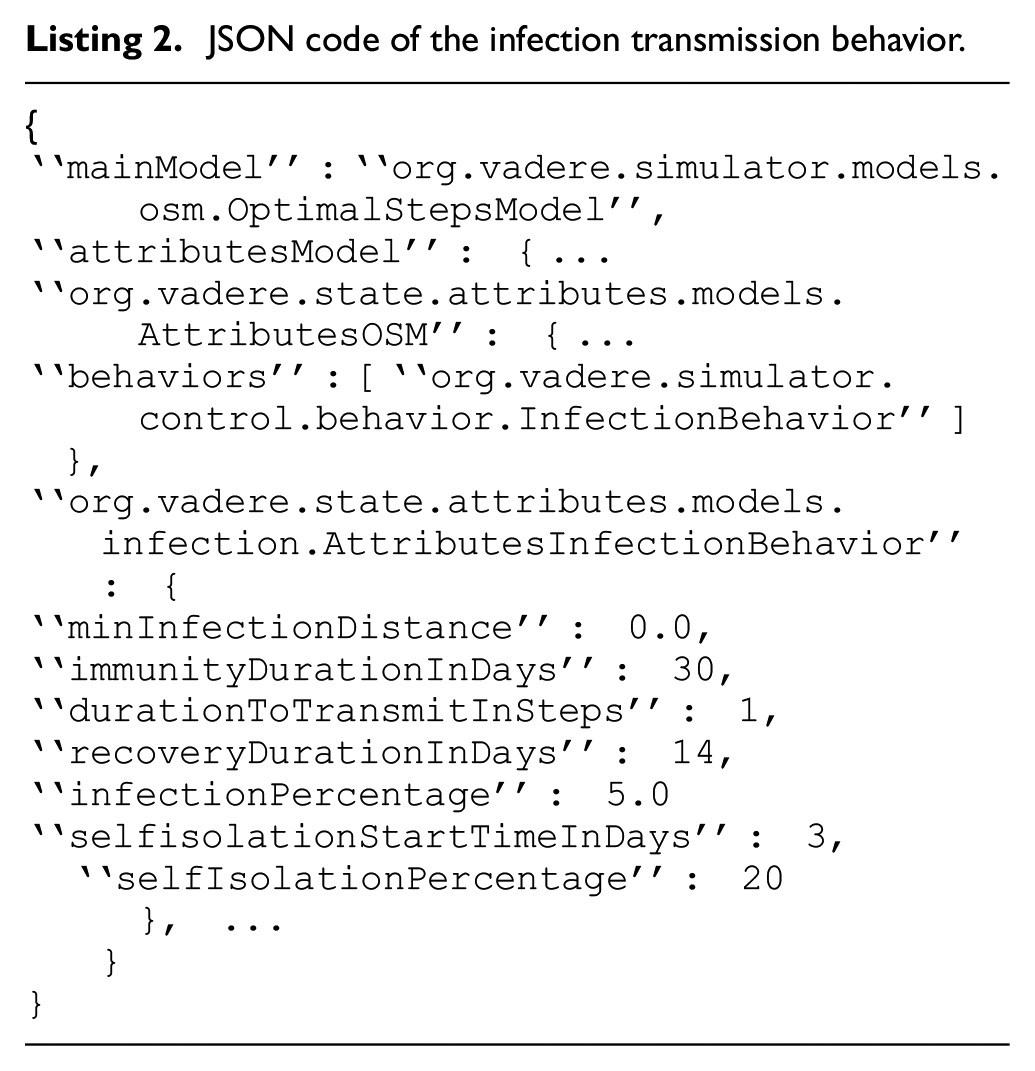
Listing 2 shows the definition of infection transmission behavior and its attributes expressed in the JSON format.
JSON code of the infection transmission behavior.
3.2. Modeling protective measures
In the following, we explain how we model three kinds of protective measures: social distancing, self-isolation, and wearing a mask of particular type. In addition, we model controlling individual’s speaking volume that can be effective to limit the virus spreading, and room ventilation.
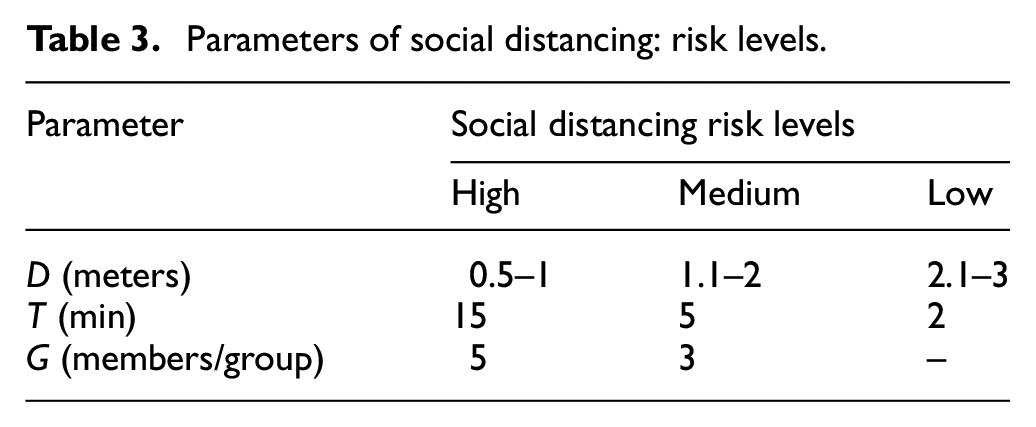
1) Social distancing: We consider three kinds of risk scenarios regarding social distancing: high-, medium-, and low-risk scenarios. The relevant parameters that determine social distancing (defined in Table 1) are described with values in Table 3 as follows:
• Physical distance
• Duration of contact
• Grouping
2) Self-isolation: It is a widely used protective measure—persons exposed to COVID-19 isolate themselves for some time in order to find out if they have become infectious. 30 Isolated agents in our model do not spread infection as they are modeled as having no infectious radius during isolation.
Parameters of social distancing: risk levels.
We define the self-isolation rate of infected agents as a user-defined percentage
3) Wearing face masks
In our model, we set three options for wearing masks with empirically estimated corresponding protection values. First, agents can wear FFP2 masks with a protection percentage of at least 94% 31 ; we denote this by the protection value 3. Second, agents may choose to wear surgical masks with a protection percentage of at least 74%, 32 which is denoted by the protection value 2. Finally, agents may choose not to wear masks; in this case the protection percentage is 0%, and this is denoted by the protection value 1.
4) Controlling one’s speaking volume
5) Room ventilation: We model the ability to ventilate a room by allowing the user to open/close the room’s door interactively during simulation time—we discuss this in detail in the next section.
Figure 3 shows an UML class diagram of our infection transmission model, where a particular
• A particular locomotion model (in our simulations we use OSM as the main model). The MainModel class has a list of sub-models (e.g.,
• A list of behaviors (e.g., Infection behavior). We implement class
• A
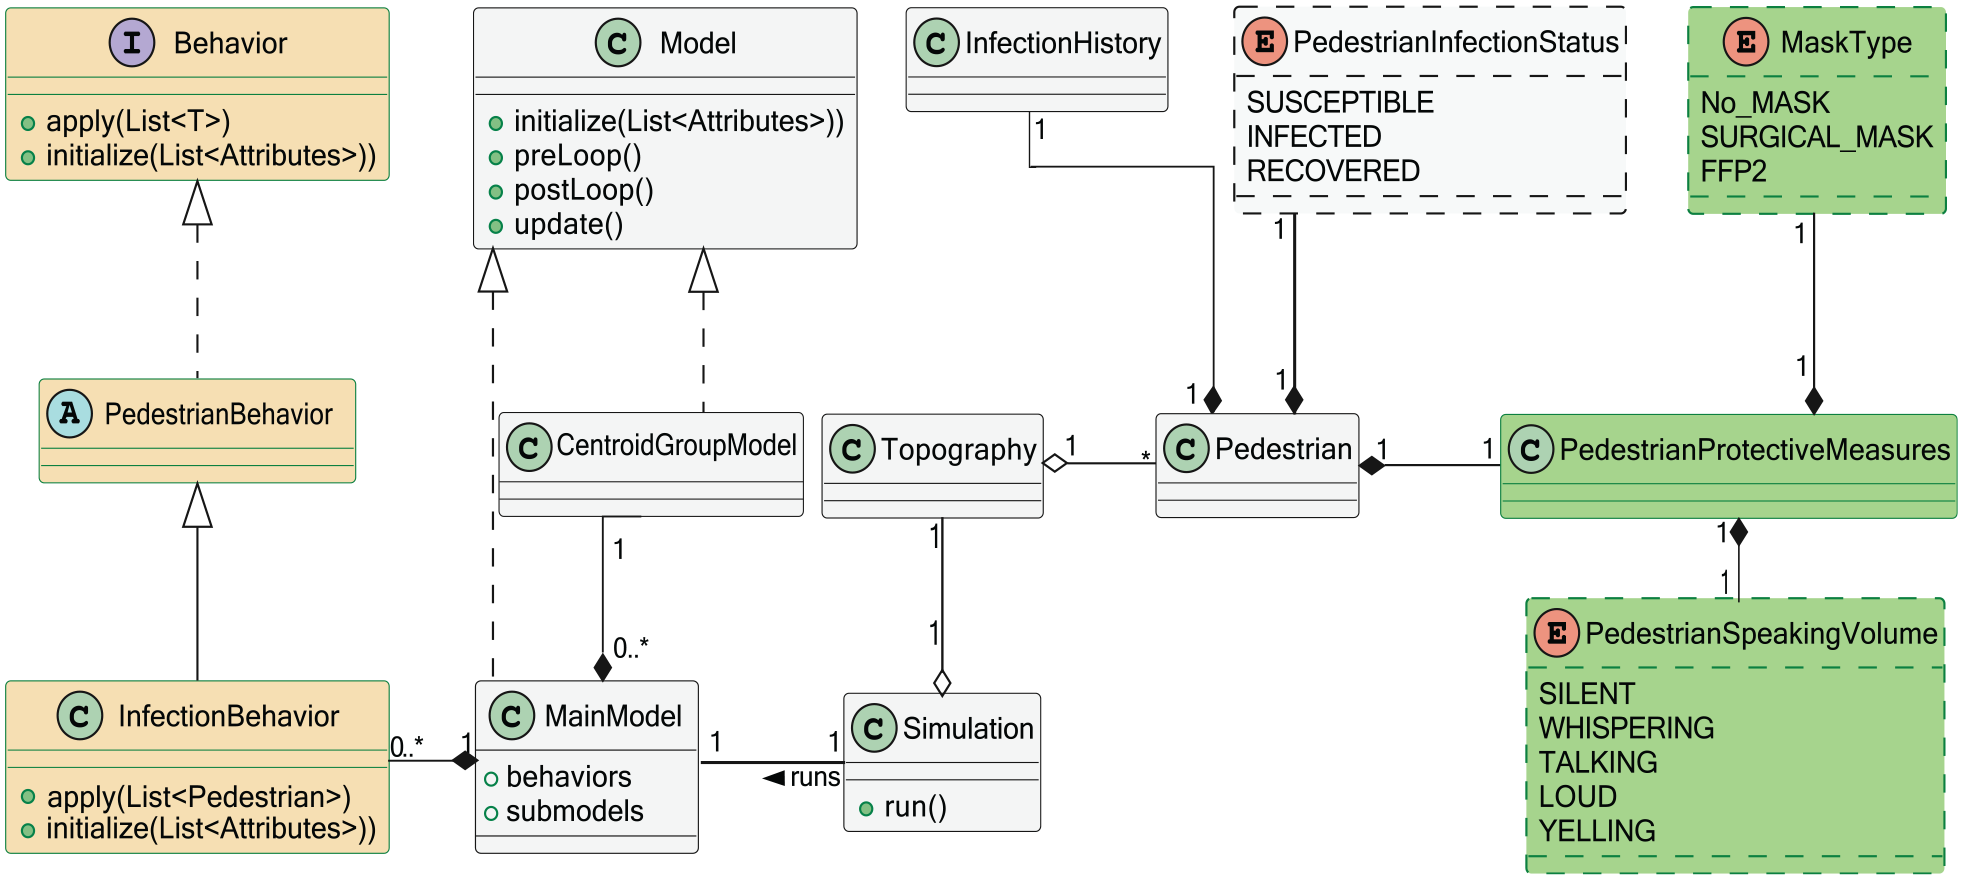
Infection transmission model: UML class diagram.
4. Interactivity of simulation
We aim at substantially enhancing the level of interactivity in the simulation process of infection transmission. Our interactive simulation approach offers the following advantages: (a) the user can actively modify the parameter values and characteristics of the VE (e.g., buildings and rooms) during the simulation; and (b) the user can examine the outcomes of the experiments in real time, and can interactively re-formulate and re-simulate scenarios of interest. This enables the user to interact with the simulation environment in real time in order to explore alternative strategies in the simulation process.
4.1. Modeling interactive door elements
In our simulation system built as an extended version of the Vadere framework, we design a new interactive door element: the user can change the state of a door from closed to open and vice versa during the simulation run time by a mouse double-click, thus affecting the behavior of agents.
Opening and closing a door allows air to flow between the rooms separated by that door.3,34,35 According to experts’ opinion, opening and closing a door for a few minutes every hour provides a minimal level of room ventilation. In our model, this ventilation reduces the infection radius of the infected individual by a ventilation factor. The ventilation factor’s value is inversely proportional to the ventilation duration and ranges from 0.1 to 1. For example, if the infection radius is
In addition to ventilation, opening a closed door allows the agents to exit to a specific target outside. This reduces the current occupancy of a room, and, as a result, this also reduces the probability of an agent becoming infected.
Figure 4(a) shows an example of a simple topography consisting of two rooms separated by a wall with two interactive doors. Agents are created at sources S1 and S2 in the left room and they move to the target T in the right room through doors D1 and D2. Agents navigate to the target through the nearest open door. For example, agents created in S1 pass through D1 to the target, because D1 is closer to them than D2.
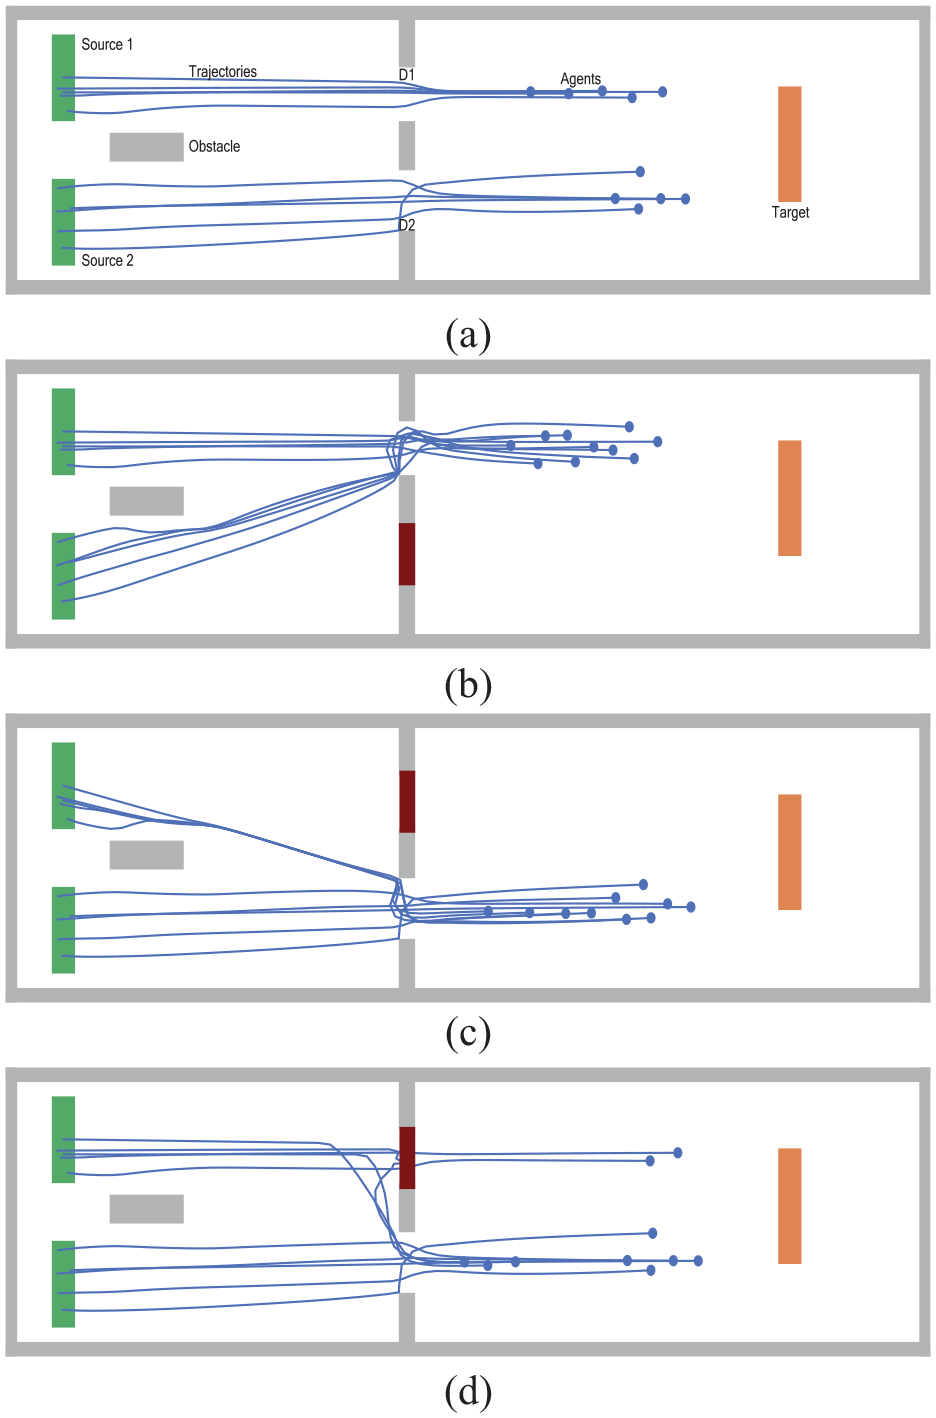
Opening and closing interactive doors by the user: (a) the two doors D1 and D2 are open, (b) D1 is open, and D2 is closed, (c) D1 is closed, and D2 is open, and (d) D1 is closed after two agents have passed through it; D2 is open.
The figure illustrates different combinations of the doors’ states and their effect on agents’ trajectories:
• Figure 4(a): D1 and D2 are open.
• Figure 4(b): D1 is open, while D2 is closed interactively.
• Figure 4(c): D2 is open, while D1 is closed interactively.
• Figure 4(d): D2 is open, while D1 is closed interactively as in Figure 4(c); the difference to the previous scenario is that D1 is closed after two agents have already passed through it, so the other agents have to change their paths to the nearest open door.
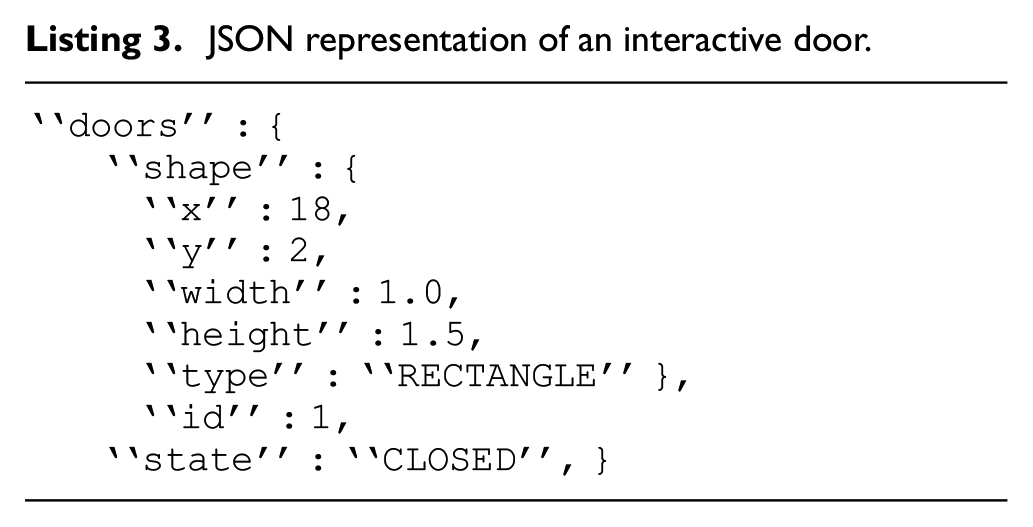
The whole topography configuration is specified using the standard open format JSON. Listing 3 illustrates how doors are specified as JSON code, with the following attributes: position (x, y), geometrical dimensions (width, height), geometrical shape (type), identification number (id), and current state (state).
JSON representation of an interactive door.
4.2. Interactive change of agent’s state
In our simulation system, we add a new capability that allows the user to change the state of any selected agent from moving to non-moving by clicking the mouse. This allows the user to simulate agents in both situations, stopping and moving, like in real life.
Figure 5 shows an example with agent 3 who is stopped by the user during the simulation (by a mouse click); after that, because the stopped agent is located in the paths of agents 1 and 2, these agents try to avoid agent 3 as an obstacle. The black arrows represent the deviation of agent 1 and 2’s trajectories. We also add a new feature that allows the user, by a mouse double-click on a selected agent, to change that agent’s status from susceptible to infected and vice versa. Thus, the user can dynamically redistribute the infected agents to the desired locations.
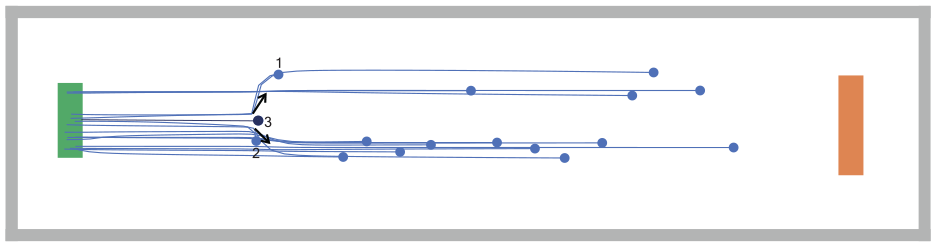
Agent 3 is stopped interactively by the user.
Figure 6 shows another example: two agents for whom the user changes their status from susceptible to infected by mouse-click, while the other three agents remain susceptible.
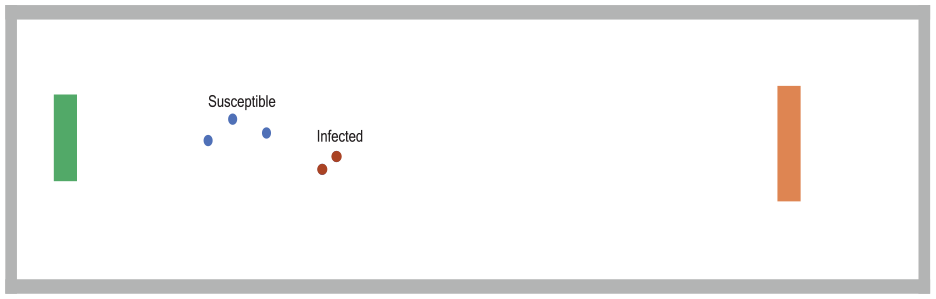
The user changes the status of two agents to infected.
Figure 7 shows the UML interaction diagram that represents user interactions with the VE.
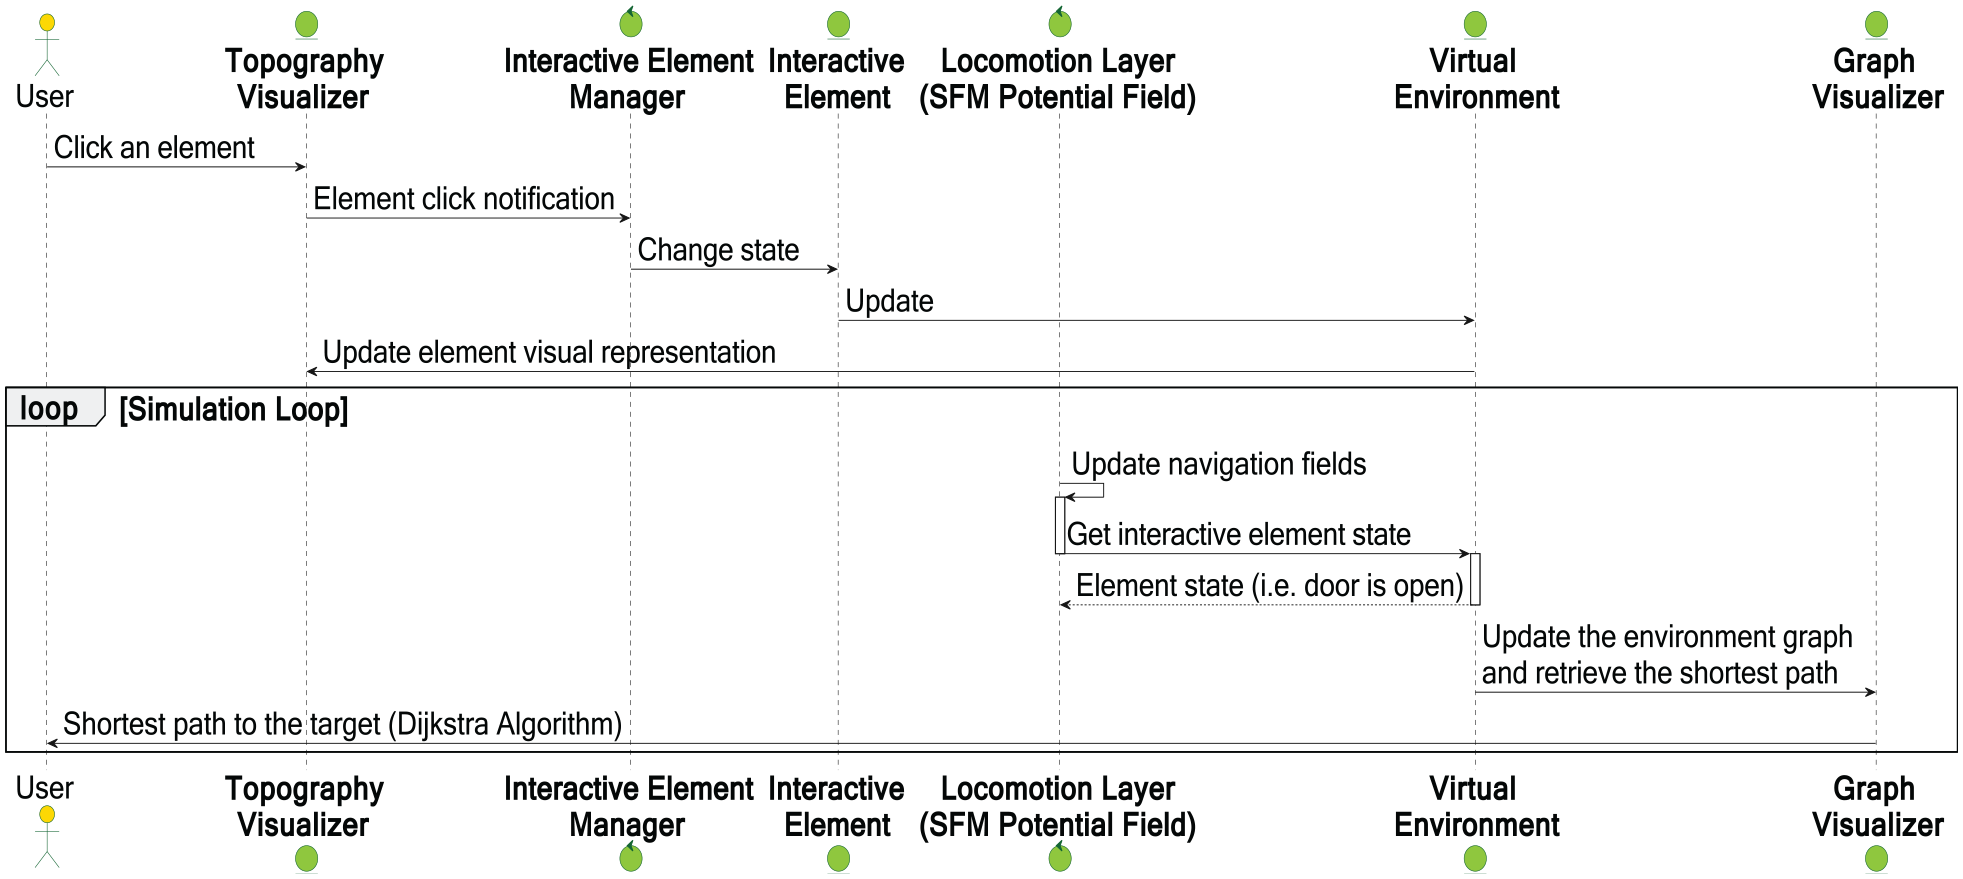
UML sequence diagram representing user’s interactions with the simulation environment.
The user can interrupt an element (e.g., a door) in the topography visualizer to change the state of that element. Our new interactive element manager module periodically checks whether the element is interactive (i.e., its state may or may not be changed). If it is interactive, the update notification is sent to the element in the VE.
While the locomotion OSM regularly updates all agents’ next step positions, agents have to know the current state of doors, the locations of other agents (both moving and standing), and obstacles. For that, OSM must check the state of the interactive elements in the VE in order to avoid possible collisions. After the user has changed the environment interactively, we can estimate the probability of infection transmission, as illustrated by the experiments in the next section.
5. Experimental evaluation
We evaluate our simulation approach using the following two kinds of scenarios:
• Large-scale scenarios: study the spread of COVID-19 among
• Small-scale scenarios: estimate the probability of infection transmission among at most 50 people in the common kinds of indoor environments. For each scenario, we aim at obtaining the probability that at least one individual will be infected.
Our simulations based on the model and implementation described above are performed on a computer with a CPU Ryzen Threadripper 2970 WX, 24 cores/48 threads, and 128 GB of memory. On this computer, it takes approximately 4 h to simulate the large-scale spread of the COVID-19 pandemic for 30 days using the time step of 2 min. We run small-scale scenarios on the same computer as large-scale scenarios. It takes about an hour to simulate a small-scale scenario of 4 h duration.
5.1. Time steps of simulation
To simulate large- and small-scale scenarios with different time resolution levels, we change the values of the simulation step, simulation time, and the ratio of real-time to simulation-time parameters in our simulation system. We define the virtual time in our simulations at two resolution levels:
In the 40 large-scale scenarios, the assumed duration of one time step is 2 min, which is the minimum duration of contact in low-risk scenarios as specified in Table 3.
In the 60 small-scale scenarios, we decrease the duration of the time step to one second. One minute of loud speaking without wearing a mask can generate thousands of oral droplets per second, which can remain airborne for more than 8 min. 36 As a result, these droplets are more likely to be inhaled by individuals, resulting in new infections. In order to precisely monitor the changes in the probability of infection transmission along simulation time, we define the duration of one time step as 1 s.
5.2. Simulation scenarios
We create our simulation scenarios as follows:
1) Large-scale scenarios of COVID-19 are built for the city of Münster in Germany. For setting parameter values and for the model validation, we use the reported data provided by the European Green Capitals 37 and the official city website. 38
Figure 8 shows the geographic map of the city of Münster in the topography creator of our simulation system. . The figure also shows the plans of two particular buildings in the city: (a) the “castle” which is the administrative building of the University of Münster, and (b) the St. Paulus cathedral.
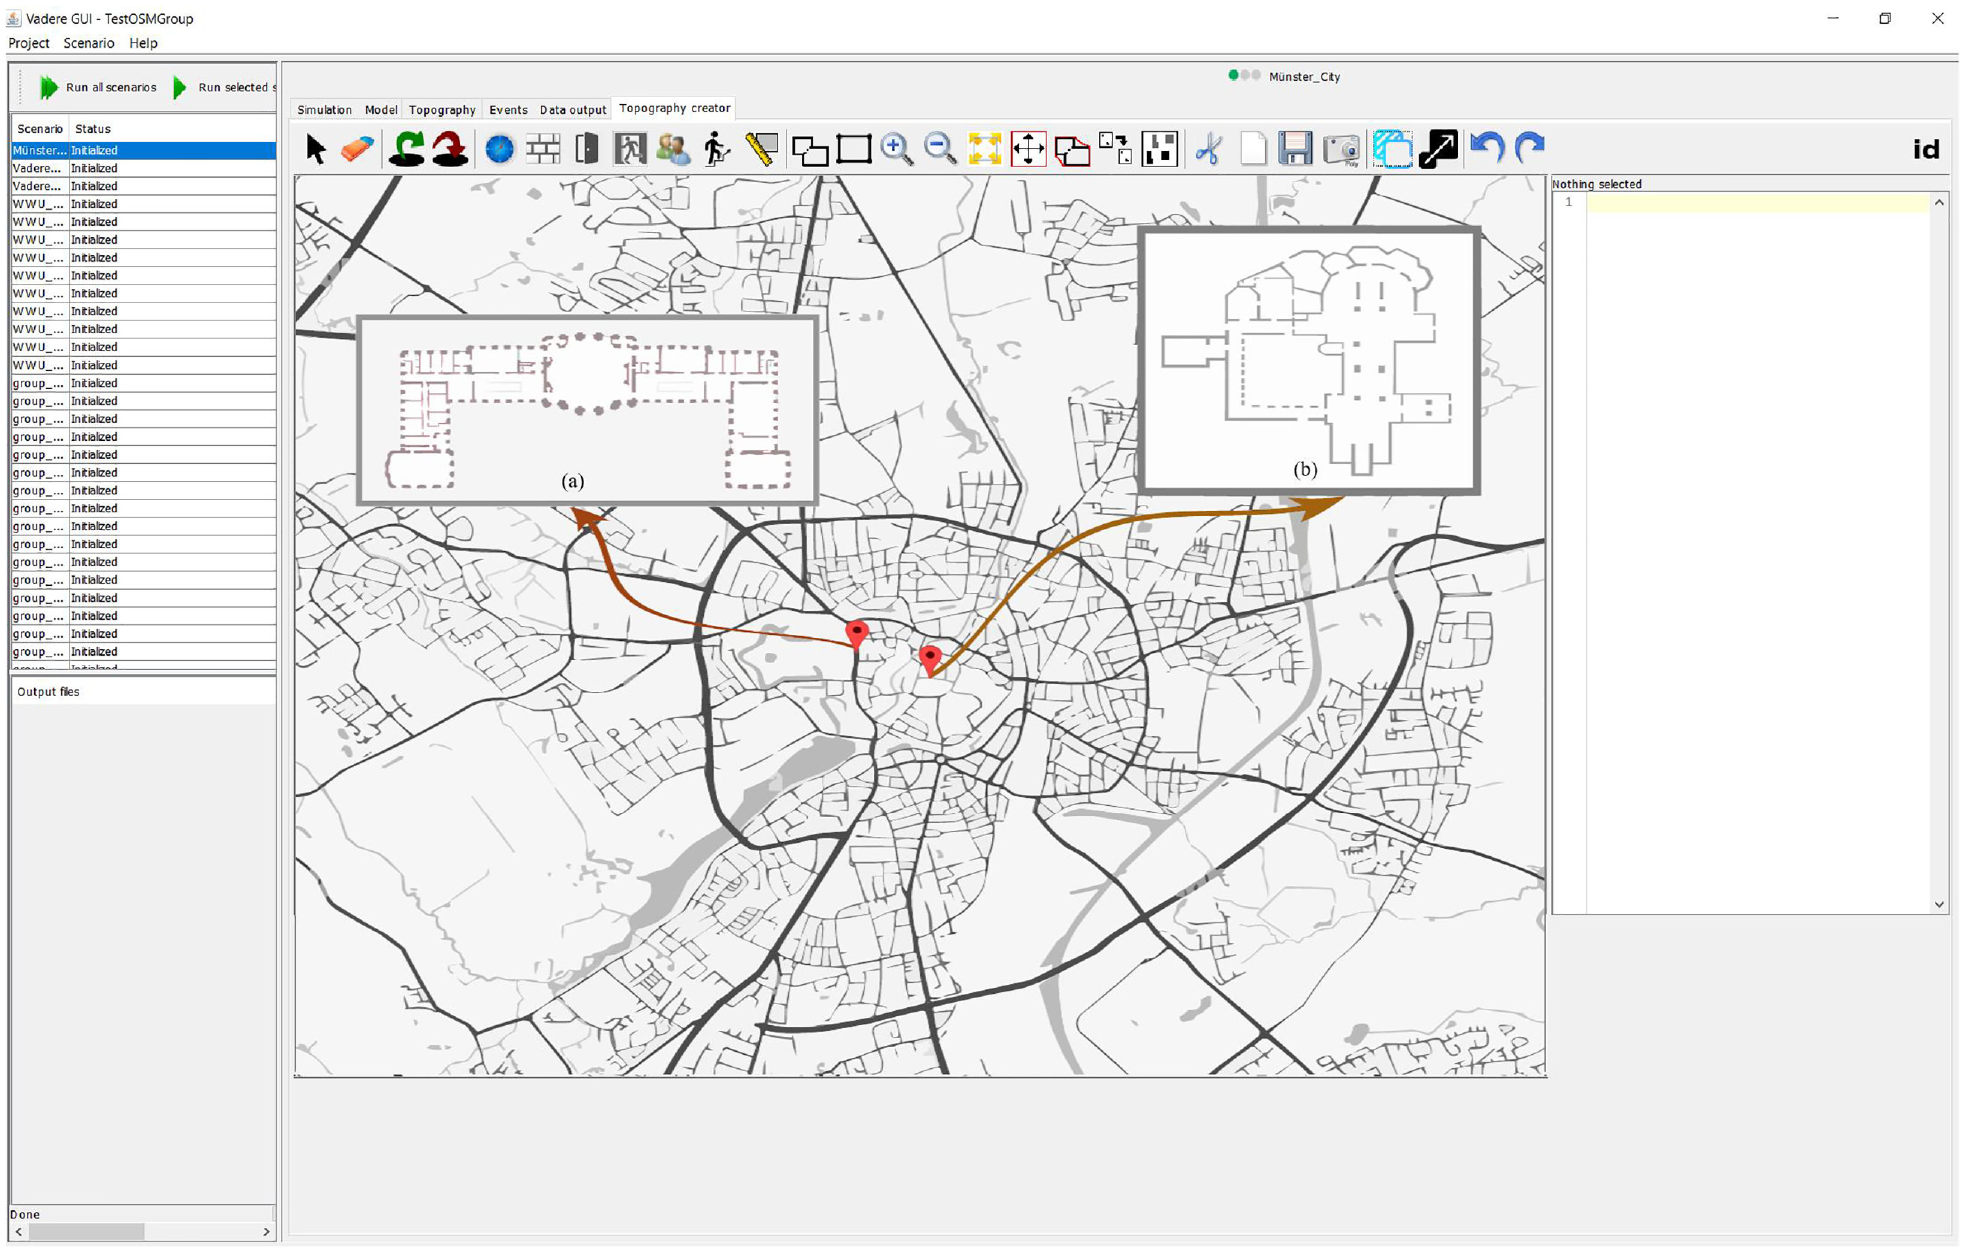
Geographic map of the city of Münster, with two particular buildings (a) and (b).
We simulate the real-life scenario: the city inhabitants perform a wide variety of daily activities while walking or sitting in different indoor environments. Daily activities include attending classroom lessons, working, shopping, or remaining isolated in homes or hospitals after they have become infected.
While moving from their source areas to their destination areas, agents may pass through target changer elements which redirect them to other intermediate targets inside the simulated VE. This ensures that agents are moving for the specified amount of time per day, after which the target changer elements redirect them to their final destinations (exit doors).
In this paper, we focus on agent behavior in indoor environments, rather than on large-scale movements as usually considered in frameworks based on GIS (Geographic Information Systems). In particular, we do not include trip patterns for agents in our scenarios, such as moving from one environment to another environment via transportation or other methods of travel (e.g., buses, cars, and trains).
Our simulation should evaluate if and how particular VEs prevent or facilitate the transmission of virus. We simulate the behavior of the whole
According to our model described above, we distinguish three classes in the city population: susceptible, infected, and removed, which change with time. Susceptible agents may become infected; removed agents either have recovered, are isolated, or died because of the virus.
2) Small-scale scenarios are studied in common indoor VEs: we estimate the probability of infection transmission from an infected individual to susceptible individuals in the most common VEs. This probability is affected by individuals’ movements in the VE, their activities with each other, and room ventilation.
Figure 9(a)–(d) show the layout of four typical example VEs with customized activities and duration of contacts, as follows:
• Figure 9(a): an office VE, with three employees working at desks for 4 h and two individuals moving.
• Figure 9(b): a classroom VE, with 12 students at their desks, interacting with a teacher in an 1-h lesson.
• Figure 9(c): a restaurant VE in which every family sits at a separate dinner table. In our experiments, the number of members of the family is assumed to vary from two to five; they stay for approximately 1–2 h for dinner.
• Figure 9(d): a concert hall VE, with 44 people attending a concert with three additional individuals as performers. The duration of the concert is 2 h.
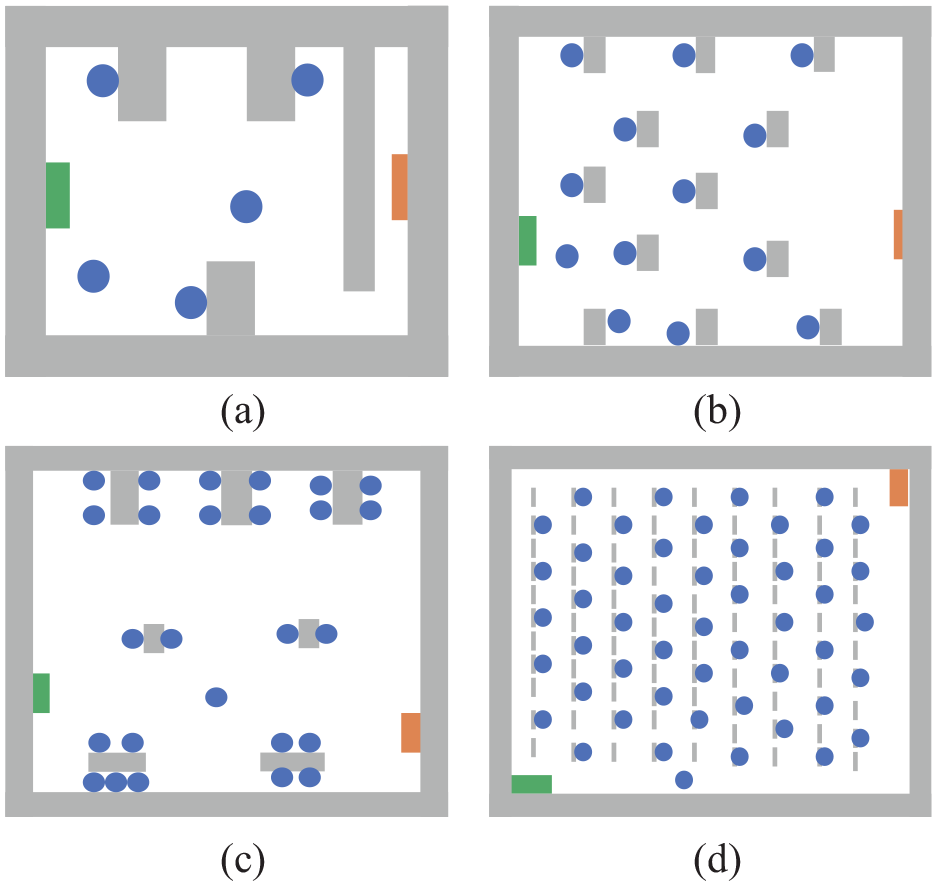
Examples: four kinds of simulation environments: (a) office, (b) classroom, (c) restaurant, and (d) hall.
Figure 10 shows an example of how our newly implemented options in the extended Vadere framework (choosing the type of mask and adjusting the volume of the speaker) are used for creating and simulating a particular scenario: an office with five employees who work silently and wear FFP2 masks.
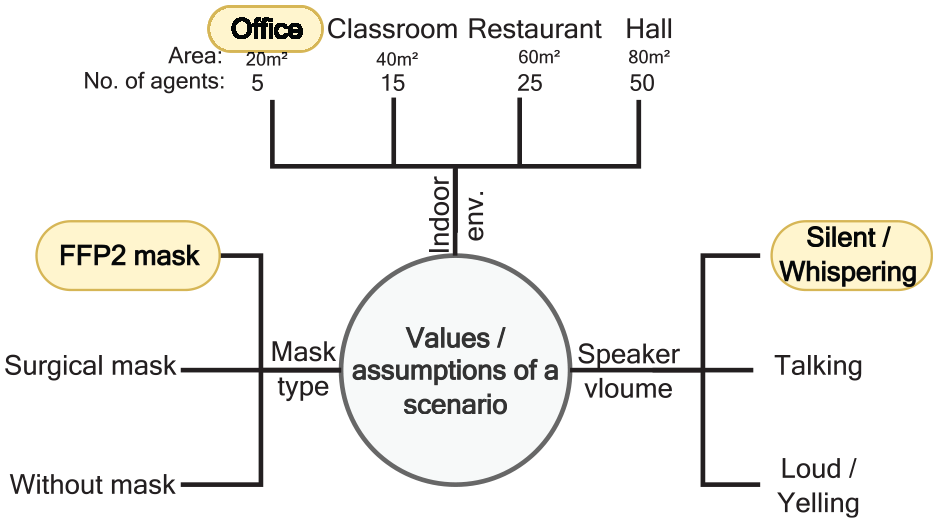
Example: parameters for a simulation scenario.
To study infection transmission in a broad variety of common environments, we run 60 different scenarios with various intervention options. In these scenarios, we study different situations with VE ventilation, which is performed by opening/closing doors regularly and with agents’ speaking volumes ranging from silence to yelling. We report the results of these experiments in Section 5.4.2.
5.3. Simulation parameters
As important examples of simulation parameters, we discuss here the infection rate
1) Infection rate
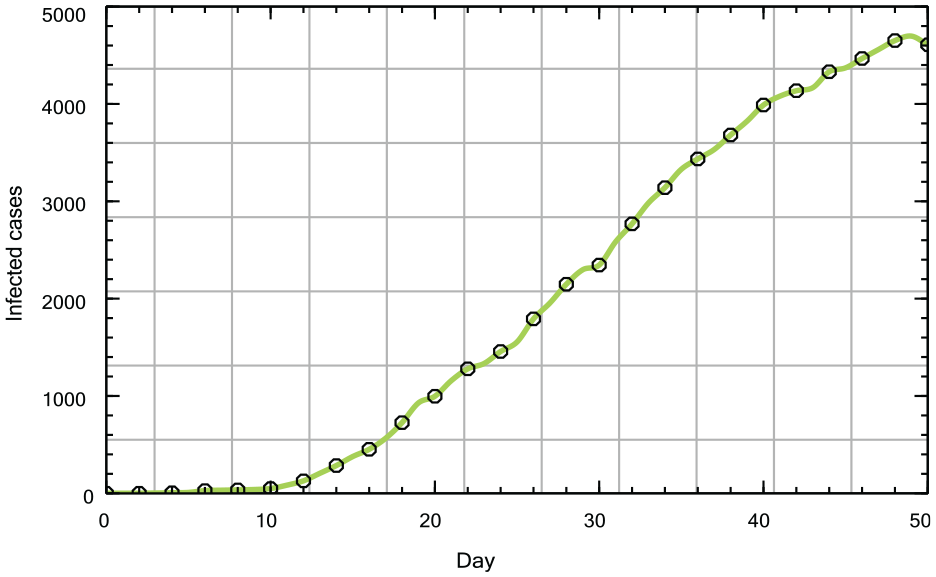
Daily infection numbers in Münster, March 1 to April 19, 2020.
We utilize the logarithmic scale for expressing the rate of growth for non-linear functions, with the infection rate
Figure 12 depicts our estimate of the infection rate

where the coefficient of
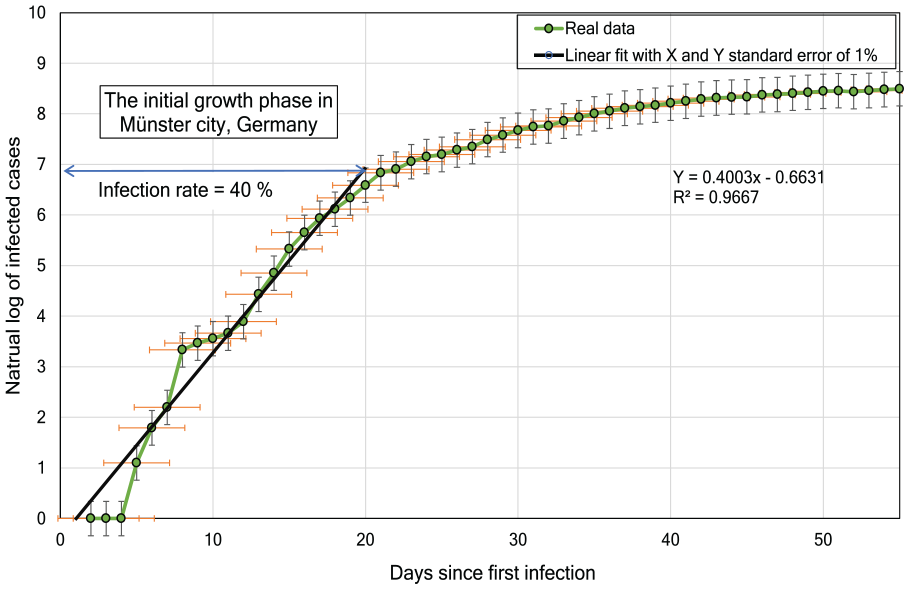
Natural logarithmic curve fitting to estimate the infection rate for Münster, Germany.
We estimate the accuracy of fitting by using the determination coefficient
2) Basic reproduction number
We initialize the value of the basic reproduction number

where
In order to estimate the value of
3)
Effective reproductive number

where
4)
The average duration of infection transmission
5) Probability of infection transmission PR(t): this probability depends on the type of contact activity among people. We set three categories of parameters to describe the various kinds of activities among people as follows:
Individual parameters, such as the volume of speech and the type of mask that each person wears.
Environmental parameters, such as the area where the individuals reside.
Inter-relational parameters, such as social distance and the duration of contact time between individuals.
This classification helps to assess the risk of contact. For example, COVID-19 is a disease with high contact-contagiousness: even a single exposure to a coughing individual who is infected with COVID-19 in an office without wearing a mask for a time of 30 min usually leads to infecting susceptible individuals.
We calculate the risk of infection transmission to a susceptible agent within the infection radius as follows:

where
Summarizing, we compute the probability PR(t) of a susceptible individual becoming infected through an infected individual in a room as follows:

where
5.4. Simulation results
In the following, we report our simulation results for the large-scale and small-scale scenarios.
5.4.1. Large-scale: COVID-19 scenarios in the city of Münster
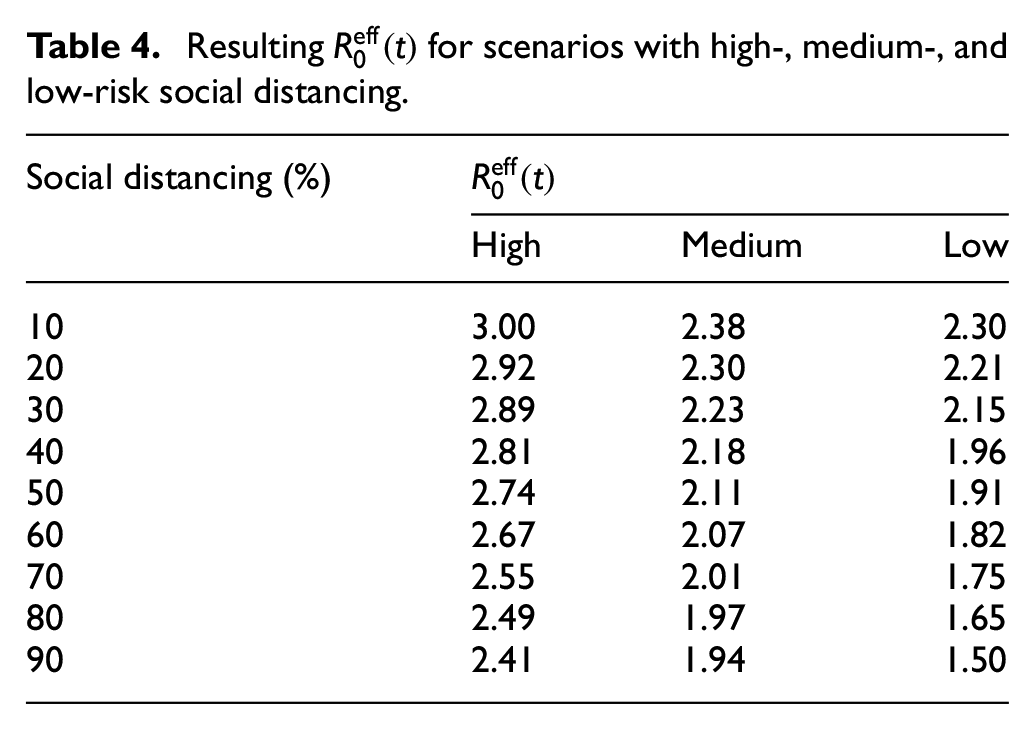
Our experiments simulate the spread of virus in 40 large-scale scenarios, from the worst to the best, based on how well the protective measures are followed by the population. In the worst scenario, we assume that 90% of people do not accept social distancing, infected cases are not isolated, and schools are not closed. In the best scenario, 90% of people follow social distancing, 90% of infected persons are isolated, and schools are closed. At the end of each scenario (150 days after the first case of infection), we evaluate the effective reproduction number that indicates the pandemic spread. Those scenarios that lead to
Table 4 shows the resulting
Resulting
In order to provide pandemic curves for our simulation scenarios during simulation run time, we customize the XChart plotting library. 46 Because the curve reflects the infection status at the time of simulation run, it is continuously in progress: every simulation step contributes to the curve, and at the end of the simulation we have a complete curve. The x-axis represents time, while the y-axis represents the cumulative number of infections.
Figure 13 presents the results of simulating the high-risk scenarios regarding social distancing for the city of Münster. The scenarios represent different percentages of the population following the social distancing guidelines (from 10% to 90%). In the high-risk social distancing scenario, the physical distance between people ranges from
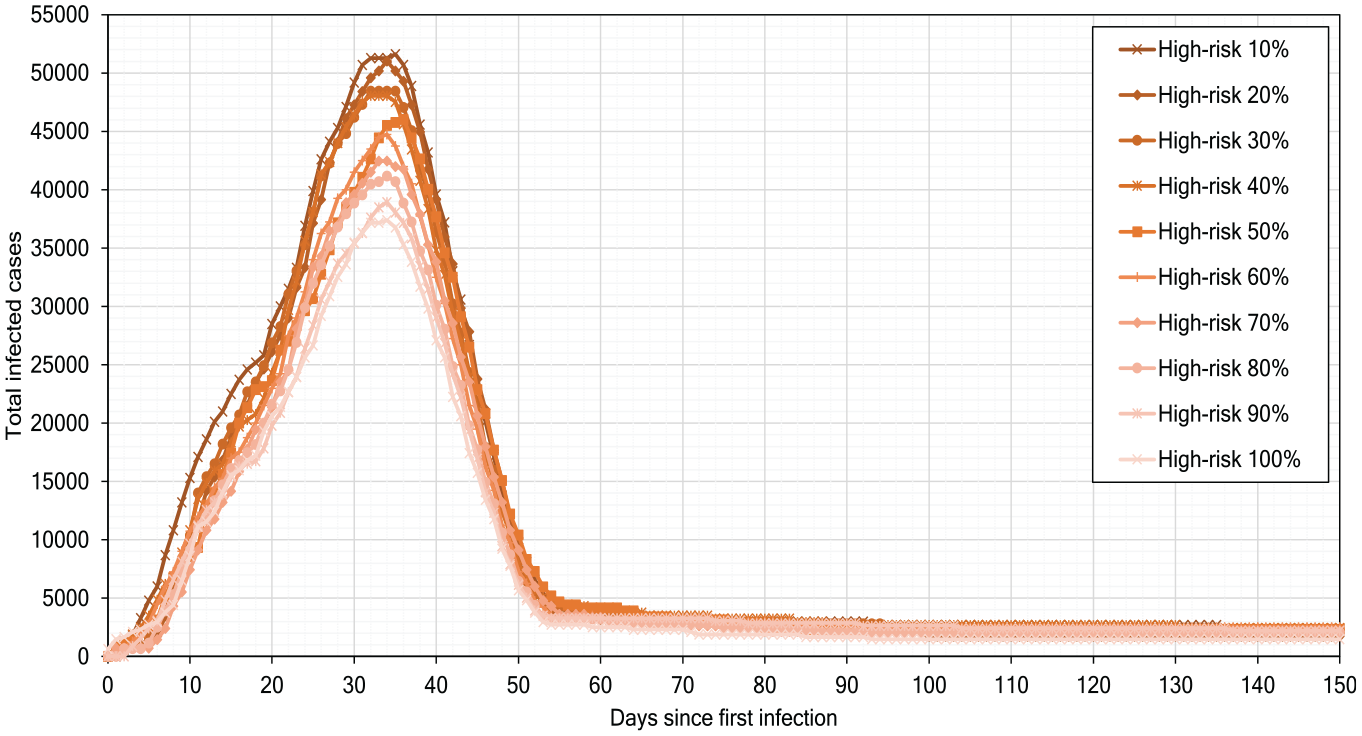
High-risk scenarios of pandemic development.
Figure 14 shows our experimental results for the scenario of medium-risk distancing; the distance between individuals is between
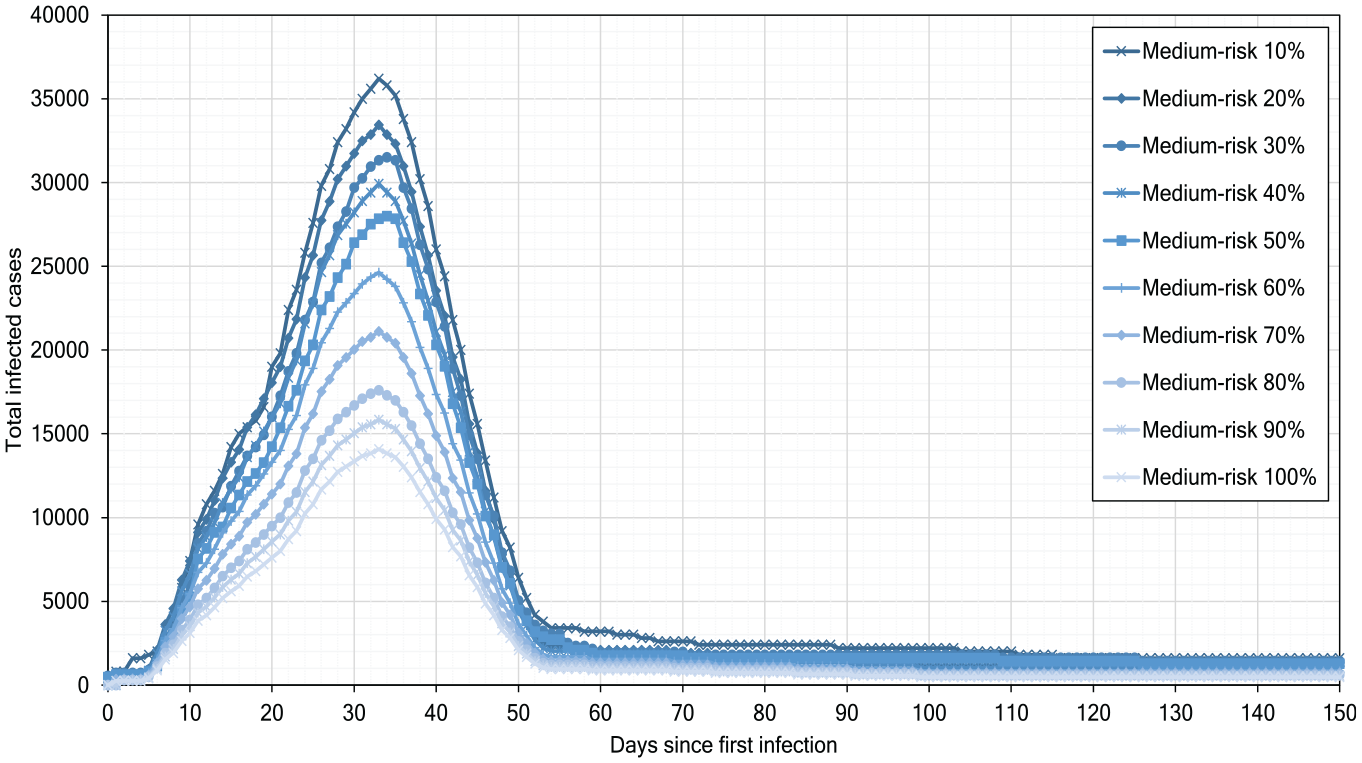
Medium-risk scenarios of pandemic development.
Figure 15 depicts the outcomes of the low-risk scenarios, if the percentage of people following guidelines increases from 10% to 90%. We observe that if 90% of people participate in the measures for low risk then the infections number decreases to
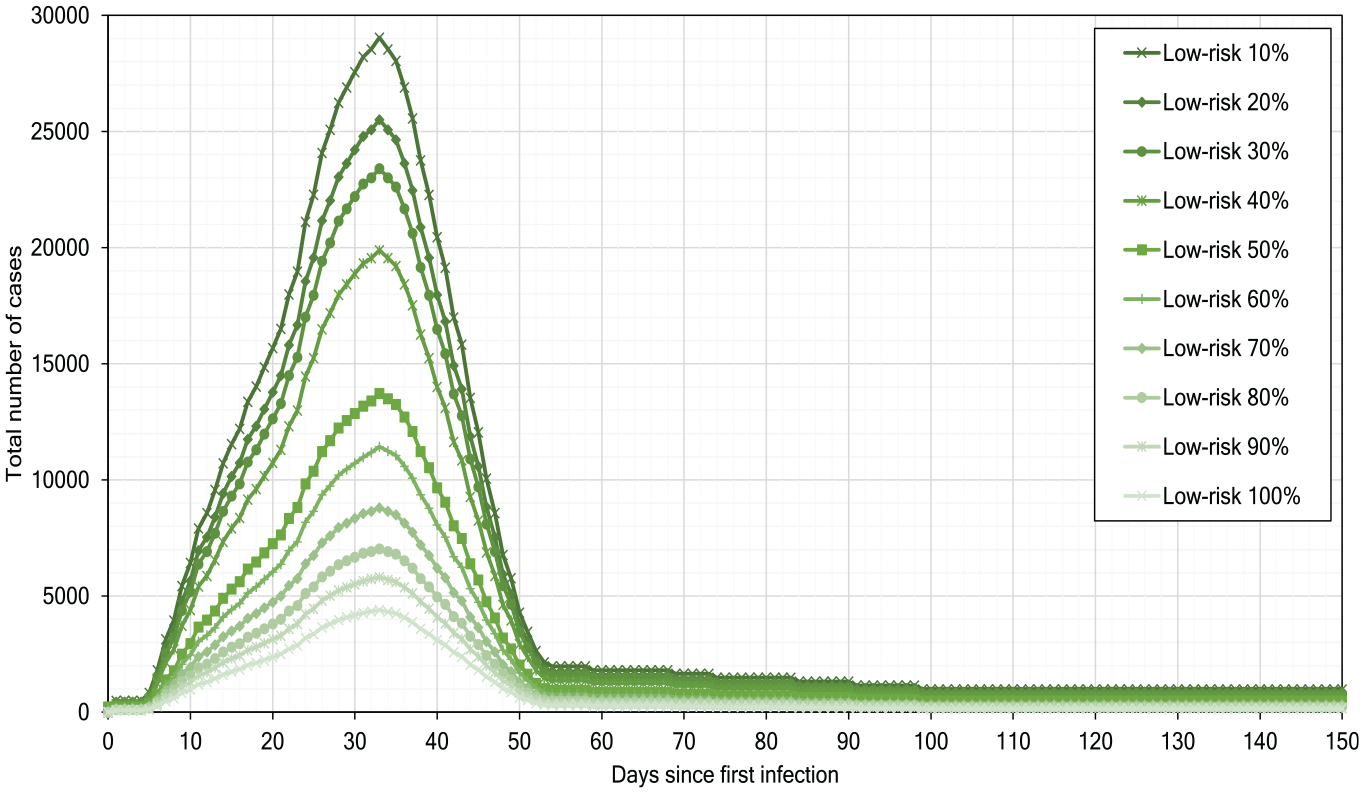
Low-risk scenarios of pandemic development.
Our simulation experiments show that, although the low-risk scenarios help reduce the infections number, they alone cannot strongly delay or flatten the infection peak.
In our next experiment, we model scenarios with self-isolation of infected persons as a single measure, without social distancing and school closure, with the results presented in Table 5. The results show that the higher the percentage of isolated infected people, the lower the values of
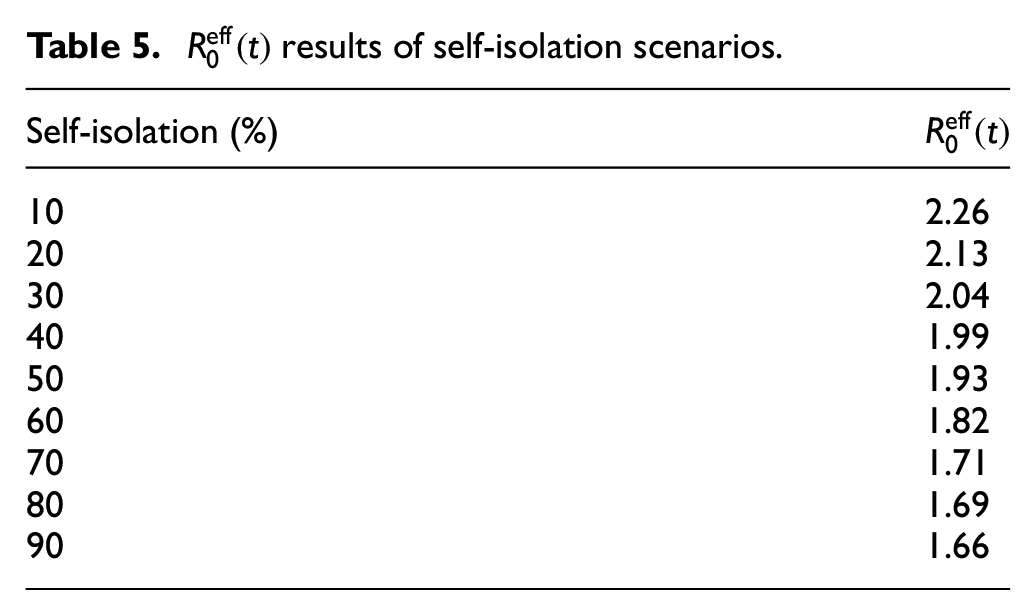
Figure 16 presents the simulation results when self-isolation rules are followed by 10% to 90% of population. We observe that self-isolation delays the peak of infection by 5–10 days for each 10% increase in the population fraction practicing self-isolation. On day 3 of infection (start of self-isolation = 3), agents are isolated for an average value period of 14 days until they recover (average duration of recovery
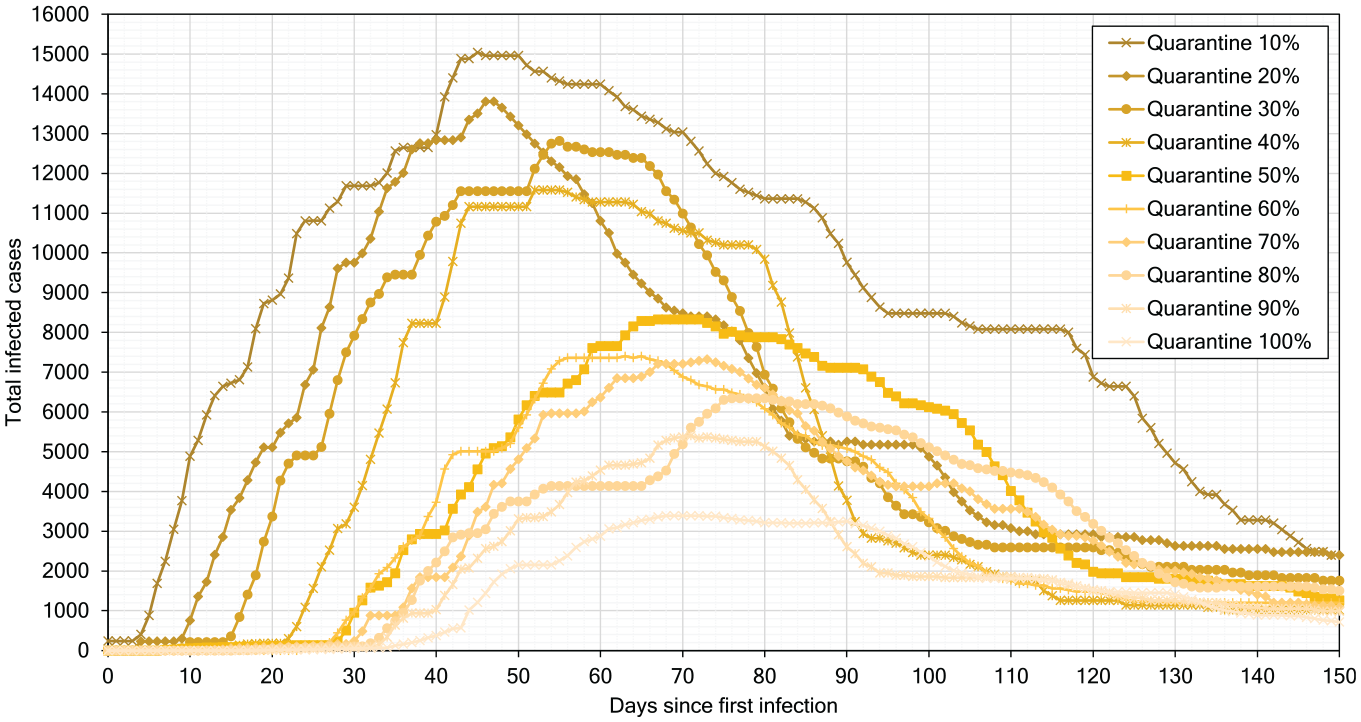
Effect of self-isolation from 10% to 90%.
Table 6 summarizes combined best scenarios with self-isolation and low-risk distancing. We can see that combined protection measures and the highest degree of accepting them achieve together the best reduction in the infection rate and flattening the pandemic curve.
Results for combined self-isolation and low-risk.
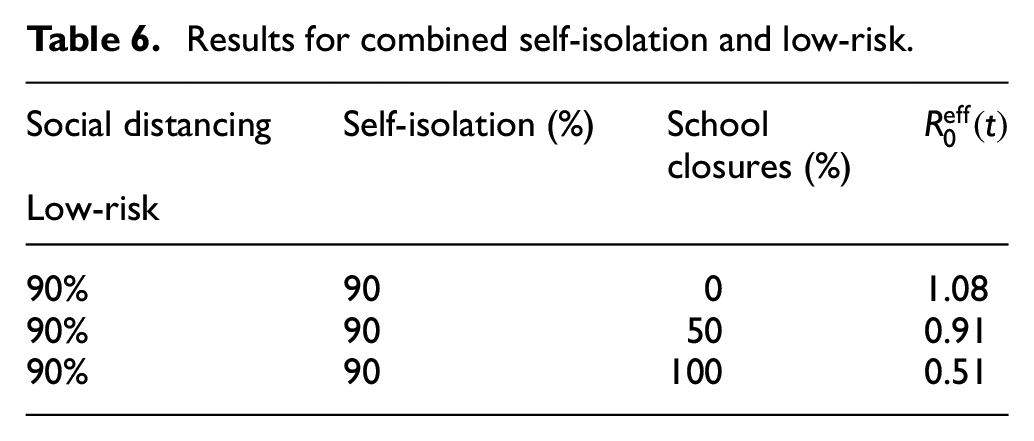
Figure 17 shows that self-isolation and low-risk distancing followed by 90% of people reduce the infection peak to
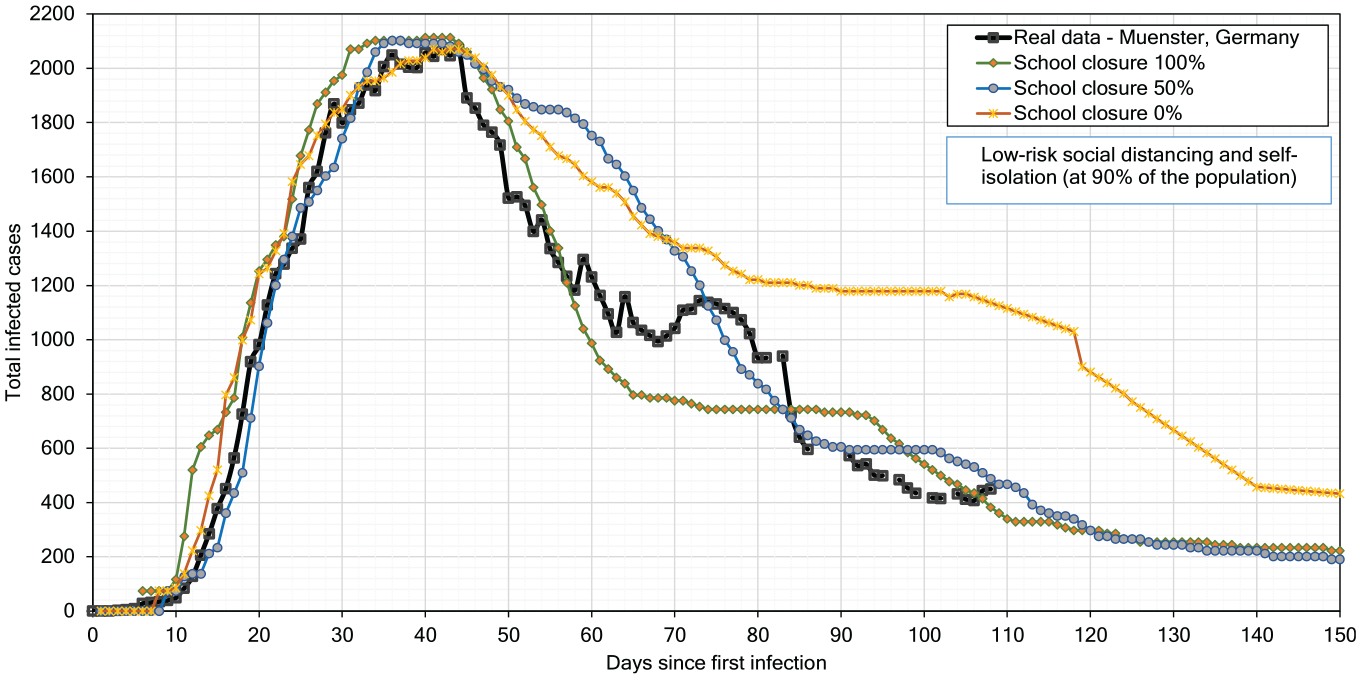
Effect of school closures.
In reality, schools in Münster were closed on day 43 after the first infection case.39,47 We experiment with school closing in three scenarios, where 0% indicates full attendance, 50% indicates that half of the students attend school in the morning shift, and 100% indicates full closure of schools; we compare our simulation results to the reported real-life curve for Münster in Figure 17. This comparison confirms that the reported curve for Münster is close to our simulation curve obtained for the 100% school closing scenario until day 58. After partial re-opening of schools on day 55, the infection number increases in the reported real-life curve, which is very near to our simulation curve for the scenario with 50% school closure.
Finally, we simulate the 0% school closure case and we forecast infections till day 150. We observe that school closure, self-isolation, and distancing together result in flattening the curve and strongly slow down the infection spread.
5.4.2. Small-scale: Indoor scenarios for COVID-19
As a result of simulating small-scale scenarios, we report the estimated probability of infection to at least one person present in one environment with an infected person.
Table 7 shows the probability PR(t) of infection transmission when people use FFP2 masks. The changes in the results are based on the change in the speaker’s volume (SV) – from silence to yelling – and the change in VEs. For instance, simulation shows that in a restaurant, when people are talking, the probability of at least one individual becoming infected after 100 min is 94%.
Probability estimations of infection transmission when individuals wear FFP2 masks.
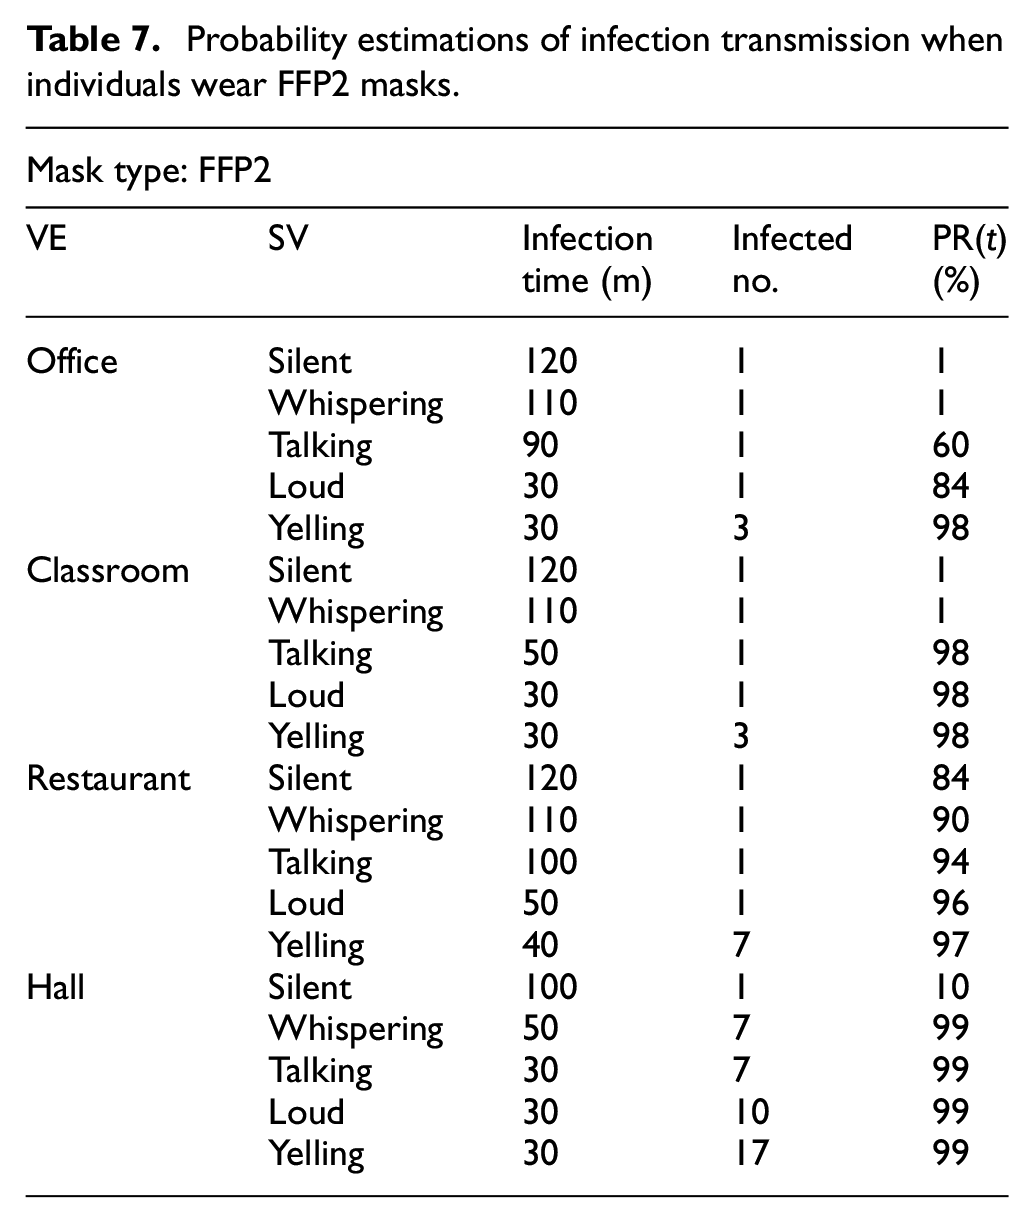
Table 8 shows how the probability of an individual becoming infected changes when people wear surgical masks.
Probability estimations of infection transmission when individuals wear surgical masks.
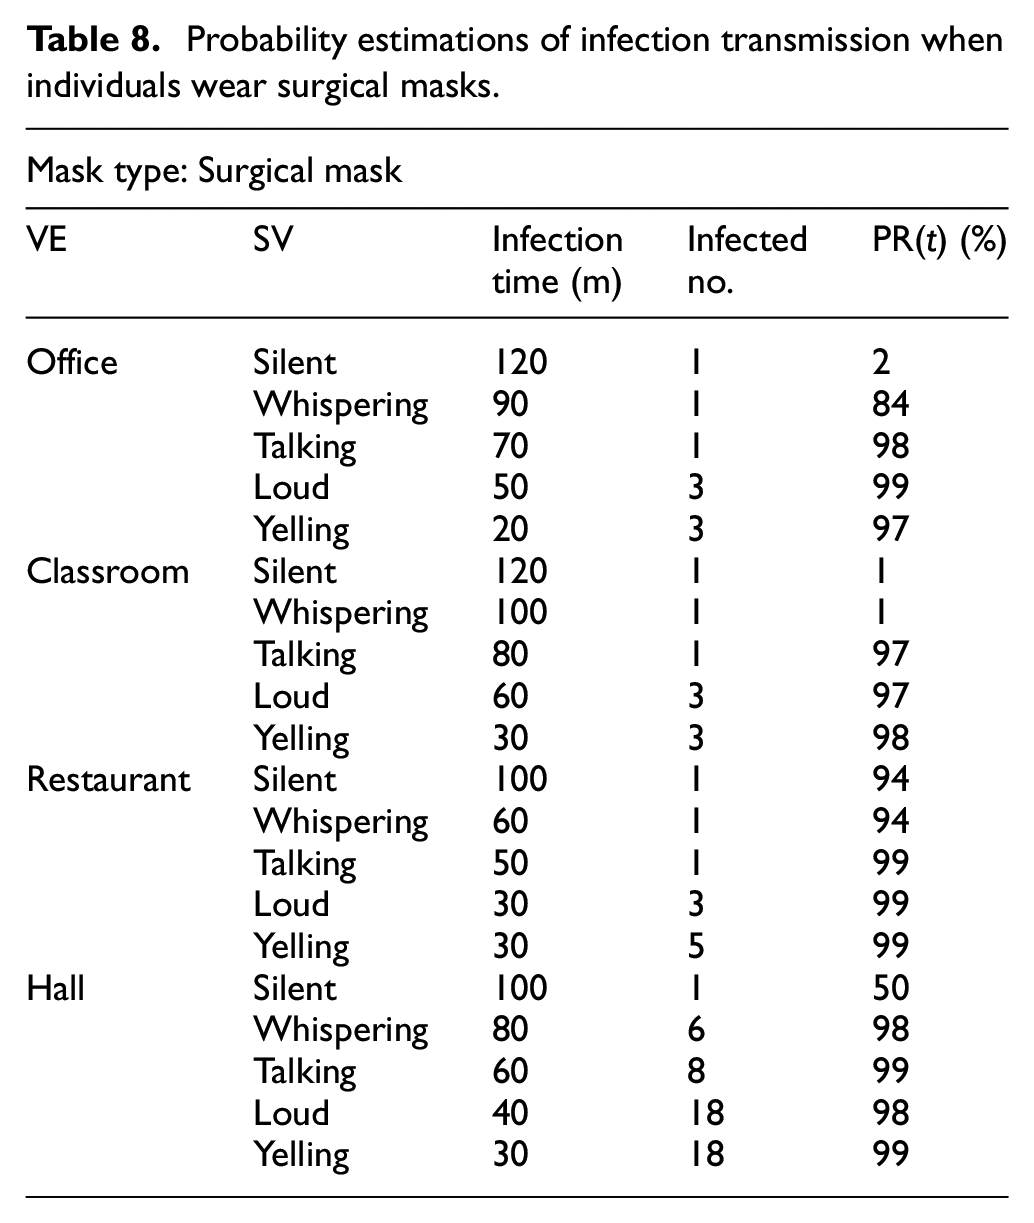
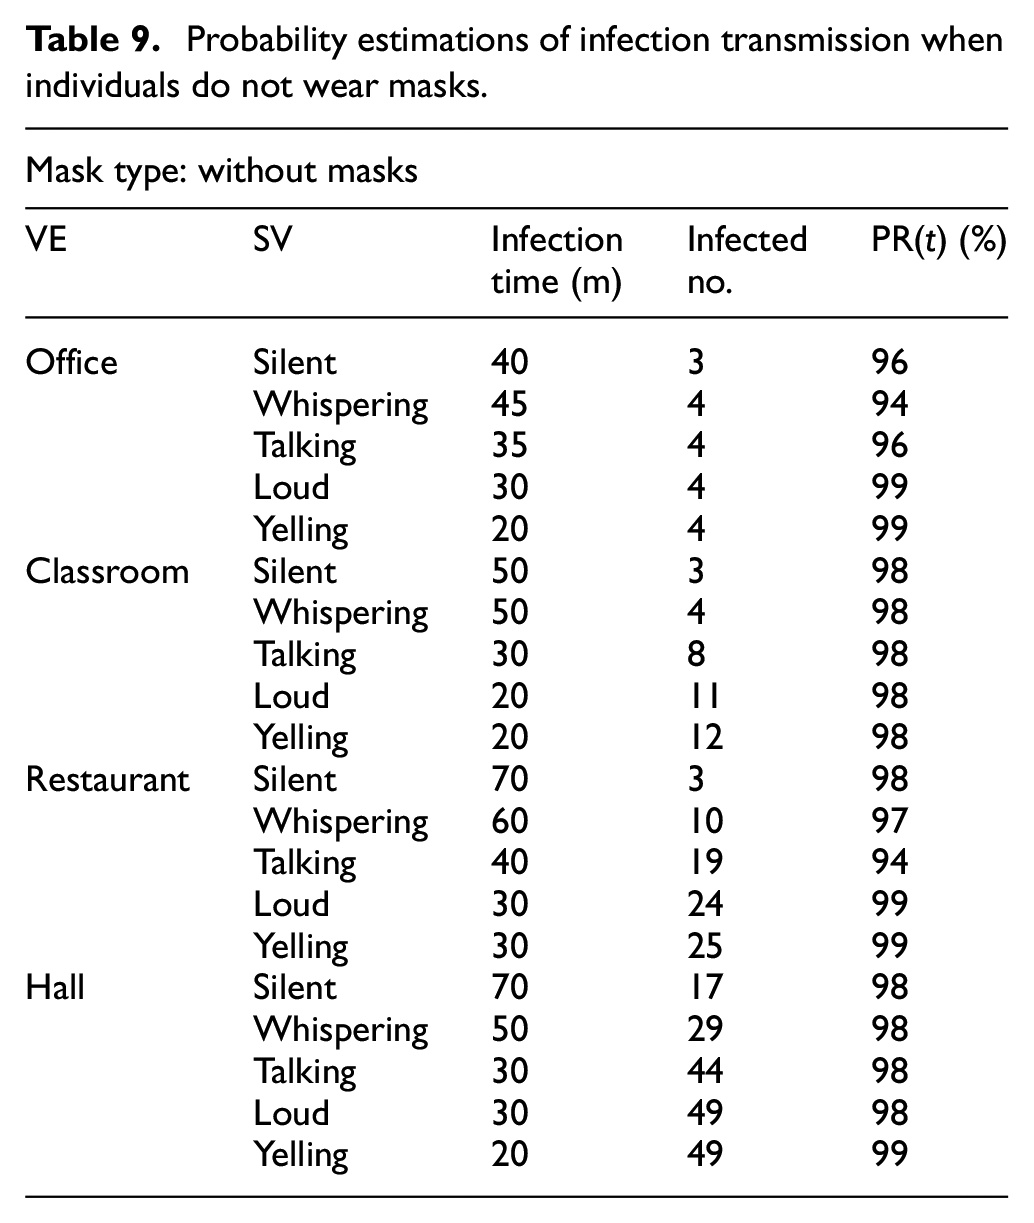
Table 9 shows the probability of infection transmission when people do not wear masks.
Probability estimations of infection transmission when individuals do not wear masks.
One major way to reduce the probability of infection transmission is to increase room ventilation. The recommended airflow rate in indoor environments is 8–10 L/s per person in meeting rooms and classrooms. 48 We simulate room ventilation by interactively opening and closing room doors on a regular basis.
Figure 18(a)–(d) show the effect of ventilating the four kinds of VEs on the probability of infection transmission. We select one simulation run for each VE from Table 8 in which individuals wear surgical masks and speak with each other at the talking level. The risk of infection before ventilation ranges from 97% to 99%, as shown in Table 8. Yet, after ventilation, the probability drops to a range of 0% to 6.5%, as shown in: Figure 18(a) for the office VE, Figure 18(b) for the classroom VE, Figure 18(c) for the restaurant VE, and Figure 18(d) for the hall VE.
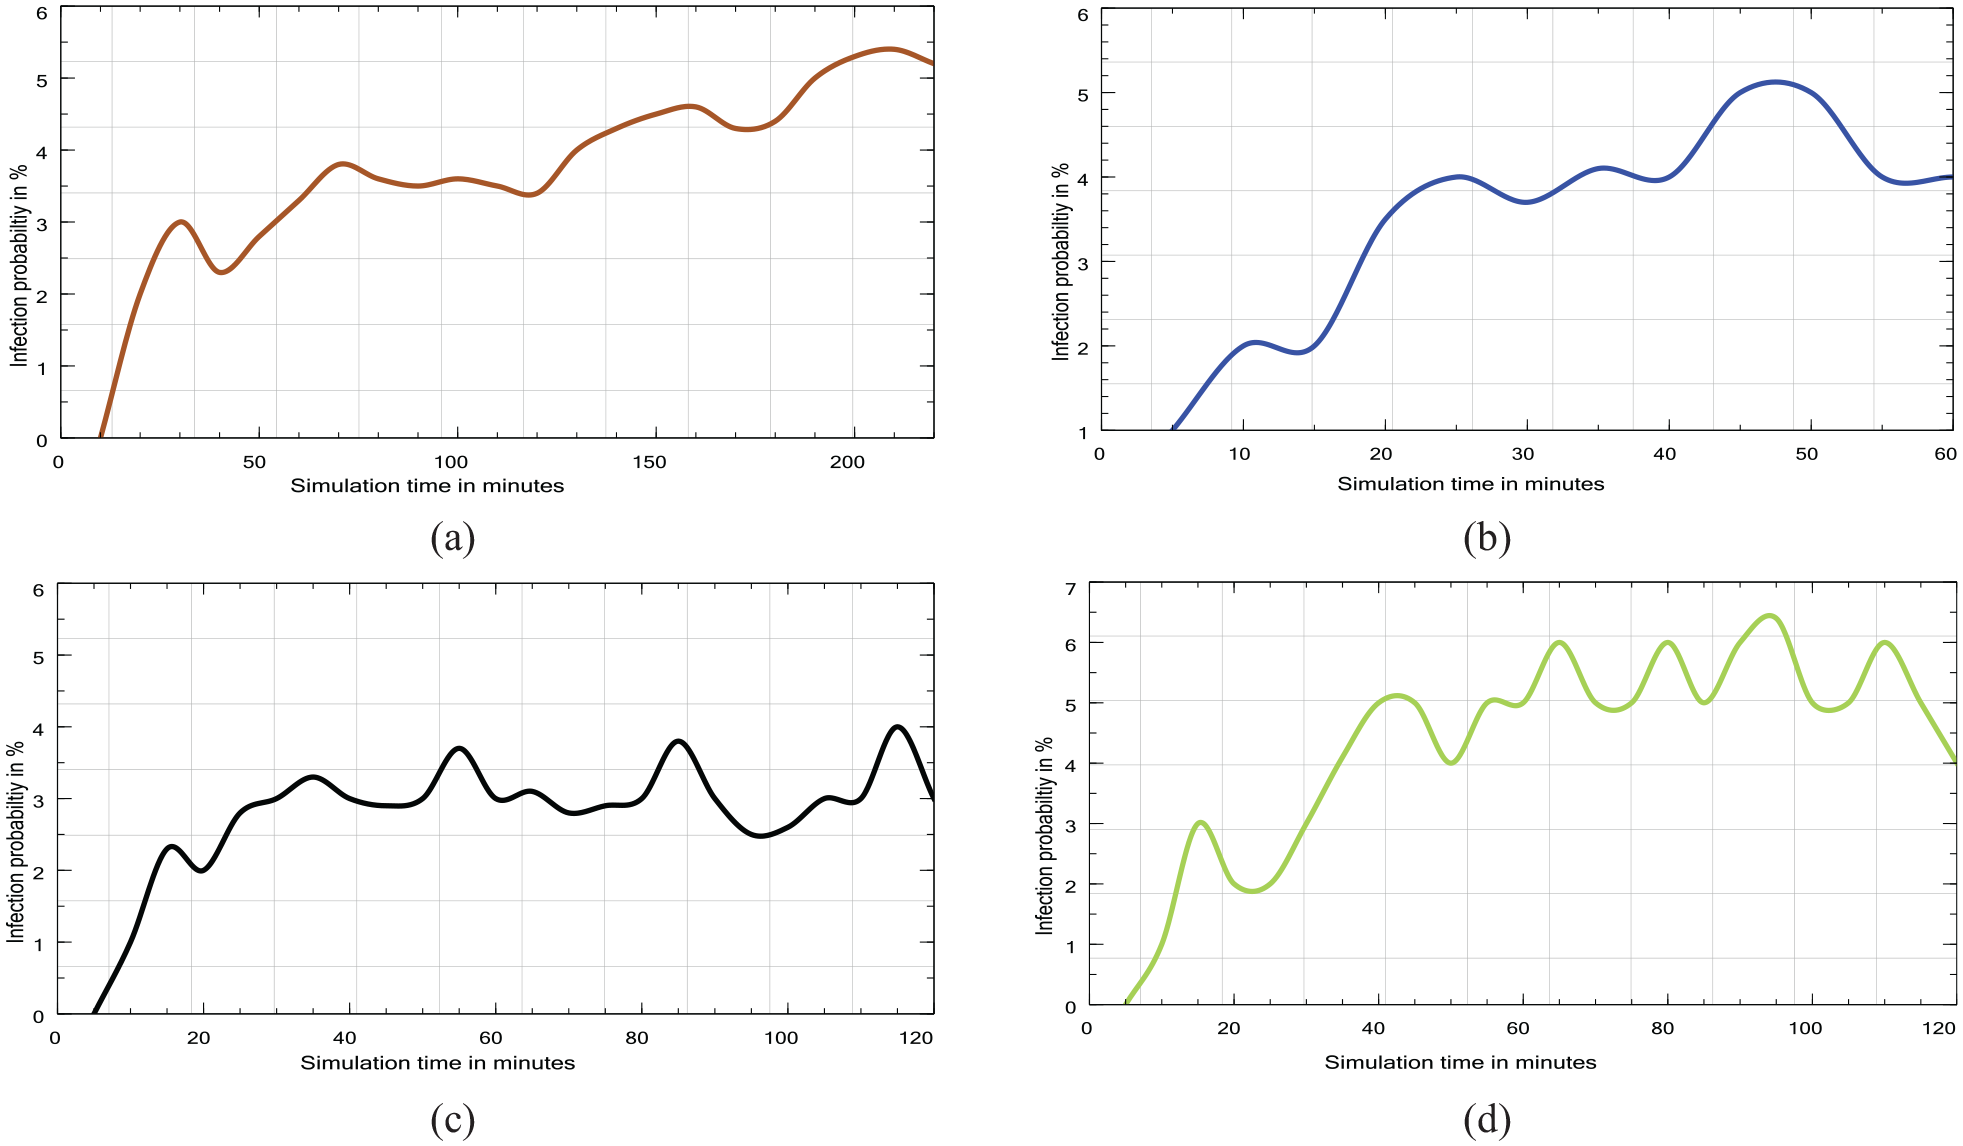
Four probability estimation plots for small-scale scenarios: (a) office, (b) classroom, (c) restaurant, and (d) hall.
5.5. Limitations of our approach
Our simulation model and its current implementation have a number of limitations. First, currently we model only three possible health states for agents, namely: susceptible, infected, and recovered. We do not consider other possible states, for example exposed and hospitalized. Second, we assume that infection transmission does not occur in open air but only in buildings and rooms. Additionally, we do not model agents’ trips in the outdoors, such as moving from home to work and back home, and we do not include transportation and traveling in our consideration. Because of this restriction, our simulation model would be not suitable for other kinds of pandemics that are developed primarily due to the infection transmission in open air. Fourth, our scenarios do not simulate multiple virus mutations with different infection rates simultaneously.
A further restriction of our model is that we assume for simplicity that infection is only possible within the infectious radius of an infected individual. In reality, aerosols are divided into two types: large droplets that fall to the ground and surfaces based on the atmospheric conditions of the room, and small droplets that remain suspended in the air for extended periods of time 49 and can move over longer distances. The primary mode of infection transmission is via breathing airborne droplets. Additionally, infection transmission through large droplets often happens by direct contact, such as shaking hands with an infected individual or touching the door handle and then rubbing eyes. 50 These droplets are thought to spread widely with varying densities and pose a risk to everyone in a small or moderately sized indoor room. Therefore, it is possible that the transmitted airborne particles will spread in areas beyond our calculated infection radius, thus additionally affecting the number of infected individuals.
In future work, we plan to address the restrictions and weaknesses of our modeling and simulation approach.
6. Conclusion
In this paper, we introduce and implement a novel model of infection/virus transmission in the SIR format, and we apply it to simulate the recent COVID-19 pandemic. We develop a new concept of behaviors based on pedestrian dynamics and we implement it by extending the existing Vadere simulation framework. In our simulation system, we greatly enhance the Vadere’s level of user interactivity in the process of simulation. This allows the user to control by mouse-clicks the state of the agents (stationary/moving and susceptible/infected) and to add new interactive elements, for example, doors that can be opened/closed interactively during simulation.
We evaluate our approach in a series of extensive simulation experiments for the city of Münster in Germany, which has a population of approximately
Footnotes
Acknowledgements
Thanks to Dr. Celeste Brennecka (University of Münster) for proofreading the article.
Funding
Mina Abadeer was supported by a scholarship from Christian Vision UK. Sergei Gorlatch is supported by the DFG project PPP-DL at the University of Münster.