
Abstract
Objectives
Urban heat island effects are intensifying under climate change and rapid urbanization. However, how large-scale climate anomalies such as the El Niño–Southern Oscillation (ENSO) interact with urban morphology to shape surface urban heat island intensity (SUHII) remains unclear. This study compares Shanghai and Suzhou to examine how SUHII responds to ENSO intensity across Local Climate Zones (LCZs).
Methods
Summer (June–August) land surface temperature data (2018–2022) were downscaled from MODIS using a random forest model and integrated with 100 m LCZ maps. SUHII was calculated relative to LCZ D and decomposed into inter- and intra-LCZ components. Linear and quadratic regressions were applied to quantify SUHII sensitivity to ENSO intensity, represented by the Oceanic Niño Index (ONI).
Results
ENSO intensity appears to modulate SUHII. La Niña phases strengthen inter-SUHII in both cities, whereas El Niño generally weakens it. The ONI–SUHII linkage is LCZ-dependent, with compact built types exhibiting the strongest sensitivity; in Shanghai, compact LCZs show a response slope of −0.98 °C per ONI, exceeding open, industrial, and vegetated types. Intra-SUHII follows a nonlinear pattern, reaching minima under near-neutral ENSO conditions and increasing during stronger El Niño or La Niña phases. City-scale morphology further appears to condition this sensitivity: Shanghai’s monocentric and high-density structure may contribute to the concentration of heat cores and amplifies ENSO-related variability, resulting in higher mean inter-SUHII (by 0.54 °C) and stronger ONI sensitivity than in polycentric Suzhou, where more dispersed urban form and cooling elements may help limit heat buildup.
Conclusions
These findings underscore the critical role of urban morphology in modulating climate-induced surface heat burden, offering valuable insights for climate-resilient urban planning in rapidly developing regions.
1. Introduction
Extremely high temperatures are a significant feature of global climate change, particularly in urban environments where they drive notable land surface temperature (LST) increases that threaten public health and resource management.1–3 Superimposed on long-term warming, large-scale climate anomalies can further shift the regional thermal background. Among them, the El Niño–Southern Oscillation (ENSO), expressed through its El Niño and La Niña phases, alters atmospheric teleconnection patterns and can trigger extremes such as abnormal temperature surges and persistent heat anomalies in East Asia and other regions.4–6 Understanding how ENSO-driven shifts in the regional thermal–moisture background interact with local urban form is therefore critical for reducing heat risks in rapidly urbanizing areas.
ENSO-related extremes have produced substantial impacts worldwide in recent years, including flooding in Pakistan and wildfires in the western United States, 7 and have also been associated with heat and drought episodes in the Yangtze River Delta (YRD). In the YRD, ENSO can modulate summertime temperature and rainfall by altering large-scale circulation (e.g., the western Pacific subtropical high), thereby influencing moisture transport, precipitation, cloud cover, and the surface radiation balance. 8 La Niña conditions often favor hotter and drier summers with reduced cloudiness and stronger shortwave heating, whereas El Niño conditions more often correspond to wetter and cloudier summers that enhance latent cooling and suppress surface heating. 9
Urban responses to extremely high-temperature events vary significantly and are often shaped by their unique spatial and material characteristics. Traditionally, cities have been classified into urban and suburban areas, with urban cores displaying higher average temperatures, faster warming rates, and more frequent hot days during extreme heat events. 10 However, this binary approach fails to account for the complex three-dimensional structures and surface material variations within and between urban regions, leading to an incomplete understanding of spatial heat responses. 11 This gap limits the effectiveness of data-driven strategies for urban spatial optimization and renewal.
The local climate zone (LCZ) classification offers an advanced framework to address the limitations of traditional urban-rural classifications in studying heat responses. Introduced by Stewart and Oke, 12 this system uses remote sensing observations to categorize urban areas into 17 types—10 built-up and 7 natural landscapes—based on spatial morphology, surface cover, and thermal characteristics. Recent international studies have increasingly applied the LCZ framework to interpret urban thermal environments and inform planning-relevant heat mitigation across diverse contexts, including planning-led urban form comparisons, island cities, and multi-scale cooling design frameworks.13–15
Built-up LCZ types generally exhibit higher LST than natural landscape types, particularly during summer.16–18 These differences are further influenced by factors such as building density and architectural form. For instance, LCZ 8 (large low-rise buildings) and LCZ 10 (industrial zones) often have significantly higher LST compared to other built-up types due to their compact structures and reduced vegetation.19,20 Such thermal variations highlight the critical role of urban spatial structures and land use in shaping localized heat responses.
The thermal responses of the same LCZ types vary across different cities.21,22 For instance, in LCZ 2 (compact mid-rise) areas, factors like building height and green space coverage influence LST differently in Shanghai and Tokyo. 23 Variability also exists within cities, where high-density LCZs often experience stronger warming compared to low-density ones. 23 Key factors driving these variations include building layout, materials, and proximity to cooling elements such as green spaces and water bodies.24–26 In Milan, for example, densely built LCZs (e.g., LCZ 3 and LCZ 8) exhibit higher LST due to greater building density and limited vegetation, whereas LCZs with nearby greenery or water bodies (e.g., LCZ 5 and LCZ 10) show notable cooling effects. 27
Temperature variations across LCZs are commonly assessed using surface urban heat island intensity (SUHII), which quantifies temperature differences between urban and non-urban areas or across different urban zone types.28,29 Recent studies highlight two key aspects of SUHII: inter-LCZ variations, which compare SUHII across different LCZ categories, and intra-LCZ variations, which examine spatial variability within the same LCZ type.29,30 These variations reflect differences in urban morphologies and land use patterns while emphasizing the role of local factors, such as vegetation and surface materials, in shaping thermal responses. Analyzing both inter- and intra-LCZ SUHII provides a deeper understanding of urban thermal heterogeneity and informs targeted climate adaptation strategies. In this study, SUHII is derived from satellite-based LST. This LST-based SUHII is conceptually different from canopy-layer UHI, which is defined using near-surface air temperature (typically at ∼2 m). Accordingly, SUHII should be interpreted as a spatially continuous indicator of surface heat patterns rather than a direct measure of human thermal comfort.
Meanwhile, ENSO-related anomalies have produced substantial hydroclimatic impacts in the Yangtze River basin in recent years, including episodes of heat and drought as well as anomalous rainfall. Urbanization can further amplify vulnerability to such climate anomalies by modifying albedo, evapotranspiration, surface roughness, and turbulent heat exchange, 31 thereby altering surface temperature extremes in urban cores. 32 As global temperatures rise, compounded by ENSO-driven variability, heat risks to urban environments and public health are expected to intensify. 33 Yet, despite growing evidence on LCZ-based thermal differences, current research has not fully addressed a key planning-relevant question: whether and how the thermal behavior of LCZs—and the resulting SUHII—systematically shifts under different ENSO intensities, and whether such climate–urban interactions differ across cities.
We frame ENSO as an external forcing and urban form as a planning-relevant modifier shaping LCZ-based SUHII sensitivity. To operationalize this framework, we conduct a comparative analysis of Shanghai and Suzhou—two major cities in the Yangtze River Delta that share broadly similar regional climate conditions but differ markedly in urban structure and morphology. Specifically, we test three propositions: (P1) ENSO intensity modulates summertime SUHII, with La Niña conditions tending to intensify SUHII and El Niño conditions generally corresponding to weakened SUHII. (P2) The magnitude of the ONI–SUHII linkage is LCZ-dependent, with compact built types exhibiting stronger sensitivity than open or natural types. (P3) City-scale urban form further conditions this sensitivity: a monocentric, high-density morphology (Shanghai) amplifies the ENSO signal in compact LCZs relative to a more polycentric city with more dispersed cooling elements (Suzhou).
By testing these propositions, this study aims to provide evidence that is both methodologically rigorous and conceptually relevant to climate-resilient urban planning, including the prioritization of LCZ-targeted interventions and the integration of predictable climate variability into heat-risk management.
2. Materials and methods
2.1. Study area overview
This study selects Shanghai (120°52′E-122°12′E, 30°40′N-31°53′N) and Suzhou (119°55′E-121°20′E, 30°47′N-32°02′N) (Figure 1(a)–(c)), two major cities in the middle and lower reaches of the Yangtze River Basin, as comparative study areas due to their significant sensitivity to El Niño/La Niña events and distinct urban characteristics. (a-c) Study area overview and LCZ spatial distribution; (d) Proportion of area occupied by each LCZ in Shanghai and Suzhou. (Produced by ArcGIS 10.8 and Python). LCZ definitions are provided in Table S1.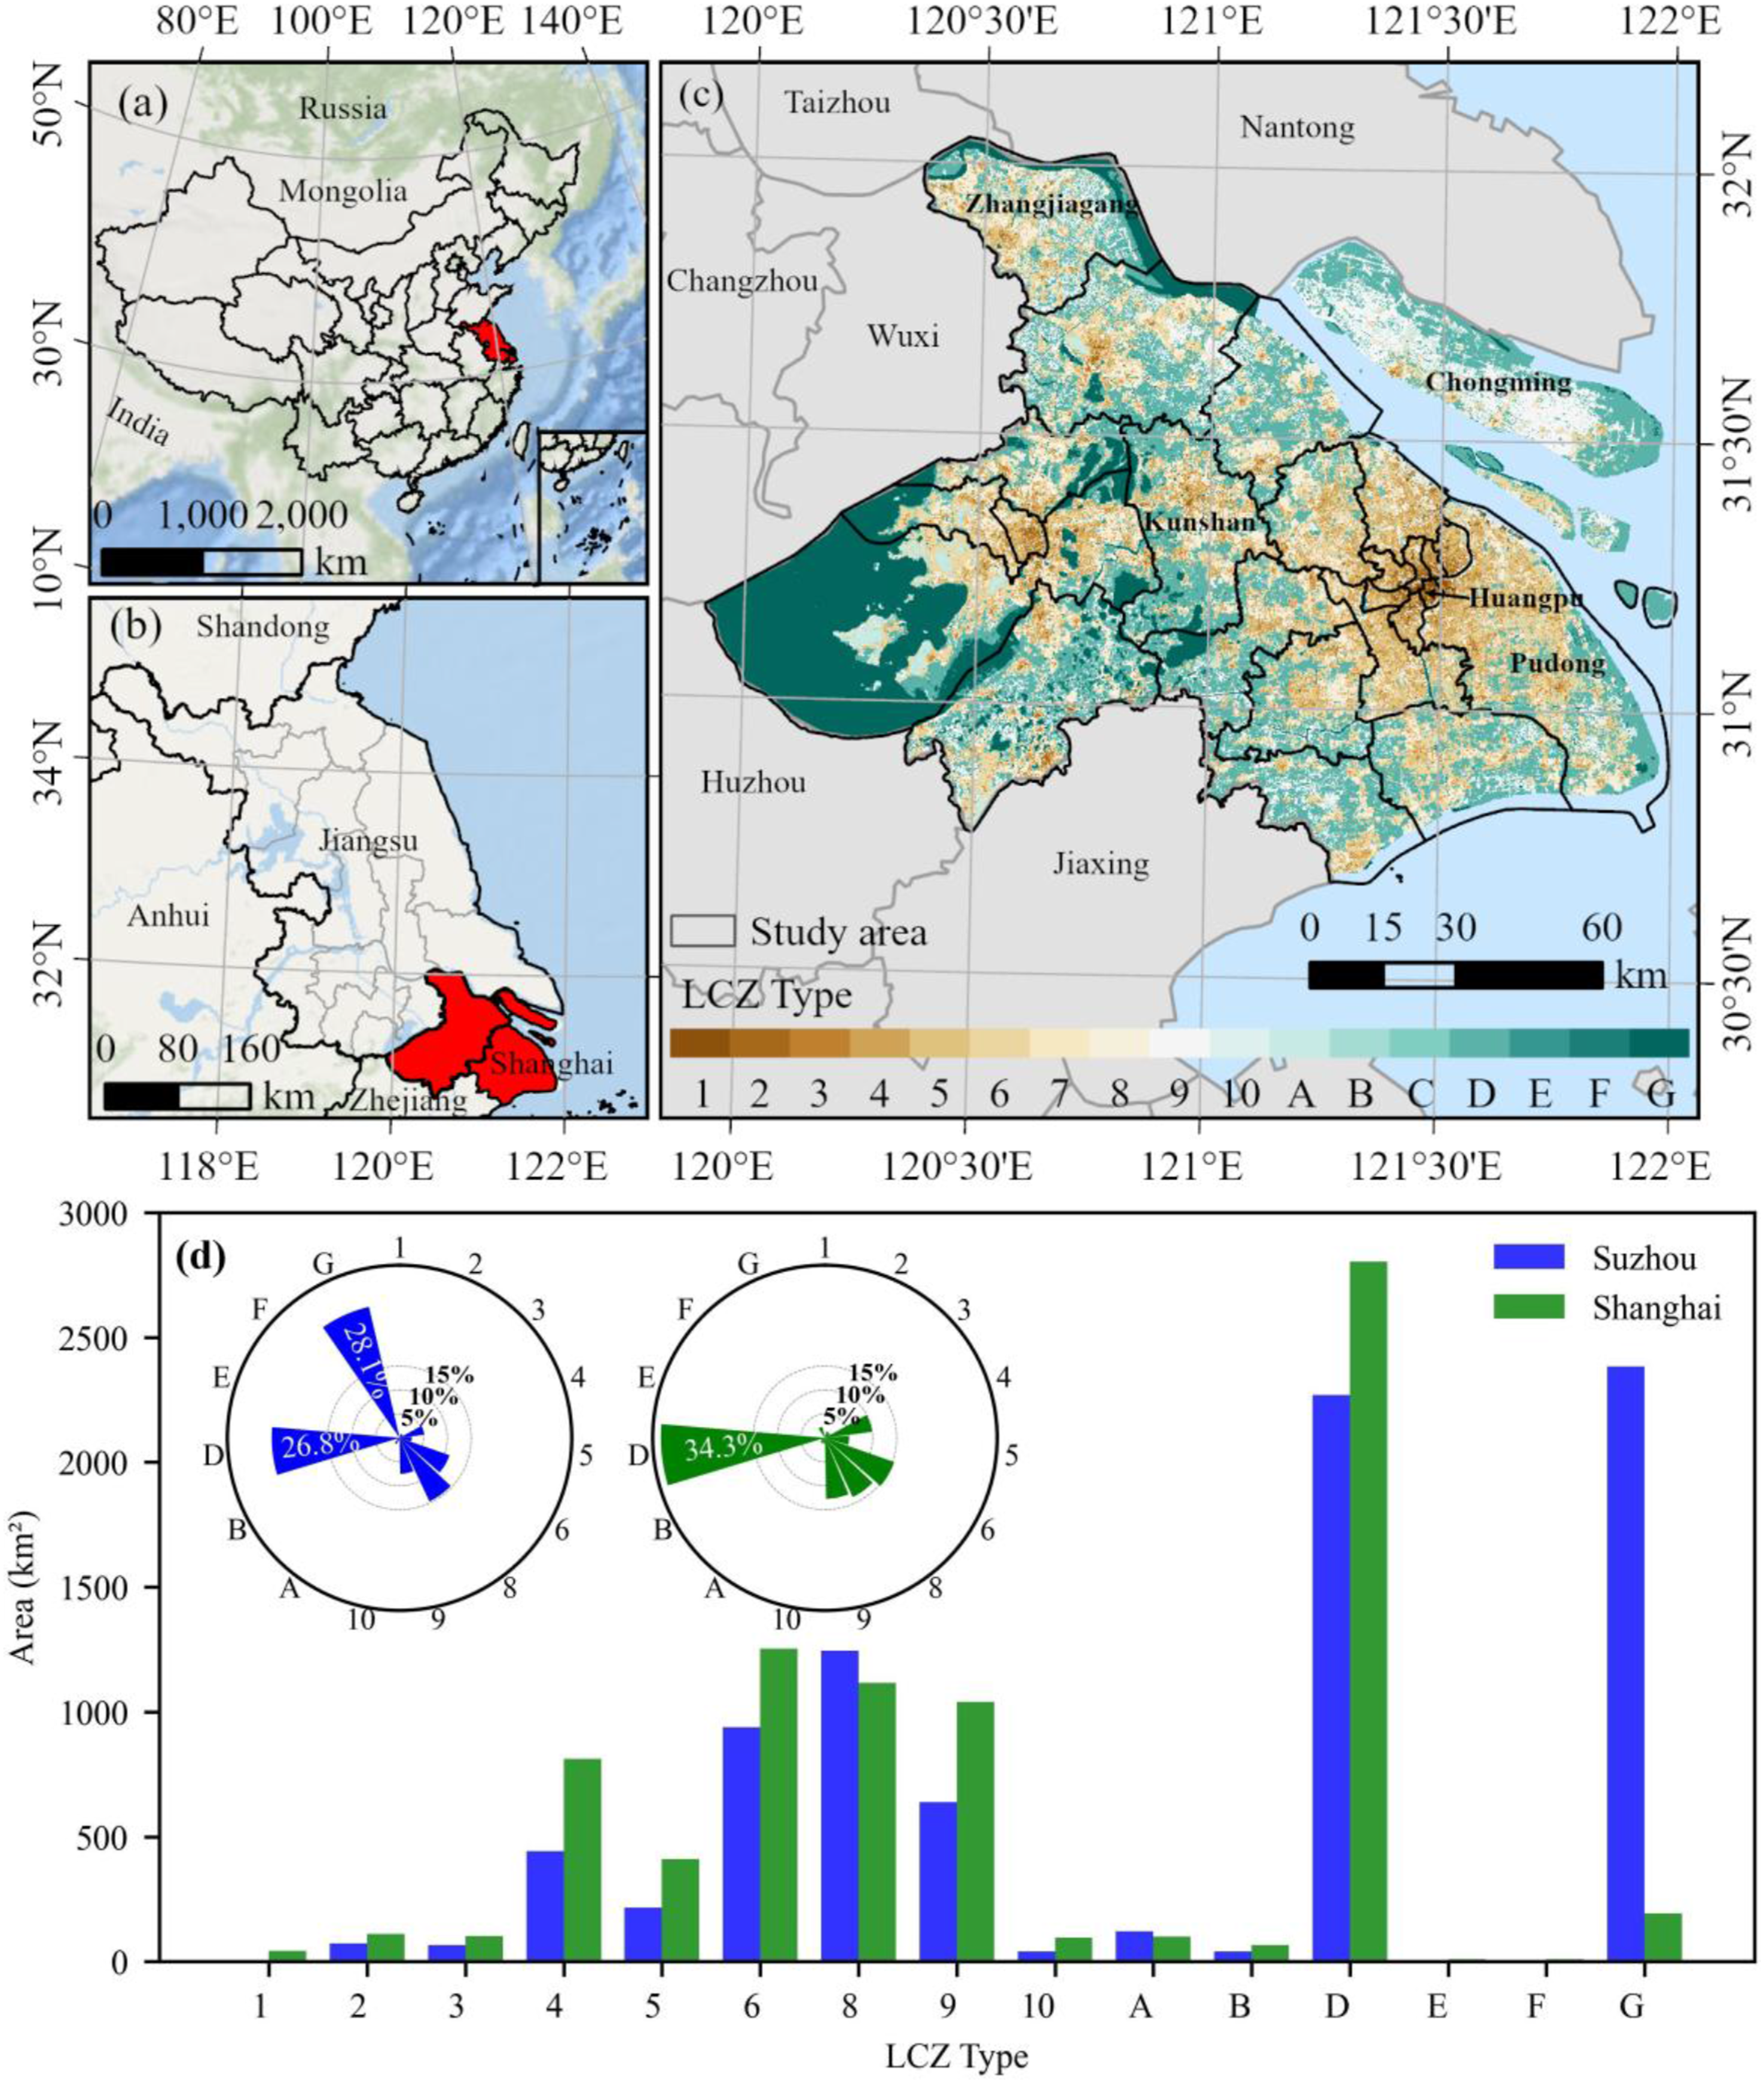
Both cities are core economic hubs in the Yangtze River Delta region, with Shanghai and Suzhou covering 6340.5 km2 and 8657.32 km2, respectively. Although they share similar climatic conditions as part of the subtropical monsoon zone, which features mild temperatures and annual precipitation of around 1100 mm, their urban structures and land use patterns differ significantly. Shanghai features a prominent monocentric urban structure with taller buildings and higher construction density, reflecting intensive urbanization. In contrast, Suzhou has a polycentric layout, with strict height restrictions aimed at preserving its historical heritage, abundant landmarks, and green spaces. As shown in Figure 1(d), except for LCZ G (water bodies), the proportional composition of the remaining LCZ types is highly comparable between Shanghai and Suzhou, indicating strong similarity in their overall LCZ structural composition. These similarities and differences provide valuable contrasts for analyzing LCZ heat response patterns under similar climate conditions. Accordingly, we analyzed the period 2018–2022, focusing on five consecutive summers (June–August).
2.2. Local climate zone data
The LCZ map data used in this study were derived from the global 100 m × 100 m resolution LCZ map published by Demuzere et al. 34 through the World Urban Database and Access Portal Tools (WUDAPT) project (https://doi.org/10.5281/zenodo.6364594) (Supplemental Table S1). The classification process utilized WUDAPT’s default random forest algorithm, augmented by multiple lightweight global random forest models, and employed an automated cross-validation method to ensure high accuracy.
The training data included samples from Ruhr-University Bochum, previous studies, and the LCZ classifier, supported by 33 auxiliary datasets like the 30 m global forest canopy height dataset and the NANTLI (Nighttime Light Index). Accuracy assessment indicated reliable results, with an overall accuracy (OA) exceeding 70%, supporting its application in studies of urban thermal environments and LCZ heat response analysis. 35 Adopting the standardized LCZ scheme facilitates cross-city comparability and positions our analysis within recent LCZ-based UHI research that links thermal patterns to planning and mitigation strategies.13–15
We selected 2018–2022 as the analysis period to ensure consistency between the thermal metrics and the available LCZ data. The LCZ map used in this study is the widely adopted global product by Demuzere et al., which represents urban form around 2018; applying this static classification to earlier years (when Shanghai and Suzhou experienced rapid land-use and structural change) could introduce substantial bias. After 2019, urban expansion slowed significantly, partly due to the COVID-19 pandemic and subsequent economic adjustments, making the 2018 LCZ map a relatively stable morphological baseline for analyzing ENSO-related variability over the subsequent five years. This design therefore targets climate-state–dependent modulation of LCZ-based SUHII under interannual ENSO variability rather than long-term urban morphological evolution.
2.3. Land surface temperature data
The land surface temperature (LST) data used in this study were derived from the MOD11A1 V6 product of the Moderate Resolution Imaging Spectroradiometer (MODIS), developed by NASA. This dataset provides daily global LST observations with a spatial resolution of 1 km. To enhance data reliability, we utilized the quality control (QC) flags in the MOD11A1 product accessed through the Google Earth Engine (GEE), selecting only “Good data quality” pixels to filter out cloud contamination and other retrieval anomalies. For the average summer LST, we focused on monthly averages for June, July, and August in the study area. Although Landsat 8-9 LST products offer higher spatial resolution, their low temporal resolution and high sensitivity to cloud cover during summer limited their suitability for regional-scale analysis, and thus were excluded from this study.
Furthermore, to enhance the spatial detail of the LST data, a random forest (RF)-based spatial downscaling approach was employed, using digital elevation model (DEM), slope, aspect, and normalized difference vegetation index (NDVI) as auxiliary predictors to refine the resolution from 1 km to 100 m. RF has been widely adopted for MODIS LST downscaling because it can flexibly model complex and nonlinear relationships between LST and biophysical/topographic controls 36 Empirical validations against higher-resolution reference LST (e.g., Landsat-derived LST) reported that RF-downscaled MODIS LST typically achieves RMSE on the order of ∼1–2 K, indicating comparatively low uncertainty and supporting its applicability for urban heat studies. 37
The NDVI data used in this study were derived from the Harmonized Landsat and Sentinel-2 (HLS) surface reflectance products jointly produced by NASA and the USGS. The HLS product suite provides two parallel streams: HLSL30 (Landsat-based, 30 m) and HLSS30 (Sentinel-2–based, 30 m). In this study, we used HLSL30 to generate NDVI, which offers 30 m spatial resolution and a high revisit frequency suitable for vegetation monitoring (https://www.earthdata.nasa.gov/data/catalog/lpcloud-hlsl30-2.0).
The DEM data were obtained from the Shuttle Radar Topography Mission (SRTM) Version 3 product (SRTM Plus) released by NASA’s Jet Propulsion Laboratory (JPL), with a spatial resolution of 30 m (https://earthexplorer.usgs.gov/). Based on the DEM data, slope and aspect layers were generated using GEE.
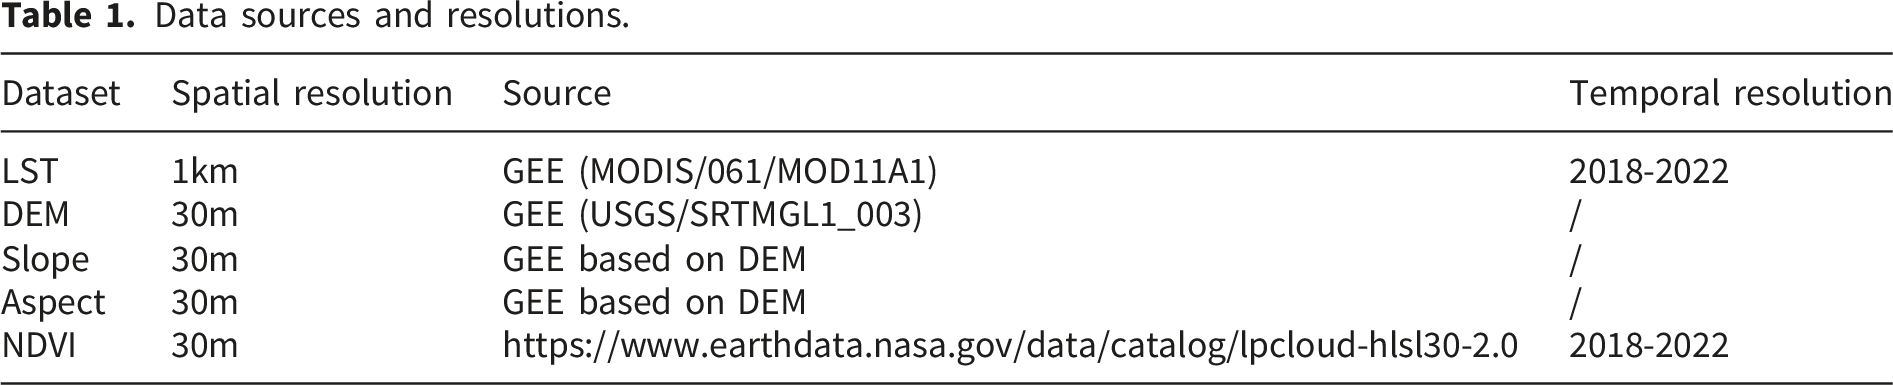
Data sources and resolutions.
An RF model was developed for each year (2018–2022) to downscale MODIS LST. The LST raster was converted to point samples, and predictor values were extracted at corresponding locations to create a paired dataset. This dataset was randomly split into training and validation subsets (80%/20%), and hyperparameters were tuned using grid search. Model performance was evaluated using the withheld 20% independent validation samples. The downscaled LST achieved an R2 of 0.79 and an RMSE of 0.92 °C (Figure 2(f)), with annual R2 and RMSE values presented in Figure 2(a)–(e). Comparison between predict and MODIS LST (Produced by Python).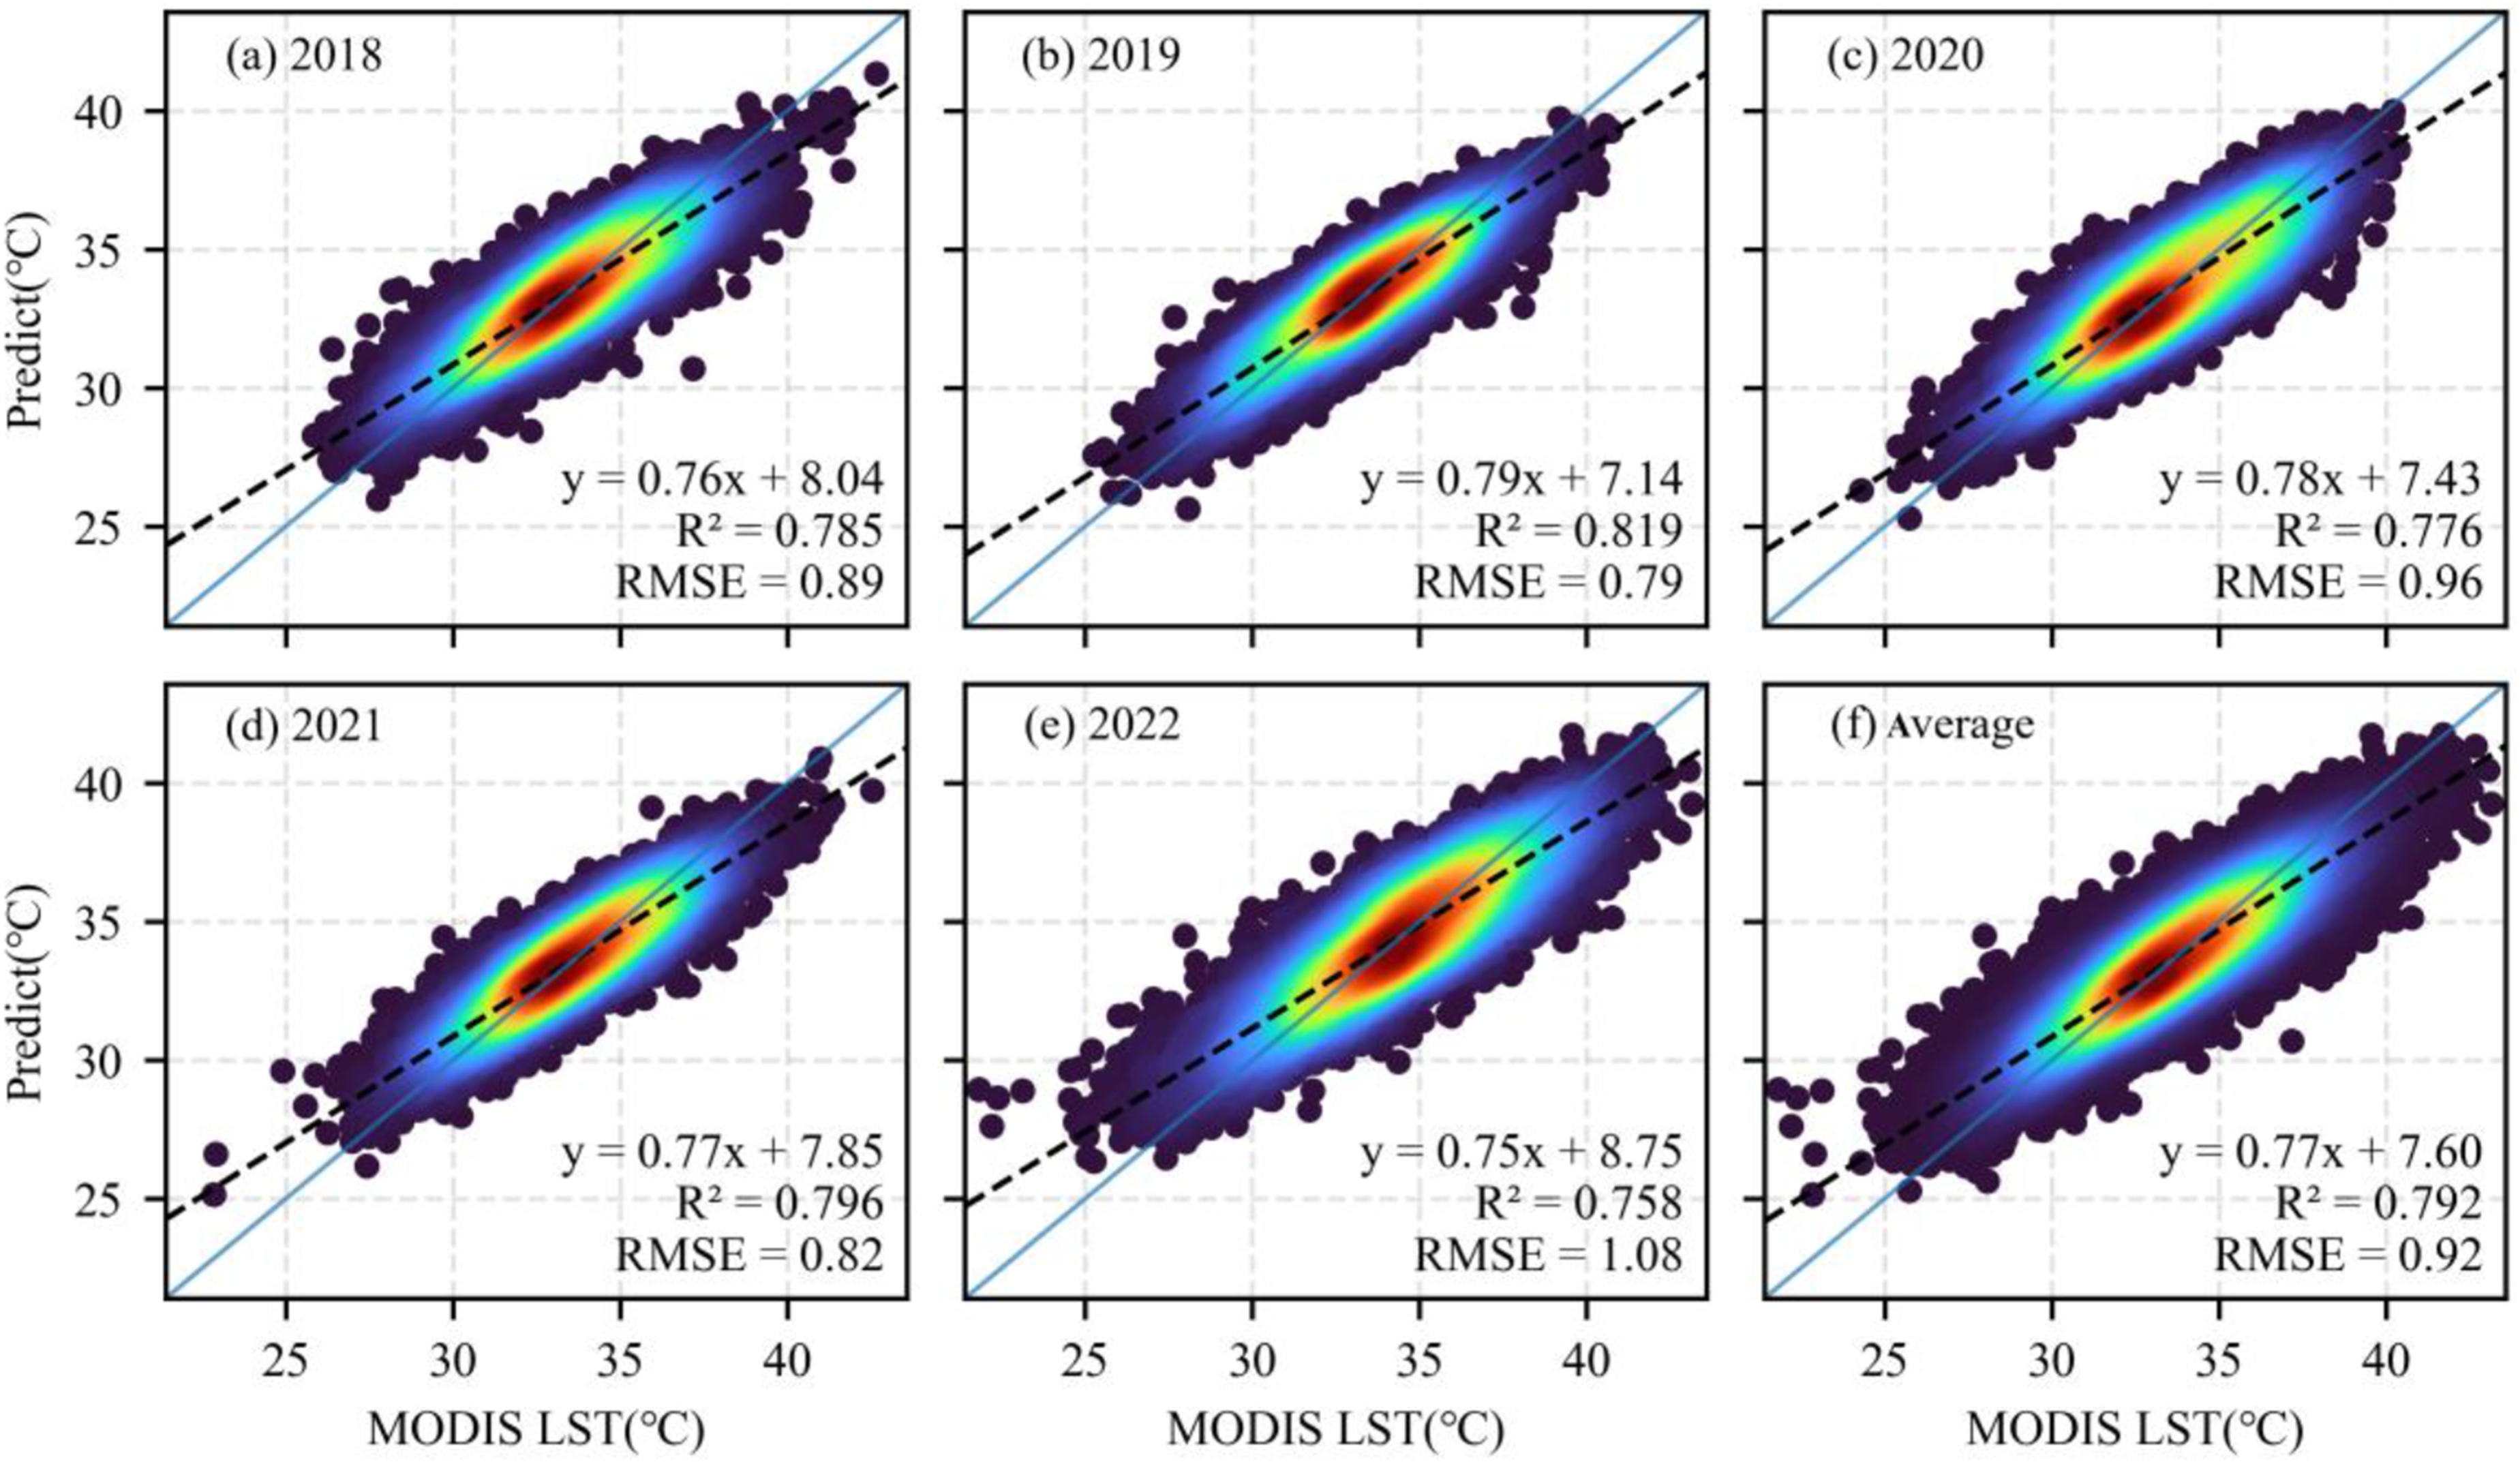
2.4. The calculation of SUHII
SUHII is a key indicator for assessing urban heat island effects by quantifying the LST difference between urban centers and surrounding rural areas. When using the LCZ approach to estimate SUHII, LCZ D (low plants), an area characterized by minimal human disturbance and dominant vegetation, is commonly selected as the reference temperature. The SUHII is calculated relative to the mean high-resolution LST of LCZ D (
The inter-LCZ SUHII is defined as the mean SUHII of a specific LCZ, as illustrated in Equation (2):
The intra-LCZ SUHII (
2.5. The change of SUHII under varying El Niño/La Niña intensities
The intensity of El Niño/La Niña events is represented by the Oceanic Niño Index (ONI), which can be accessed from https://origin.cpc.ncep.noaa.gov/products/analysis_monitoring/ensostuff/ONI_v5.php. An ONI value greater than +0.5 indicates an El Niño event, and its intensity increases as the ONI value rises. Conversely, an ONI value less than -0.5 indicates a La Niña event, with greater intensity observed as the ONI value decreases. Since the ONI is derived from the three-month average of monthly sea surface temperature anomalies, this study uses the JJA (June–August) mean ONI to align with the summer period of 2018–2022.
To investigate how SUHII varies under different El Niño/La Niña intensities, this study examines the correlation between SUHII and the ONI during the summers of 2018–2022. The analysis seeks to determine whether changes in ONI values influence the magnitude of inter- and intra-LCZ SUHII, thereby revealing potential links between large-scale climatic phenomena and localized urban thermal responses.
3. Results
3.1. Differences in LST under varying ONI intensities
The spatial distribution of the summer (June–August) mean LST for 2018–2022, based on MODIS LST downscaled to 100 m with the RF model, is shown in Figure 3(a). Both Shanghai and Suzhou exhibit prominent high-temperature features in urban centers, with LST exceeding 35°C, forming a sharp gradient from suburban areas, where LST remains near 30°C. Shanghai shows a large, contiguous high-temperature region with a single-core concentrated pattern, while Suzhou displays a multi-core distribution with smaller, fragmented hotspots scattered across the city. (a) Spatial distribution of average LST from 2018 to 2022; (b) Average LST in Shanghai and Suzhou during June–August from 2018 to 2022; (c) Relationship between average LST in Shanghai and Suzhou during June–August (2018–2022) and the ONI. (Produced by ArcGIS 10.8 and Python).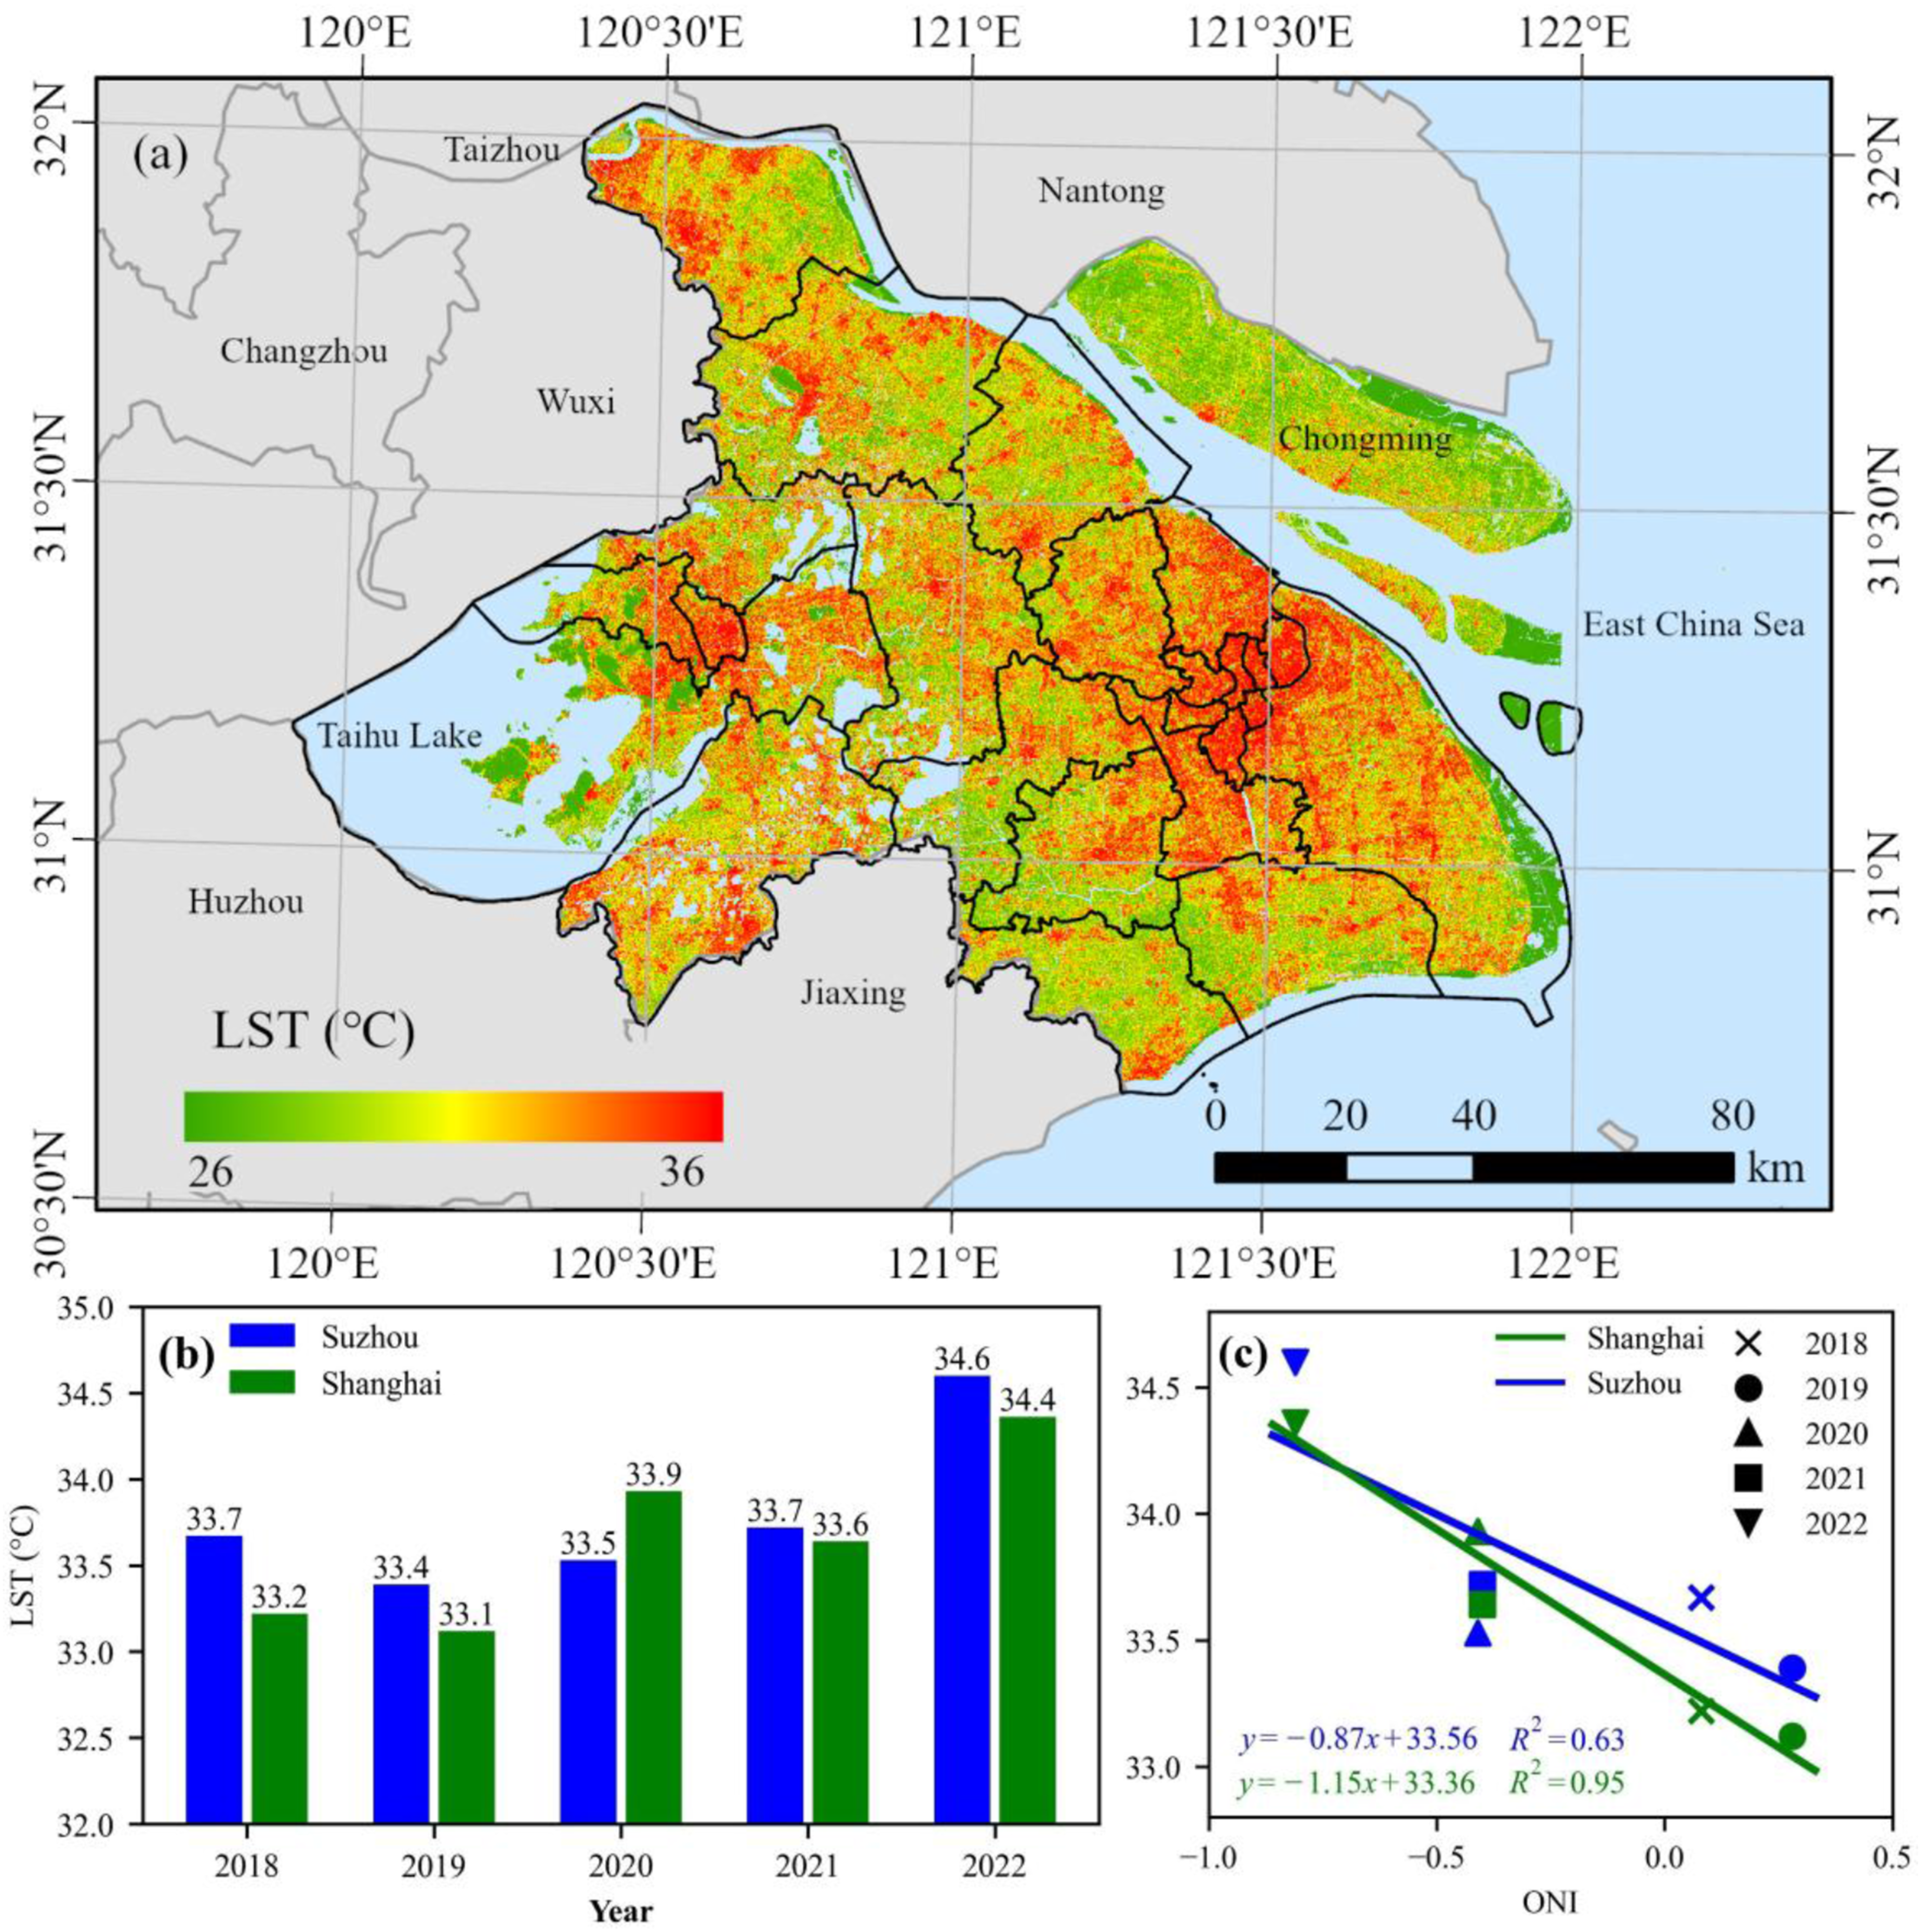
Generally, Suzhou’s summer LST is higher than Shanghai’s (Figure 3(b)). Although high-temperature areas (LST > 35°C) in Shanghai are more extensive than those in Suzhou (Figure 3(a)), the low-temperature zones around Chongming Island and neighboring islands, covering about 20% of Shanghai’s total area, lower the city’s overall average LST.
Within 2018–2022, summer-mean LST shows an apparent negative association with ONI (Figure 3(c)), where LST tends to rise during stronger La Niña years. Linear regression analysis reveals that the R2 values for Shanghai and Suzhou are 0.95 and 0.65, respectively, suggesting a stronger link between LST changes and ONI in Shanghai. Additionally, the steeper regression slope for Shanghai indicates that its LST is more sensitive to El Niño/La Niña intensities. Given the limited number of annual observations (n = 5), the regression is used to indicate interannual co-variability in our study window rather than to provide a robust long-term statistical estimate.
The spatial distribution of LCZs and the average LST for each LCZ in Shanghai and Suzhou are shown in Figures 1 and 4, respectively. Among the built-up LCZs (LCZ 1-10), compact LCZs (LCZ 1-3) exhibit the highest LST values in both cities, with LCZ 2 reaching an average of nearly 36°C. However, compact LCZs occupy only 2–3% of the total urban area (Figure 1), limiting their overall contribution. Open LCZs (LCZ 4-6), which cover a larger proportion of urban areas, have an average LST around 0.8°C lower than that of compact LCZs. Comparison of average LST for each LCZ in Shanghai and Suzhou during June–August from 2018 to 2022(Produced by Python).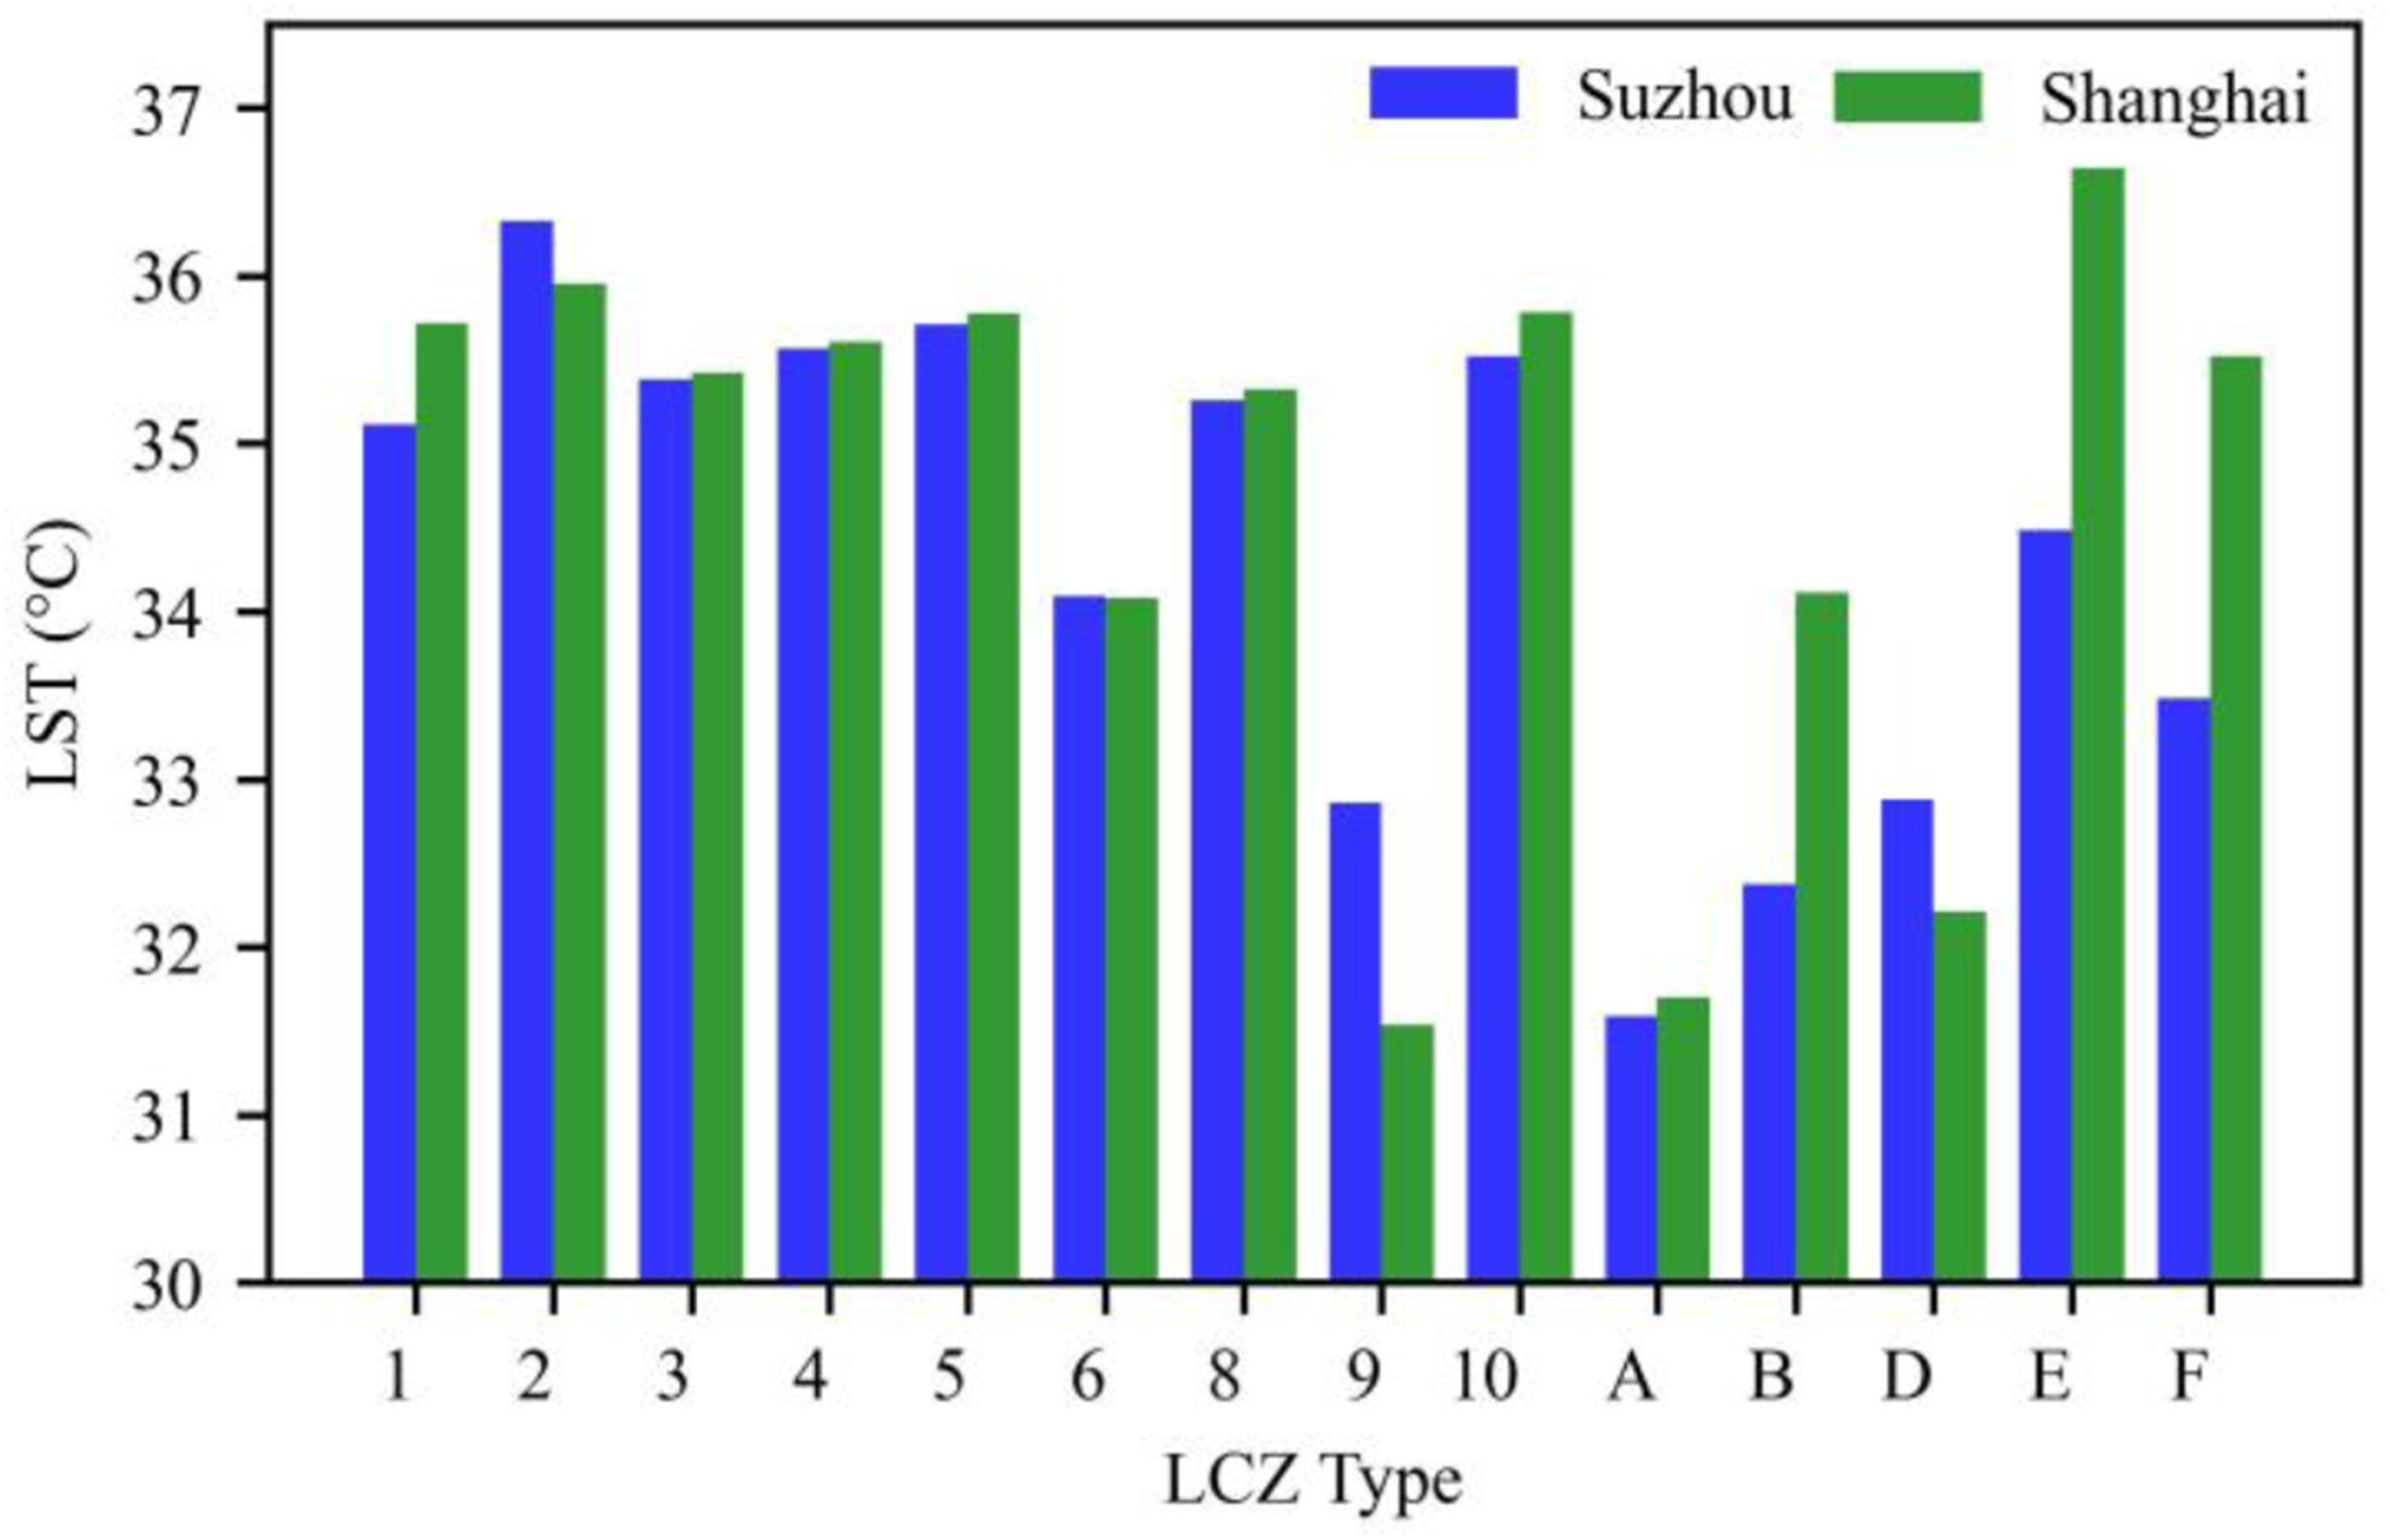
Overall, Shanghai’s LCZs exhibit higher LST values than Suzhou’s, with the average LST in built-up LCZs being 0.19±0.1°C higher and in natural LCZs 1.5±0.5°C higher, likely due to the different urban layouts and land use patterns. Interestingly, for LCZ D, which plays a key role in calculating SUHII, Shanghai’s average LST is 0.6°C lower than Suzhou’s, potentially amplifying Shanghai’s SUHII due to larger temperature contrasts between urban and suburban areas.
3.2. Distribution of SUHII
The spatial distribution of average SUHII during summer (June–August) from 2018 to 2022 is shown in Figure 5(a). In Shanghai, SUHII has a contiguous spatial pattern, with most urban areas showing values between 3°C and 5°C. High SUHII values above 5°C are scattered within the city core. In comparison, Suzhou exhibits a weaker and less concentrated SUHII, with similar values (3°C to 5°C) but fewer areas exceeding 5°C. (a) Spatial distribution of average SUHII during the summer months (2018–2022); (b) Yearly comparison of SUHII during the summers of 2018–2022; (c) Correlation between average SUHII in Shanghai and Suzhou during June–August (2018–2022) and the ONI. (Produced by ArcGIS 10.8 and Python).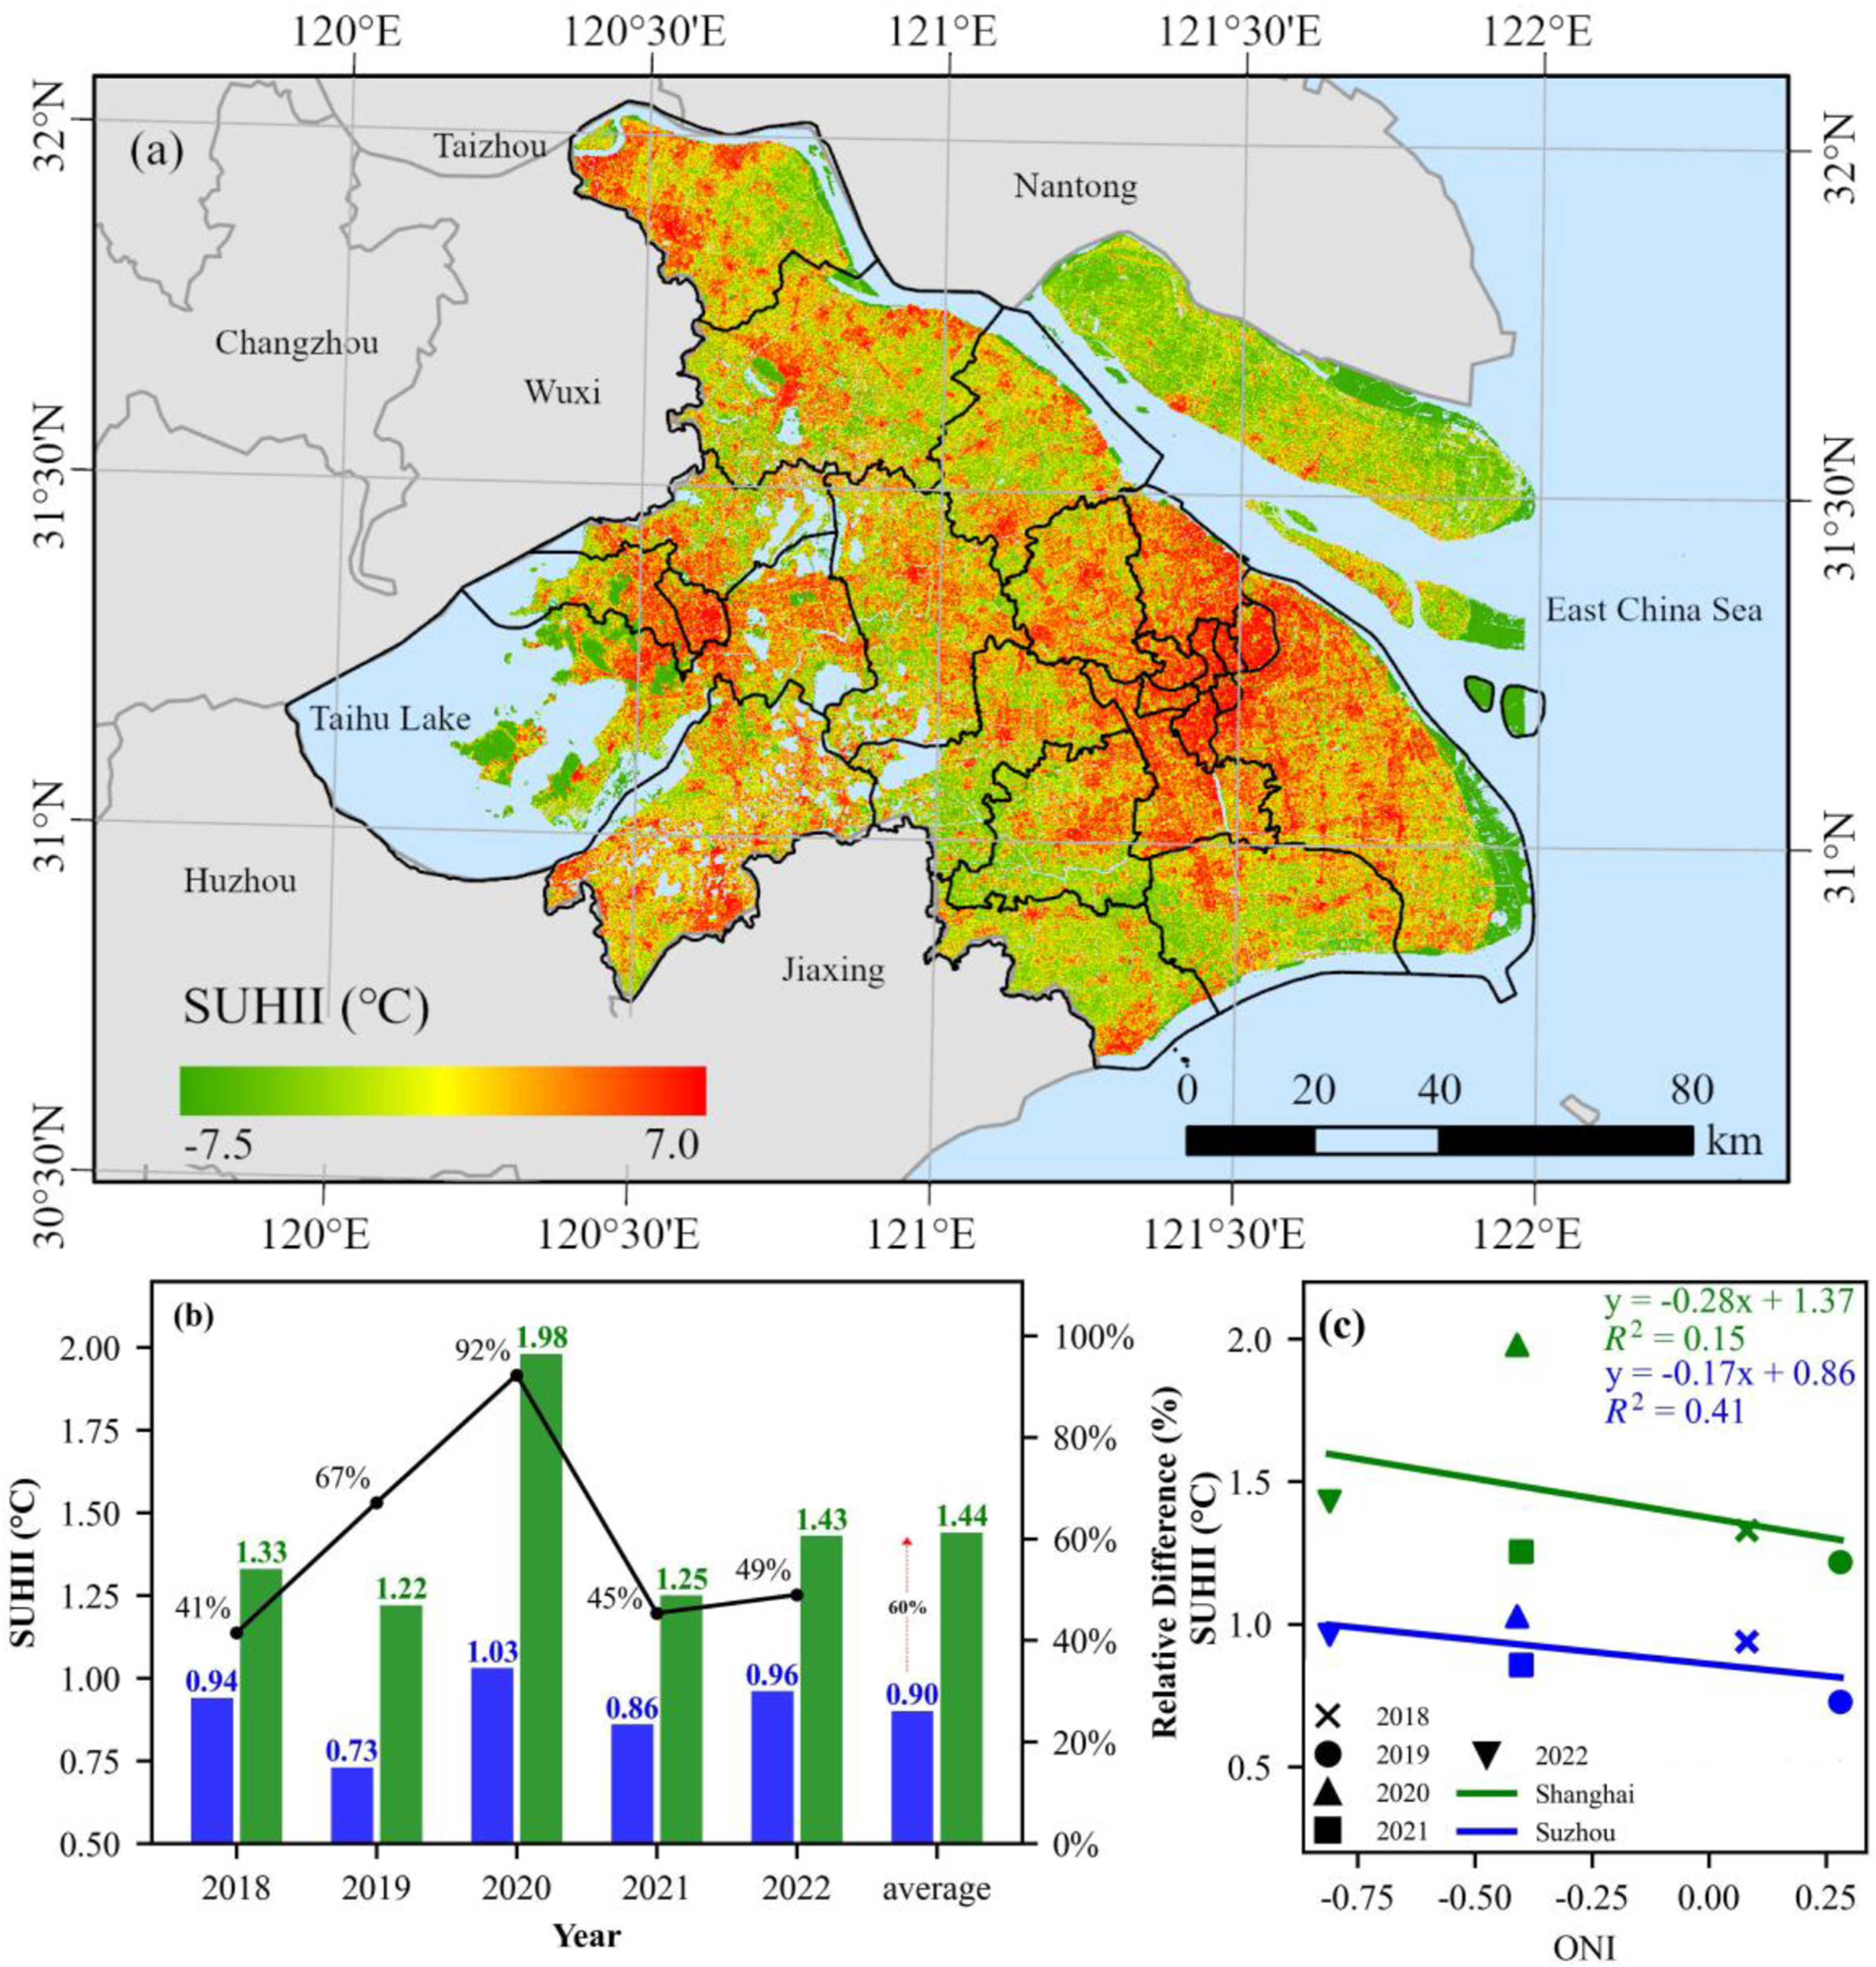
Figure 5(b) shows the interannual variation of the annual mean SUHII during 2018–2022 for Shanghai and Suzhou. Shanghai consistently exhibited higher SUHII than Suzhou, with an average absolute difference of 0.54 °C over the study period; this corresponds to a mean relative difference of 60% when referenced to Suzhou. The largest inter-city difference occurred in 2020 (0.95 °C), corresponding to a 92% relative difference compared with Suzhou.
Both Suzhou and Shanghai exhibit notable negative correlations between their annual average SUHII and the ONI (Figure 5(c)), indicating that SUHII levels in both cities increase as the ONI decreases. However, the strength and characteristics of this correlation differ between the two cities.
In Suzhou, the R2 value of 0.41 indicates a moderate-to-strong correlation, suggesting that SUHII levels are relatively sensitive to ONI variations. In contrast, Shanghai’s R2 value is only 0.15, indicating that ONI changes account for a smaller fraction of the variability in its SUHII levels. The weaker correlation in Shanghai may be partially attributed to an anomalously high SUHII value in 2020.
Despite the weaker correlation, the regression slope shows that Shanghai’s SUHII levels respond more strongly to ONI fluctuations (-0.28 for Shanghai vs. -0.17 for Suzhou). This suggests a greater sensitivity of Shanghai’s SUHII to ONI variations. Consequently, during stronger La Niña events, the SUHII gap between the two cities tends to widen, reflecting differing responses to large-scale climate dynamics.
3.3. The change of inter-LCZ SUHII caused by varying ONI
As shown in Figure 6(a), SUHII characteristics vary significantly across LCZ types in Shanghai and Suzhou. Among built-up LCZs, LCZ 2 has the strongest SUHII, with a 5-year average SUHII of 3.74°C in Shanghai and 3.45°C in Suzhou. LCZ 5 ranks second, with SUHII values of 3.56°C in Shanghai and 2.80°C in Suzhou, while LCZ 9 shows the weakest SUHII, with the values of -0.67°C in Shanghai and -0.02°C in Suzhou. In natural LCZs, SUHII effects are generally weaker, except for LCZ E and F, which exhibit slightly higher SUHII levels but cover less than 1% of the total area and have a limited impact. Inter-LCZ SUHII comparison between (a) Shanghai and (b) Suzhou during summer (2018–2022); (c) Differences in inter-LCZ SUHII between Shanghai and Suzhou (Shanghai minus Suzhou). (Produced by Python).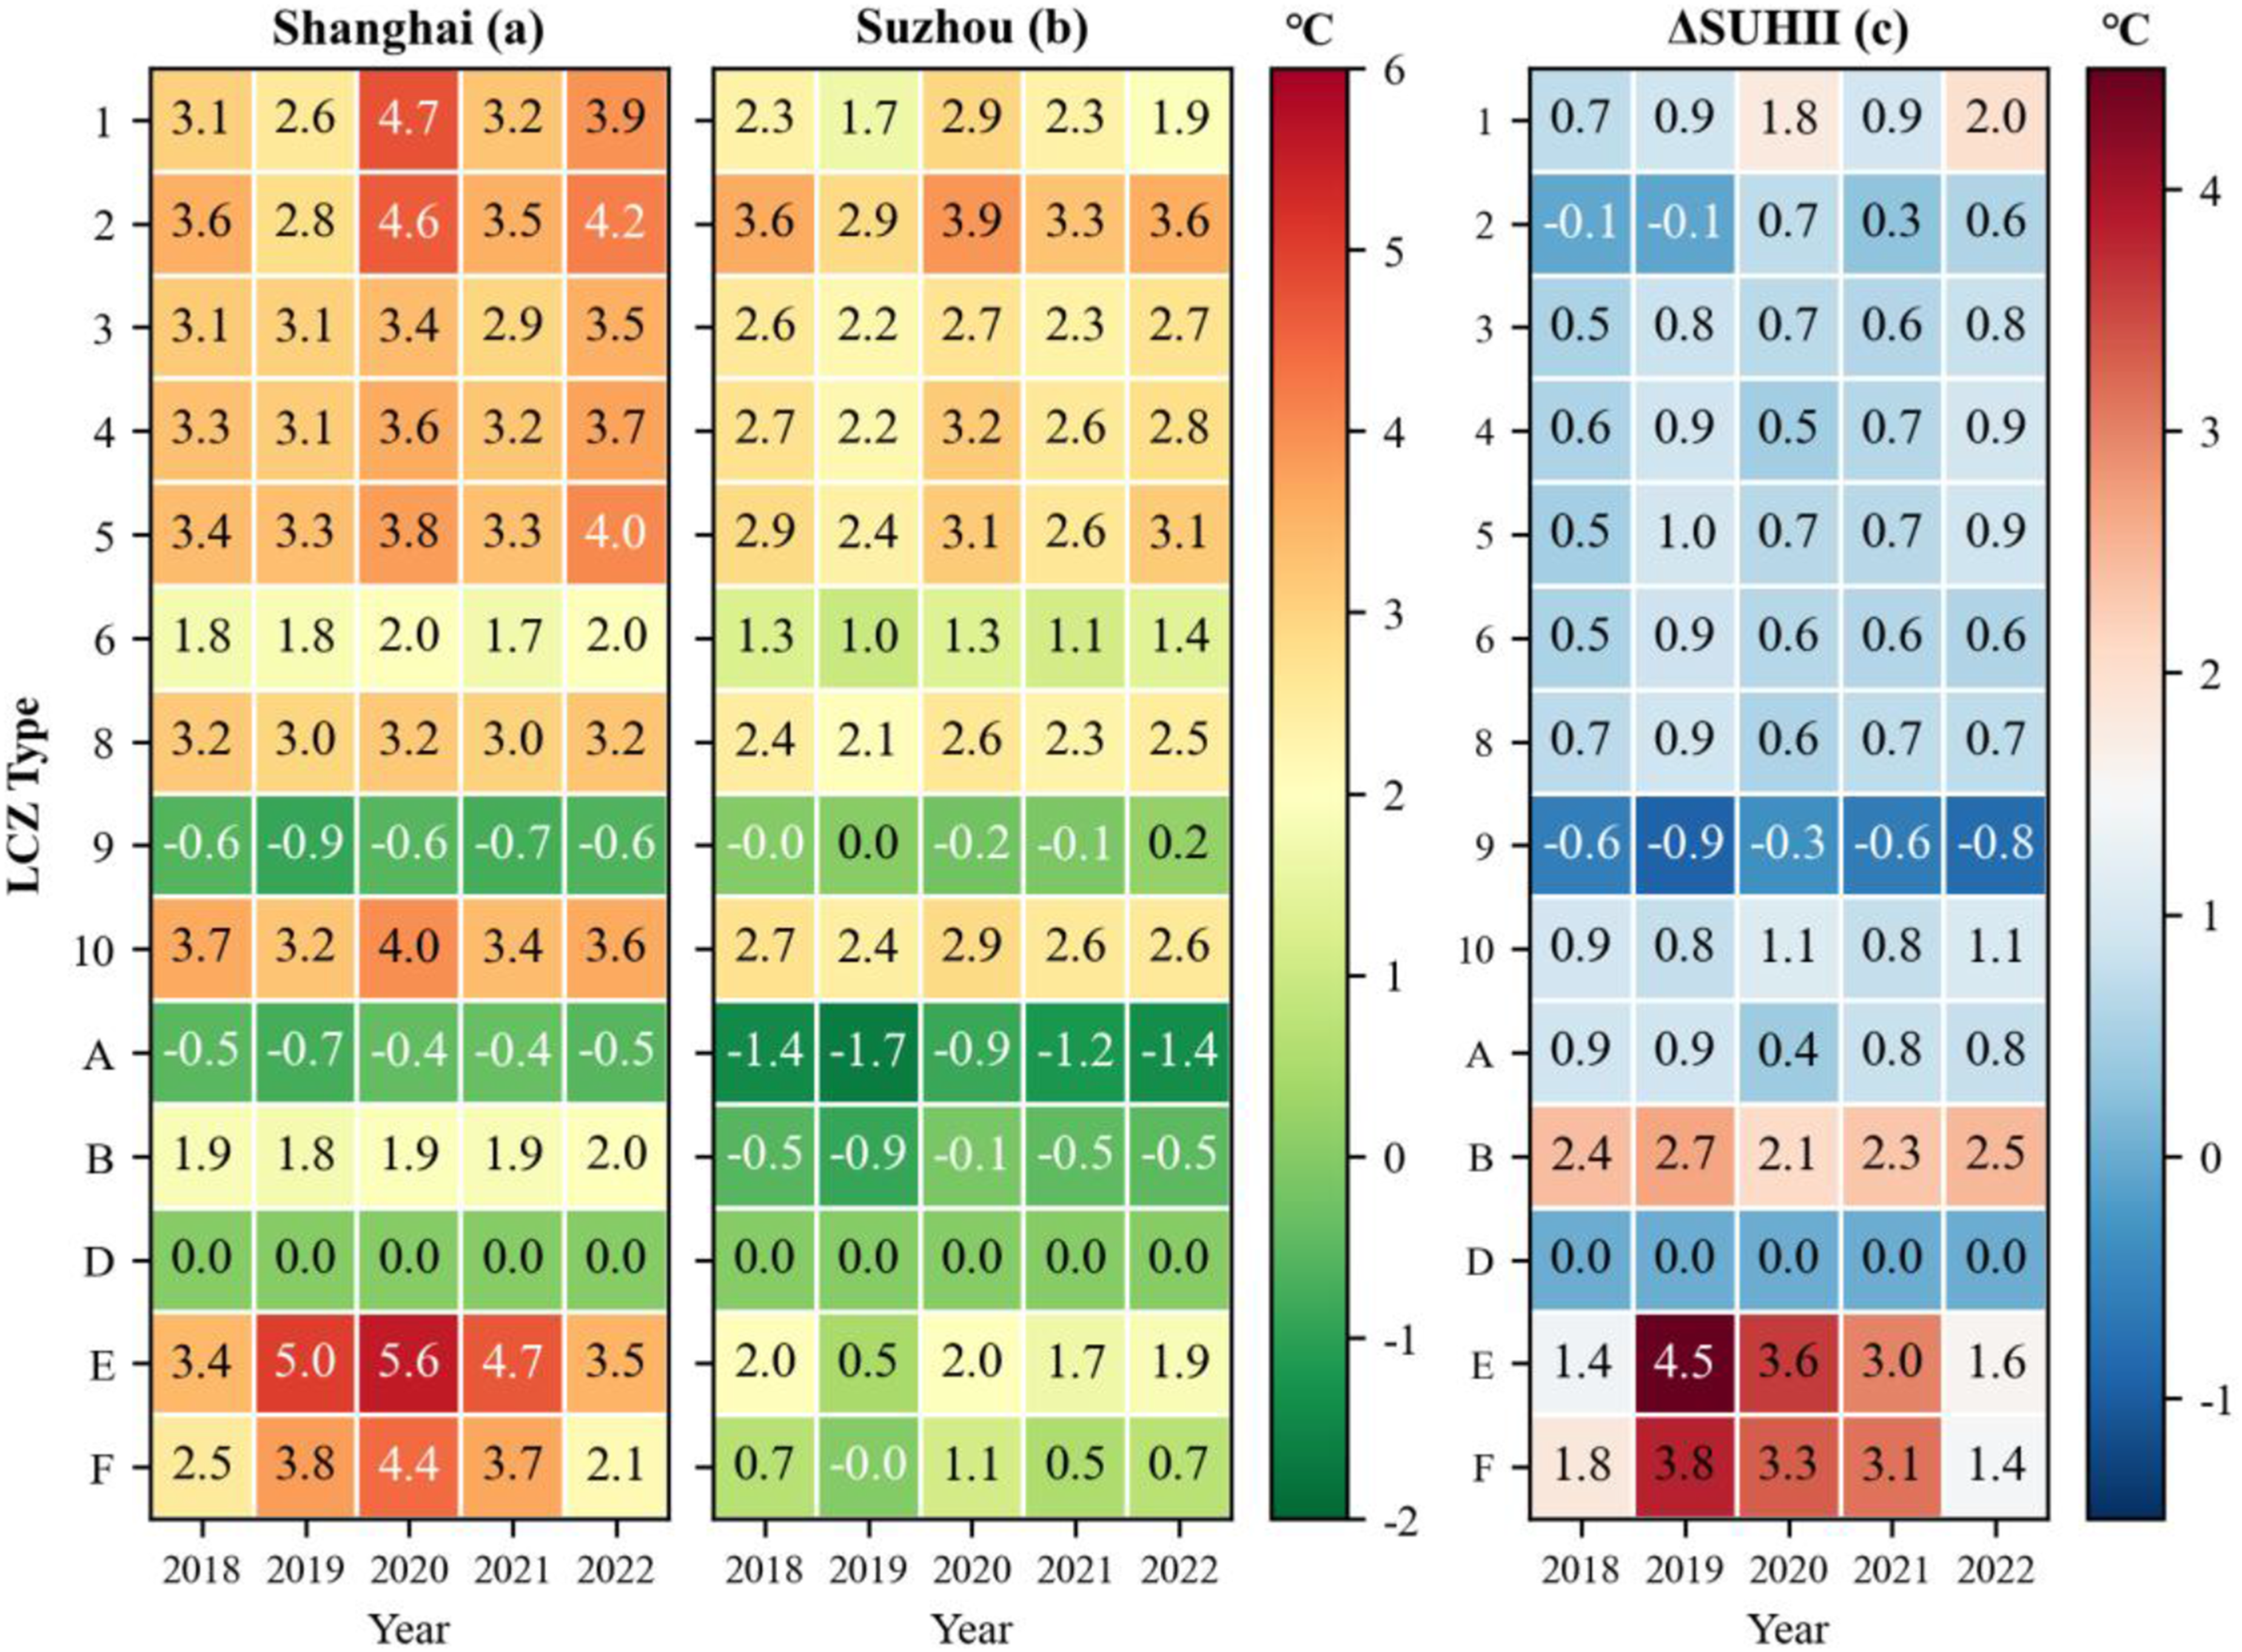
Figure 6(c) illustrates the differences in inter-LCZ SUHII between Shanghai and Suzhou. In built-up areas, Shanghai generally exhibits higher inter-LCZ SUHII values than Suzhou, with an average difference of about 0.70°C. The greatest difference between the two cities occurs in LCZ 1, with an average difference of 1.27°C. The largest SUHII difference of LCZ 1, reaching 1.97°C, was observed in 2022. The smallest SUHII difference between the two cities is found in LCZ 2, with a difference of only 0.30°C. In the vegetated LCZs (LCZ A-D), the inter-LCZ SUHII difference in LCZ B between the two cities is also pronounced, at approximately 2.4°C, making it the largest difference among all LCZs. LCZ E and LCZ F, representing non-vegetated types, cover relatively small areas (Figure 4(b)), and thus their values are not representative.
Figure 7 categorizes LCZs into four major types to explore the relationship between inter-SUHII and ONI. Across all major types, a linear correlation exists between inter-SUHII and ONI. Compact (Figure 7(a)) and open (Figure 7(b)) LCZs demonstrate a stronger response of inter-LCZ SUHII to ONI compared to industrial and vegetated LCZs. Specifically, Shanghai’s compact LCZ exhibits the most pronounced response to ONI, with a slope of -0.98°C/ONI, significantly higher than Suzhou’s -0.37°C/ONI. This suggests that during intensified La Niña phases, Shanghai’s compact LCZ experiences a more pronounced urban heat island effect. The response of open LCZs in both cities shows similar slopes: -0.41°C/ONI for Shanghai and -0.44°C/ONI for Suzhou. Conversely, industrial and vegetated LCZs exhibit weaker responses to ONI. The correlation between inter-LCZ SUHII and ONI in (a) Compact, (b) Open, (c) Industrial, and (d) Vegetated LCZ types (Produced by Python).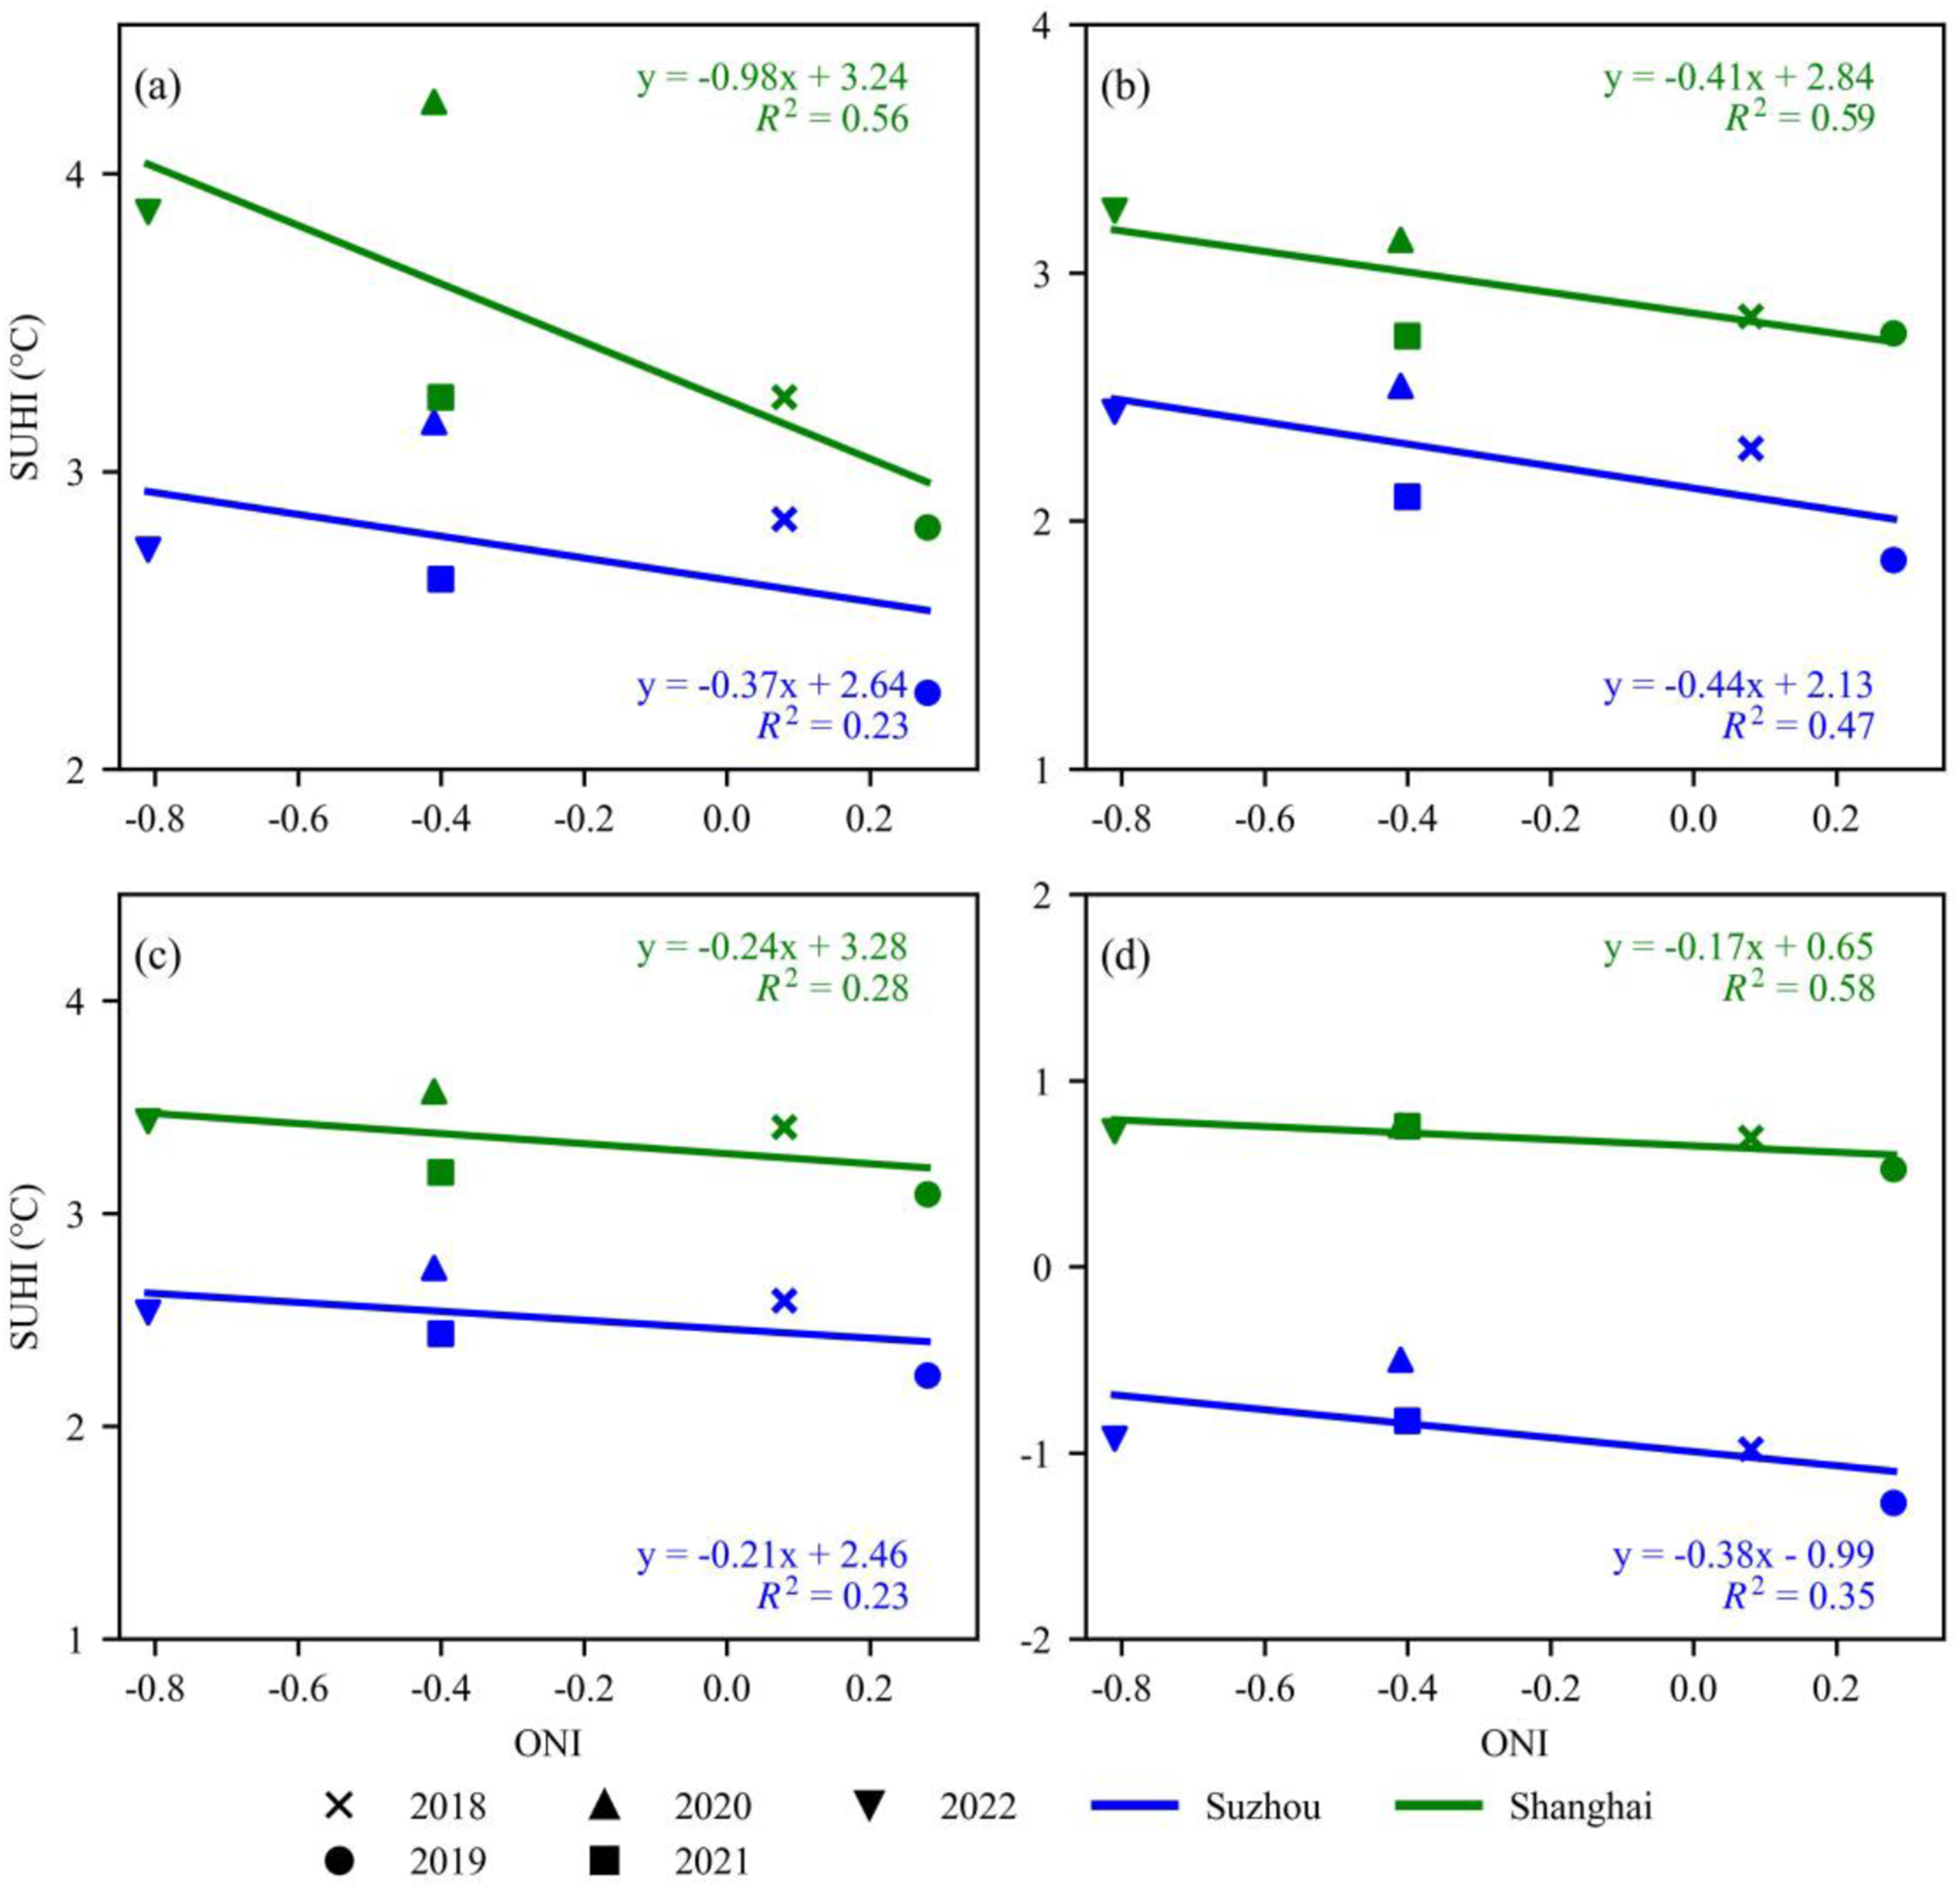
However, the ONI–SUHII relationship should not be interpreted as a fixed linear scaling across all years. ONI values in 2020 and 2021 are nearly identical (both close to −0.4), yet SUHII in 2021 is markedly lower, representing an anomalous departure from a linear expectation. And in 2022, even under relatively strong (more negative) La Niña phases, SUHII remains lower than the linear relationship would predict. Therefore, the linear regression in Figure 7 is best viewed as a first-order tendency, while acknowledging that nonlinearities and/or lagged effects may emerge under certain hydroclimatic states.
3.4. The change of intra-LCZ SUHII caused by varying ONI
The differences in intra-SUHII within different LCZs in Shanghai and Suzhou are illustrated in Figure 8(a) and (b). The average intra-SUHII across all LCZs is 1.68 °C for Shanghai and 1.86°C for Suzhou. Over 5 years, LCZ 1, LCZ 6, and LCZ B in Suzhou exhibit an average intra-LCZ SUHII exceeding 2.0°C, with LCZ B reaching the highest intra-LCZ SUHII at 2.54°C. In Shanghai, relatively high intra-SUHII values are predominantly found in natural LCZs, such as LCZ B, D, E, and F, averaging 1.97°C. According to Figure 8(c), intra-LCZ SUHII within built-up LCZ types in Shanghai is lower compared to that in Suzhou. However, intra-SUHII in vegetated LCZ types in Shanghai is higher than in Suzhou. Intra-SUHII of different LCZs during the summer (2018–2022). (a) and (b) are intra-SUHII of various LCZs in Shanghai and Suzhou; (c) Differences in intra-SUHII between Shanghai and Suzhou (Shanghai minus Suzhou) (Produced by Python).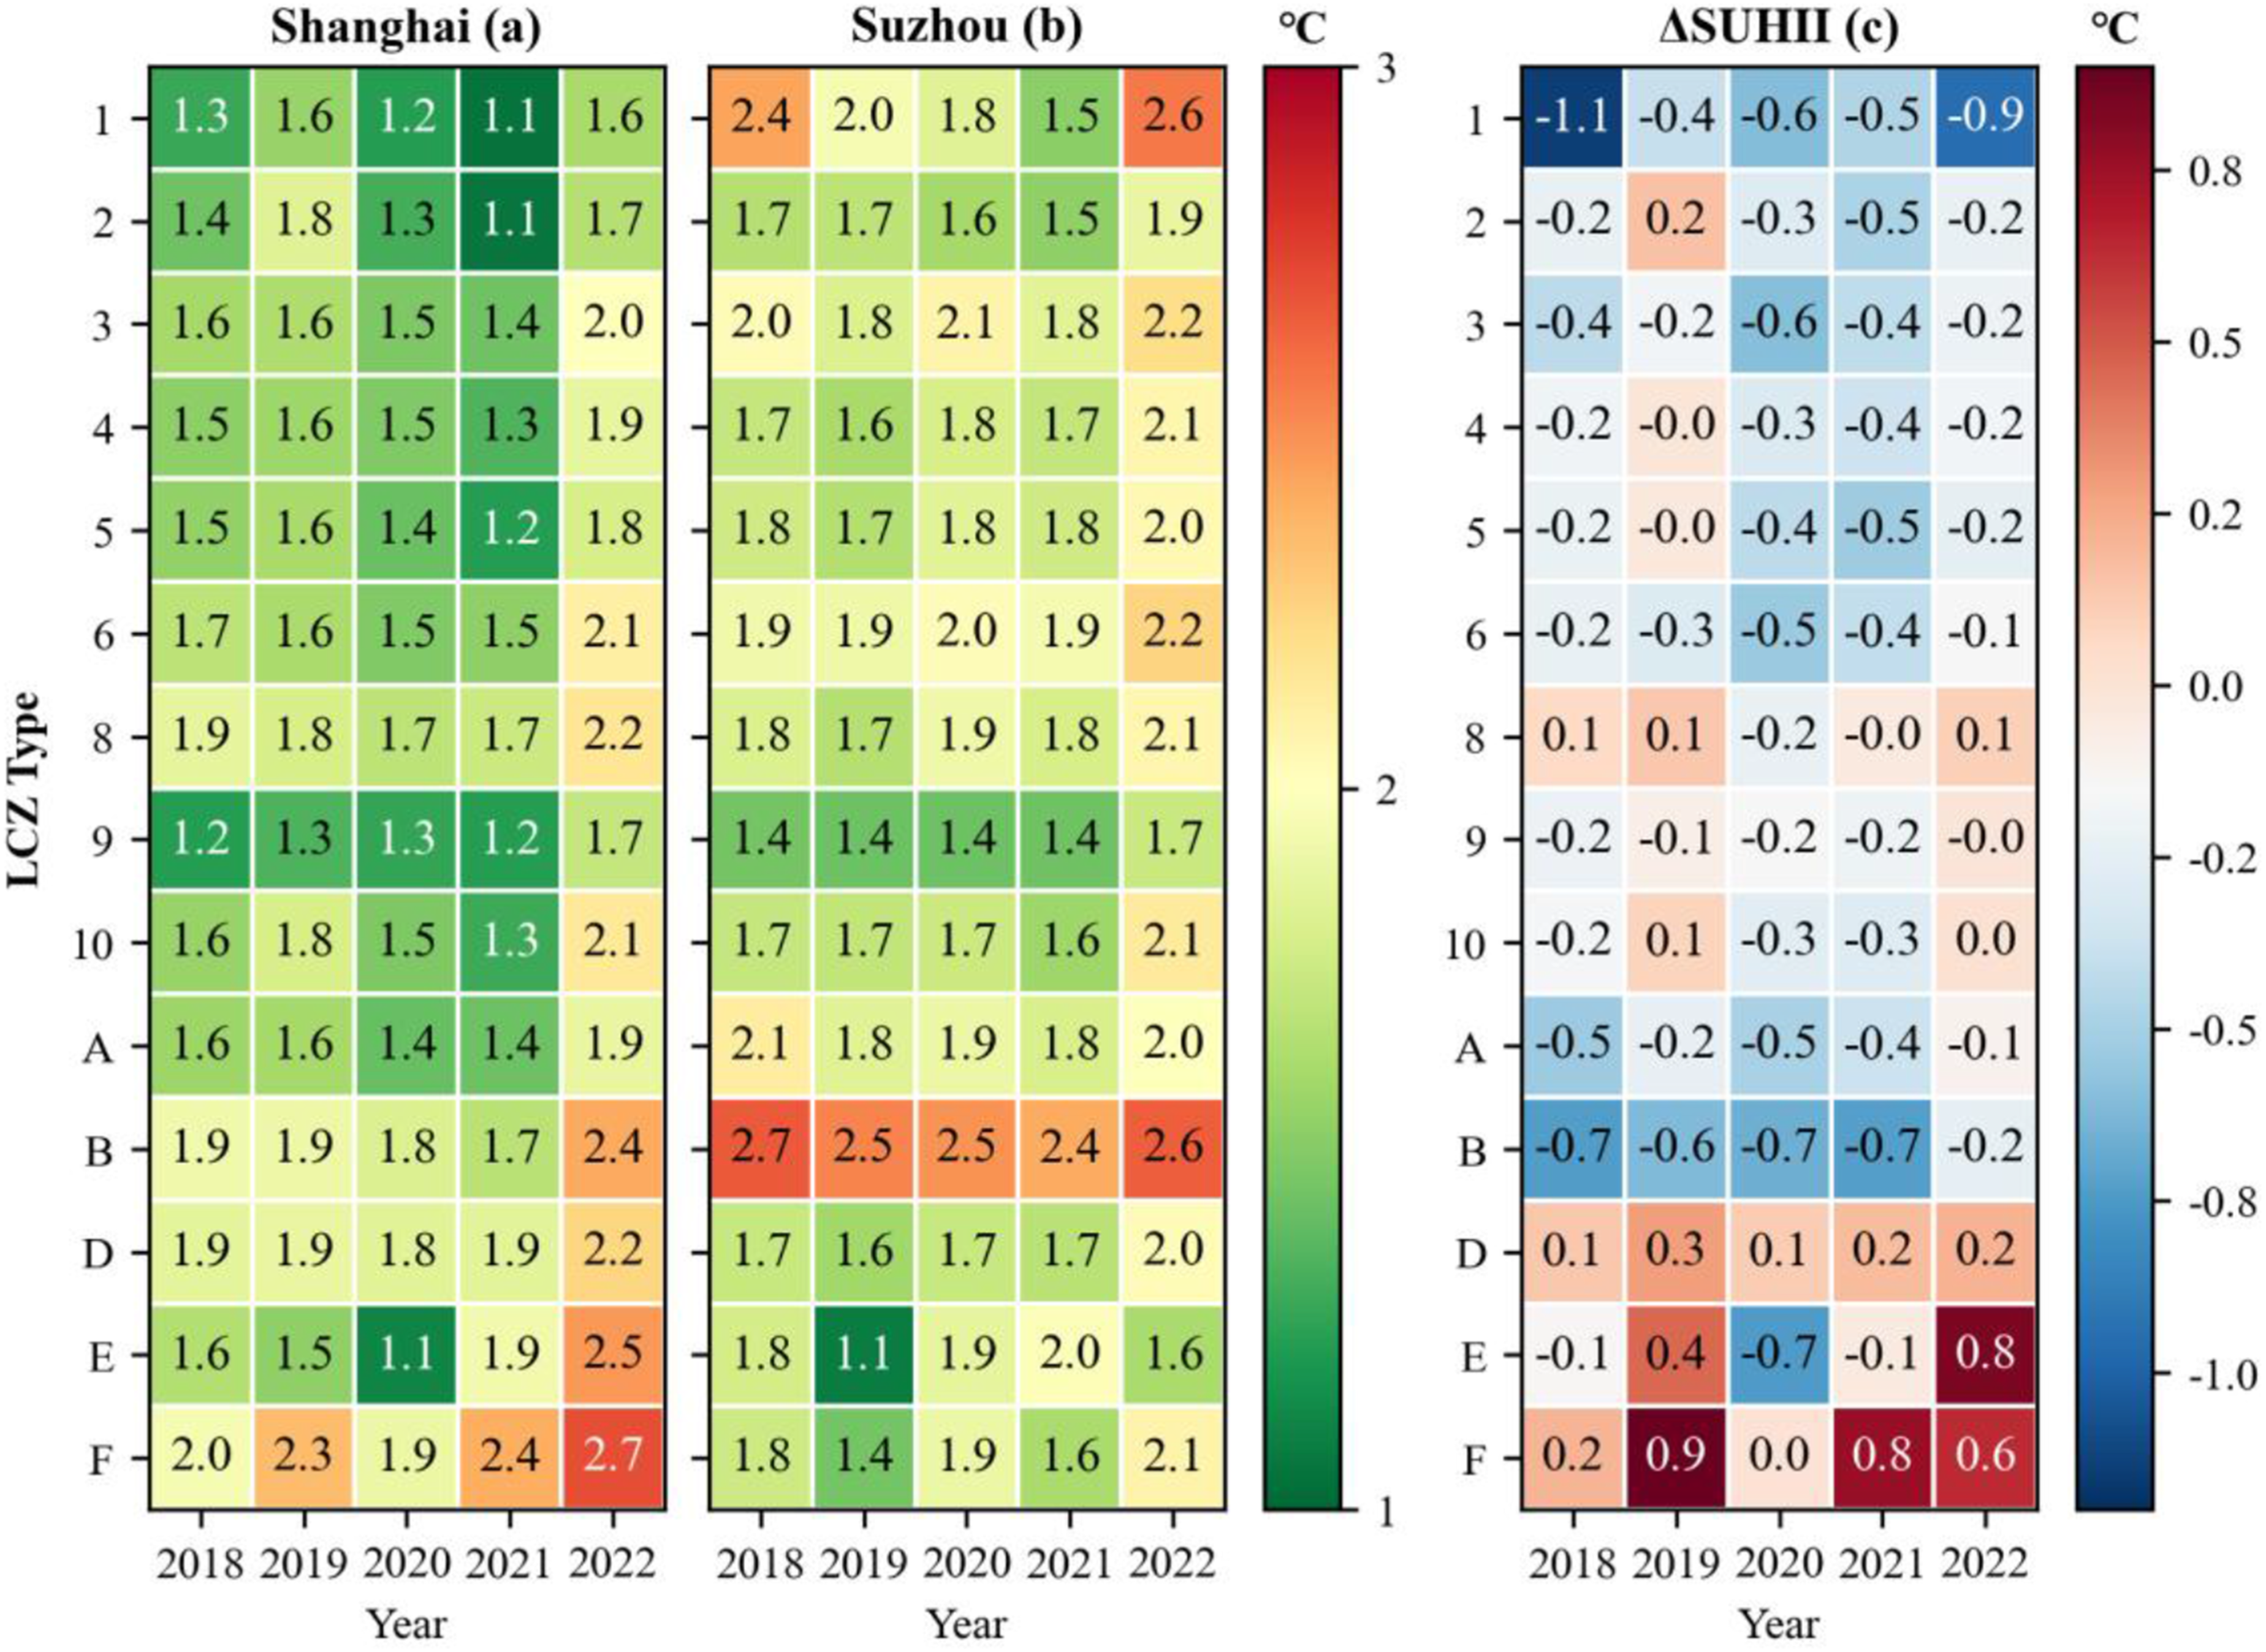
Suzhou and Shanghai exhibit closely correlated changes in average intra-SUHII with variations in ONI (Figure 9(e)). Quadratic polynomial fitting reveals R2 values of 0.93 (Shanghai) and 0.86 (Suzhou), indicating strong correlations between intra-SUHII and ONI for both cities. According to the fitting results, the values of intra-SUHII of Suzhou and Shanghai approach minimal values at ONI -0.18 and 0.08, respectively, both near ONI=0. This suggests that intra-SUHII reaches its minimum during periods without El Niño or La Niña effects. As the absolute value of ONI increases, indicating stronger El Niño or La Niña effects, intra-SUHII progressively increases. The correlation between intra-LCZ and ONI in (a) Compact, (b) Open, (c) Industrial, and (d) Vegetated LCZ types; (e) Correlation between the average intra-SUHII and the ONI in Shanghai and Suzhou, respectively. (Produced by Python).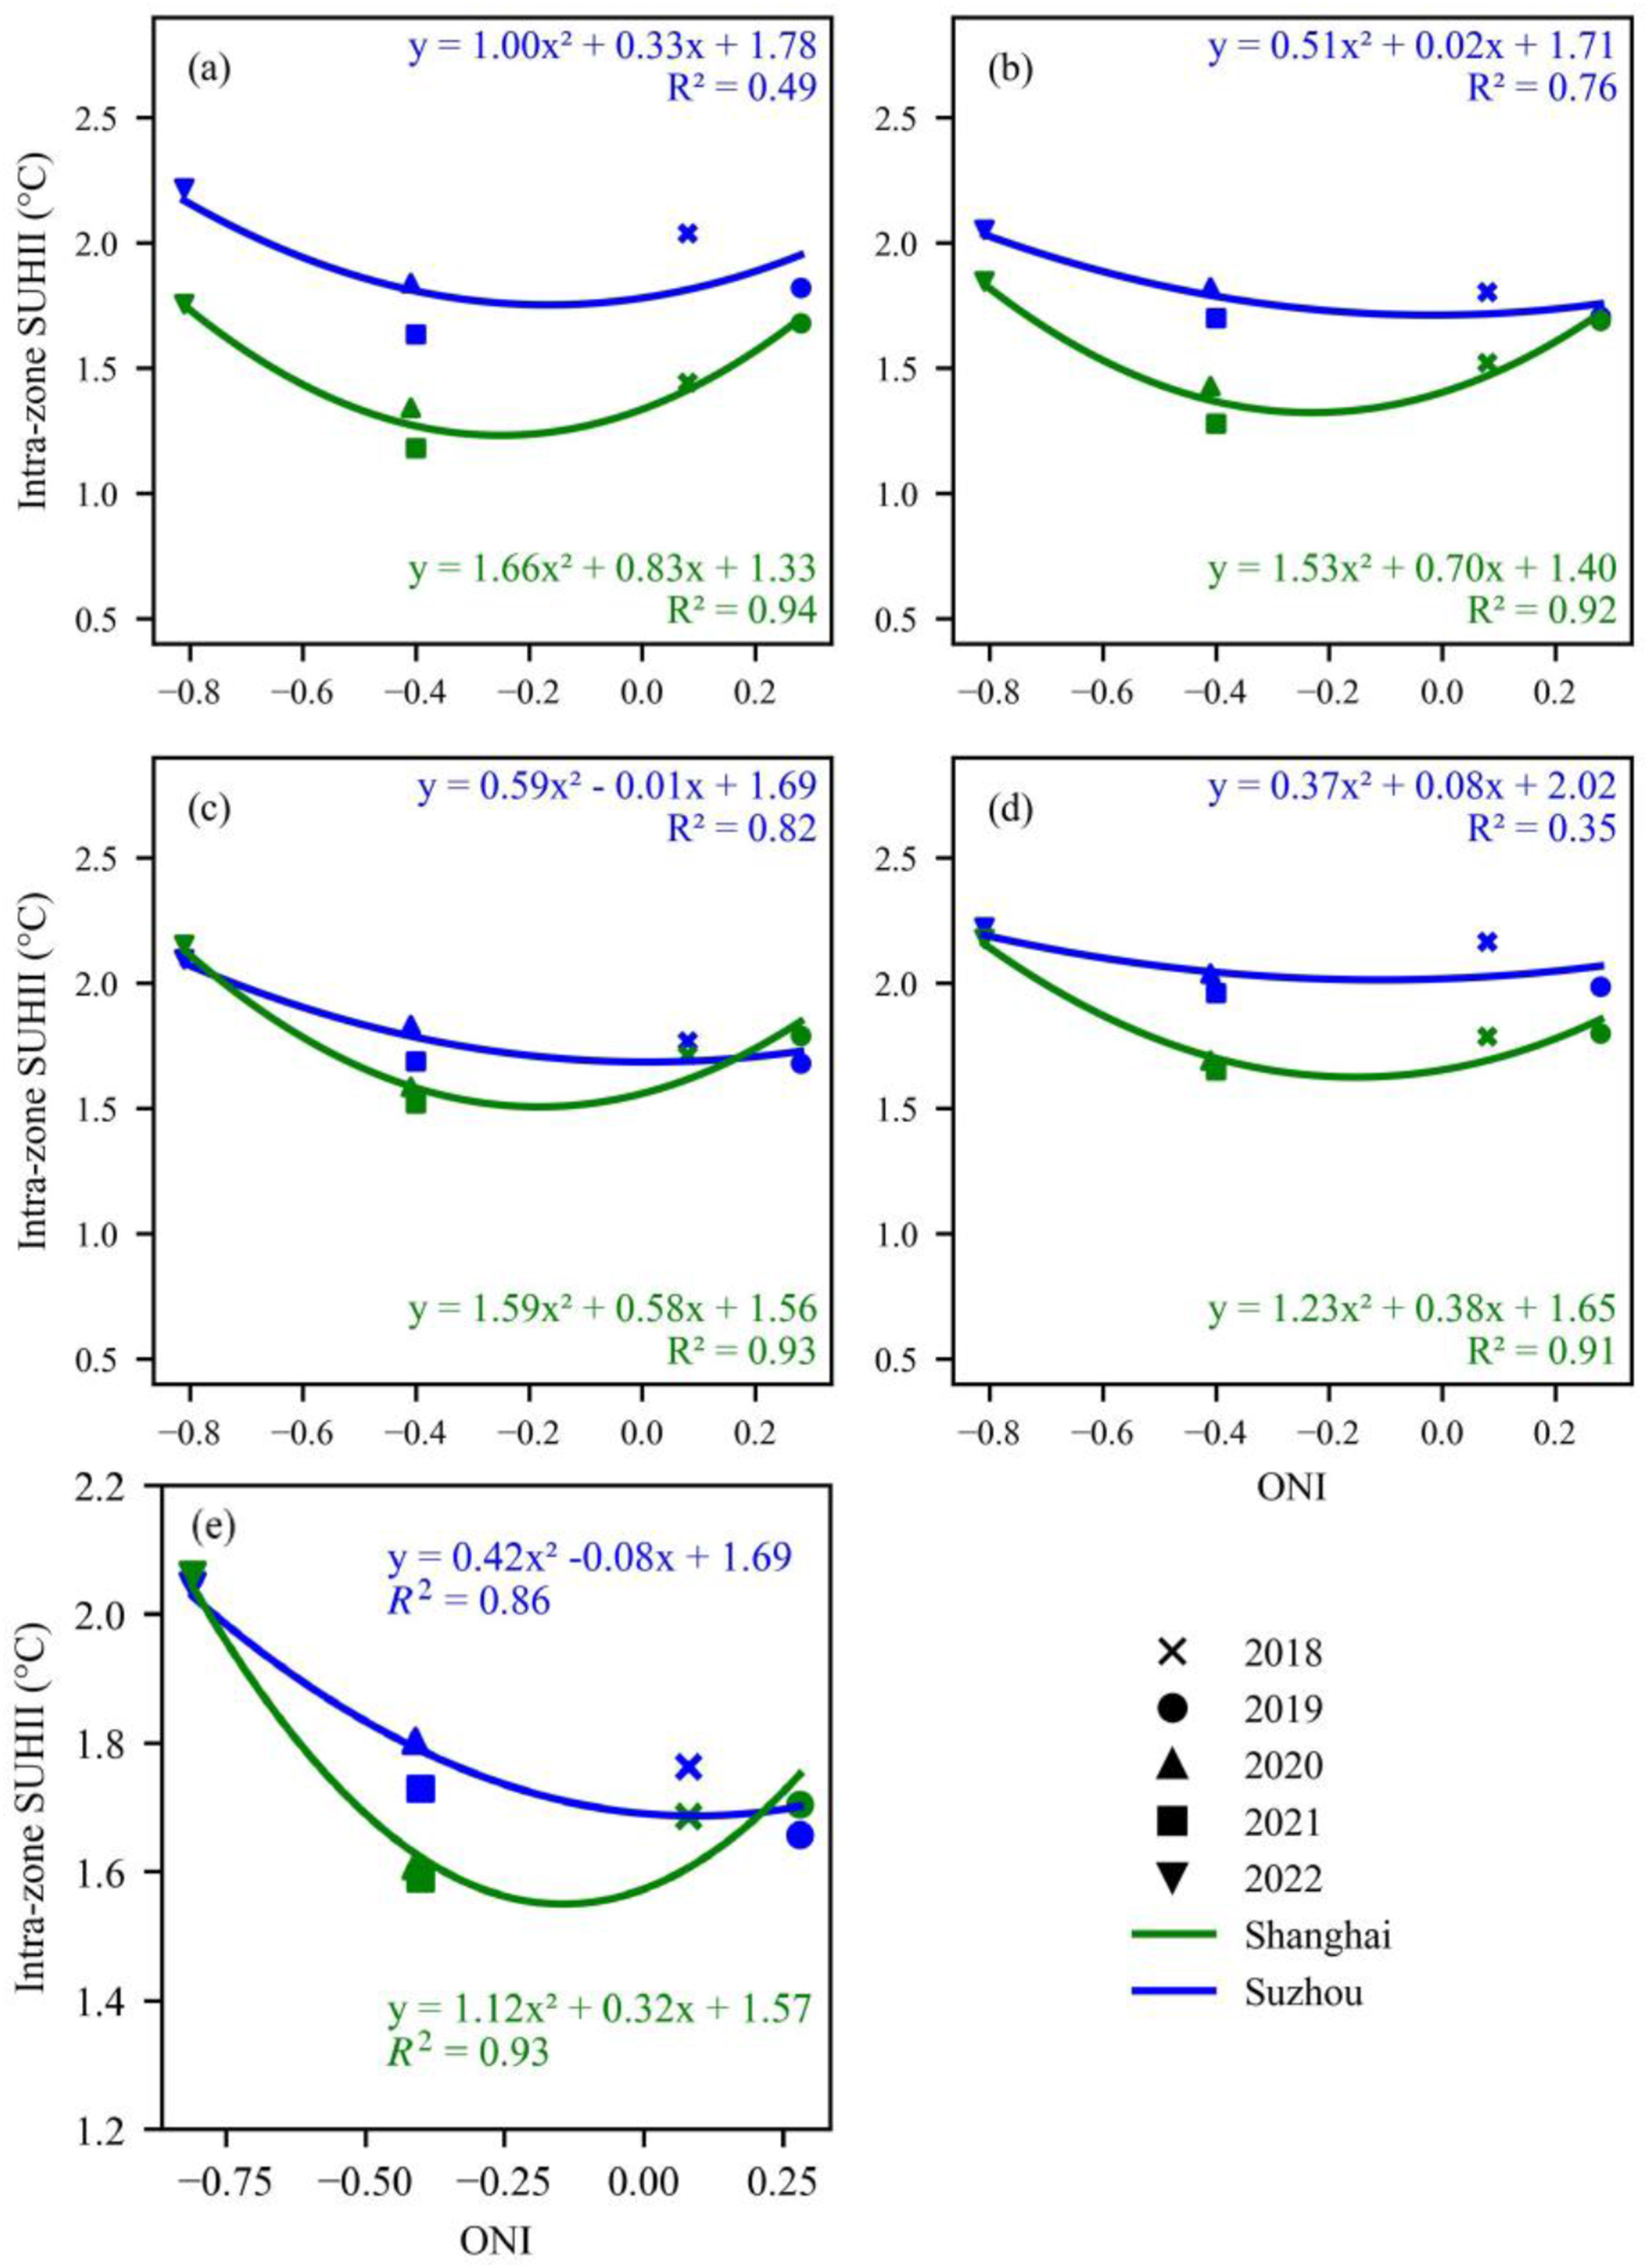
As shown in Figure 9, LCZs are classified into four major types to examine the relationship between Intra-SUHII and ONI across different categories. The results illustrate that this relationship exhibits a quadratic parabolic curve, akin to the regional average, with minimum values near ONI=0. As El Niño or La Niña effects intensify, average Intra-SUHII increases progressively across all types. Within each LCZ type, Intra-SUHII values in Suzhou consistently exceed those observed in Shanghai, highlighting higher spatial variability in Suzhou. Moreover, the response of intra-SUHII to ONI changes is more pronounced in Shanghai compared to Suzhou, underscoring Shanghai’s heightened sensitivity to climate variability.
4. Discussion
4.1. Urban morphology as a modifier: Inter-city contrast in SUHII
Our results reveal a notable inter-city contrast in the thermal (LST) response to background climate variations, with Shanghai exhibiting a significantly higher sensitivity to ONI changes than Suzhou. This discrepancy suggests that urban form may play an important role in modulating local climates. Urban thermal environments are widely recognized to be shaped by land-use/land-cover change and urban geometric/morphological characteristics. Neighborhood-scale studies consistently show that LST increases with proxies of built intensity and human activity (e.g., imperviousness, road/building density, building morphology, and population density), whereas vegetation and blue–green elements (e.g., NDVI, urban green space, and water bodies) exert significant cooling effects through shading and evapotranspiration.39–42
From the LCZ perspective, we observed a significant inter-city contrast: SUHII in both compact and open LCZs is systematically higher in Shanghai than in Suzhou (Figure 6(a),(b)). This difference may be partly related to differences in urban morphology between the two cities. Shanghai’s monocentric and high-density built form likely strengthens heat accumulation in compact/open LCZs, while Suzhou’s more polycentric structure, together with abundant cooling elements (water bodies and green space), helps fragment hotspots and buffer heat build-up, resulting in weaker SUHII. Moreover, the height restrictions imposed on buildings in historical conservation areas (average height ≤24 meters) facilitate natural ventilation. 43 Furthermore, Suzhou’s urban green coverage exceeds 44%, 44 while Shanghai’s is approximately 40%. 45 A higher proportion of urban green space effectively reduces surface temperatures through evapotranspiration. 46 Together, these factors make Suzhou’s urban morphology more favorable for mitigating heat accumulation and reducing SUHII.
The inter-city contrast is particularly pronounced in compact LCZs. On average, Shanghai’s compact LCZs exhibit a significantly higher SUHII than those in Suzhou by 0.70 °C. Compared with previous studies, the SUHII in Shanghai’s compact LCZs is higher than that reported for other Chinese megacities such as Guangzhou (3.07 °C) and Chongqing (2.92 °C). 47 This enhanced SUHII in Shanghai is consistent with its greater extent and intensity of compact development: the proportion of compact LCZs is higher in Shanghai than in Suzhou (12% vs. 7%, Figure 1(d)), and Shanghai also shows higher building density and a larger share of impervious surfaces, which together strengthen heat storage and retard cooling. 48 Moreover, Shanghai’s compact LCZs are embedded within a large, contiguous core of high-temperature areas and lack sufficient green corridors and low-density development zones to mitigate heat accumulation.35,49,50 These cumulative morphological effects—highly concentrated urban layout and relatively limited cooling pathways—further amplify SUHII in compact LCZs. 47
4.2. The regulatory effects of El Niño and La Niña on SUHII
Our results indicate that El Niño and La Niña act as external climate forcings on SUHII. As La Niña intensifies, the persistence of a stable subtropical high over the Yangtze River basin promotes hot, dry, and low-wind conditions,
51
which suppress evapotranspiration cooling and enhance heat retention.
23
Consequently, SUHII in both Shanghai and Suzhou increases significantly. Conversely, El Niño increases the likelihood of extreme rainfall, strengthening latent heat flux and weakening surface heating.
52
However, the ONI–SUHII relationship is not stable and can be influenced by multiple factors. Our results show that SUHII in 2022 was lower than predicted by the linear ONI-SUHII relationship despite record-high LST and intense La Niña conditions. This anomaly reflects the 2022 severe heatwave–drought compound event, which impaired vegetation transpiration and caused abnormal warming of LCZ D (as shown in Figure 10), thereby partially offsetting the expected increase in the urban-rural thermal contrast. NDVI and LST of LCZ d in Suzhou and Shanghai (2018-2022) (produced by python).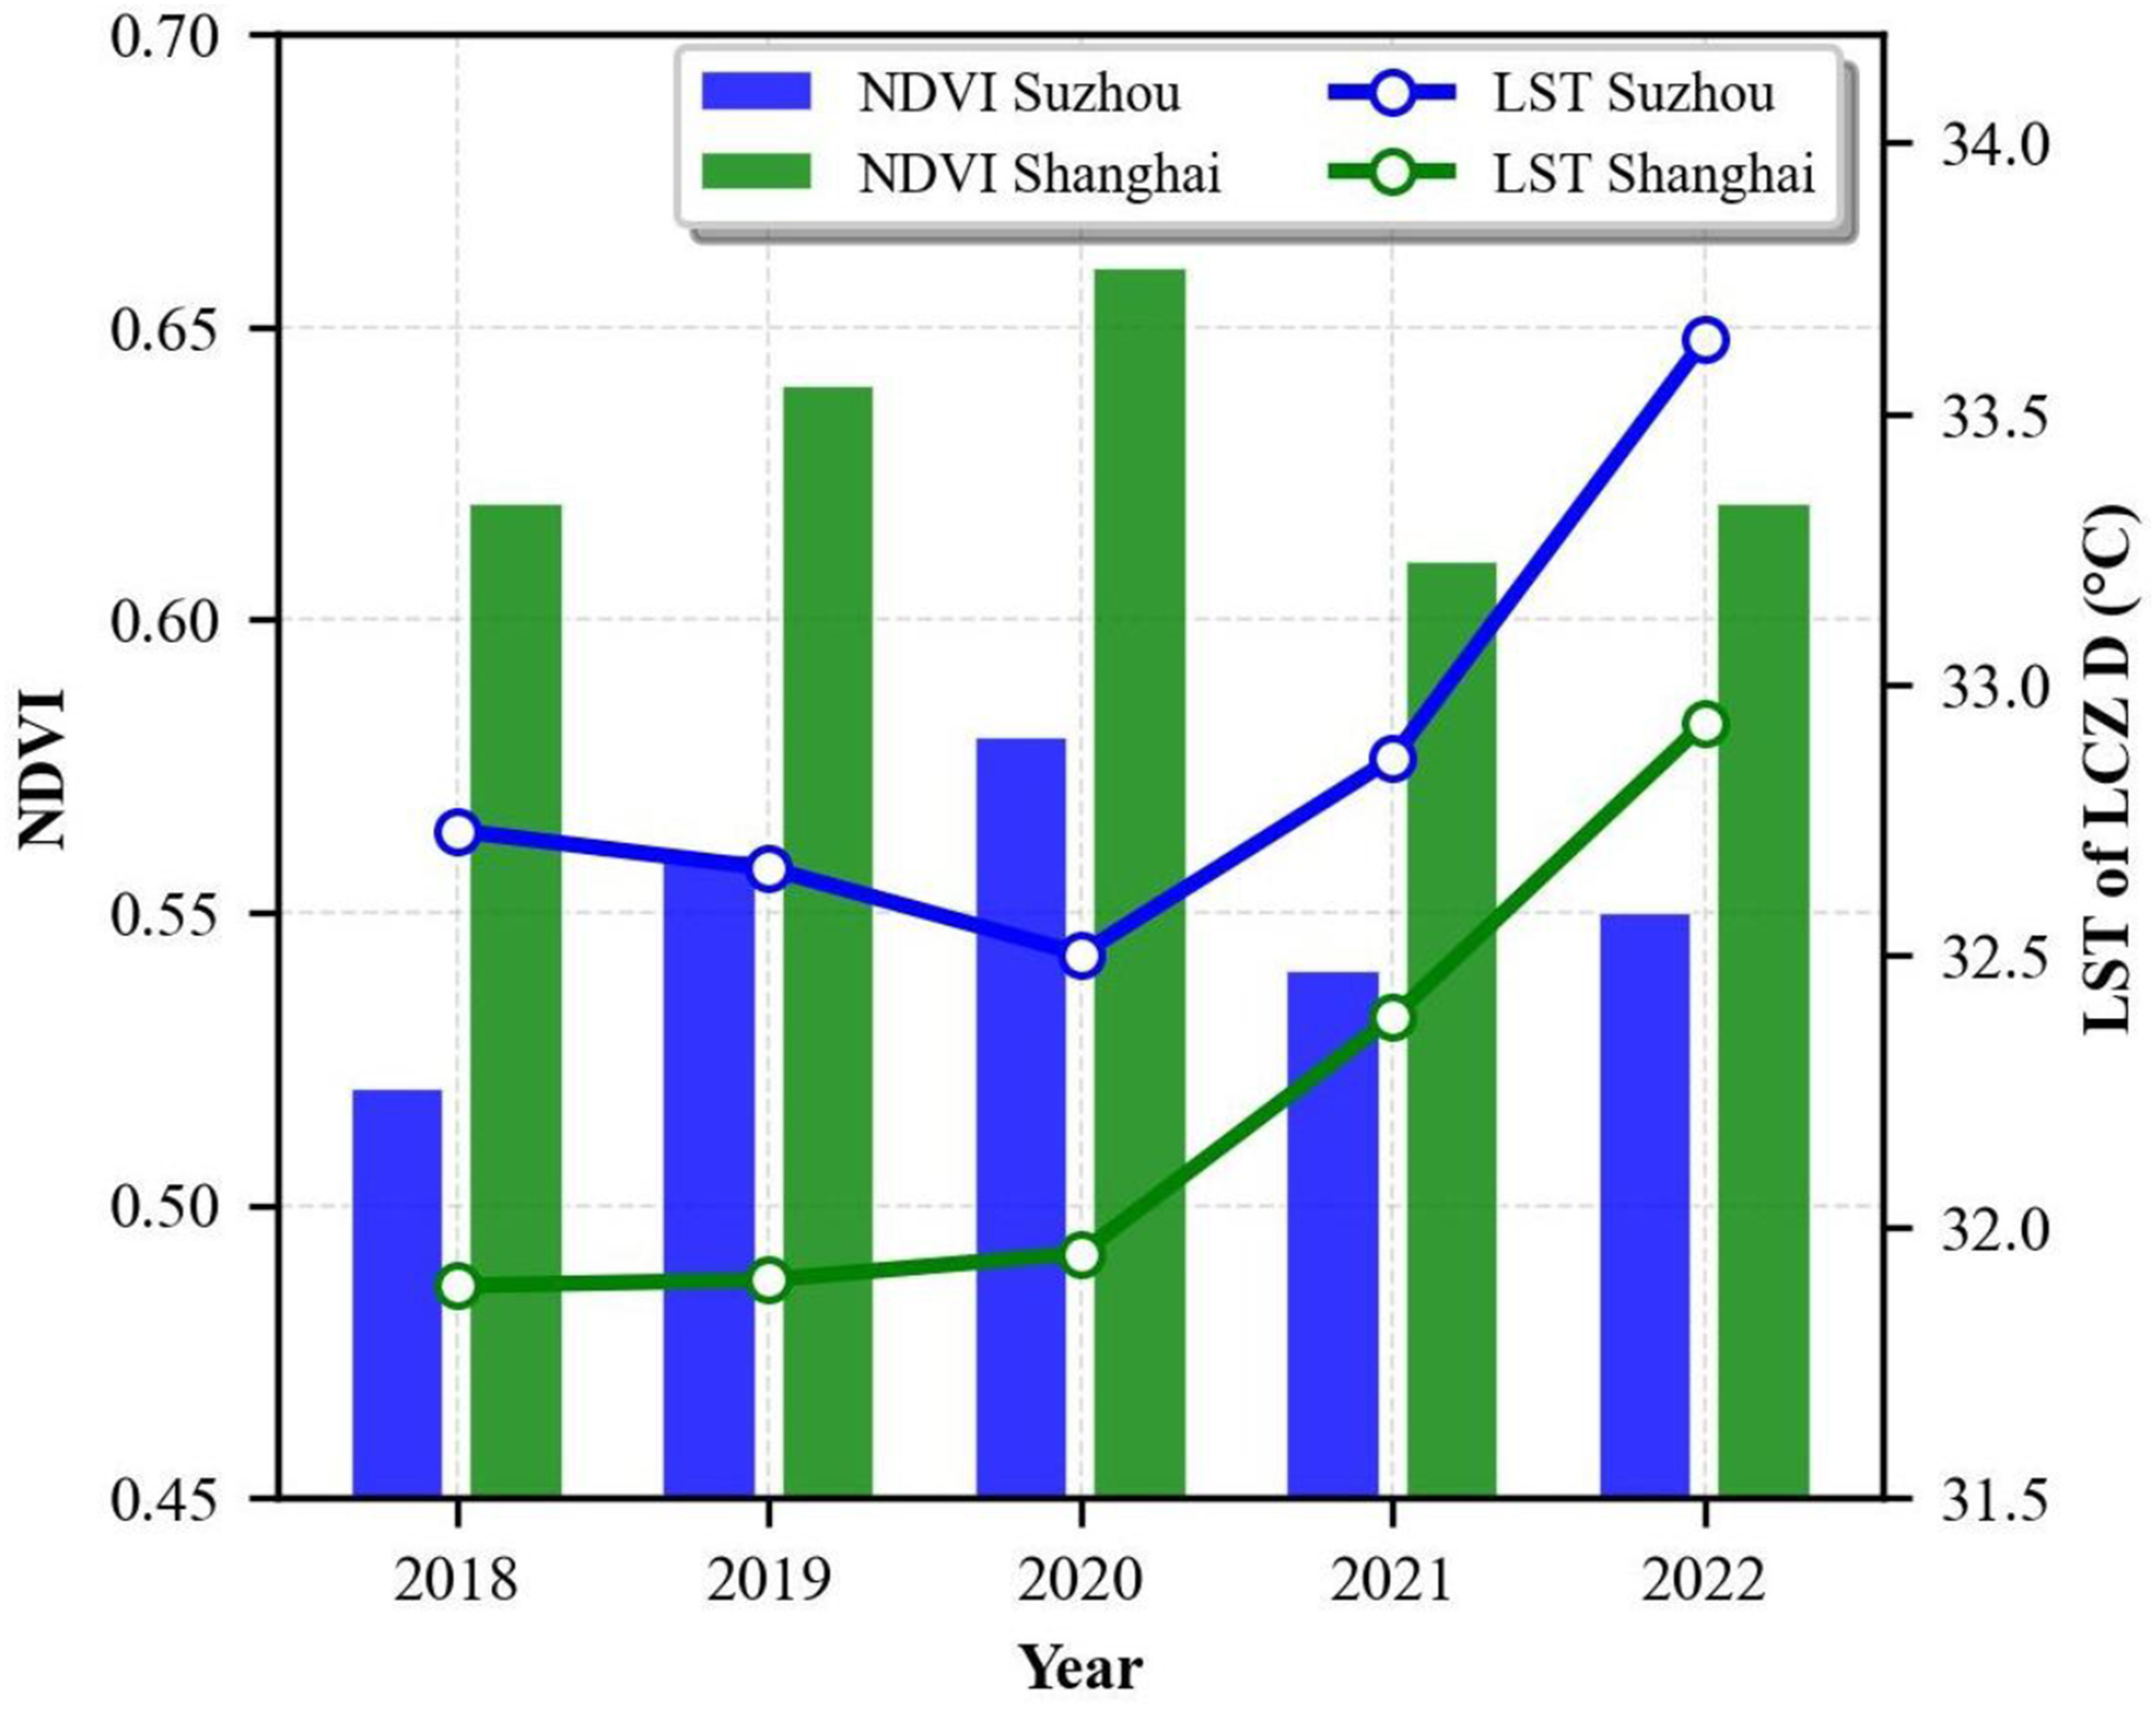
From a global perspective, although our results show that La Niña intensifies SUHII in the Shanghai and Suzhou, evidence from other regions indicates that the sign and magnitude of ENSO-related urban thermal responses depend strongly on regional climatic teleconnections. 53 For instance, in contrast to East Asia where La Niña exacerbates summer heat and drought, studies in Southeast Asia, Australia, and tropical South America often demonstrate that El Niño phases trigger severe heatwaves and suppress precipitation, thereby amplifying the urban heat island effect.54,55 Consequently, the ONI-SUHII relationship appears to be highly climate-dependent and cannot be uniformly generalized across global climate zones without accounting for differences in regional atmospheric forcing. Nevertheless, given the limited observational period, the potential influence of other climatic anomalies on the ONI–SUHII relationship remains insufficiently understood. Moreover, uncertainties in the LST product related to imaging conditions and spatial resolution may also affect the estimated relationship (see Section 4.4).
Even within the same region, however, the regulatory effects of El Niño and La Niña on SUHII are not fixed, but can be modulated by other large-scale ocean–atmosphere anomalies. In our study, for example, La Niña intensity was similar in 2020 and 2021 (ONI ≈ −0.4), yet SUHII differed markedly between the two years. In particular, SUHII in 2021 was substantially weaker, even lower than that observed in the mild El Niño year of 2018. This discrepancy is likely related to sea surface temperature anomalies in the Barents Sea, which intensified the southward displacement of the subtropical high and enhanced moisture transport in 2021. 51 The resulting extreme summer rainfall over the study area reduced surface heat accumulation 56 and thereby weakened SUHII. Nevertheless, given the limited observational period, the potential influence of other climatic anomalies on the ONI–SUHII relationship remains insufficiently understood. Moreover, uncertainties in the LST product related to imaging conditions and spatial resolution may also affect the estimated relationship (see Section 4.4).
4.3. LCZ-dependent ENSO sensitivity and planning implications
Our results show that ENSO-related variability is not expressed uniformly across urban space, but is conditioned by LCZ type and city context. In both cities, compact built LCZs exhibit the strongest inter-LCZ SUHII response to ONI, with a much steeper sensitivity in Shanghai than in Suzhou. This pattern is consistent with the broader LCZ literature showing that dense built forms tend to intensify surface heating because of higher heat storage, lower evapotranspirative capacity, and more limited cooling pathways.12,15,18 In this study, the climatic signal appears to vary across urban space and may be associated with LCZs where urban morphological controls on heat accumulation are relatively strong.
ENSO variability also affects thermal heterogeneity within LCZ classes, not only the mean urban–non-urban contrast. In both cities, intra-LCZ SUHII is lowest near neutral ONI conditions and increases as ONI shifts toward either El Niño or La Niña states, suggesting that climate anomalies can amplify localized hotspot variability even within the same morphological category. This interpretation is consistent with previous work showing that intra-LCZ thermal behavior reflects not only nominal LCZ class, but also finer-scale differences in vegetation, surface materials, and exposure conditions.22,38,57,58 Accordingly, ENSO-sensitive heat risk should be understood as involving both elevated mean SUHII and greater within-LCZ unevenness under anomalous climate states.
These results provide preliminary, planning-relevant screening cues for Suzhou and Shanghai. First, treating ONI < −0.5 as the highest-alert screening range is consistent with NOAA’s operational definition of La Niña conditions 59 and is also broadly supported by previous studies showing that La Niña can intensify summertime extreme heat over eastern China. 60 Compact LCZs may therefore warrant priority attention because they showed both the highest SUHII and the strongest ONI sensitivity, particularly in Shanghai (−0.98 °C per unit ONI, versus −0.37 °C per unit ONI in Suzhou). Under stronger La Niña conditions, possible anticipatory actions may include intensified hotspot surveillance in compact urban cores. At the same time, the intra-LCZ results indicate that thermal heterogeneity within LCZs also increases as ENSO departs further from neutral conditions, implying greater spatial unevenness in SUHII under stronger climate anomalies. Accordingly, earlier readiness of cooling services in high-risk neighborhoods and targeted short-term interventions in the most heat-sensitive zones may also be warranted.2,61
These implications should be limited to Suzhou and Shanghai and should not be directly generalized to other cities, including other polycentric urban systems. Even where polycentricity is present, transferability may still be shaped by differences in climatic background, such as humidity, rainfall variability, wind conditions, and regional ENSO teleconnections, as well as by differences in surface and substrate conditions and in the detailed configuration of urban design.8,51,62 In other words, polycentricity alone does not guarantee the same ONI–SUHII response observed in Suzhou 63 ; the spacing and connectivity of urban centers, 64 green–blue network continuity, 65 ventilation pathways, 66 and land–water settings may all alter the magnitude and even the direction of the response. The present findings should therefore be read as evidence-based planning guidance for the two study cities only, with broader applicability requiring further validation.
In addition, it should be noted that our results characterize surface thermal patterns (LST-based SUHII) rather than canopy-layer heat exposure, which limits their ability to directly interpret human thermal comfort. Experienced heat stress depends on near-surface air temperature, radiation, wind speed, and humidity, rather than surface temperature alone. Future studies could integrate air temperature or reanalysis data and include multi-variable comfort/heat-stress metrics to better link ENSO variability with human-relevant heat risk.
4.4. Limitations and future outlook
This study provides preliminary evidence of an ONI–SUHII association in the Yangtze River Delta, but several limitations should be acknowledged. First, our LST estimates are based on the MODIS LST product and are therefore subject to uncertainties related to sensor noise, cloud contamination, and retrieval conditions. Although we applied quality-control filtering, cloud masking, noise-reduction procedures, and 3-month summer mean compositing to reduce these effects, some uncertainty may still remain. In addition, the relatively coarse spatial resolution of MODIS may limit the accuracy of characterizing ENSO-related SUHII variations. With the growing availability of medium- and high-resolution LST products from multiple satellite platforms, 67 future multi-sensor datasets may provide longer time series and finer spatial resolution, offering a stronger basis for further investigation of the ONI–SUHII relationship.
Second, in this study ONI is defined as the JJA (June–August) mean. A potential “lag effect” would therefore imply that JJA SUHII is influenced not only by concurrent ONI_JJA but also by ENSO conditions in preceding months or seasons, via hydroclimatic persistence and land-surface “memory” (e.g., precipitation/soil moisture and related surface energy partitioning) that can carry over into summer. Such lagged ENSO influences on hydroclimate and land-surface states have been widely documented.68–71 To evaluate this possibility, we additionally examined alternative ONI averaging windows (e.g., MAM, DJF, and MJJ, see Table S2) against JJA. In our current record (2018–2022), these alternative windows yielded weaker relationships than the concurrent ONI_JJA, supporting the use of JJA-mean ONI as adopted in this study. Nevertheless, this result should not be interpreted as evidence against lag effects; rather, the limited 5-year sample restricts statistically robust inference of lagged relationships and their potential non-stationarity.
More broadly, SUHII variability is influenced by multiple interacting drivers, and the ONI-based relationship identified here should be interpreted as an association rather than a definitive causal effect. In addition to ENSO, concurrent meteorological anomalies, regional circulation patterns, and other large-scale ocean–atmosphere processes may also affect SUHII responses. Future studies using longer observational records and improved high-resolution datasets could help better constrain this relationship, extend the analysis to cities across different climatic regions, and further clarify the underlying mechanisms linking ENSO to urban heat island dynamics.
5. Conclusion
This study investigated how ENSO intensity, represented by the ONI, was associated with summertime SUHII across LCZs in Shanghai and Suzhou during 2018–2022. In both cities, SUHII generally increased under La Niña conditions and weakened under El Niño conditions, although several interannual anomalies indicate that additional climatic factors also influenced the observed variability. The ONI–SUHII linkage was LCZ-dependent. Regarding inter-LCZ variations, compact built types exhibited the strongest SUHII and the highest sensitivity to ONI, particularly in Shanghai, suggesting that dense and contiguous urban form can intensify the surface thermal response to large-scale climate anomalies. Meanwhile, intra-LCZ SUHII exhibited a nonlinear pattern in both cities, with minimum heterogeneity near neutral ENSO conditions and higher variability under stronger ENSO phases. Overall, the comparative results indicate that urban morphology plays an important role in conditioning how ENSO-related climate variability is expressed across urban space. These findings provide support for LCZ-targeted heat mitigation and suggest that predictable large-scale climate signals may be useful for anticipatory heat-risk planning in comparable climate-sensitive urban settings.
Supplemental material
Supplemental material - Comparing the urban heat island intensity response to ENSO across the local climate zones in Suzhou and Shanghai, China
Supplemental material for Comparing the urban heat island intensity response to ENSO across the local climate zones in Suzhou and Shanghai, China by Xuehe Lu, Suwan Chen, Mengru Zhang, Wenwen Zhang, Yihan Li, Xuan Cui, Qing Huang, Haidong Zhang and Qian Zhang in Science Progress.
Footnotes
We would like to thank the editors and the anonymous reviewers for their constructive comments and suggestions, which substantially improved the quality and clarity of this manuscript.
Ethical considerations
This study did not involve human participants or personal data. Ethics approval was not required.
Author Contributions
Xuehe Lu: Writing – original draft, Visualization, Software, Methodology, Formal analysis. Suwan Chen: Writing – review & editing, Software, Methodology. Mengru Zhang: Writing – review & editing, Supervision, Conceptualization. Wenwen Zhang:Writing – review & editing, Supervision, Conceptualization. Yihan Li: Writing – review & editing, Supervision, Conceptualization. Xuan Cui: Writing – review & editing, Supervision, Conceptualization. Qing Huang: Writing – review & editing, Supervision, Conceptualization. Haidong Zhang: Writing – review & editing, Supervision, Conceptualization. Qian Zhang: Writing – review & editing, Supervision, Conceptualization.
Funding
The authors disclosed receipt of the following financial support for the research, authorship, and/or publication of this article: This work was supported by funding from the Taishan Scholar project (tsqn202306210), the Postgraduate Research & Practice Innovation Program of Jiangsu Province (SJCX24_1885), and the Suzhou Academy of Agricultural Sciences (24031).
Declaration of conflicting interests
The authors declared no potential conflicts of interest with respect to the research, authorship, and/or publication of this article.
Data Availability Statement
The data that support the findings of this study are available from the corresponding author upon reasonable request.
Supplemental material
Supplemental material for this article is available online.
References
Supplementary Material
Please find the following supplemental material available below.
For Open Access articles published under a Creative Commons License, all supplemental material carries the same license as the article it is associated with.
For non-Open Access articles published, all supplemental material carries a non-exclusive license, and permission requests for re-use of supplemental material or any part of supplemental material shall be sent directly to the copyright owner as specified in the copyright notice associated with the article.