
Abstract
Objective
Despite advances in prevention, cervical cancer remains a serious global health issue. Concurrent chemoradiation is the standard treatment for locally advanced squamous cell carcinoma, yet 20–30% of patients develop persistent cervical cancer due to incomplete response, resulting in poor outcomes. This study aims to develop a predictive model for persistent cervical cancer in patients with locally advanced cervical squamous cell carcinoma following concurrent chemoradiation therapy, leveraging pretreatment multisequence magnetic resonance imaging data and advanced deep learning techniques.
Methods
This retrospective study included 259 patients with locally advanced cervical squamous cell carcinoma who underwent concurrent chemoradiation therapy at two centres. Four magnetic resonance imaging sequences were used to generate 2.5D data. A deep learning model incorporating Crossformer was developed and compared with radiomics and clinical models. Model performance was evaluated using receiver operating characteristic curves, calibration curves, and decision curve analysis.
Results
CrossFormer model outperformed the traditional convolutional neural network models in slice-level analysis across all cohorts, achieving an area under the curve of 0.775 in the test cohorts. The deep learning model achieved high predictive accuracy, with area under the curves of 0.884, 0.833, and 0.814 in the training, validation, and test cohorts, respectively, outperforming both the clinical and radiomics models. Combining clinical features with the deep learning model further improved performance, yielding area under the curves of 0.914, 0.868, and 0.839 in the respective cohorts.
Conclusion
The developed model, utilizing 2.5D multi-sequence magnetic resonance imaging data and the deep learning technology that incorporated Crossformer, demonstrated strong predictive performance for persistent cervical cancer in patients with locally advanced cervical squamous cell carcinoma following concurrent chemoradiation therapy. This approach offers a promising and clinically applicable tool for treatment decision-making.
Keywords
Introduction
Cervical cancer (CC) is the fourth most common cancer in women worldwide. 1 Although the incidence and mortality of CC have significantly declined with increased screening and the rise in human papilloma virus vaccination rates,2,3 the disease still causes approximately 350,000 deaths annually 1 and poses a serious and persistent threat to women’s health. CC therapeutic strategies are mainly based on the cancer stage and pathology type. 4 Squamous cell carcinoma of the cervix is the most prevalent pathological subtype, accounting for approximately 70–80% of all CC cases. 5 Locally advanced cervical squamous cell carcinoma (LACC), defined as stages IB3–IVA under the International Federation of Gynecology and Obstetrics (FIGO) classification,6,7 constitutes approximately 37% of all newly diagnosed cases. 8 Concurrent chemoradiation therapy (CCRT) is the primary treatment for LACC,5,6,9 and achieving complete remission (CR) of localized lesions after treatment is a key determinant of prognosis in patients with LACC. 6 However, studies indicate that 20–30% of patients with LACC fail to achieve CR after CCRT. 10 This group of patients, referred to as having persistent cervical cancer (PCC), presents significant treatment challenges.10,11 Therefore, accurately predicting the likelihood of achieving CR before CCRT is critical. This facilitates the establishment of a more individualized and rational treatment strategy before therapy initiation, potentially increasing CR rates post-CCRT and improving the prognosis of patients with LACC.
Magnetic resonance imaging (MRI), with its characteristics of multiparametric imaging, high soft-tissue resolution, noninvasiveness, and absence of ionizing radiation,12,13 is particularly suitable for evaluating primary lesions of CC and is now considered the optimal modality for staging CC.12–15 Therefore, MRI is an indispensable adjunctive examination for the pre-treatment evaluation and post-treatment follow-up of patients with CC. Tumor tissues from different patients with CC have considerable heterogeneity at the histological, cellular, and molecular levels,13,16 and these heterogeneities can be reflected in MRI. 13 However, MRI information identified by clinicians through the naked eye is often qualitative, 17 which may overlook the rich quantitative information embedded in MRI,18,19 and, consequently, the heterogeneity in different tumors. 13 Radiomics provides an effective method for identifying and processing quantitative information by extracting multiple quantitative features from images using high-throughput computational processes. This approach efficiently transforms images into quantitative data, providing more valuable information, 20 and allowing for the recognition of tumor heterogeneity. 13 In CC, MRI-based radiomics has been applied to several clinical aspects, including the analysis of clinicopathological features, lymph node metastasis prediction, prognostic evaluation, and evaluation of treatment efficacy.13,16,21–28 In recent years, deep learning has been widely applied in the analysis of radiological images. 29 In traditional radiomics, feature extraction relies on artificially designed, predefined mathematical formulas to quantitatively extract features with clear physical or statistical significance (e.g., shape, texture, first-order statistical features, etc.) from medical radiological images. This determines that traditional radiomics tends to overlook many higher-order, implicit features that cannot be manually defined, while deep learning is not subject to this limitation. It can automatically extract higher-dimensional, more abstract deep features. Consequently, deep learning-based models possess a higher theoretical upper limit for predictive performance. However, the non-intuitive, non-mathematically formalized feature extraction approach employed by deep learning inevitably leads to poorer interpretability. The integration of deep learning with handcrafted radiomics enhances predictive efficacy while maintaining a certain degree of clinical interpretability.30,31 Many studies have verified the effectiveness of incorporating deep learning into radiomics research.32–37
The most commonly used deep learning models for radiological image analysis are those based on convolutional neural networks (CNNs).38–40 while attention mechanism-based models (Vision Transformer, ViT, and its variants) have recently emerged as an important component of artificial intelligence–driven medical radiological image analysis approaches, owing to their ability to effectively capture long-range dependencies and global contextual relationships across different regions of an image. They have been shown to outperform CNNs in various medical radiological image analysis tasks and are considered to hold broad application prospects in the field of medical radiological imaging.41–43 Crossformer is a significant variant of the vision transformer, which further introduced a cross-scale embedding layer (CEL) and a long-short distance attention (LSDA) mechanism on the foundation of the vision transformer, 44 and multiple studies have demonstrated its good performance in medical radiological image analysis.45–48 Previous literature commonly extracted the slice with the largest region of interest (ROI) for model training, which may ignore substantial information contained within three-dimensional (3D) images, thereby limiting the model capabilities, 49 yet directly utilizing 3D images incurs considerable training costs and time consumption.50,51 The 2.5D technique that utilizes the slice of largest ROI along with its adjacent slices can effectively balance information completeness and computational efficiency. 52 Recently, several studies have validated the effectiveness of this strategy.53–57
This study aimed to predict the CR of localized lesions post-CCRT in patients with LACC using a 2.5D deep learning algorithm that incorporates Crossformer model, based on the pre-treatment multi-sequence MRI data. Figure 1 shows the workflow of this study. Workflow of this study.
Methods
Study cohort
Data was retrospectively collected from 259 patients with LACC who received CCRT at the General Hospital of Northern Theater Command and Shengjing Hospital of China Medical University. The patients were selected consecutively. Among these, 217 patients were from the General Hospital of Northern Theater Command and 42 were from the Shengjing Hospital of China Medical University. All patients were pathologically confirmed to have cervical squamous cell carcinoma before treatment and were staged as locally advanced according to the FIGO 2018 cervical cancer guidelines, and all received CCRT. Treatment was administered from 2021 to 2023, and all patients underwent pelvic MRI scans between 2 weeks and 1 month before starting treatment, followed by a second MRI scan 3 months post-treatment to assess efficacy. Exclusion criteria included: incomplete pre-treatment evaluation or post-treatment follow-up MRI data; or failure to complete the full course of CCRT due to complications or personal reasons. Figure 2 illustrates the patient selection process. The collected data included patients’ age at diagnosis, FIGO stage, the average diameter of the primary lesion, and MRI images pre- and post-treatment. The study was approved by the ethics committee of General Hospital of Northern Theater Command (Shenyang, China; approval No.Y2023-238; approval date: December 29, 2023), and conducted in accordance with the Declaration of Helsinki of 1975 (as revised in 2024). This study is a retrospective study and the requirement for informed consent was waived by the ethics committee. All patient details have been de-identified. Patient selection process.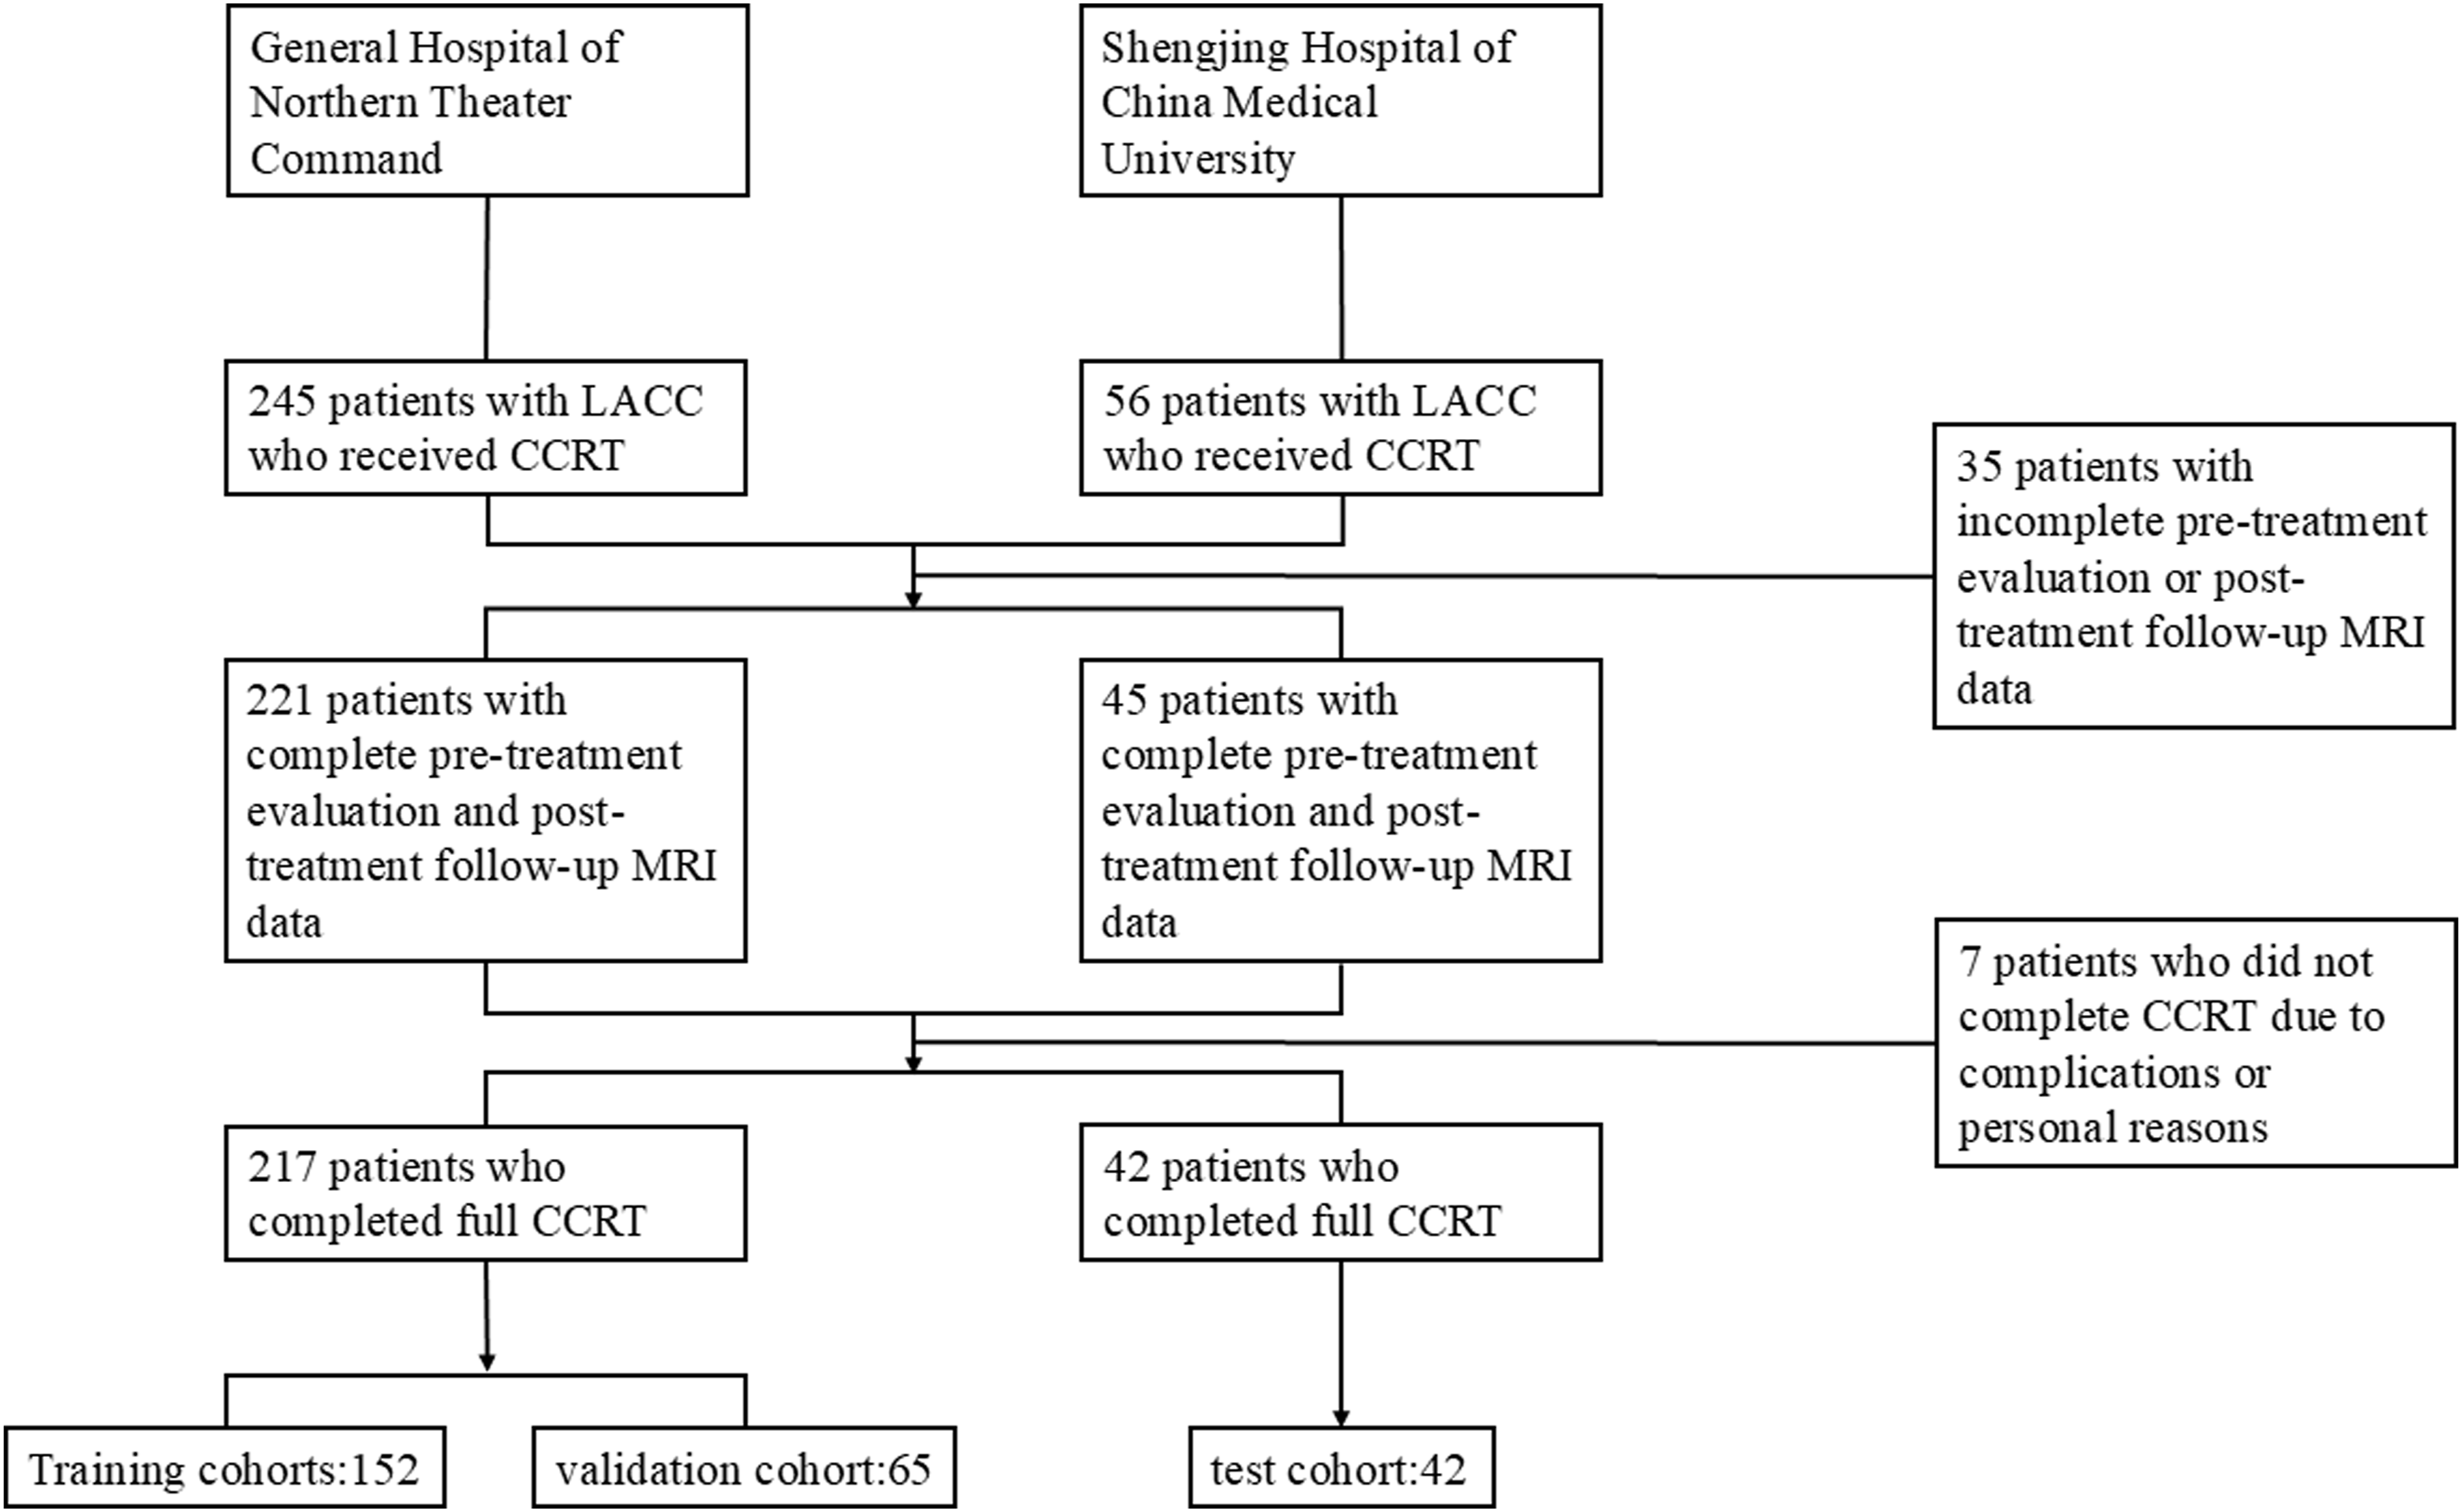
Baseline characteristics of cohorts.

Image acquisition
Patients from both centers underwent standardized scanning using the Philips Achieva (3.0-T) system. The acquisition sequences included T1_SPIR, T1_TSE, T2_SPAIR, and T2_TSE. MRI images were saved in the Digital Imaging and Communications in Medicine (DICOM) format. Pre-treatment images were used for modeling, whereas post-treatment were used to assess whether the local lesions achieved CR as determined by the Response Evaluation Criteria in Solid Tumors (RECIST) 1.1. 58
Image segmentation and preprocessing
First, the OKT-convert2nii tool on the Onekey platform was used to convert the MRI images from DICOM to nii. gz format. ITK-SNAP was then used to delineate ROIs in the T2_SPAIR images. Two experienced radiologists independently annotated the ROIs in a double-blind manner, with any discrepancies resolved by a radiologist with 20 years of experience. Subsequently, the OKT-registration tool from the Onekey platform was used to perform batch registration of the remaining sequence images. After batch registration, manual fine-tuning was performed using the ITK-SNAP. Following the registration process, masks were mapped to all sequences included in the study. Next, the RIAS software was employed to perform value-based resampling of the sequence images and masks, with the voxel spacing set to 1×1×1 mm.
2.5D deep learning
Traditional 2D deep learning often employs the maximum ROI slice for computation, which may neglect the three-dimensional information of the ROI. To overcome this limitation, we simultaneously select both the maximum ROI slice and several layers adjacent to it. This approach enables more comprehensive utilisation of the ROI’s three-dimensional information while simultaneously increasing the training sample size. This methodology is referred to in some literature as 2.5D deep learning. In this study, we define 2.5D data as the stack consisting of the slice of the largest ROI and its adjacent slices (positions +1, +2, and +4). The selection of this non-contiguous, exponentially increasing offset (+1, +2, and +4) aims to expand the model’s receptive field without increasing computational burden, thereby maintaining computational efficiency.
Data generation
First, identify the slice containing the maximum ROI cross-section. Subsequently, extract adjacent slices along the superior-inferior or anterior-posterior axis at positions +1, +2, and +4 relative to the maximum ROI cross-section slice. Meanwhile, extract the slices from different perspectives (transverse, sagittal, coronal) of the maximum ROI cross-section. This study incorporated data from four sequences: T1W_SPIR, T1W_TSE, T2W_SPAIR, and T2W_TSE. These slices were packaged to form 2.5D data.
Model training
During the training phase, we incorporated the generated 2.5D data into a deep learning framework to evaluate its effectiveness. We assessed the performances of several prominent deep learning architectures, including DenseNet121, ResNet101, ResNet50, and CrossFormer. Supplemental Figure 1 shows the workflow of Crossformer. We applied Z-score normalisation to the images, which were then used as model inputs. Real-time data augmentation techniques, including random cropping and horizontal and vertical flipping, were employed for training images. For test images, only normalisation was applied. Additionally, grayscale values of slices were standardised using a min-max transformation, and images were resized to 224 × 224 pixels using nearest neighbor interpolation. We optimised our training by adjusting the learning rate through a cosine decay strategy to enhance model generalisation, as detailed in the following equation:
Multi-instance learning modeling
We utilized a multi-instance learning (MIL) approach to enhance predictive accuracy. First, we used the deep learning model to predict each slice, obtaining corresponding probabilities and labels, denoted as 1. Predict Likelihood Histogram (PLH): (1) Each distinct number was treated as a “bin” to count occurrences across types. (2) Frequencies of 2. Bag of Words (BoW): (1) A dictionary was created from unique elements within
Finally, integrate 
After that, we performed dimensionality reduction and modelling on the features derived from MIL. During the dimensionality reduction phase, we employed techniques t-tests, correlation coefficients, and Lasso regularization. Subsequently, we employed multiple machine learning algorithms to model the reduced-dimensional features, the machine learning algorithms utilized including logistic regression, Support Vector Machin (SVM), and Random Forest. To address the class imbalance issue, we applied the Synthetic Minority Over-sampling Technique (SMOTE) to the training set. To ensure model robustness, we utilized 5-fold cross-validation within the training dataset and optimized hyperparameters through Grid-Search.
Traditional radiomics modeling and clinical features modeling
We extracted handcrafted radiomic features from four imaging modalities: T1W_SPIR, T1W_TSE, T2W_SPAIR, and T2W_TSE. The extracted features include geometry (3D shape of the tumor), intensity (statistical distribution of voxel intensities), and texture (higher-order spatial distributions). Furthermore, we performed Laplacian of Gaussian (LoG) and wavelet transformations on the images. When extracting texture features, we employed various techniques including the grey-level co-occurrence matrix (GLCM), grey-level run length matrix (GLRLM), grey-level size zone matrix (GLSZM), and neighbourhood grey-tone difference matrix (NGTDM). All features were extracted using the PyRadiomics tool (version 3.0.1), adhering to the Imaging Biomarker Standardization Initiative (IBSI) standards. Subsequently, we performed selection and modelling on the extracted traditional radiomics features. Subsequently, we performed feature selection and modelling on the extracted conventional radiomic features, and performed comparisons between traditional radiomic models and deep learning models. Supplemental Material 2 provides the detailed radiomics modelling process and results.
Moreover, we conducted analyses of clinical features using the same models applied to the 2.5D deep learning model. When constructing the clinical model and combined model, we utilized the clinical features presented in Table 1. Supplemental Material 3 provided the results of clinical features modelling.
Performance evaluation
We assessed the diagnostic performance of our deep learning model in the test cohort by constructing Receiver Operating Characteristic (ROC) curves. Additionally, we evaluated the calibration performance using calibration curves and tested the calibration capabilities using the Hosmer-Lemeshow goodness-of-fit test. Decision Curve Analysis (DCA) was also performed to ascertain the clinical utility of the predictive models.
Statistical analysis
Normality of clinical features was assessed using the Shapiro-Wilk test. Continuous variables were tested for significance using either the t-test or Mann-Whitney U test, depending on their distribution, while categorical variables were analyzed using Chi-square (χ2) tests. Table 1 presents the baseline characteristics of all cohorts, showing p-values >0.05 between the different cohorts, indicating no significant differences or an unbiased division between the groups. All data analyses were conducted using Python 3.7.12 on the OnekeyAI platform version 3.1.8. For statistical analysis, Statsmodels version 0.13.2 was utilized. Radiomic feature extraction was performed using PyRadiomics version 3.0.1. Machine learning algorithms, including the SVM, were implemented using Scikit-learn version 1.0.2. Our deep learning models were developed using PyTorch version 1.11.0 and optimized for performance using CUDA version 11.3.1 and cuDNN version 8.2.1. The reporting of this study conforms to STROBE guidelines. 59
Result
Slice level prediction results
Slice-level results of different deep learning models.
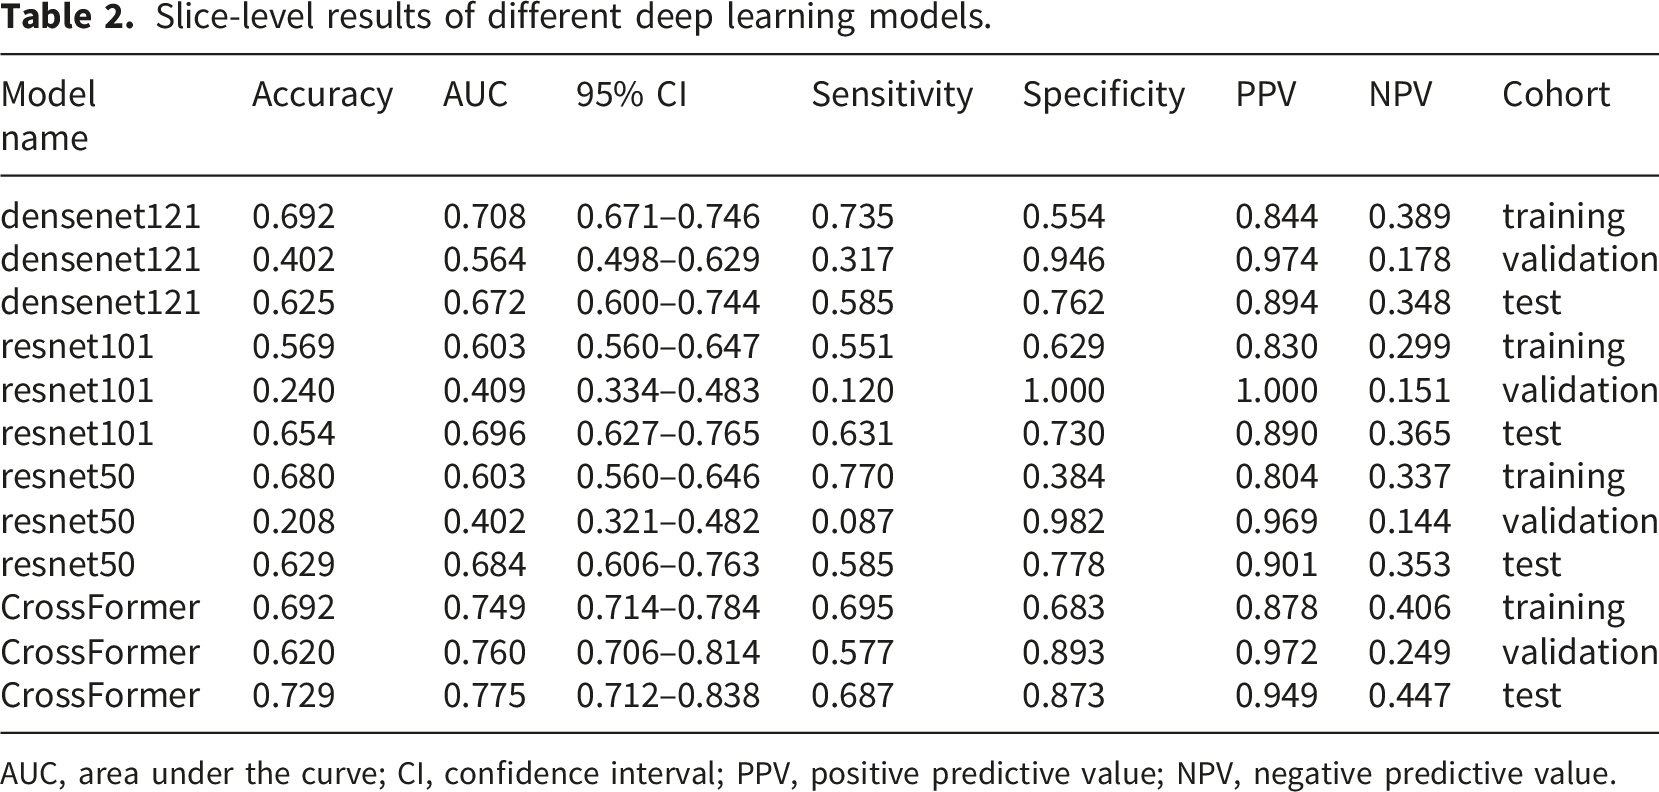
AUC, area under the curve; CI, confidence interval; PPV, positive predictive value; NPV, negative predictive value.

Receiver operating characteristic curves of different deep learning models in slice-level prediction.

Grad-CAM heatmaps of representative cases.
MIL fusion prediction results
Metrics of different machine learning methods in multi-instance learning models.

LR, logistic regression; SVM, support vector machine; AUC, area under the curve; CI, confidence interval; PPV, positive predictive value; NPV, negative predictive value.

Receiver operating characteristic curves of different machine learning algorithms.
Models comparison
Metrics on different models.

AUC, area under the curve; CI, confidence interval; PPV, positive predictive value; NPV, negative predictive value; DL_25D, 2.5D Deep Learning.

Different models’ receiver operating characteristic curves in different cohorts.
Performance of the combined model
Calibration curve
The Hosmer-Lemeshow (HL) test was used to assess the discrepancy between predicted outcomes and actual conditions. In this study, the HL test statistics of the combined model were 0.117, 0.087, and 0.105 for the training, validation, and test cohorts, all significantly greater than 0.05 (Figure 7). The combined model exhibited a good calibration performance. Calibration curves of different cohorts.
Decision curve analysis
Decision Curve Analysis (DCA) was used to evaluate the value of predictive models in practical clinical decision-making. In this study, the Decision Curve for the combined model consistently remained above the reference line (Figure 8). The combined model demonstrates a good clinical application value. Decision curves in different cohorts.
Discussion
PCC is an intractable problem in LACC treatment, 60 and preventing its occurrence is essential to improving patient outcomes. Increasing radiotherapy doses or combining antiangiogenic therapy with immunotherapy is an effective way to increase the CR rate of CCRT and decrease the incidence of PCC. 61 However, increasing treatment intensity will inevitably increase treatment trauma and treatment-related toxicities, it is particularly important to investigate methods that can accurately identify patients who are difficult to achieve CR with standard CCRT that before treatment. This study presents a model for PCC prediction. The proposed model achieves satisfactory prediction efficacy of PCC by integrating Crossformer-based 2.5D deep learning algorithms, machine learning algorithms and radiomics methods, using multisequence MRI data and clinical data of LACC patients before treatment. Based on the prediction results, clinicians can adjust radiotherapy doses individually and consider whether to supplement antiangiogenic therapy and/or immunotherapy. This method is expected to reduce the overall incidence of PCC while mitigating treatment-related trauma, thereby striking a balance between therapeutic efficacy and side effects and ultimately improving the overall treatment outcome in LACC. Our model relies on data readily available in routine clinical practice and requires no additional screening, thus exhibiting good clinical applicability.
Regarding the issue of treatment efficacy prediction for LACC patients receiving CCRT, the academic community has never ceased its exploration. Chel et al. 62 developed a proteomic panel associated with radioresistance to construct a protein spectrum prediction model, which demonstrated good predictive efficacy. However, this predictive method is overly complex and costly, making it unsuitable for large-scale clinical use. Maximilian et al. 63 explored the risk factors of PCC in patients with LACC using data from EMBRACE-I and found that high-risk clinical target volume, maximum tumour size, and MRI-detected tumour necrosis were independent risk factors for the occurrence of PCC after chemoradiotherapy. Li et al. 64 conducted a study involving 114 LACC patients undergoing chemoradiotherapy, identifying a history of diabetes, tumour size, FIGO stage ≥ IIA1, and SCC-Ag > 1.5 as independent risk factors for PCC, and developed a nomogram prediction model based on these clinical indicators. Silviu et al. 65 investigated the predictive role of tumour histological subtype on PCC after chemoradiotherapy in 461 patients, revealing that the presence of adenocarcinoma components was a risk factor for PCC in patients with LACC. These studies provide accessible predictive indicators for clinical practice and offer valuable insights for future research. However, relying solely on individual clinical or pathological indicators may hinder the achievement of a high predictive efficacy, thereby limiting the clinical application of these predictive methods.
For patients with LACC, pretreatment MRI is a routine and essential examination, and almost all patients with LACC undergo this examination before the initiation of CCRT. The widespread use of MRI provides the feasibility and clinical utility for constructing predictive models for PCC based on radiomics imaging data. Dolciami et al. 66 evaluated the predictive value of representative quantitative data derived from Intravoxel Incoherent Motion (IVIM) and diffusion-weighted imaging (DWI) to assess the CCRT response in patients with LACC. Several recent studies67–71 have made more extensive use of radiomics data obtained from MRI to develop some different predictive models for treatment outcomes in patients with LACC. making MRI-based radiomics prognostic models generally superior in predictive efficacy. The application of radiomics significantly enhances the clinical utility of predictive methods for PCC.
Deep learning is particularly well-suited for large data matrices, such as those found in radiomics, effectively enhancing the utilisation of image data and further improving the accuracy of predictive models. Over the past two years, scholars have made valuable contributions in this field. Yang et al. 72 utilised the VGG19 network to fuse manual radiographic and clinical features, developing a predictive model for pathological CR after CCRT in patients with LACC using T2-weighted 2D images. This model demonstrated high predictive efficacy. Similarly, Sungmoon et al. 73 employed a CNN and transfer learning techniques to develop a predictive model for PCC based on T1-and T2-weighted 3D images and compared its prediction efficacy with that of handcrafted radiomic models. The results indicated that the deep learning model exhibited a significantly better predictive performance than the handcrafted radiomic model, and models that integrated deep features, radiomic features, and clinical characteristics demonstrated superior efficacy in effectively predicting PCC in patients with LACC following CCRT. These models are highly suitable for clinical applications due to their convenience and predictive accuracy.
Our study builds upon the studies of Yang et al. 72 and Sungmoon et al. 73 but offers several unique advantages compared to their research. First, we integrated CrossFormer model to construct our deep learning models, leveraging the strengths of this approach for image processing tasks. Second, we utilised images from four distinct MRI sequences, commonly used in the diagnosis and assessment of cervical cancer, to develop both deep learning and handcrafted radiomic models, maximising the information extracted from MRI. Importantly, expanding the number of MRI sequences did not reduce the clinical applicability of our models. Third, our study employed 2.5D data to develop a deep learning model that optimally utilizes graphical information while reducing computational resource consumption, thereby enhancing the clinical application potential of our findings. The results from the validation cohort indicated that our deep model, which utilised multi-sequence MRI 2.5D data integrated with CrossFormer algorithm, significantly outperformed previous efforts in predicting PCC, and has good clinical application prospects, it could serve as a convenient and effective tool for aiding treatment decision-making in patients with LACC. Furthermore, in this study, we observed that the deep learning model significantly outperformed the handcrafted radiomics model in the test cohort. We attribute this result to the following reasons. Handcrafted radiomics features are derived from predefined mathematical formulas and are highly sensitive to variations in MRI acquisition parameters across different centers. Although we performed data preprocessing, these preprocessing steps may not fully harmonize the inter-center heterogeneity in high-order statistical and textural features. In contrast, deep learning models focus on more robust, higher-level abstract features and may disregard the variations caused by differences in scanning parameters. This endows them with greater resilience to the variability inherent in multicenter studies, thereby yielding superior generalization capabilities. Meanwhile, this feature learning approach in deep models may enable the identification of more subtle and predictive radiological markers that cannot be captured by handcrafted radiomics. Additionally, Grad-CAM analysis suggested that critical predictive information may not be homogeneously distributed within the ROI. Unlike handcrafted radiomics, which applies uniform attention across the entire ROI, deep learning models selectively focus on different regions. This to some extent avoids the “dilution” of signals in key regions by background regions, which occurs due to uniform attention in handcrafted radiomics. Therefore, the findings of this study further validate the advantages of deep learning in PCC prediction and provide evidence for the effectiveness of CrossFormer model in processing MRI data from patients with LACC, and offer new insights for future research in the field of radiological image analysis.
However, this study still has some limitations. First, although we avoided reliance on a single center and made every effort to enroll all eligible patients from the included centers, the number of centers (two) remains relatively small. The resulting selection bias is still difficult to avoid, which may limit the generalizability of our model to some extent. Second, due to the retrospective study design, some included cases lacked records of key laboratory tests such as pre-treatment SCC level. Meanwhile, because the study spanned a long timeframe and involved two centers, the existing data may exhibit variations in testing reagents, instruments, and procedures. As a result, we cannot ensure that the testing conditions and standards were entirely consistent across all cases. Therefore, we had to exclude these laboratory indicators when selecting clinical features, which may have somewhat reduced the predictive efficacy of the model.
In the future, we will further expand the number of research centers and the sample size of cases to enhance the generalizability of the model. Simultaneously, we will advance prospective study designs to incorporate more clinical features, thereby further improving the predictive efficacy of the model. We will also explore integrating ROI automatic annotation technology to achieve full-process automation in model application, thereby enhancing convenience for clinical use. Furthermore, as the artificial intelligence algorithms continue to evolve, we will keep optimizing our algorithms to drive the overall system toward greater precision and efficiency. We ultimately expect our research outcomes can achieve effective application in real clinical settings, forming convenient and reliable software tools, and providing practical support for clinical treatment decision-making.
Conclusion
In summary, we developed a predictive model for PCC by utilising pre-treatment 2.5D MRI data from four sequences of patients with LACC undergoing CCRT at two centres. Our results demonstrate that CrossFormer model offers unique advantages over the CNN model when predicting PCC using 2.5D MRI data. The deep learning model that integrated CrossFormer demonstrates better predictive efficacy compared to handcrafted radiomic approaches. The final model we constructed shows good predictive performance for PCC in patients with LACC post-CCRT. This study provides a new and reliable reference tool for individualized medical decision-making in LACC patients. The clinical application of this work is expected to help improve overall treatment outcomes for LACC. At the same time, this study also provides new practical evidence for the effective application of deep learning in the medical field. In the future, we will further expand the sample size and the number of participating centers, integrate more clinical data, and continuously optimize algorithms, to further enhance the predictive efficacy and generalizability of the model. Furthermore, we will explore enhancing the automation level and convenience of the model, ultimately achieving large-scale promotion and application in clinical practice.
Supplemental Material
Supplemental Material - Predicting complete response to concurrent chemoradiotherapy in locally advanced cervical squamous cell carcinoma using multi-sequence MRI data and a 2.5D deep learning algorithm integrated with crossformer model
Supplemental Material for Predicting complete response to concurrent chemoradiotherapy in locally advanced cervical squamous cell carcinoma using multi-sequence MRI data and a 2.5D deep learning algorithm integrated with crossformer model by Chao Chen, Liying Guo, Si Li, Jingli Sun, Lipeng Pei and Wei Ren in Science Progress
Footnotes
Acknowledgement
We would like to thank the Onekey platform for providing technical support for this study. Our gratitude also goes to Yu Xia from the Department of Obstetrics and Gynecology, Shengjing Hospital of China Medical University, for administrative support in the collection of test set data. Additionally, we thank the Department of Radiology, General Hospital of Northern Theater Command, for their administrative support in the collection of training and validation set data, as well as their technical assistance in the Segmentation of ROI.
Ethical considerations
The study was approved by the ethics committee of General Hospital of Northern Theater Command (Shenyang, China; approval No.Y2023-238; approval date: December 29, 2023).
Consent to participate
The use of data from the participating center, Shengjing Hospital of China Medical University, complied with institutional policies for managing de-identified retrospective data. Due to the retrospective nature of the study, the requirement for informed consent was waived by the ethics committee.
Author contributions
CC and WR Conception and design; acquisition, analysis, and interpretation of the data. Manuscript preparation and revision. WR: Conception and design. Manuscript revision, project administration and funding. CC, LG, SL, and WR performed the experiments and drafted the manuscript. JS and LP contributed to scientific design. All of the authors have read and agreed to the submitted version of the manuscript.
Funding
The authors disclosed receipt of the following financial support for the research, authorship, and/or publication of this article: This work was supported by the Department of Science and Technology of Liaoning province (2022JH2/101500044 and 2023JH2/101700089).
Declaration of conflicting interests
The authors declared no potential conflicts of interest with respect to the research, authorship, and/or publication of this article.
Data Availability Statement
Data supporting the findings of this study are available from the corresponding author upon request.
Artificial intelligence (AI)
The authors declare that they did not use AI-generated work in this manuscript.
Supplemental material
Supplemental material for this article is available online.
Appendix
References
Supplementary Material
Please find the following supplemental material available below.
For Open Access articles published under a Creative Commons License, all supplemental material carries the same license as the article it is associated with.
For non-Open Access articles published, all supplemental material carries a non-exclusive license, and permission requests for re-use of supplemental material or any part of supplemental material shall be sent directly to the copyright owner as specified in the copyright notice associated with the article.