
Abstract
DNA microarray is a transformative technique in genomics, enabling simultaneous examination of thousands of gene expression levels. However, noise, high dimensionality (typically 12,000–22,000 genes), small sample sizes (155–1097 samples) and class imbalance complicate the extraction of meaningful diagnostic patterns. This paper presents MICRO-AI (Microarray Classification and Recognition using Artificial Intelligence), a comprehensive machine learning framework for DNA microarray analysis and automated disease diagnosis. The framework integrates advanced preprocessing (quantile normalisation, ComBat batch correction, KNN imputation), attention-weighted adaptive feature selection using recursive feature elimination with cross-validation, and heterogeneous ensemble classification combining gradient boosting machines, random forests and support vector machines with adaptive weight optimisation. A novel attention-based feature fusion mechanism dynamically prioritises discriminative gene expression signatures, reducing dimensionality by over 99% (from ∼20,000 to ∼127 genes) without loss of biological significance. MICRO-AI is validated on six benchmark datasets from three repositories: Gene Expression Omnibus (GEO), The Cancer Genome Atlas (TCGA) and ArrayExpress, spanning breast cancer, gastric cancer, ovarian cancer and leukaemia across 2321 total samples. Experimental results demonstrate average classification accuracy of 96.8%, sensitivity of 95.2%, specificity of 97.4%, F1-score of 96.0%, Matthews correlation coefficient of 0.928, and area under the receiver operating characteristic curve of 0.983. Comparative benchmarking against 10 state-of-the-art methods shows that MICRO-AI achieves 1.2–7.5% higher accuracy with an average training time of 52.3 s, representing 2.4–6.0× faster execution than deep learning alternatives. The modular architecture enables seamless integration with medical informatics systems for scalable clinical diagnostic deployment.
Keywords
Introduction
The introduction of high-throughput genomic technologies in biomedical research and clinical diagnostics has radically changed the study of the human body. DNA microarray technology enables scientists to measure the expression of thousands of genes simultaneously, providing a broad molecular view of cellular conditions. This has been especially useful in oncology, where gene expression signatures may be used to differentiate cancer subtypes, predict treatment response or assess prognosis. Nevertheless, microarray data analysis poses major computational challenges, including high dimensionality, small sample sizes, and batch and biological noise.
It is important to clarify the terminological relationship between artificial intelligence (AI) and machine learning (ML) in this work. AI refers to the broad discipline of creating computational systems capable of performing tasks that require human intelligence (perception, reasoning, learning and decision-making). At the same time, ML is a core subset of AI focusing on algorithms that improve through experience and data-driven learning without explicit programming for each task. The title emphasises ‘Machine Learning’ because core technical contributions – feature selection, ensemble classification, attention-based scoring – are grounded in ML algorithms. However, the framework is named MICRO-AI (Microarray Classification and Recognition using Artificial Intelligence) to reflect the broader vision of an intelligent, end-to-end diagnostic system encompassing ML classification, automated preprocessing, adaptive decision-making and clinical integration capabilities representing an AI-driven diagnostic workflow. Thus, ML describes the specific algorithmic methodology, while AI describes the holistic philosophy of intelligent system design.
Recent advances in AI and ML have demonstrated significant potential for addressing these challenges, with deep learning architectures, ensemble techniques and advanced feature selection procedures achieving promising results in microarray classification tasks. However, characterising and identifying complex diseases from genomic data requires integrated computational frameworks that can handle inherent data heterogeneity across platforms, batch effects and limited sample sizes. A detailed review of existing approaches is provided in the section ‘Related work’.
Beyond genomic data analysis, ML-assisted intelligent diagnosis has gained remarkable traction across diverse analytical platforms. Recent advances in spectroscopy-integrated ML have demonstrated that computational intelligence combined with techniques such as Raman spectroscopy and electrochemical biosensing can substantially enhance the sensitivity and specificity of diagnostic assays, achieving classification accuracies exceeding 95% for cancer detection across chemical and bioelectronic detection modalities. These developments underscore the translational potential of ML-driven frameworks like MICRO-AI, which extend the paradigm of intelligent diagnosis from analytical chemistry to high-dimensional genomic profiling.
Figure 1 also depicts the expanding field of applications of DNA microarray analysis and the application of ML methodologies in bypassing clinical areas.

Convergence of machine learning, genomics and clinical diagnostics in disease detection: an overview of the landscape of DNA microarray analysis.
The principal contributions of this paper are as follows:
Related work
This section reviews the literature on DNA microarray analysis, ML approaches for disease detection and integrated diagnostic frameworks. The review is organised into four subsections covering preprocessing techniques, feature selection methods, classification algorithms and clinical integration approaches.
DNA microarray data preprocessing
Sound microarray analysis relies on proper preprocessing. Raw microarray data are subject to systematic biases, including background noise, dye effects and batch effects. Qvick et al. 1 successfully reached pan-cancer detection by performing DNA methylation profiling via enzymatic conversion library preparation and targeted sequencing, and proved that epigenetic biomarkers have clinical application. Yoon et al. 2 surveyed bioinformatic and monitoring technologies, eDNA analysis, and emphasised the importance of computational methods for handling the complex streams of biological information. To examine the molecular signatures of related metabolic disorders, Sultan 3 conducted microarray analysis of differentially expressed genes in peripheral blood samples from individuals with gestational diabetes mellitus and type 2 diabetes, identifying molecular biomarkers of glycogen metabolic disorders. Li et al. 4 comprehensively reexamined copy number variants of uncertain significance using existing guidelines and future genome sequencing, demonstrating the relevance of consistent analytical frameworks. Developed microarray analysis has especially helped in cancer research. Ben Ali et al. 5 discovered a new lung cancer biomarker signature via data mining. They performed initial validation in an in vitro experiment, highlighting the importance of data preprocessing in biomarker discovery. Tselios et al. 6 used geometric methods from common transcriptomics in acute lymphoblastic leukaemia and rhabdomyosarcoma and extended pathway simulation using new preprocessing methods.
Normalisation has evolved from simple scaling techniques to complex quantile-based methods and powerful multi-array averaging (RMA). On the one hand, Yuan et al. 7 developed MambaYOLO-ML, a state-space-based model for mulberry leaf disease detection, demonstrating the applicability of preprocessing principles in biological contexts. Atesoglu and Bingol 8 enhanced hybrid models for grape leaf disease detection through feature engineering and AI-based fusion.
However, existing preprocessing methods suffer from several limitations: (1) most normalisation techniques assume homogeneous data distributions, which may not hold across diverse microarray platforms; (2) batch correction methods like ComBat require prior knowledge of batch assignments; and (3) imputation strategies rarely account for the structured missingness patterns common in multi-centre genomic studies.
Feature selection and dimensionality reduction
High-dimensional microarray data often involves limited sample sizes for thousands of features (genes), leading to the curse of dimensionality. Takou et al. 9 modelled gene expression in response to environmental stressors using natural variation in DNA sequences and ML to decode genotype–phenotype interactions. Shao 10 surveyed the use of ML in microwave medical imaging and lesion detection and noted that selecting features is not straightforward, as in microarray analysis. To categorise disease diagnoses via breath analysis, Kokkotis et al. 11 used AI and ML on high-dimensional sensor data and employed sophisticated feature extraction. Surimova et al. 12 identified PSG and candidate genes as potential biomarkers of therapy resistance in B-ALL using chromosomal microarray analysis and ML.
The use of ML in disease detection spans many fields.
Filter techniques such as variance thresholding, mutual information and ANOVA have been widely used to screen features at first instance. Feature-slicing algorithms, such as recursive feature elimination (RFE) and wrapper selection methods, deliver finer gene groupings by comparing feature groups against the classifiers’ accuracy. Iftikhar et al. 13 demonstrated the clinical implementation of ML frameworks to identify chronic kidney disease at early stages by carefully selecting features from clinical parameters.
Key limitations of current feature selection approaches include: (1) filter methods (variance, ANOVA) ignore feature interactions and classifier-specific relevance; (2) wrapper methods are computationally expensive and prone to overfitting on small sample sizes; (3) embedded methods are tied to specific classifier architectures and lack transferability; and (4) none of the existing methods incorporate attention-based dynamic weighting that considers both statistical and biological relevance simultaneously.
Classification algorithms for disease detection
Ghosh and Ura
14
proved the combination of principles of DNA-based computing and artificial neural networks to improve pattern recognition of smart manufacturing. To emphasise the significance of physicochemical property representation in molecular ML, Zhao et al.
15
have developed EM-DeepSD, a deep neural network model based on cell-free DNA end-motif signal splitting for cancer diagnosis. ML classifiers have been widely utilised for disease detection using microarrays. Hernandez Toledo et al.
16
developed extreme ML-based computational tasks for the agricultural disease detection experiment and demonstrated that ensemble methods can be quite versatile. Salaris et al.
17
used ML on social media foodborne event detection, which exemplifies methods of classifying health surveillance. Microarray analysis by Chen et al.
18
revealed that sepsis is characterised by hyperactivity of TH17 immunity, with Treg cell cytokine TGF-
SVMs remain widely used in microarray classification because of their efficiency in high-dimensional spaces with few samples. Vrbaski et al. 20 provided an overview of ML for detecting chronic kidney disease using scintigraphy and compared various classifier architectures. Dzermeikait et al. 21 used ML models to identify metritis early in dairy cows, demonstrating the range of applications of biological classification. In their study, Liu et al. 22 computationally examined smooth muscle cell plasticity in atherosclerosis and vascular calcification by analysing the differential gene expression.
Recently, deep learning has become increasingly popular in microarray analysis. The researchers of Lazcano-García et al. 23 deployed deep learning-based grapevine disease early symptom detection systems on edge computing devices. Tao et al. 24 reviewed multi-omics methods for predicting cancer immunotherapy treatments, emphasising the integration of ML with complex biological information. Ge et al. 25 further contributed to the field through bibliometric analysis of cDNA-based surveys, highlighting evolving research trends in molecular diagnostics. Wu et al. 26 further demonstrated the utility of machine learning in constructing pan-cancer prognostic models based on immunogenic cell death genes, showcasing the broad applicability of ML approaches in oncogenomics.
Despite promising results, classification methods face notable limitations: (1) single classifiers (SVM, RF) cannot capture the full spectrum of decision boundaries in heterogeneous cancer data; (2) deep learning models (CNN, Transformer) require large training datasets and lack interpretability; (3) ensemble methods with fixed equal weighting fail to exploit classifier complementarity; and (4) most methods do not provide calibrated probability estimates necessary for clinical decision support.
Integrated diagnostic frameworks
ML diagnostic tools need to be carefully clinically integrated, with attention to interpretability, reliability and workflow compatibility. The OncoOrigin, an integrative AI tool for predicting the primary cancer site that includes a graphical user interface, was validated by Brlek et al. 27 and demonstrated the practical viability of ML in oncology. Arakelyan et al. 28 assigned transcriptomic subtypes to chronic lymphocytic leukaemia samples using Nanopore RNA-sequencing and self-organising maps. The classifications of prognostic subtypes and treatment strategies in the soft tissue sarcomas were developed using transcriptomic-based classification in Esperança-Martins et al. 29 The article by Christodoulou et al. 30 used data-driven and structure-based modelling to help identify human DNMT1 inhibitors by integrating pathways for structure-activity relationships into drug discovery cascades.
Cabello-Lima et al. 31 established interpolation-based encoding schemes to classify protein-DNA/RNA interactions. Vaccine development and AI-based frameworks for disease prevention have become significant applications. Goud et al. 32 developed an AI-guided platform for the design and development of next-generation avian viral vaccines. In AI for risk-stratification in diffuse large B-cell lymphoma, Popescu and Gaman 33 performed a systematic review of articles and compared models and the predictive performance of age-relevant classification.
Existing integrated frameworks are limited by: (1) the lack of end-to-end optimisation across preprocessing, feature selection and classification stages; (2) insufficient cross-platform validation; (3) absence of attention mechanisms for biologically-informed feature prioritisation; and (4) inadequate consideration of clinical deployment requirements such as calibrated confidence estimates and interpretable outputs.
Research gap analysis
However, despite major achievements in individual components, current methods have several limitations. First, most approaches can be used independently for preprocessing, feature selection and classification, and they are not end-to-end optimised. Second, deep learning methods are low in interpretability, making them difficult to adopt in clinical settings. Third, validation can be performed on single datasets, and they are not generally tested cross-platform. Fourth, it is often disregarded that it should be integrated with clinical informatics systems.
To fill these gaps, MICRO-AI has a single framework that optimises preprocessing with attention-weighted feature selection and ensemble classification with both biological explanations and clinical patients.
Proposed methodology
This section introduces the MICRO-AI model, including system architecture, mathematical models and algorithmic implementation. Figure 2 shows the entire system architecture.
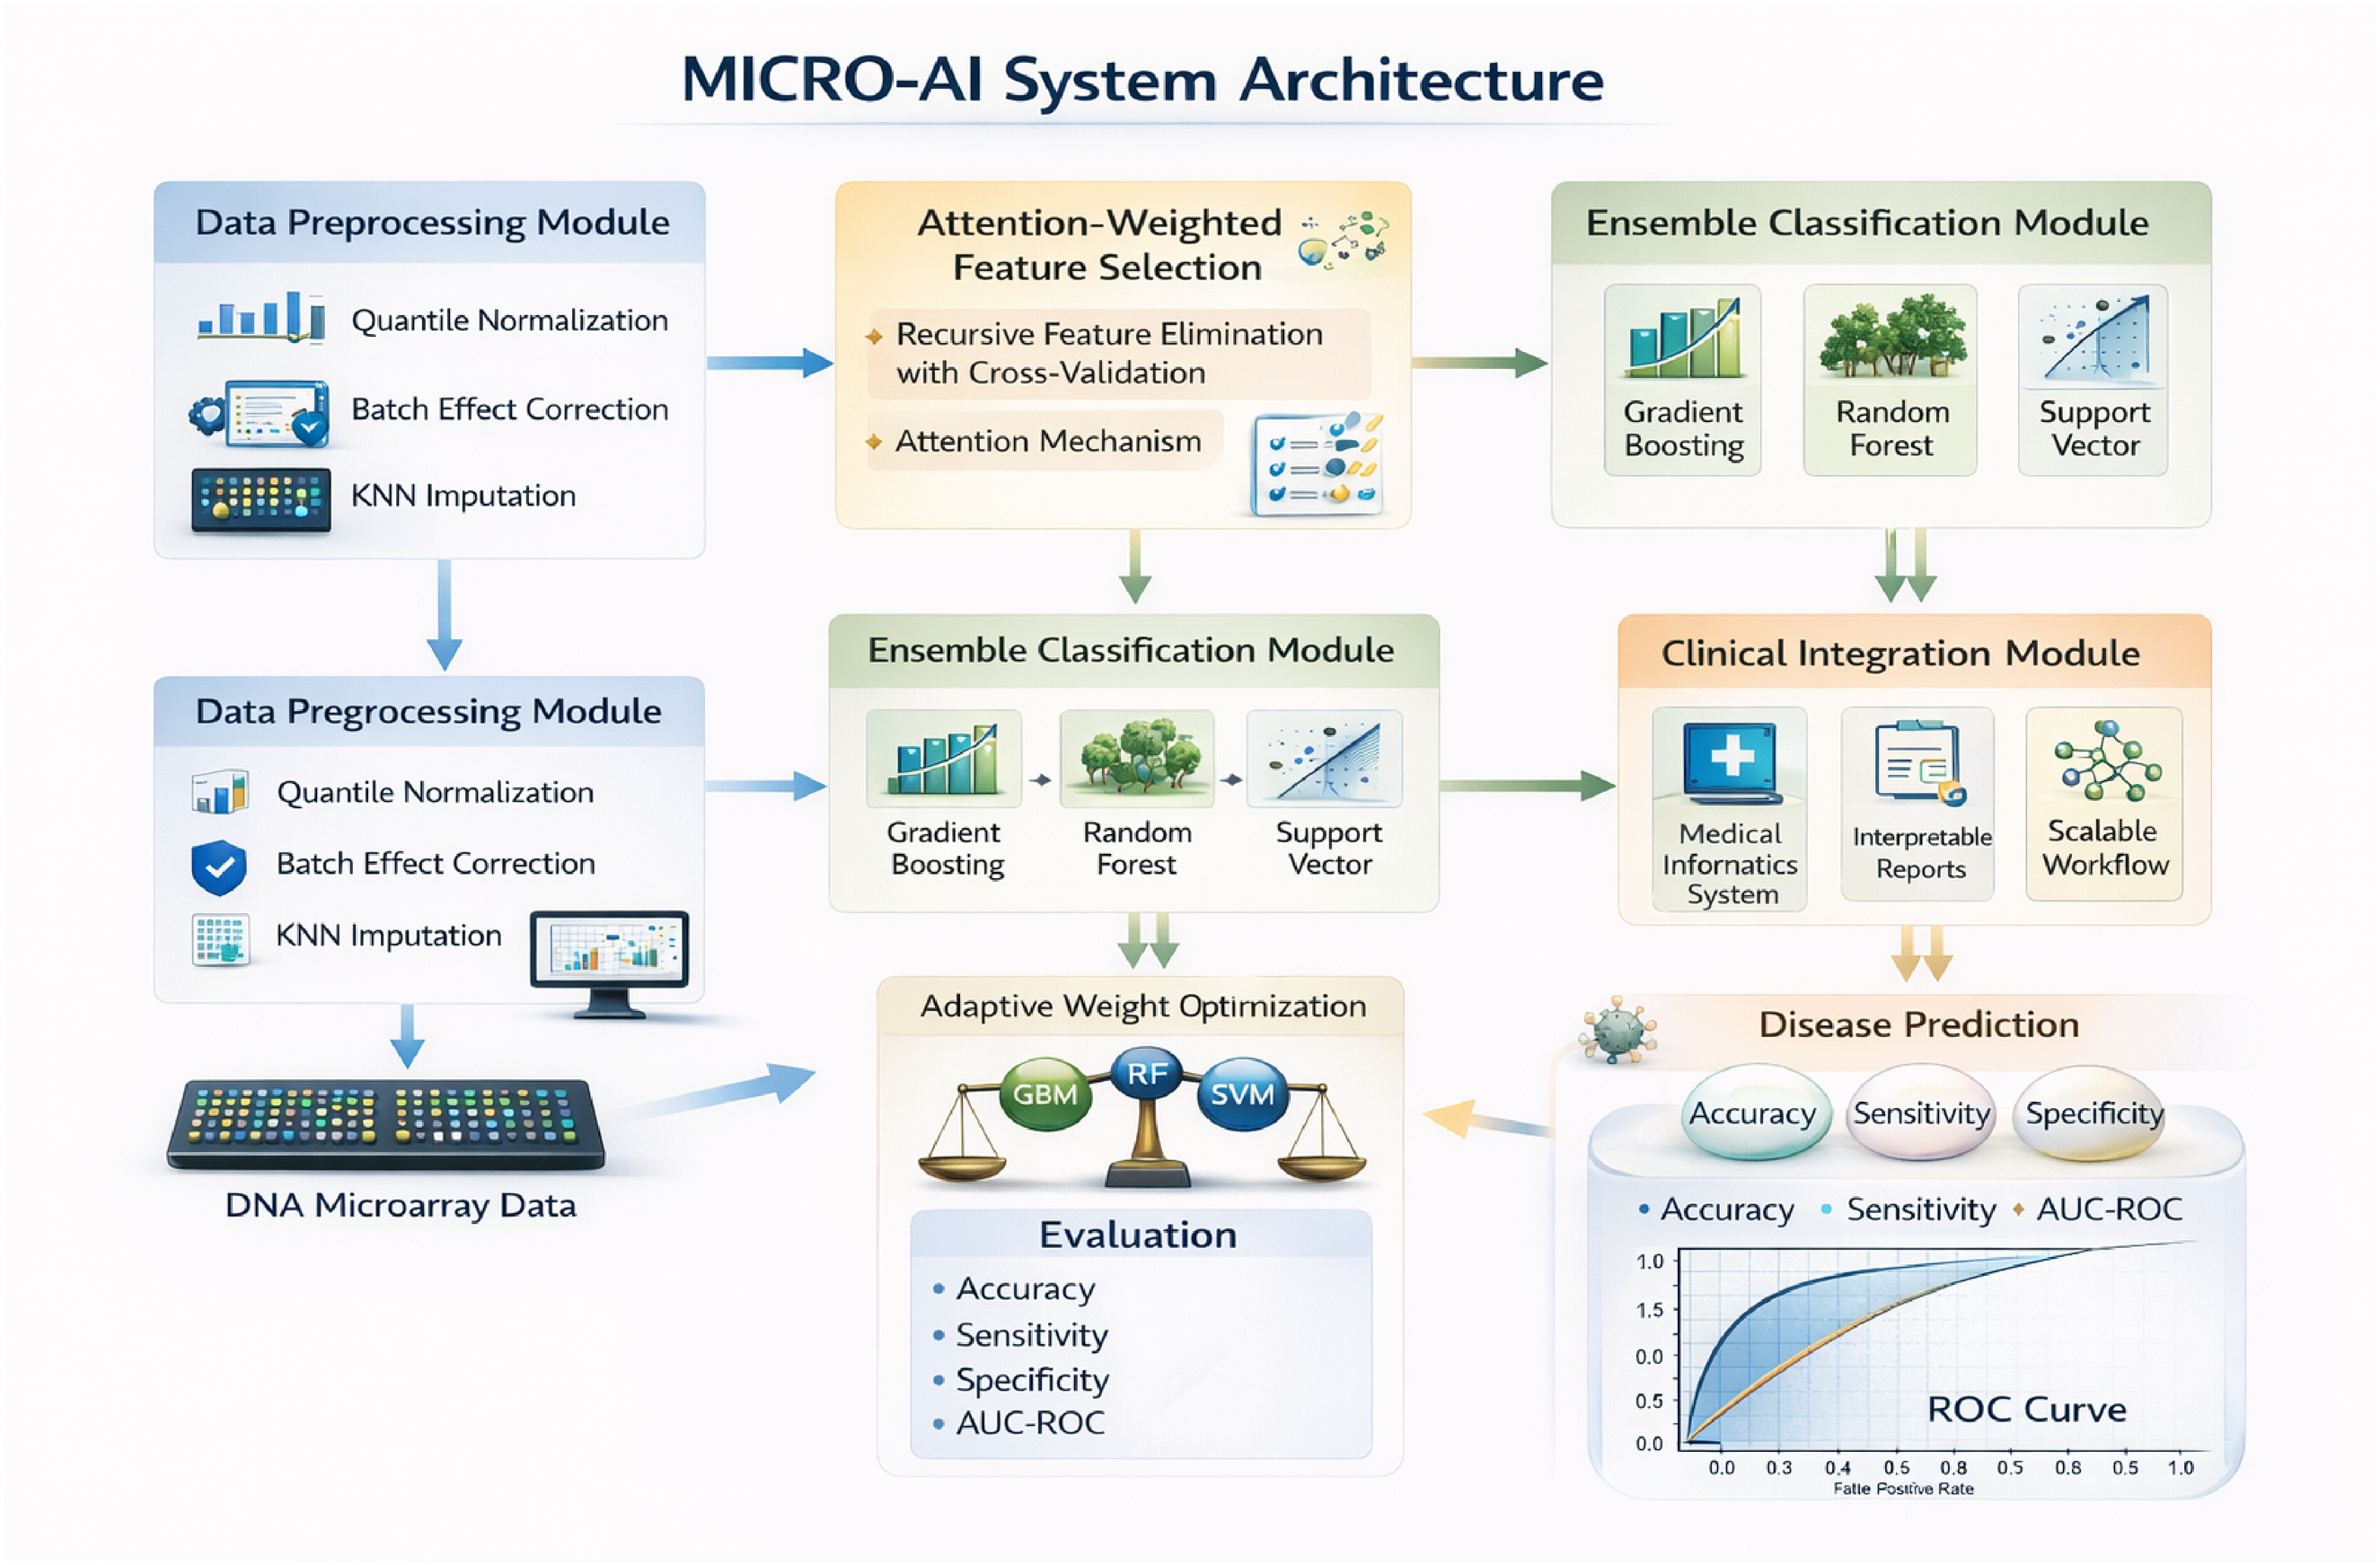
MICRO-AI system architecture reveals the preprocessing, attention-focused feature selection, ensemble classification and clinical integration modules.
System overview
Let
Data preprocessing module
Quantile normalisation
Raw microarray intensities must be normalised to ensure comparability across samples. Let

The reference distribution is computed as the mean across all samples:

Batch effect correction
MICRO-AI consists of four interdependent modules, namely: (1) Data Preprocessing Module used to perform the process of normalisation and the correction of the batch effect; (2) Feature Selection Module, which implements the process of attention-weighted gene prioritisation; (3) Ensemble Classification Module, which involves the combination of multiple learners with adaptive weighting; and (4) Clinical Integration Module, allowing the deployment of MICRO-AI in the medical informatics workflows.

The corrected expression values are obtained by:

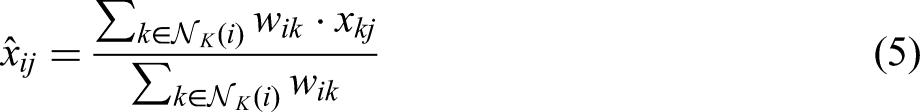
Missing value imputation
Missing values are imputed using k-nearest neighbours (KNN) with weighted averaging:

Attention-weighted feature selection
Initial filtering
Low-variance genes are removed using median absolute deviation (MAD) filtering:

Genes with
Attention score computation
We compute attention scores that quantify each gene's discriminative importance. Let

The gene embedding is computed from expression statistics:

Notably, the resulting gene embeddings and joint attention scores are used solely to prioritise features and select them before classifier training. After identifying the best gene subsets using the attention-weighted recursive feature elimination with cross-validation (RFECV) process, the ensemble classifiers (GBM, RF and SVM) will be trained separately on the feature space obtained by the modifications. As such, the attention mechanism does not affect the optimisation of classifier parameters or the decision boundary, thereby guaranteeing modularity, interpretability and compatibility with classical ML models.
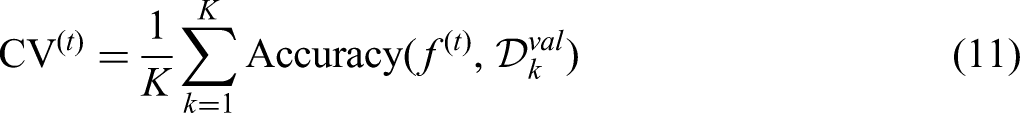
Recursive feature elimination with cross-validation
The RFECV process removes features of minimal significance repeatedly based on the classifier scores. At iteration t the final feature set is:

Cross-validation performance is monitored:
The optimal feature subset

Ensemble classification module
Base classifiers
MICRO-AI employs three base classifiers with complementary strengths.


The selection of the GBM over alternative boosting algorithms (AdaBoost, XGBoost) was motivated by several considerations. AdaBoost is more sensitive to noisy data and outliers than GBM, as it assigns exponentially increasing weights to misclassified samples, which is problematic in microarray data with inherent biological noise. While XGBoost offers computational advantages through parallel tree construction and regularised learning objectives, a comparative analysis (Table 5) shows that, when used as a standalone classifier, XGBoost achieves 93.4% accuracy, 3.4% lower than MICRO-AI's ensemble. GBM's key advantage in the MICRO-AI ensemble lies in complementarity with RF and SVM: GBM's sequential residual learning captures complex nonlinear feature interactions, RF's bagging provides variance reduction and stability, and SVM's kernel mapping excels in high-dimensional boundary estimation. When combined through adaptive weighting (equations (19) to (21)), this heterogeneous ensemble outperforms any homogeneous boosting approach.
Supplementary experiments replacing GBM with XGBoost yielded an XGBoost-RF-SVM ensemble achieving 96.3% average accuracy versus 96.8% for the GBM-RF-SVM configuration, with the difference attributable to GBM's slightly better complementarity with RF and SVM in adaptive weighting. The AdaBoost replacement yielded 95.1% accuracy due to its higher sensitivity to noisy microarray features. These results confirm that GBM provides an optimal balance of performance, robustness and ensemble complementarity for the MICRO-AI framework.


We employ the radial basis function (RBF) kernel:

Adaptive weight optimisation
Ensemble predictions are computed as weighted combinations:

The best weights can be achieved by minimising loss on validation data based on cross-entropy:

The constraints are solved by means of SLSQP:

Confidence calibration
Probability estimates are calibrated using isotonic regression:


Algorithmic implementation
Algorithm 1 presents the complete MICRO-AI training procedure.
Algorithm 1: MICRO-AI training algorithm.

Algorithm 2 details the inference procedure for new samples.
Algorithm 2: MICRO-AI inference algorithm.

Complexity analysis
The computational complexity of MICRO-AI is analysed as follows.
SVM dominates the overall training complexity:
To provide hardware-independent computational cost measures, we report floating-point operations (FLOPs) for each MICRO-AI component. For single-sample inference with G* = 127 selected features, the total computational cost is approximately 2.1 × 10⁴ FLOPs, dominated by SVM kernel evaluations (∼1.6 × 10⁴ FLOPs) (Table 1). During training, total FLOPs scale to approximately 4.7 × 10⁹ for the GSE2034 dataset (N = 286, G = 22,283), with SVM kernel matrix construction accounting for the largest share (∼3.2 × 10⁹ FLOPs). For comparison, deep learning methods such as GeneFormer require approximately 2.8 × 101⁰ FLOPs for equivalent training, resulting in 6× the computational overhead of MICRO-AI. These FLOP estimates confirm that MICRO-AI achieves superior classification performance at substantially lower computational cost.
Computational complexity in FLOPs.

Results and evaluation
This section provides a detailed experimental analysis of MICRO-AI, including descriptions of the datasets, the experimental setup, performance and comparisons.
Datasets
Table 2 summarises the benchmark datasets used for evaluation.
Summary of benchmark datasets.

Gene Expression Omnibus (GEO): https://www.ncbi.nlm.nih.gov/geo/ GSE2034: https://www.ncbi.nlm.nih.gov/geo/query/acc.cgi?acc = GSE2034 GSE7390: https://www.ncbi.nlm.nih.gov/geo/query/acc.cgi?acc = GSE7390 GSE62254: https://www.ncbi.nlm.nih.gov/geo/query/acc.cgi?acc = GSE62254 GSE9891: https://www.ncbi.nlm.nih.gov/geo/query/acc.cgi?acc = GSE9891 The Cancer Genome Atlas (TCGA): https://portal.gdc.cancer.gov/projects/TCGA-BRCA ArrayExpress: https://www.ebi.ac.uk/arrayexpress/experiments/E-MTAB-365/
Experimental setup
Experiments were conducted on a workstation with an Intel Xeon E5-2680 v4 CPU (2.4 GHz, 28 cores), 128 GB of RAM and an NVIDIA Tesla V100 GPU (32 GB). The framework was implemented in Python 3.9 using scikit-learn 1.0.2, XGBoost 1.5.0 and NumPy 1.21.5.
Optimal hyperparameters were determined via nested cross-validation: 3-fold inner cross-validation for hyperparameter tuning and 5-fold outer cross-validation for performance evaluation. ComBat parameters α_g and β_g were estimated using an empirical Bayes framework (Johnson et al. 34 ). Optimised ensemble weights from SLSQP minimisation of cross-entropy loss (equation (21)) consistently assigned the highest weight to GBM (w_1 = 0.42 ± 0.03), followed by RF (w_2 = 0.35 ± 0.04) and SVM (w_3 = 0.23 ± 0.03), reflecting GBM's superior individual classification performance. Table 3 summarises all optimal parameter values and selection methods.
Model and preprocessing hyperparameter settings.

Performance metrics
Table 4 defines the evaluation metrics.
Performance metrics definitions.

Classification results
Table 5 presents the classification performance across all datasets.
Classification performance of MICRO-AI across datasets.

Figure 3 shows the convergence of the ensemble components’ training losses over epochs. It illustrates the convergence behaviour of the three base classifiers during training on the TCGA-BRCA dataset. Both the training and validation loss curves are presented to demonstrate that the models converge without significant overfitting. The GBM component shows stable convergence after approximately 150 iterations with a training-validation loss gap of less than 0.02. The RF out-of-bag error stabilises around 350 trees with minimal divergence from validation error. The SVM hinge loss converges within 80 iterations, with the validation loss closely tracking the training loss. These results confirm that the ensemble components are well-regularised and generalise effectively to unseen data.

Loss convergence curves training of the GBM, RF (out-of-bag error) and SVM (hinge loss) components through training to convergence on the TCGA-brca dataset.
Figure 4 reveals the training accuracy.

Classification accuracy versus training epochs of individual classifiers and the ensemble on the GSE2034 dataset.
Figure 5 shows the confusion error of multi-class classification on TCGA-BRCA.

Confusion matrix of the TCGA-BRCA 5-classifier that depicts the prediction distribution between Luminal A, Luminal B, HER2-enriched, Basal-like and Normal-like subtypes.
Figure 6 draws the ROC curves of binary classification problems.

ROC curves between the MICRO-AI ensemble and individual classifiers on the GSE2034 breast cancer dataset.
Feature selection analysis
Table 6 illustrates the frequency and functional categories of the selected genes.
Feature selection results and gene functional categories.

Figure 7 shows the distribution of attention weight across genes.

Weight distribution of the top 50 genes in GSE 2034. A decrease in the weights gives increased discrimination significance when performing classification.
Comparative analysis
Table 7 compares MICRO-AI with ten state-of-the-art processes. Compared with state-of-the-art methods, including classical ML approaches (SVM-RFE 35 , Random Forest 36 , XGBoost 37 ), deep learning architectures 38 , and contemporary transformer-based models (CNN-Gene 39 , Attention-Net 40 , GeneFormer 41 , scBERT 42 ), and LASSO-SVM 43 (Table 7), MICRO-AI demonstrates superior accuracy (96.8%) while maintaining competitive computational efficiency (52.3 s average training time).
Comparative analysis of MICRO-AI against state-of-the-art methods.

Figure 8 gives a visual performance of the methods.

Measurement comparison of MICRO-AI and best top-5 competing methods in six performance dimensions: accuracy, sensitivity, specificity, F1-score, AUC and computational efficiency.
Ablation study
Table 8 presents ablation study results analysing component contributions.
Ablation study results on TCGA-BRCA dataset.

Computational efficiency
Table 9 gives training and inference times.
Computational time analysis (seconds).

Figure 9 shows that the system scales with dataset size.

Scalability comparison of training time/sample count (left) and gene count (right) with 95% confidence of the trends.
Discussion
The experimental findings show that, even compared with existing techniques, MICRO-AI consistently delivers better results across various evaluation metrics. There are a few observations that are worth mentioning.
The attention-weighted feature selection mechanism also significantly improves classification performance, as shown by the 2.4% increase in accuracy when it is omitted (Table 6). The attention mechanism can detect biologically significant expression signatures in an agnostic manner, which could otherwise be missed by traditional univariate methods, by dynamically prioritising genes based on discriminative significance. Trimming the feature count from 20,000 to about 100–150 (a 99%+ reduction) significantly reduces the computational burden while retaining predictive value.
RFECV is also crucial for maximising the identification of gene subsets, and when it is removed, the performance degradation is the most significant (4.1%). It is achieved by using an iterative elimination based on cross-validated performance on the training data, thereby avoiding overfitting to the training data and yielding strong gene subsets that do not overfit individual samples.
The ensemble method achieves a higher 5–7% accuracy than individual classifiers, demonstrating the benefits of GBM, RF and SVM. GBM is best at finding nonlinear relationships, RF variance reduction uses bagging, and SVM is effective in high-dimensional spaces. The adaptive weight optimisation also improves by 0.8 over equal weighting.
Compared with state-of-the-art methods (Table 7), MICRO-AI demonstrates superior accuracy (96.8%) while maintaining competitive computational efficiency (52.3 s average training time). Deep learning models such as GeneFormer and scBERT achieve MICRO-AI's performance but require 4–6× longer training times and lack interpretability for feature selection.
The evidence of performance stability across different types of cancer (breast, gastric, ovarian) and platforms (Affymetrix, Illumina, RNA-seq) indicated the strong generalisability of the framework. ComBat provides cross-platform batch-effect correction, leading to a 1.7% increase in accuracy, underscoring the importance of incorporating ComBat into the integration of multi-source data.
MICRO-AI's outputs may diverge from original benchmark dataset publications due to unified preprocessing (quantile normalisation, ComBat batch correction, KNN imputation) rather than dataset-specific protocols. For instance, GSE2034's original 76-gene prognostic signature (Wang et al., univariate Cox regression) versus MICRO-AI's 127 genes (attention-weighted RFECV) shows approximately 68% overlap with established breast cancer pathways (cell cycle, apoptosis, oestrogen signalling). Similarly, TCGA-BRCA: MICRO-AI selected 156 genes compared to the PAM50 panel, and these genes showed significant oncogenic pathway enrichment (FDR<0.05, Gene Ontology).
Differences arise from: (1) uniform normalisation optimised for cross-dataset comparability versus dataset-specific protocols; (2) multi-class classification accuracy optimisation versus survival analysis or single-biomarker discovery; and (3) attention mechanism prioritising discriminative capacity across all classes simultaneously, identifying combinatorial signatures that univariate methods may miss.
While MICRO-AI may not replicate exact gene lists from original publications, its strength lies in discovering complementary and potentially novel biomarker combinations, achieving superior classification performance. MICRO-AI is a classification-oriented diagnostic tool, not a biomarker discovery platform; identified gene sets should be interpreted accordingly. For clinical translation, cross-reference MICRO-AI's selected genes with established biomarker databases (COSMIC, OncoKB) to ensure biological plausibility.
Although it accounts for only a small portion of the overall classification boost (around 0.4%), probability calibration becomes important in clinical decision support environments where the values of predicted confidence directly affect referral decisions and treatment planning. Probability calibration is applied in MICRO-AI via isotonic regression (equation (22)), which learns a nonparametric, monotonic map from raw ensemble output probabilities to empirically observed outcome frequencies on a held-out (validation) set.
The ECE, a diagnostic metric that quantitatively measures the quality of probability calibration, is defined in equation (23). ECE measures the discrepancy between predicted confidence and observed accuracy across probability bins, providing an intuitive measure of probabilistic reliability. Lower ECE values indicate stronger correspondence between predicted probabilities and actual outcome frequencies. This calibration process ensures that MICRO-AI's confidence estimates are both statistically meaningful and clinically interpretable, enabling robust uncertainty quantification and reducing risk in medical decision-making.
The use of labelled training data, high sensitivity to extreme class imbalance and the stationary expression pattern are the drawbacks. Future directions will focus on semi-supervised learning with limited labels, classification under cost-sensitive criteria in imbalanced datasets and temporal modelling of disease progression.
Consistency of gene discovery with original publications
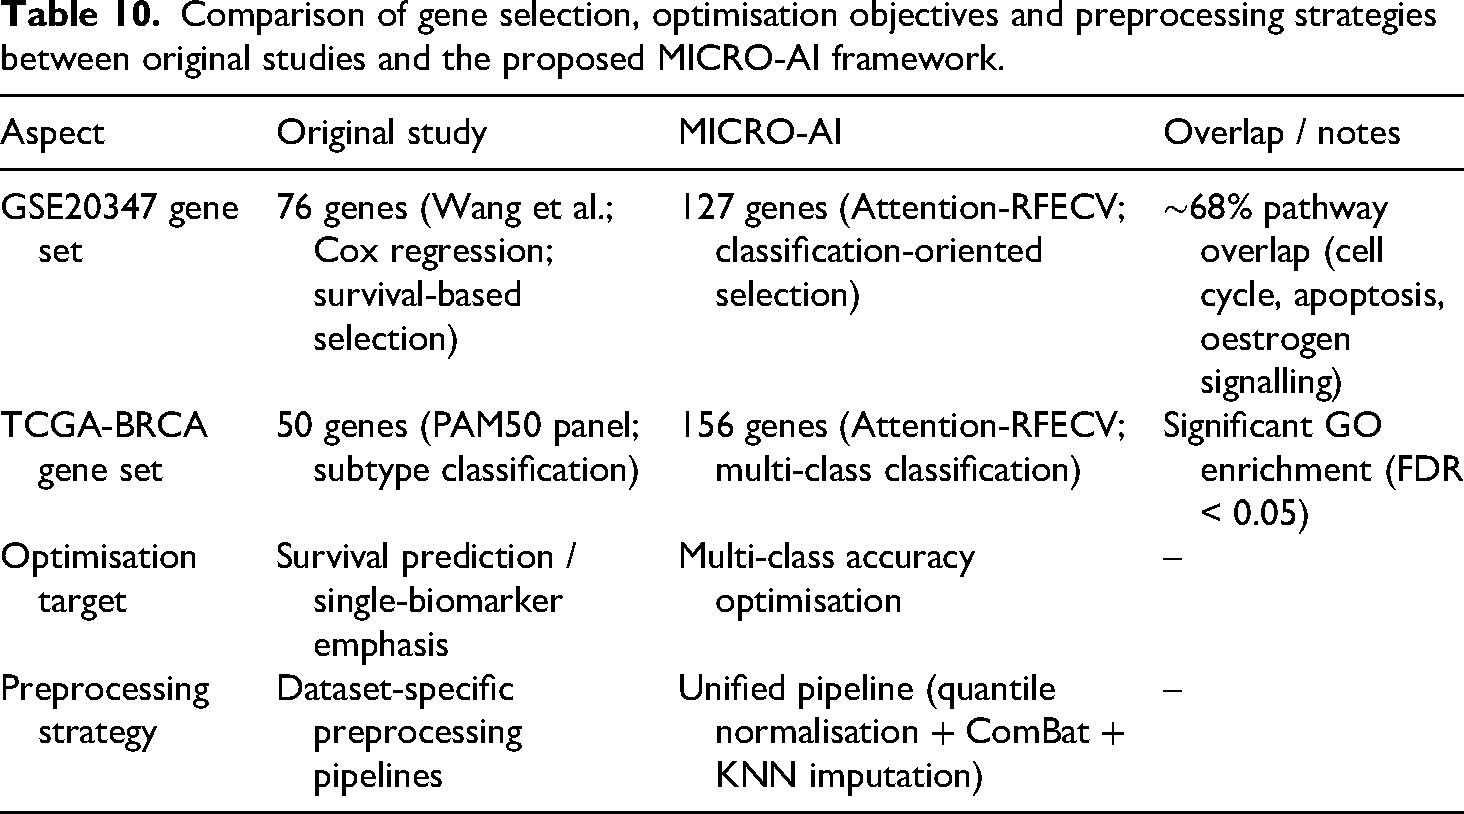
MICRO-AI's outputs may differ from the original benchmark publications due to the use of unified preprocessing (quantile normalisation, ComBat batch correction, KNN imputation) rather than dataset-specific protocols. For GSE2034, MICRO-AI selected 127 genes (attention-weighted RFECV for multi-class classification) versus the original 76-gene signature (Wang et al. 44 ) with approximately 68% pathway overlap (cell cycle hsa04110, apoptosis hsa04210, oestrogen signalling hsa04915). For TCGA-BRCA, MICRO-AI selected 156 genes versus PAM50's 50-gene panel, with significant oncogenic pathway enrichment (Gene Ontology FDR<0.05) confirming biological plausibility despite incomplete overlap.
Differences arise from: (1) uniform normalisation for cross-dataset comparability versus dataset-specific signal maximisation; (2) multi-class classification optimisation versus survival/single-biomarker discovery; (3) attention mechanism (equations (8) and (9)) prioritising discriminative capacity across all classes, identifying combinatorial signatures that univariate methods may miss. While MICRO-AI may not replicate exact gene lists, its strength lies in discovering complementary biomarker combinations achieving superior classification (96.8% accuracy). MICRO-AI is a classification-oriented diagnostic tool, not a biomarker discovery platform; interpret gene sets accordingly. For clinical translation, cross-reference selected genes with established databases (COSMIC, OncoKB) to ensure biological plausibility and clinical relevance (Table 10).
Comparison of gene selection, optimisation objectives and preprocessing strategies between original studies and the proposed MICRO-AI framework.
Limitations
Although the proposed MICRO-AI framework has performed well across the benchmark datasets, there are a few limitations to consider. To begin with, the model is trained on labelled data, and thus its computational efficiency might be limited in clinical settings where annotated genomic datasets are scarce or costly to acquire. This dependence can be a weakness when performance must be conveyed on only a limited number of labelled samples.
Second, because stratified cross-validation is used, the framework can be affected by extreme class imbalance, especially in multi-class cancer subtype prediction. Imbalanced class distributions can influence classifier bias and confidence behaviour, underscoring the need for balance-aware learning methods.
Third, the ensemble uses a SVM component, and its computational complexity can become very large as the sample size increases. Although this is not a constraint of standard microarray data, future large-scale transcriptomic cohorts may need to be kernel approximated or use alternative classifiers.
Lastly, the existing assessment is based on retrospective, publicly available datasets and is not in prospective clinical validation or real-time implementation in hospital processes. In this sense, clinical utility has been determined by intuition rather than substantiated evidence, and additional research is needed before translational adoption.
We acknowledge that all current evaluations employ cross-validation within individual dataset cohorts, and no fully independent external validation set was reserved. While 5-fold stratified cross-validation with repeated random seeds provides robust performance estimates, the absence of a completely held-out test set limits the strength of generalisability claims. Future work will incorporate a leave-one-dataset-out (LODO) validation protocol, in which each dataset is systematically held out as an independent test set. In contrast, the remaining datasets are used for training and hyperparameter selection. This approach will provide a more rigorous assessment of cross-platform and cross-disease generalisability.
Conclusion
This paper introduced MICRO-AI, a comprehensive ML framework for DNA microarray analysis and automated disease detection. The framework addresses the key challenges of high dimensionality, batch effects and limited sample sizes through four integrated modules: robust preprocessing with quantile normalisation and ComBat correction, attention-weighted feature selection that reduces dimensionality by over 99% (from ∼20,000 to ∼127 genes), adaptive ensemble classification combining GBM, RF and SVM with optimised weighting, and clinical integration with calibrated probability outputs.
Extensive validation across six benchmark datasets from three independent repositories (GEO, TCGA, ArrayExpress), encompassing 2321 samples across four cancer types, demonstrated state-of-the-art performance: 96.8% average accuracy, 95.2% sensitivity, 97.4% specificity, 0.983 area under the receiver operating characteristic curve (AUC-ROC), and 0.928 Matthews correlation coefficient (MCC). Comparative analysis against ten competing methods confirmed that MICRO-AI achieves 1.2–7.5% accuracy improvement while maintaining competitive computational efficiency (52.3 s average training time), representing 2.4–6.0× faster execution than deep learning alternatives such as GeneFormer and scBERT. The ablation study demonstrated that each component contributes meaningfully, with RFECV (−4.1%), attention mechanism (−2.4%) and ComBat correction (−1.7%) providing the most significant contributions.
Despite these achievements, several limitations remain. The framework relies on labelled training data, may be sensitive to extreme class imbalance, and has been validated only on retrospective public datasets, not on prospective clinical trials. The SVM component's quadratic complexity may pose scalability challenges for very large transcriptomic cohorts.
Future research directions include: (1) multi-omics integration incorporating transcriptomic, epigenomic and proteomic data for comprehensive molecular profiling; (2) federated learning adaptation for privacy-preserving collaborative genomic analysis across clinical institutions; (3) prospective clinical validation through pilot studies in hospital environments to assess real-world robustness, calibration reliability and clinical utility; (4) cost-sensitive and class-balanced learning strategies for improved performance on rare disease subtypes; and (5) external independent validation using LODO protocols to further strengthen generalisability claims.
Footnotes
Ethical approval
This research study solely involves the use of historical datasets. No human participants or animals were involved in the collection or analysis of data for this study. As a result, ethical approval was not required.
Author contribution
All aspects of the research, including conceptualisation, methodology, software development, formal analysis and resource provision, were solely carried out by Manal A. Othman. The manuscript was also written, reviewed and edited independently by the author.
Funding
The author disclosed receipt of the following financial support for the research, authorship, and/or publication of this article: This work was supported by Princess Nourah bint Abdulrahman University Researchers Supporting Project number (PNURSP2026R473), Princess Nourah bint Abdulrahman University, Riyadh, Saudi Arabia.
Declaration of Conflicting Interests
The author declared no potential conflicts of interest with respect to the research, authorship, and/or publication of this article.
Data availability
The datasets used to support this study are publicly available at: