
Abstract
This study analyzes the temporal evolution of canine leishmaniasis in the province of Tarragona (Catalonia, Spain) over the past four decades using historical case records from local animal shelters (2018–2022) and publicly available epidemiological datasets (1985–1994). All this information was compiled to construct long-term positivity trends and compare them with regional temperature records obtained from the Servei Meteorològic de Catalunya. To forecast future incidence, we adapted an existing single-season SEIRD model of human leishmaniasis into a multiseason dual-host system (dogs and sandflies). Model equations were modified, and model parameters were calibrated using observed positivity from the previous collection of data. The resulting simulation model reproduces the historical increase in canine positivity (which grows approximately 4% from 1985–1994 to 2018–2022, meaning it stays pretty stable) and predicts certain stability after an initial increase. However, when considering an increase in the temperature overtime to simulate global warming, the model has the same initial increase but, afterwards, the dog population starts decreasing significantly due to deaths caused by the disease. The model provides a transferable framework for forecasting pathogens transmitted by sandflies, mosquitoes, or other arthropod vectors. This model could be adapted to become a digital twin if there was a constant and sufficient supply of data.
Introduction
The primary objective of this work is to develop a robust and versatile predictive model that accurately simulates the dynamics of leishmaniasis spread. By defining this model, we aspire to not only visualize the progression of the disease but also to provide insight into its future trajectory, enabling effective planning for prevention and intervention measures.
In this study, particular emphasis will be placed on the epidemiological characteristics of the disease, with a focus on the province of Tarragona, Catalonia, Spain. The model will be specifically calibrated using data from this region, allowing for localized predictions tailored to the unique environmental and demographic factors influencing disease spread. We hypothesize that the incidence of infected dogs will exhibit a significant increase over time, leading to a corresponding rise in leishmaniasis cases.
To implement the simulation model, we use Insight Maker, 1 which provides a platform for constructing system dynamics models with relative ease. This tool will enhance our ability to visualize the complex interactions between variables influencing disease spread. Our approach will be grounded in a preliminary model 2 that will be improved to be able to represent the interaction between different populations as will be detailed next. Ultimately, this research will contribute to a deeper understanding of canine leishmaniasis and facilitate the development of effective strategies for its control and prevention, leveraging the capabilities of a dynamic model to simulate and predict the evolution of this concerning health issue.
Leishmaniasis is a complex of infectious and parasitic diseases 3 of complicated classification. Diseases can be classified mainly according to four aspects: (i) mode of transmission, (ii) cause or pathogen, (iii) duration, and (iv) spread.
Depending on the mode of transmission, diseases can be directly transmitted diseases or indirectly transmitted diseases. Leishmaniasis is an indirectly transmitted disease, which are those diseases in which proximity between someone infected and someone not infected is not necessary, since transmission is through a shared utensil, infected water or food or a vector. 4 The transmission of leishmaniasis occurs by a vector, that is, the carrier of the disease is an infected insect. More specifically, leishmaniasis is transmitted through the bite of a female sandfly that has previously bitten someone infected. 5
Depending on the pathogen, that is, what spreads the disease, diseases can be bacterial, viral, fungal, caused by helminths (worms), or caused by protozoa. 6 Leishmaniasis is a disease caused by protozoa. This type of disease is the result of infection with protozoa, a single-celled organism that is transmitted either by lack of water treatment or by insect bites, as is the case with leishmaniasis. The protozoan that causes it is known by the name of Leishmania. 7
Depending on the duration, illnesses can be acute illnesses or chronic illnesses. Leishmaniasis is generally a chronic disease 3 that is, a long-term disease that can even be suffered throughout life.
Depending on the spread, diseases can be endemic, epidemics, or pandemics. Leishmaniasis is an endemic disease, that is, it is constantly present in certain regions of the world. These regions are Asia, Africa, the Americas, and the Mediterranean region, 8 therefore, it is endemic to Catalonia, where this work will focus.
Within leishmaniasis there is also a classification. Leishmaniasis can be classified according to the organism affected and according to the organ or system affected. The Annex provides a comprehensive overview of leishmaniasis, detailing its classification by the affected organism and organ/system, as well as symptoms, diagnosis, and treatment options for each type.
Leishmaniasis is a zoonosis transmitted via vectors like sandflies (and sometimes ticks). A zoonosis is a disease that can pass between animals and humans, either directly or via a vector. 9
For leishmaniasis the transmission is indirect: an infected animal infects a sandfly, which then infects a human, therefore, Leishmaniasis is a vector-borne disease, transmitted by vectors carrying one of the 20 species of Leishmania protozoan parasites. The only scientifically recognized vector of leishmaniasis is the sandfly (Figure 1). 10

Phlebotomus. Source: Luis Fernández García, CC BY-SA 3.0 https://creativecommons.org/licenses/by-sa/3.0, via Wikimedia Commons.
Sandflies are a type of insect and their life cycle is holometabola, that is, throughout their life they carry out a complete metamorphosis. This metamorphosis has four distinct states, which are: egg, larva, pupa, and adult. At birth, they are found in the form of elongated eggs and yellowish in color. Then, when they hatch from the eggs, they become larvae, like caterpillars, and over time they become pupae. Finally, they transform into adults, a stage that lasts about a month. The life of a sandfly, in total, is between 30 and 100 days and varies according to the climatic conditions in which the sandfly is found and its species.
Sandflies live in places with high humidity and moderate temperature. They can be found in tropical, subtropical, and warm regions. They feed, both females and males, on the nectar of plants and sugar secretions that they find around where they live. They reproduce in sandy, moist and safe soil. To reproduce, female sandflies need to suck blood from vertebrate animals to develop the 40 or 60 eggs they lay. 11
The transmission of leishmaniasis by sandflies occurs exclusively in the process of feeding a female sandfly to develop her eggs. If a female sandfly is infected with leishmaniasis when it draws blood, it also infects the animal from which it extracts. Similarly, if a female sandfly is not infected and sucks blood from an infected animal, it becomes infected too. In this way, the female sandfly passes the disease from individual to individual. 11
Although sandflies are the only known vectors of leishmaniasis, it has been theorized that ticks and fleas could also be transmit the disease but this has not yet been proven.10,12 For that reason, we only took into account sandflies transmission of the disease when creating the model.
Distribution and propagation
Leishmaniasis is a disease that is widespread in many different areas of the world. It is endemic in 89 countries located in Asia, Africa, the Americas, and the Mediterranean region. Canine leishmaniasis is endemic in Spain, see Figure 2 and, therefore, also in Catalonia. Depending on the area, there is a percentage of 8% to 17% seroprevalence, which is the number of dogs that have antibodies to the disease and have therefore been in contact with it.13,14

Updated map of seroprevalence of Leishmania infantum infection in dogs in Spain. Source: R. Gálvez et al.,14
To understand the distribution of leishmaniasis, factors that have to do with both the environment and changes in the affected species or vectors must be considered. The two most relevant factors for studying the epidemiology of leishmaniasis are the movement and distribution of infected species, both animals and people. These are influenced by variables such as the socioeconomic situation and urbanization of endemic rural areas, and the movement of the vectors that cause it, mainly affected by climate change and vegetation index.15,16
Socioeconomic situation
Leishmaniasis, like many tropical diseases that are frequently neglected, is closely related to the socioeconomic situation of those who can contract it. This is because households with worse socioeconomic situations tend to have more problems with malnutrition, quality of home and the condition of pets, very relevant factors with the risk of contracting leishmaniasis. 16 In addition, this disease, once contracted, has a great economic impact on those who contract it and significantly worsens the situation of these families. 17 For these reasons, leishmaniasis is more easily distributed in poorer areas.
Urbanization
Urbanization can be understood as the process through which a city is established and developed, constructing buildings, establishing streets, providing access to electricity or water services and making space for more people to live there. 18 This is one of the factors that affect the spread of vector-borne diseases such as leishmaniasis.
When the urbanization process occurs near rural areas or forests, there is an increase between the contact of the population and possible vectors that reside in these areas, thus making the population of the urban area more susceptible to being infected. The establishment of crop fields or water supply, in addition to deforestation and the reduction of biodiversity, are effects of urbanization that can favor the spread of leishmaniasis, since they increase contact with possible vectors and decrease the number of predators of these. 19
On the other hand, it is not only the location of the urban area that can negatively affect the spread, but the planning and organization of the city itself also plays an important role. As a result of planning an urbanization without taking public health into account, various problems can arise such as inadequate housing conditions, urban solid waste management or lack of green areas, which create a space in which it is more prone to the spread of leishmaniasis. 20
Climate change
Climate change is one of the most serious factors by which leishmaniasis can be affected. This is because the behavior of the vectors that transmit it depends largely on the climate that surrounds them.
Sandflies, like any other species, have certain climatic and meteorological conditions that are optimal for their development and proliferation. In its case, the optimal temperature is 27°C to 29 °C and its optimal humidity percentage is 41% to 50%. As the temperature decreases below 27 °C, the number of sandflies decreases significantly. Although, at temperatures below 27 °C, from 21°C to 26 °C, sandflies are more capable of surviving than at temperatures above 29 °C. Similarly, a percentage of humidity below or above the optimum also decreases the number of sandflies. Unlike temperature, however, sandflies are better able to survive with higher than optimal humidity percentages than with lower humidity percentages. 21
The optimal conditions for the development and proliferation of ticks are quite different from those of sandflies. These are only capable of attaching to a host with temperatures above 7 °C and can only survive in habitats with a humidity percentage above 85%. 22
Climate change alters global temperature and humidity and, therefore, varies the distribution and behavior of sandflies and ticks. Although sandflies and ticks have different optimal survival conditions, the effect that climate change has on them is similar.
In the case of sandflies, the effects of climate change, especially the increase in temperatures during the winter, mean that sandflies can spread to areas where they did not previously exist. These warmer winters mean that sandflies can survive during this season in areas where earlier at this time of year there were temperatures too low for their survival. This fact allows the proliferation of the species in new places and, therefore, the increase in the disease it transmits, leishmaniasis. 23
Ticks can survive on the water they extract from humidity in the air, and, to achieve higher humidity, they live in moist soils. However, they can climb the grass and extend their legs to attach themselves to an animal or human and suck on them to survive regardless of the temperature or humidity percentage. Climate change, with the increase in temperature above the optimum of ticks, means that there are worse conditions for the survival of ticks, which, finding themselves in more extreme situations for their survival, tend to look for guests in a more exaggerated way. This has caused ticks to expand their territory by traveling with their hosts, increasing the expansion of exotic species and increasing the number of diseases caused by ticks, including leishmaniasis. These effects of climate change have already been seen in the United States where, in the past 20 years, the number of tick-borne diseases has doubled. 24
Vegetation index
Another factor of important relevance for the distribution of leishmaniasis is the vegetation index. For both sandflies and ticks, the vegetation allows them to maintain the necessary moisture they need to survive. Apart from this, the vegetation has different nuances that make it necessary for the survival of these two species. In the case of sandflies, it provides them with the sugar they need to feed. In addition, vegetation is the food of many mammals from which they suck blood and to which, if infected, they transmit leishmaniasis. These animals can act as reservoirs of the disease and affect its distribution. 16 In the case of ticks, as mentioned above, the vegetation allows them to attach themselves to new hosts due to the height that the vegetation provides them with. Thanks to it, they can feed on the blood of humans or animals that pass-through vegetation and transmit the disease to them in this way. 24
This factor, which is often overlooked, has been shown to be a key variable in explaining the distribution of leishmaniasis. 16
Evolution
Leishmaniasis is a disease that has been present for a long time, with case data in ancient times, but an increase in cases has been observed today, especially in the past 25 years. 25 On a global scale, there has been a gradual increase in cases of leishmaniasis on each continent, which causes total cases to grow exponentially. The total number of cases between 1960 and 2012 can be seen in the following cumulative graphs (Figure 3) of both visceral leishmaniasis and cutaneous leishmaniasis. 26

Cumulative graphs of visceral leishmaniasis (left) and cutaneous leishmaniasis (right). Source: D. M. Pigott et al. 16
In Spain, the first cases of leishmaniasis occurred in 1912, in the Delta d’Ebre. 27 However, it was not until 2015 that leishmaniasis was declared a notifiable disease in the country through Red Nacional de Vigilancia Epidemiológica (RENAVE). 28 From 2005 to 2010, the average number of leishmaniasis cases per year was 115 cases. This figure increased, however, in the following years, with 271 cases in 2011 and 265 in 2012, due to an outbreak of leishmaniasis that occurred in the Community of Madrid during this period. This figure decreased to 176 cases in 2013, as the outbreak began to be controlled in the Community of Madrid (Figure 4). 29

Graph of leishmaniasis cases per 100,000 inhabitants in Spain from 2009 to 2015. Source: “Home—ISCIII Portal Web.” Accessed: Aug. 06, 2025. [Online]. Available: https://www.isciii.es/en/.
After the leishmaniasis outbreak in the Community of Madrid, cases of leishmaniasis stabilized from 2013 to 2015 and it can be said that from 2016 onwards the number of cases has remained stable. There is a decrease in 2020, probably due to the pandemic, and a subsequent increase in 2021 (Figure 5). 29
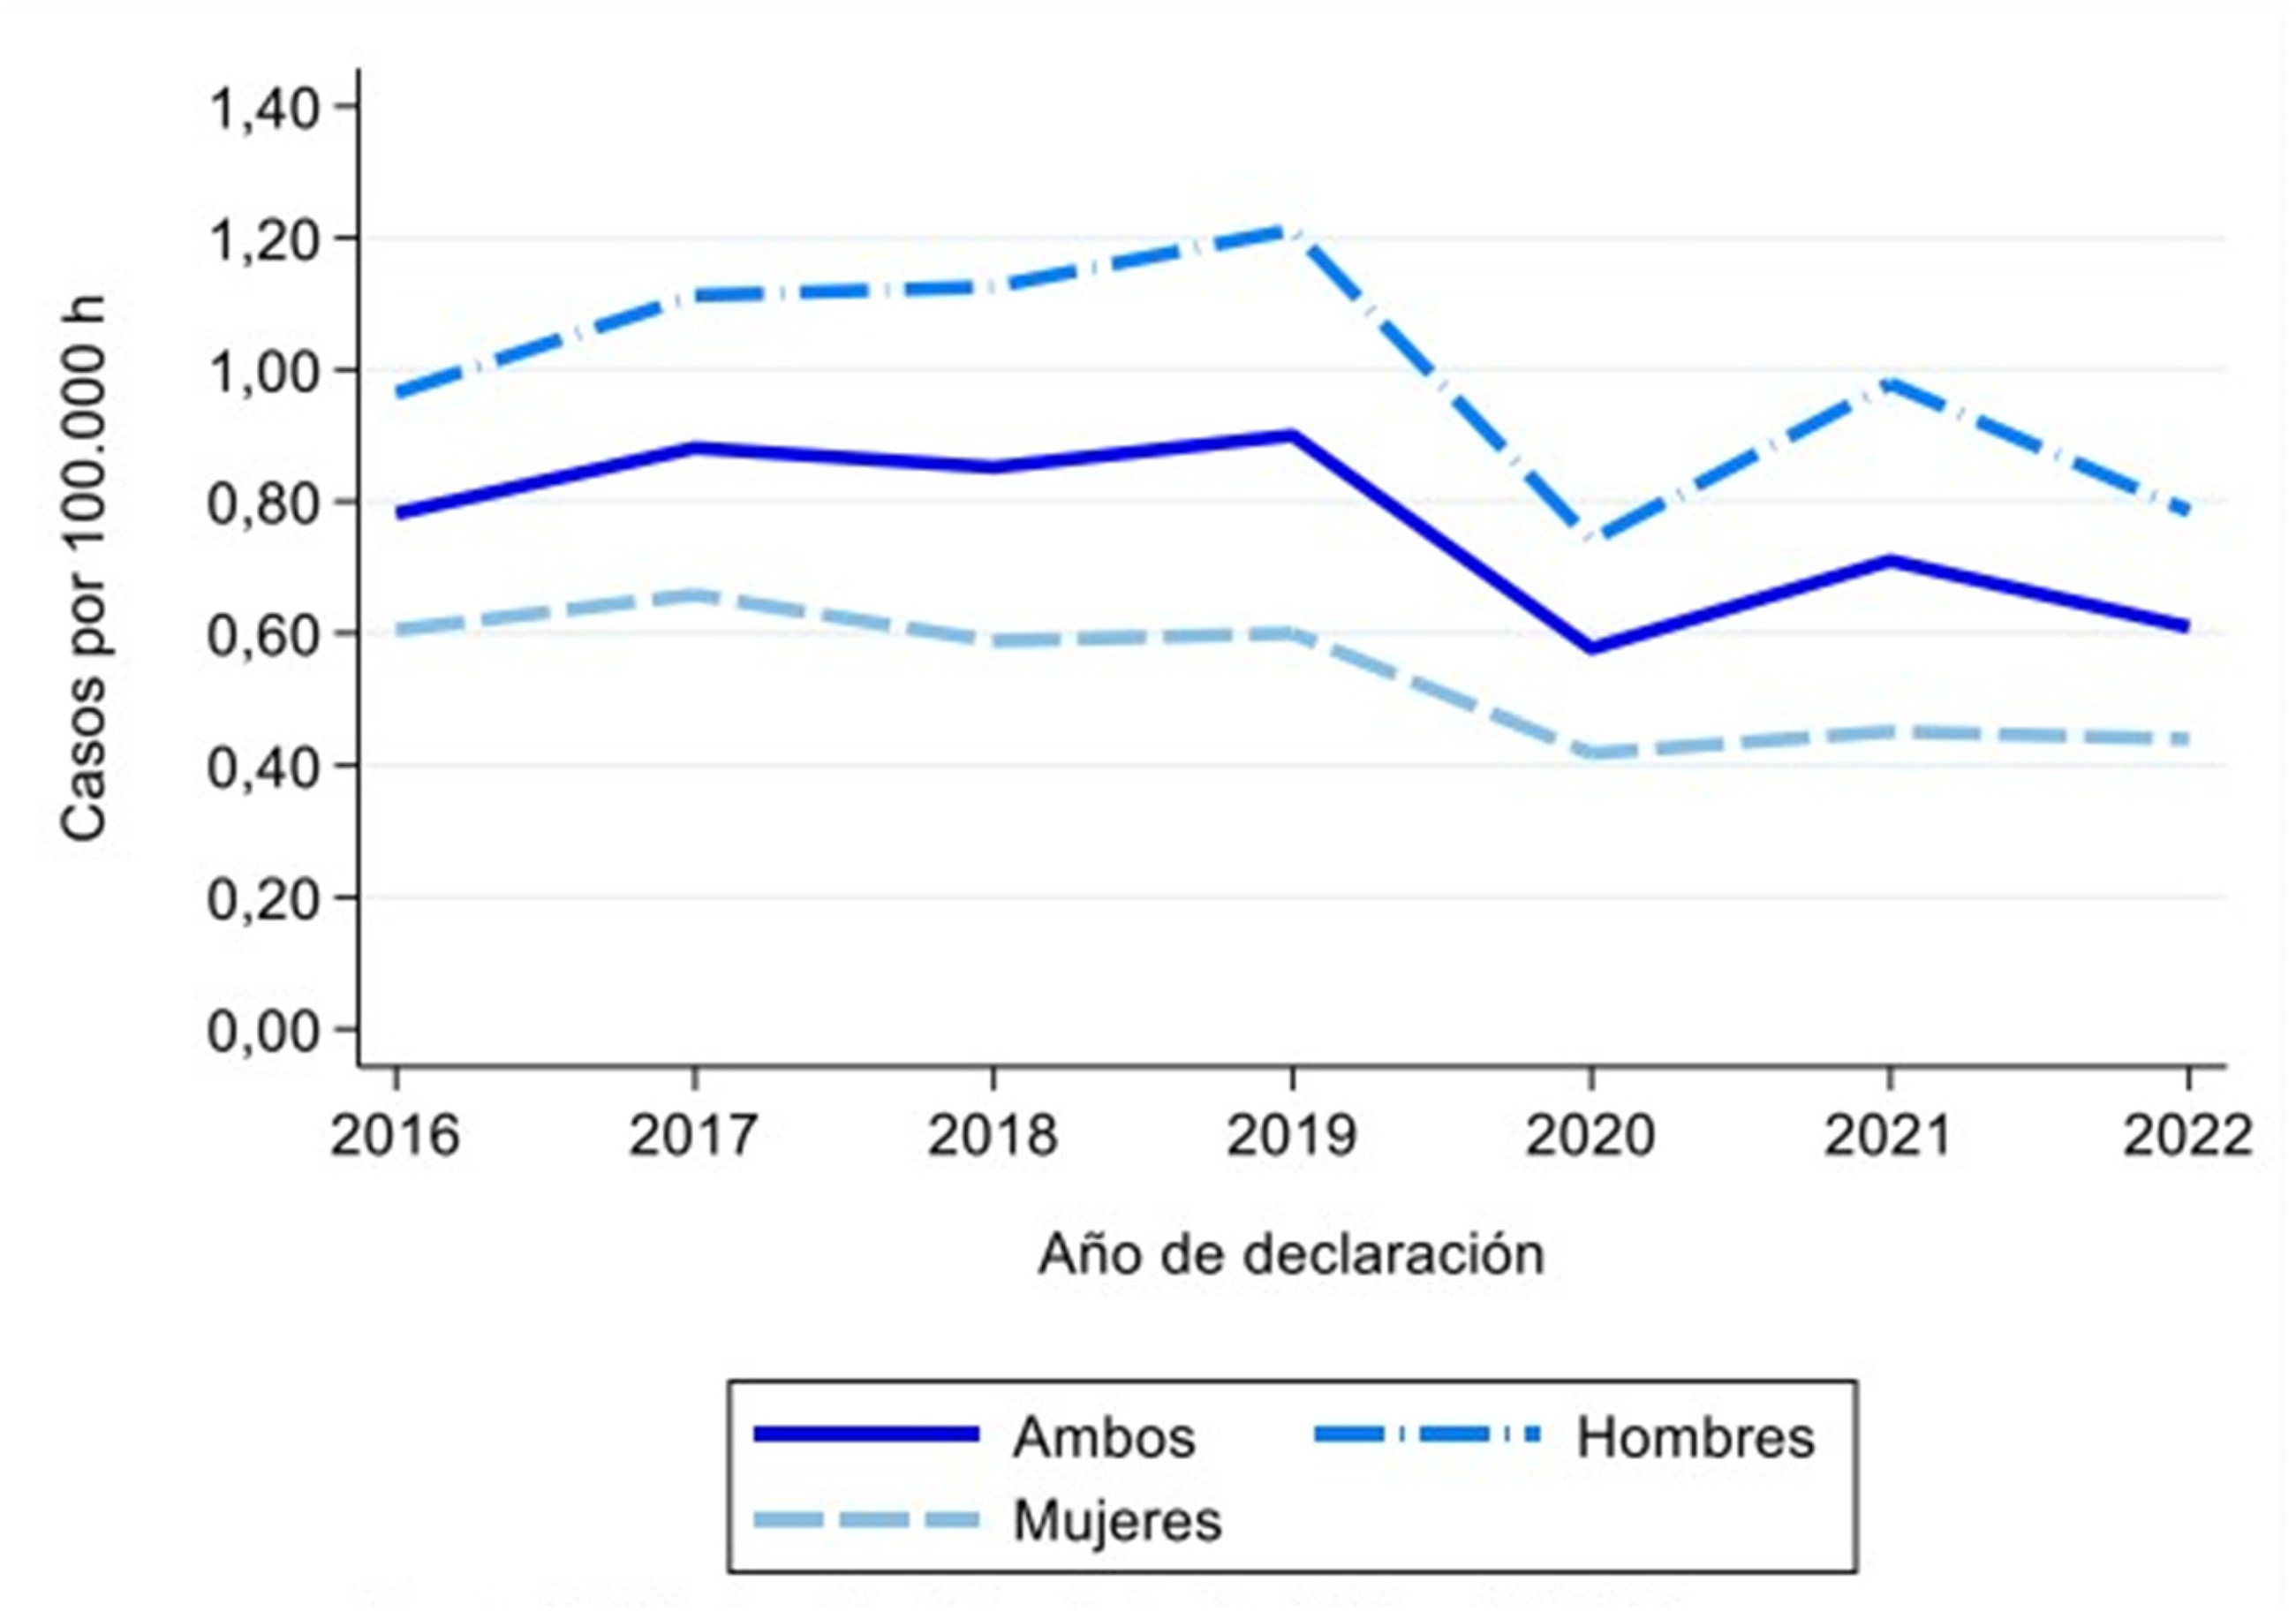
Graph of leishmaniasis cases per 100,000 inhabitants in Spain from 2016 to 2022. Source: “Home—ISCIII Portal Web.” Accessed: Aug. 06, 2025. [Online]. Available: https://www.isciii.es/en/.
Despite the increase in cases in humans between 2010 and 2013, cases of canine leishmaniasis in Spain have not been seriously affected by the outbreak in the Community of Madrid. This can be attributed to the protection that dogs have with owners and that, during this outbreak, the main reservoirs were rabbits and hares. 30 Despite this, cases of leishmaniasis in this area have been gradually increasing over time. The progression can be seen by analyzing the average seroprevalence of the disease over the following years (Figure 6). 31

Graph of the average leishmaniasis seroprevalence in dogs from 2007 to 2019. Source: A. Müller et al.31
The incidence of leishmaniasis across several provinces in Spain has been studied, 14 detailing the specific sandfly species responsible for transmission in each area. Researchers conducted seroprevalence tests on dogs throughout these regions to determine which species had bitten them and to quantify the number of infected dogs. Their findings, illustrated in an accompanying map, reveal that leishmaniasis is endemic to much of Spain, with Phlebotomus perniciosus identified as the predominant sandfly species. Another article 32 addresses the effects of climate change on vector-borne diseases, explaining the concept of vectors and analyzing how climate-related factors, such as shifts in temperature, altered rainfall patterns, and increased frequency of extreme weather events, impact vector behavior and their geographical distribution.
Focusing specifically on canine leishmaniasis, study 33 sheds light on how dogs become infected, the latency period before symptoms occur, and the range of symptoms presented. This research also outlines various types of leishmaniasis, prevention strategies, and treatment options, contributing essential knowledge about the disease. Additionally, 34 explores the relationship between climate change and disease transmission in Spain, providing specific data on both human and canine leishmaniasis. The study highlights an expected rise in cases, particularly in urban areas where dog populations are more concentrated, emphasizing the need for continued research in this field. In addition, this other article 35 discusses identification methods for canine leishmaniasis cases, detailing diagnostic tests such as PCR and other techniques. It underscores the chronic nature of the disease and reviews the effectiveness of available treatments, noting the difficulties in eliminating the pathogen.
Material and methods
Firstly, we wanted to have an idea of the increase of leishmaniasis positivity and of temperature by studying their evolution with data from the area in which this study is based. To do so, we contacted local animal shelters (Can Flix, Tarragona) to obtain recent case data on canine leishmaniasis. Additionally, we compiled historical case records for Tarragona from publicly available sources to construct temporal incidence series. Concurrently, we retrieved local temperature data of the same periods and generated corresponding time-series plots. Comparative analysis of the disease and temperature series was then performed to assess associations between temporal trends in canine leishmaniasis and changes in ambient temperature.
The graphs resulting from the initial study of leishmaniasis evolution were later used to validate the simulation model made in Insight Maker by comparing the positivity increase in the graph to that of the model to see if they followed the same trend.
Secondly, we made a simulation model in Insight Maker by adapting an existing human-based leishmaniasis simulation model 36 to include sandflies population dynamics and use dogs as the main population.
The application of dynamic models based on the SEIR framework is well-established, with successful modeling of various pathogens, including influenza, 37 COVID-19,38–40 and Mpox, 41 among others. However, there has been no similar approach for modeling canine leishmaniasis that considers both dog and sandfly populations.
The overall architecture we follow, as will be shown below, is that of a Digital Twin, where various data, models, and implementations are organized to facilitate continuous forecasting.
Although we are currently using the model primarily to forecast possible trends in the spread of canine leishmaniasis, our long-term goal is to develop a fully integrated Digital Twin. This future model will incorporate sensor data and real-time information to effectively manage the evolution of leishmaniasis in the canine population.
Digital twin architecture
We adopted the Digital Twin architecture described in reference [42]. In this framework, the Digital Master encapsulates the definition and documentation of the model, articulated through System Dynamics equations. Meanwhile, the implementation of Digital Master Simulation instances is executed using Insight Maker (Figure 7).
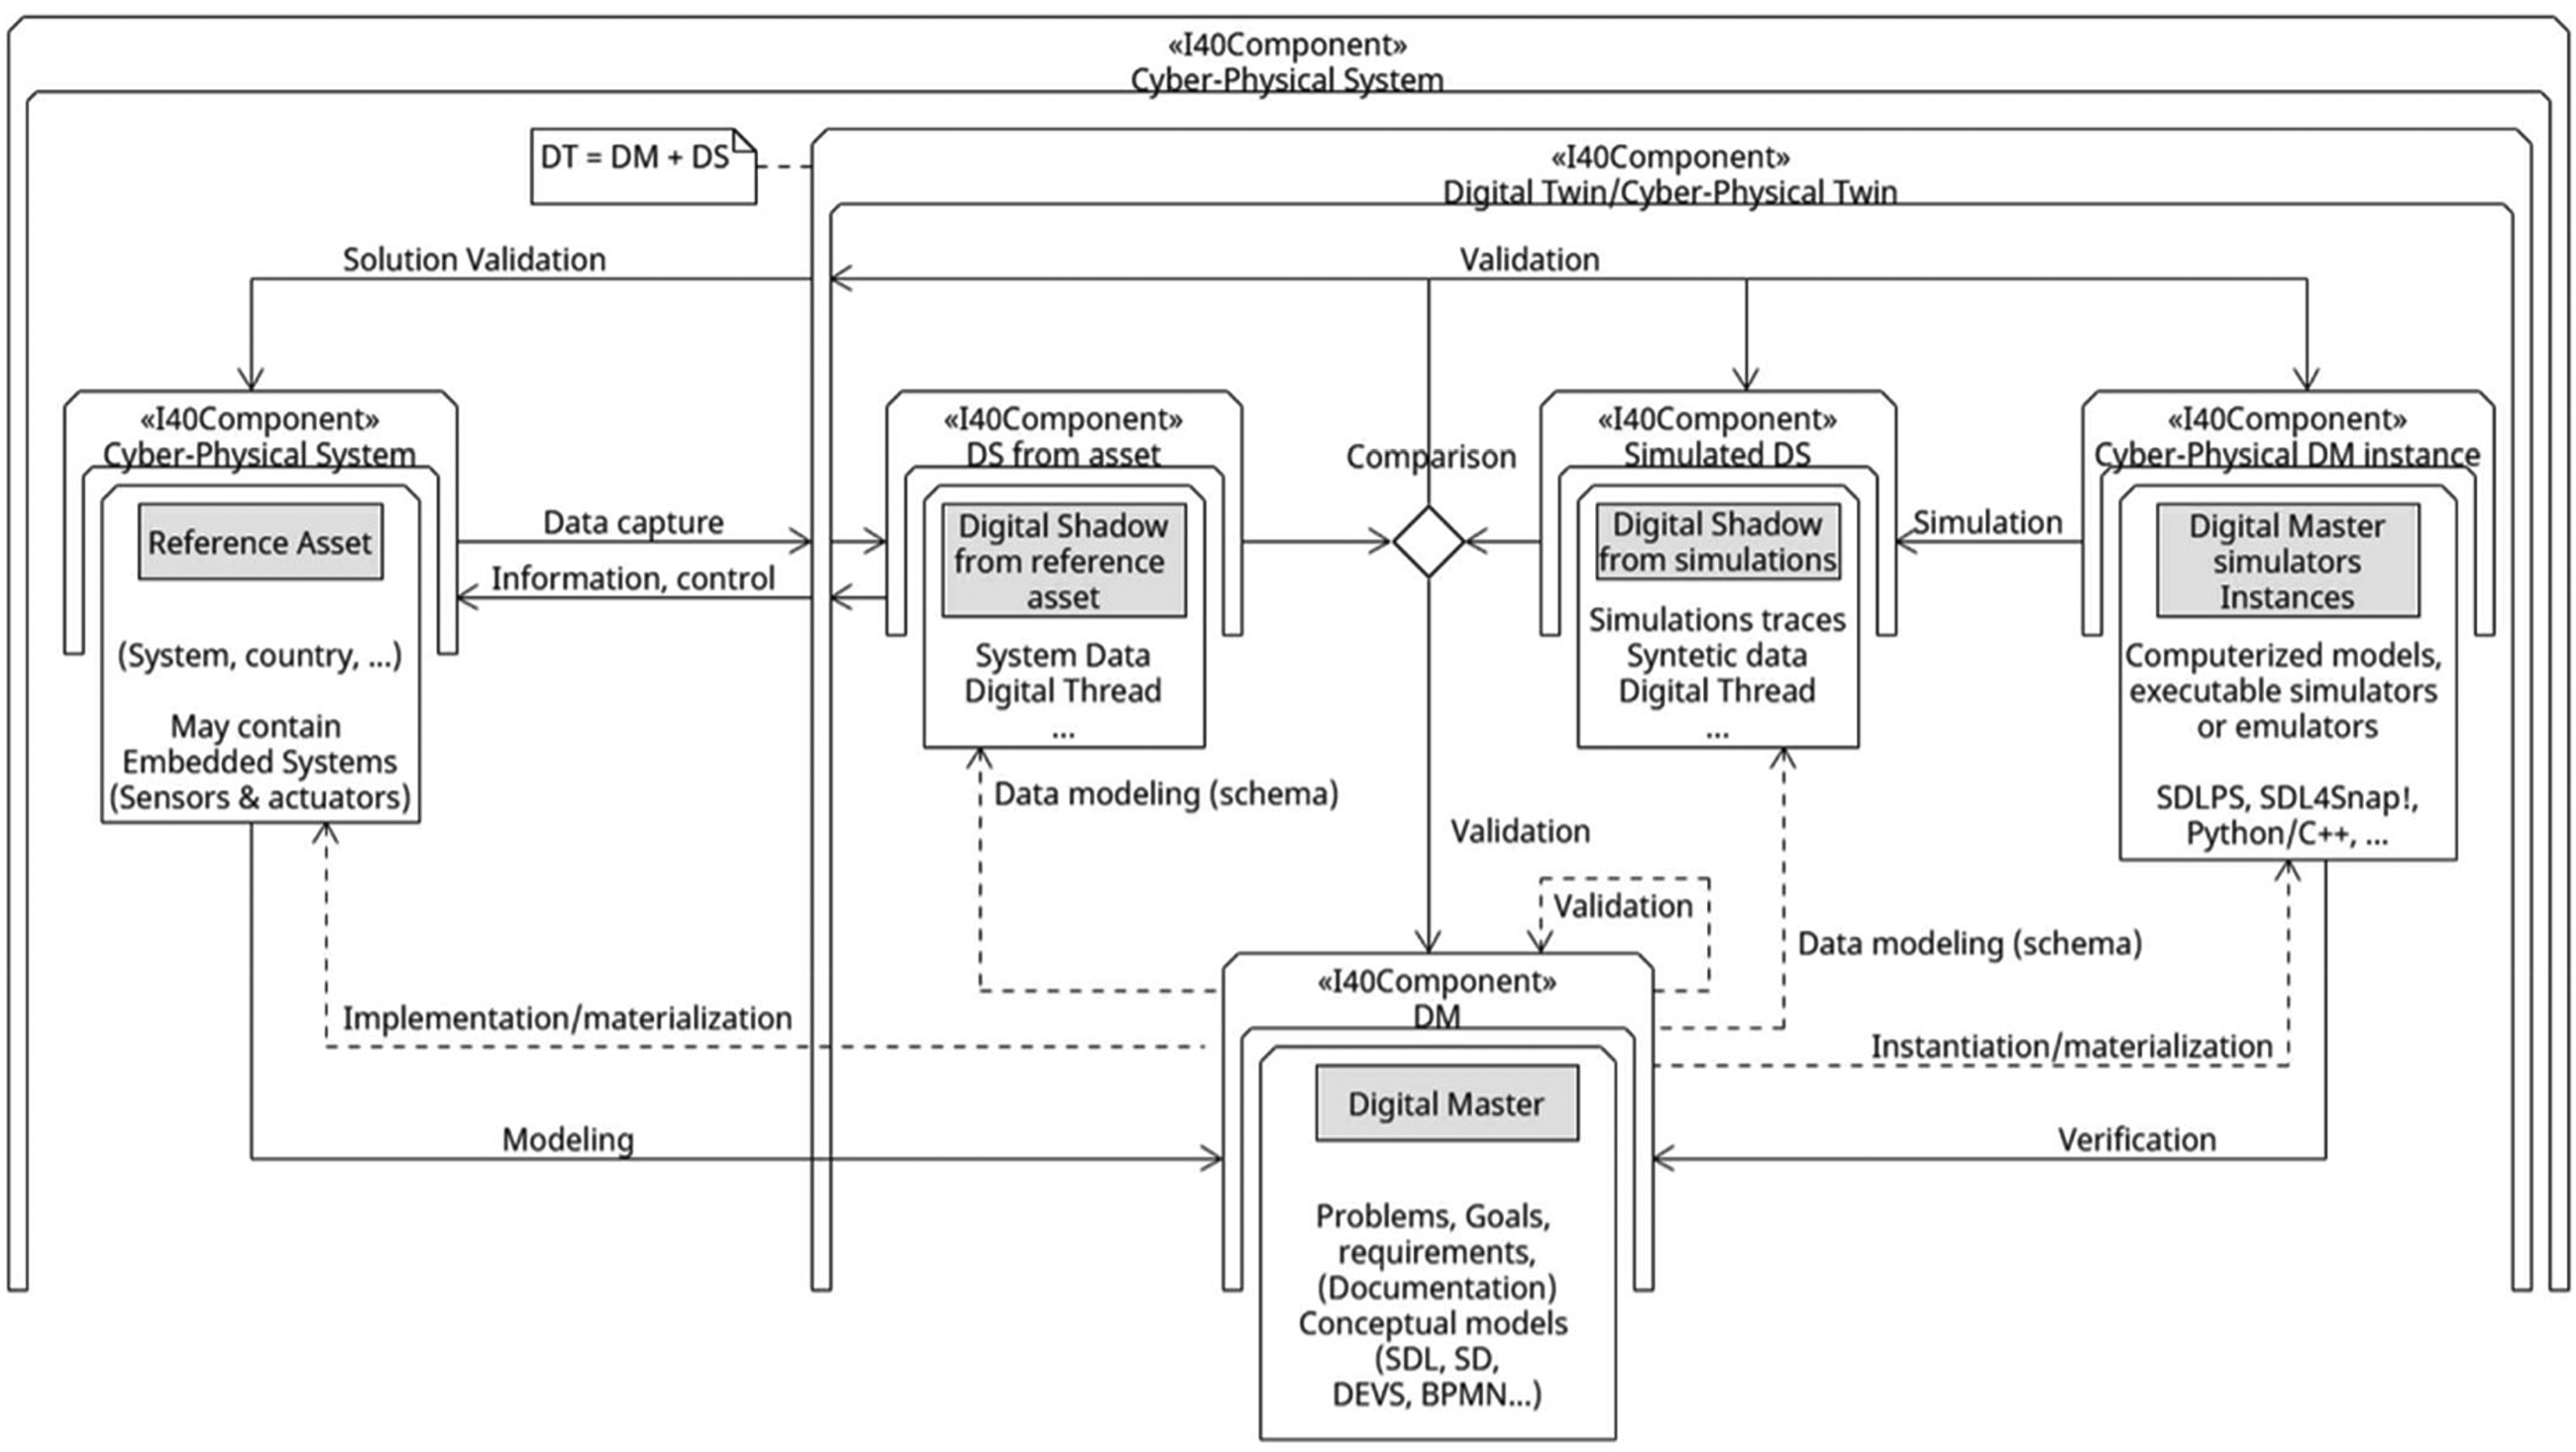
Digital twin architecture used on this project. Source Fonseca i Casas P and Pi i Palomes. 42
Specifically, the main components are:
Digital shadow from the reference asset: This component includes evidence tracking the spread of canine leishmaniasis in Tarragona, such as historical case data, sensor readings from affected areas, and veterinary reports. Ideally, this information is collected and stored digitally using automated technologies, but this is not the current situation of this information. A digital thread can be created using assumptions from the digital master, which helps monitor the disease's impact on the canine population. Digital shadow from simulation: This part consists of synthetic data generated by simulations or expert predictions about the spread of leishmaniasis among dogs. This data can help test different scenarios, such as changes in climate or population density, and can be compared to actual case data to improve the model and validate its assumptions. Digital master: This is the detailed documentation of the model that describes the Digital twin (DT) representing canine leishmaniasis in Tarragona. It outlines the parameters and rules that determine how the disease spreads among dogs. In our case we use system dynamics model, and the data assumptions that determine the current knowledge that exist regarding the phenomenon. Digital master simulator instances: This is the operational version of the DT that runs on a computer to generate synthetic data about leishmaniasis spread. It can be created by the digital master. In our case this is implemented using insight maker tool.
Data collection
To gather the necessary information for our research, and as to create the digital shadow from reference asset part of our preliminary digital twin, we requested data on the annual incidence of canine leishmaniasis over the past 40 years from animal shelters in the province of Tarragona. This approach aimed to analyze the disease's evolution over time. Additionally, we collected temperature data for the same region over the same timeframe to create comparative graphs and explore potential correlations between temperature fluctuations and the incidence of the disease. Despite reaching out to multiple animal shelters, we only received data from Can Flix.
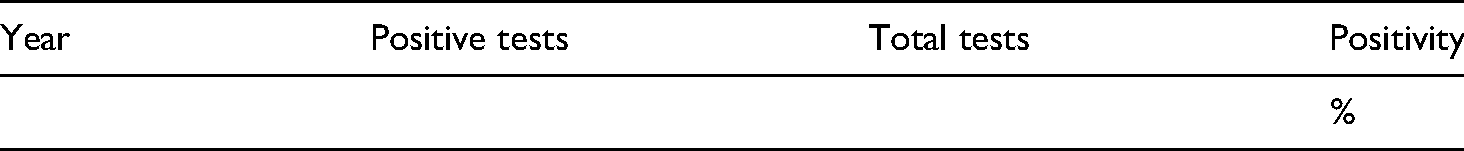
To obtain the data and to analyze it we organized it into tables, as shown below.

When these were done, we made grids with the total data we extracted from each year:
With the obtained information we were able to detail a trend in Catalonia, a gradual rise, an area of Spain where the average seroprevalence of leishmaniasis in dogs is quite high. 14 Tarragona is a province considered an important focus of canine leishmaniasis, 43 in addition to being the area in which this work is concentrated. In Tarragona it has been possible to identify a slight increase over time, which is reflected in the following graph (Figure 8) made from historical data on leishmaniasis 44 and data extracted from the Can Flix shelter. 45
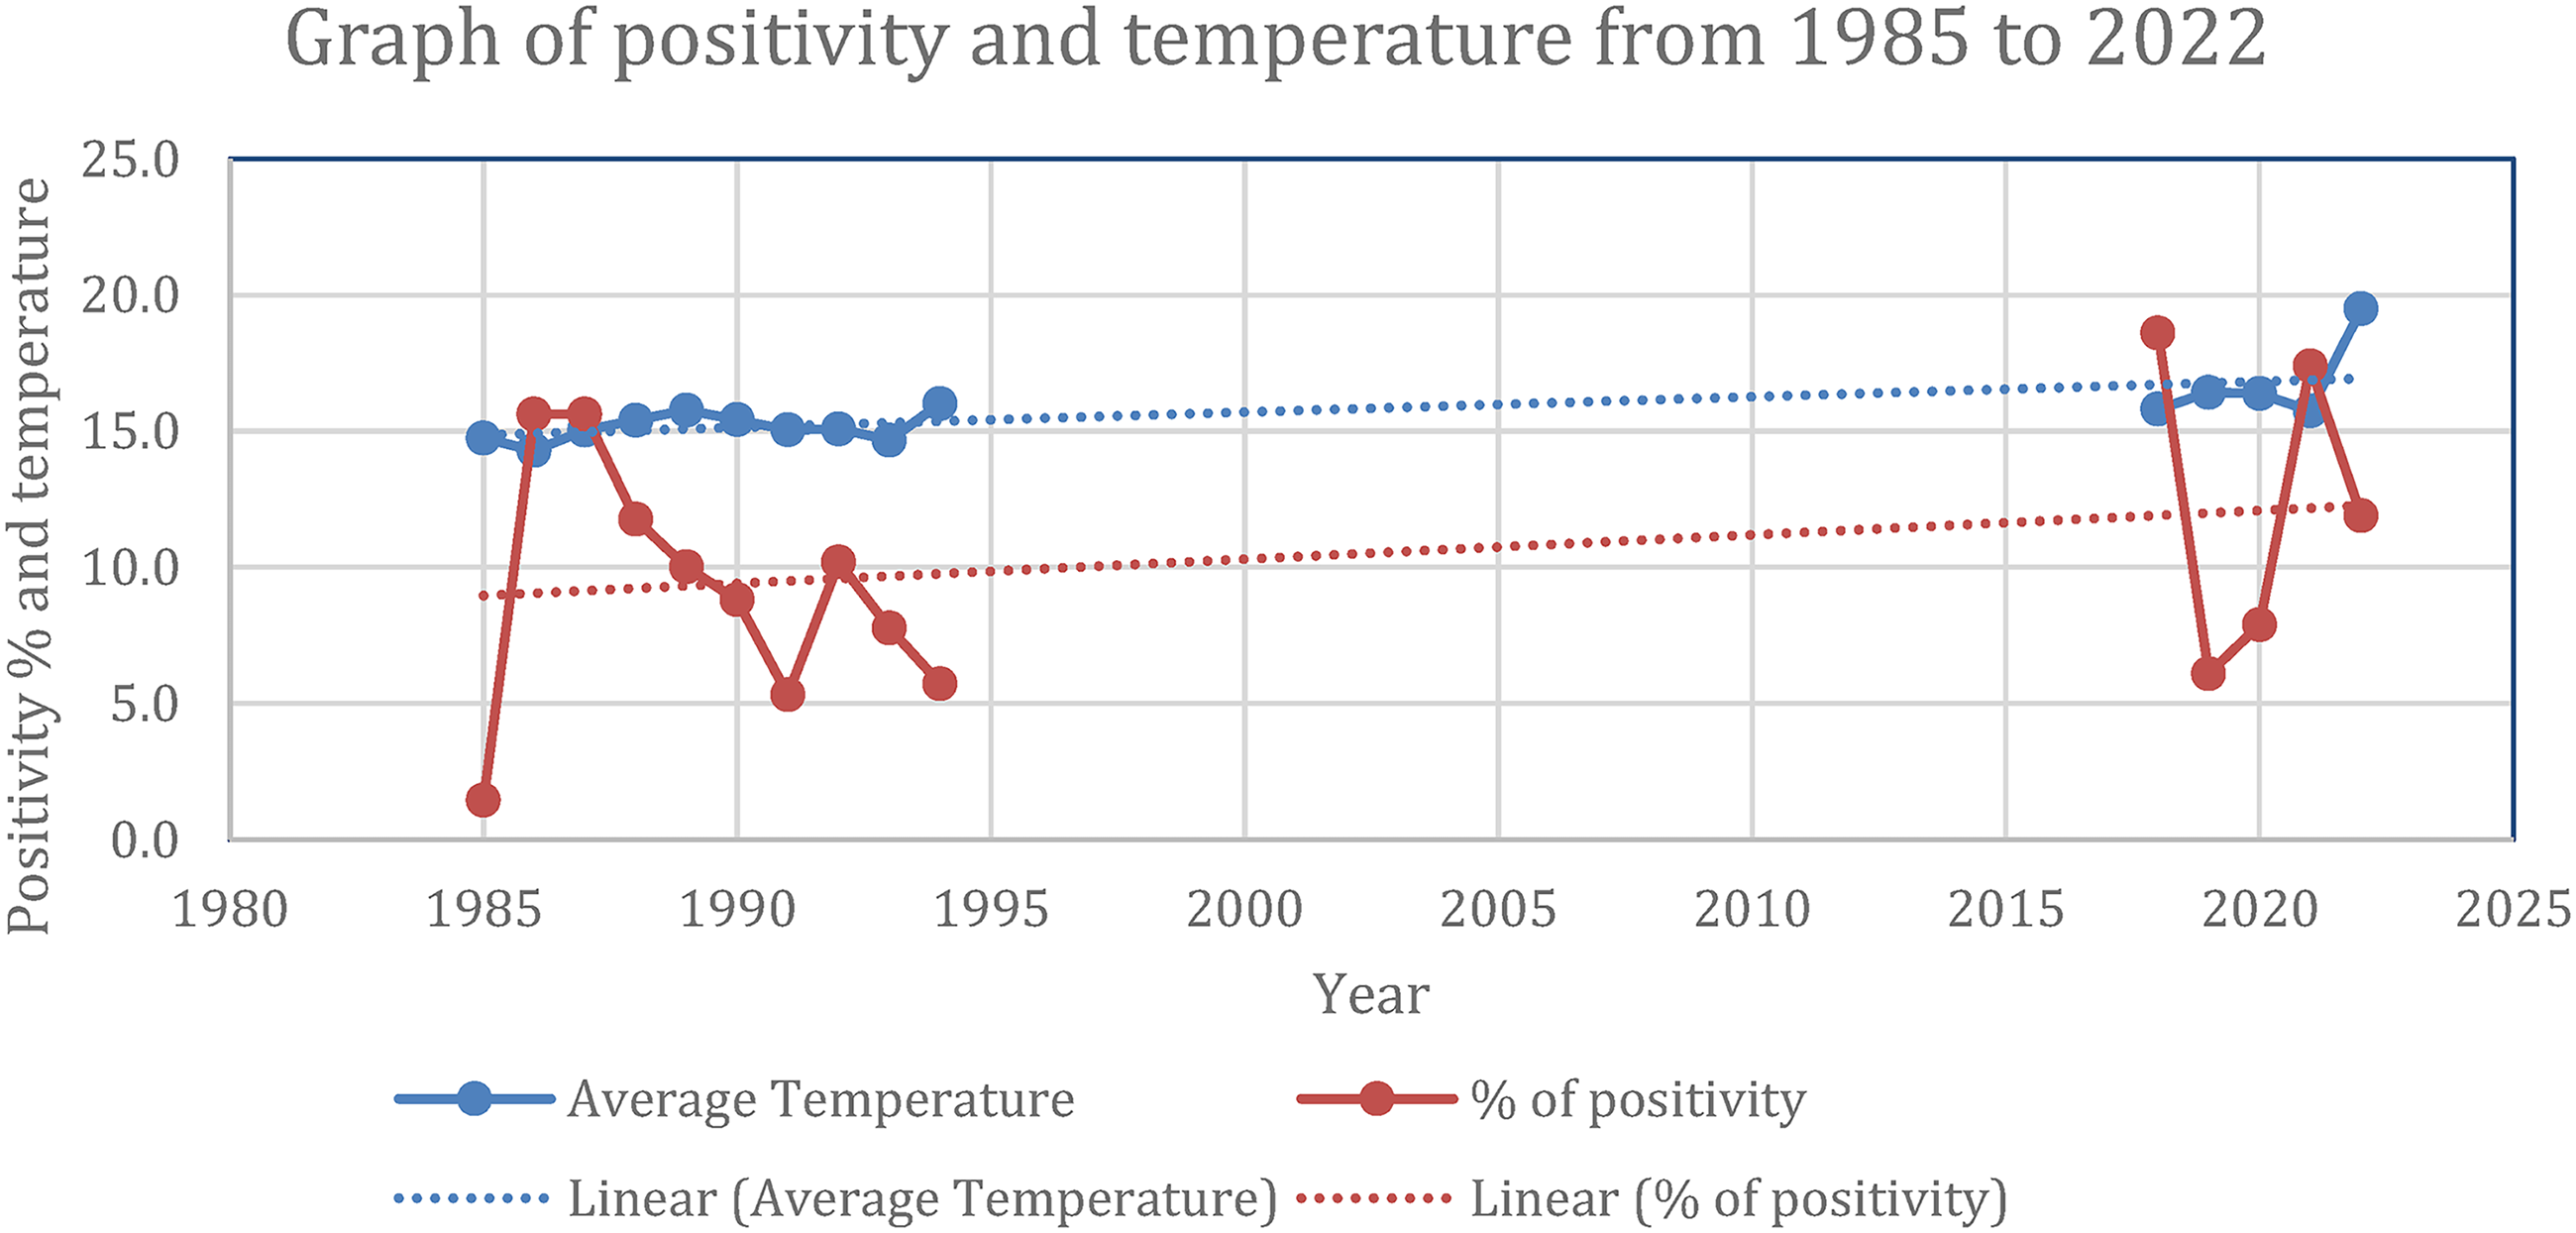
Graph of the average leishmaniasis positivity in dogs in Tarragona from 1985–1994 to 2018–2022.
The graph illustrates the increasing trend in the positivity percentage of leishmaniasis cases alongside average temperature variations in Tarragona from 1985 to 2022. While data from 1995 to 2017 is absent due to a lack of monitoring for leishmaniasis, the available data shows a slight rising trend during the recorded periods. Although no direct correlation is evident between yearly temperature changes and positivity rates, both trends are upward. When further analyzing this graph, we can see that, individually, the two periods from which we have consistent data have downward trends. However, a crucial finding emerged when we compared the two datasets, as you can see in the graph. The average positivity rate for the more recent period (2018–2022) was higher than that of the historical period (1985–1994). This reveals an underlying upward trend in canine leishmaniosis over the decades, which was masked by the shorter-term declines within each isolated period.
The overall upward trajectory of temperature coincided with the overall increase in canine leishmaniosis positivity. However, a direct, year-by-year correlation between temperature and positivity was not clear.
From this data, we concluded that leishmaniasis stays pretty stable throughout the years, even if the overall trend is upward, which is still concerning.
All this data is provided as Supplemental material. This data will serve to validate our model results, expecting to find something stable and suggesting that the increase in the temperatures can cause a slight increase on the number of cases in dogs.14,43–45
The model
The SEIRD model is a compartmental system used to describe the spread of infectious diseases. Each component represents a different stage of disease progression. Here's what each letter stands for:
S—Susceptible: Individuals who have not yet been infected but are at risk of contracting the disease. E—Exposed: Individuals who have been infected but are not yet symptomatic or contagious. This accounts for the incubation period. I—Infected: Individuals who are actively infected and can transmit the disease to susceptible individuals. R—Recovered: Individuals who have overcome the infection and may have immunity (depending on the disease). D—Deceased: Individuals who have unfortunately died due to the disease.
The model utilizes transition rates between compartments to represent infection, progression, recovery, and mortality, helping researchers simulate and predict disease dynamics.
Our approach to analyzing canine leishmaniosis in the Tarragona area involves a dual SEIRD-like model that integrates both the dog population and the sandfly vector population, the latter being responsible for transmitting the disease (see Figure 9). The dog model simulates infection dynamics among canines, including susceptibility, exposure, active infection, and mortality. The sandfly model captures fluctuations in the vector population, incorporating factors like seasonal population changes, infection rates, and transmission efficiency. By combining both models, we can analyze yearly disease evolution, identifying patterns that influence the spread of leishmaniosis in Tarragona. It provides a holistic view of the transmission cycle, considering both hosts and vectors. Also, we can add climate change considerations to forecast future increases on the spread. It enables long-term forecasting, helping assess how environmental and demographic shifts affect infection rates. It offers a data-driven foundation for developing targeted control strategies against the disease.

Forrester diagrams implemented on Insightmagker. Source: SEIRD canine leishmaniosis | Insight Maker. https://insightmaker.com/insight/1QnYwktMihpXtzmit0ALMz/SEIRD-canine-leishmaniosis
In order to adapt the existing simulation model, 36 we added dog births, with a variable that multiplies the birth rate by the total population. We then removed the transition flow from the base model, which went from infected humans to recovered humans, since there is no cure for dogs with leishmaniasis. In most cases, dogs live with the disease until death.
In addition, we added a transitional flow that comes out of susceptible dogs and another that comes out of susceptible sandflies, called death without infection, to consider dogs and sandflies that die without catching the disease. In the case of dogs, this flow is affected by a variable that has the mortality rate of dogs, which is multiplied by susceptible dogs so that dogs that do not become infected die without being infected, as happens in real life. In the case of sandflies, this flow is affected by the life expectancy of sandflies that divides susceptible sandflies.
We also decided to reflect seasonal variations in sandfly birth rates throughout the year. To enhance this, we introduced a variable based on the positive part of the sine function, peaking during the hottest months. When live sandflies are present, this variable is multiplied by the total sandfly population and their birth rate. Conversely, if there are no living sandflies, the variable is instead multiplied by the larvae population, which we also incorporated to better align the model with real-world conditions. This adjustment effectively captures the dynamics of sandfly populations, illustrating that as temperatures drop, adult sandflies die off while larvae enter a state of hibernation. 46
Finally, we have changed the variables of new cases in both dogs and sandflies. We have removed the variables that calculated the percentage of susceptible dogs and sandflies, one for new cases of dogs and the other for new cases of sandflies respectively, and we have added a variable that calculates the percentage of infected dogs and sandflies, dividing infected dogs by the total population of dogs and infected sandflies by the total population of sandflies, respectively.
In the original model, 36 there was a variable called the number of bites per sandfly that also affected new cases. The limited research on sandflies has hindered our ability to obtain this data, leading us to exclude it from our analysis. Consequently, infectivity remains the sole variable determining whether a dog is infected by a sandfly and vice versa. In conclusion, the variable of new cases in dogs has remained infectivity, multiplied by the percentage of infected sandflies, multiplied by the population of susceptible dogs. As well as that of new cases in sandflies that has remained as infectivity, multiplied by the percentage of infected dogs, multiplied by the population of susceptible sandflies and all divided by two, since it is only half of the population, the female sandflies, which bite dogs to feed on their blood and thus be able to produce eggs. 47
In this work we follow the assumption classification proposed by Fonseca i Casas 48 where the assumptions are classified on simplification assumptions, systemic data assumptions, and systemic structural assumptions. This approach eventually simplifies the transformation of models to digital twins.
Systemic data assumptions
As a simplification we can consider that (i) only sandflies are considered as a vector, and that (ii) we do not model the details of the sandfly population nor the dog's populations, that are related to the demands on humans, we keep both populations constant every year.
We must obtain data regarding the different elements that will be contained on the model. This data is considered on Table 1. Due to the lack of research in the field of leishmaniasis and the vectors that cause it, sandflies, we have not found some of the necessary data for a final definition of some systemic data assumptions, this is the reason some of them are labeled as valid, but not as true.
Key systemic data assumptions of the model.

Notice that we regard an assumption as true when we believe in its veracity, and we consider it valid when we have doubts about its correctness.
To adjust the data that hasn’t yet been researched due to lack of information, (i.e. larvae population, warming increase), we used Figure 8 to compare it to the graphs resulting from the model and we adjusted the values so that the graphs resulting from the model were adequate to the real data of the graph, which remains pretty stable throughout the years.
Systemic structural assumptions
The model equations, variables and constants are defined below.
State variables (stocks):
Key parameters (constants, data assumptions):
Composite/forcing functions:
The system differential equations:
The flows in the model define the rates of change for the stocks. Here are the ODEs for each compartment.
Susceptible dogs ( Inflow: Outflows: ODE: Exposed dogs ( Inflow: Outflows: ODE: Infected dogs ( Inflow: Outflows: ODE: Susceptible sandflies ( Inflow: Outflows: ODE: Exposed sandflies ( Inflow: Outflows: ODE: c) Infected sandflies ( Inflow: Outflows: ODE: Auxiliary variable Inflow: ODE:
Finally, we detail the expressions that detail the strength of the Infection.
The coupling between the dog and sandfly systems occurs through the forces of infection, Force of infection on dogs ( The probability a bite is infectious ( The biting rate (implicit in ( The probability of transmission per infectious bite ( Force of infection on sandflies ( The probability a bite is on an infectious dog ( The biting rate (implicit in The probability of transmission per bite on an infectious dog (
Summary of the complete ODE system
The full model is described by the following system of seven coupled ODEs:


Results
Once the model was fully adapted and calibrated, we analyzed the resulting graph (Figure 10). This graph features five lines representing the following variables over time: susceptible dogs (dark blue), exposed dogs (green), and infected dogs (yellow). The horizontal axis denotes time in months, with the simulation covering a span of 1200 months, approximately 100 years.

Graph extracted from the simulation model that shows the evolution of the dog population in 20 years.
As illustrated in Figure 10, a substantial proportion of susceptible dogs become infected and experience cyclical exposure each year. This pattern arises because the sandfly population is influenced by seasonal changes, leading to a significant reduction in leishmaniasis transmission during colder months. Initially, there is a pronounced increase in the infection rate; however, the system eventually stabilizes, resulting in a consistent positivity of the disease.
Additionally, the sandfly population exhibits a stable pattern after an initial spike, as the seasonal dynamics remain consistent year after year. In Figure 11, the population of sandflies is detailed, including susceptible (dark blue), exposed (green), and infected (yellow) categories. Meanwhile, Figure 12 focuses solely on the exposed (green) and infected (yellow) sandflies, highlighting the initial surge followed by stabilization.

Graph extracted from the simulation model that shows the evolution of the sandfly population in 20 years.

Graph extracted from the simulation model that shows the evolution of the sandfly population in 20 years (only exposed and infected sandflies).
An initial analysis of Figure 13 reveals the results of our model execution under conditions of improved reproduction for sandflies, because of a climate warming scenario. This analysis confirms our hypothesis: cases of canine leishmaniasis are anticipated to rise significantly over time due to climate change. The increase in cases is contingent upon an expanded breeding season for sandflies, which arises as temperatures increase. The figure illustrates the dynamics of the dog population, where we initially opted for a birth rate that stabilizes the population in the base scenario. However, in this new scenario, the dog population is projected to decline toward zero. This indicates that stability is disrupted due to an increased death rate among dogs caused by leishmaniasis. The main objective of the model is not to see the final population of dogs, but rather the trend it follows. The population would never realistically decline to zero as action would be taken before that took place. However, it makes sense that, in the model, without any regulation or measures taken to control canine leishmaniasis whatsoever, the population declines drastically.

Evolution of dog populations in response to rising temperatures, which extend the seasonal window for sandfly reproduction.
The data suggests that with prolonged favorable conditions for sandfly reproduction, global warming, the incidence of leishmaniasis among canine populations will likely escalate, raising public health concerns. Moreover, the implications of this trend extend beyond canine health, potentially impacting human populations as well. As climate change continues to reshape ecosystems and expand the geographical range of sandflies, understanding, and addressing the dynamics of leishmaniasis transmission becomes increasingly crucial.
Concluding remarks
This research aims to address the issue of modeling the evolution of canine leishmaniasis in the province of Tarragona, Spain. Our primary objective was to develop a simulation model to predict the future evolution of this disease and eventually implement nonpharmaceutical interventions (NPI) to control the spread. To achieve this, we conducted preliminary research into the epidemiology of canine leishmaniosis and explored suitable simulation systems to form the foundation for the practical component of our work.
Our study suggests a likely increase in canine leishmaniosis cases in the Tarragona area, driven by several interconnected factors:
Challenges in disease management: Difficulties in the early detection and isolation of infected dogs, primarily due to subclinical infections, hinder effective control. Limited diagnostic access and delayed intervention contribute to ongoing transmission within the canine population. Climate change extending vector activity: Rising temperatures and altered seasonal patterns are expanding the geographic range and prolonging the active season of sandflies, the primary vector for leishmaniasis. Studies indicate that by 2060, the risk of infection could increase by 71.6% in certain Spanish regions, including Tarragona.
54
Growing canine population: An increase in the domestic dog population, especially in urban and suburban areas, provides more hosts for the parasite, thereby facilitating its spread.
These findings are consistent with existing literature,54,55 which discusses the expansion of canine leishmaniosis into new regions due to climate change and increased dog mobility. They underscore the urgent need for enhanced disease monitoring, robust vector control strategies, and improved diagnostic tools to mitigate the anticipated rise in cases.
However, the model has substantial limitations that constrain the reliability of its long-term predictions.
Sparse and discontinuous data: To make sure the model's results were accurate to reality, we compared the model's graph to a graph made from real leishmaniasis data. This graph went from 1985 to 2022, however, there was missing data from 1995 to 2017 due to the lack of monitoring of the disease. This prevents robust calibration and increases uncertainty. Key parameters are based on assumptions rather than empirical measurements: Sandfly population size, birth rate, and infectivity were estimated and based on that of similar insects and diseases. They were also adjusted by comparing the model's graph to real data. Again, this is due to lack of researched data in this field. The model keeps dog and sandfly populations constant: In other to simplify the model and make it more adaptable, demographic changes, adoption patterns, vector control, and environmental shifts were left out. However, this can be added easily to adjust it to a certain time frame of events and to different situations. This makes the model more versatile and usable as a base. No sensitivity or uncertainty analysis was performed: This important step was not done as it is currently not possible with the available data. However, in the future, it can be done when the data is sufficient.
Given these limitations, the model should be interpreted as a foundational infrastructure that can evolve into a fully operational epidemiological tool. Although current data limitations prevent its complete validation, the structure is already designed to support advanced modeling approaches. With continuous and sufficiently detailed data, the model can be calibrated, tested, and ultimately adapted into a digital twin capable of supporting real-time disease monitoring and forecasting.
A key outcome of this research, as we have said, is the development of a preliminary dynamic model that simulates the evolution of canine leishmaniosis in Tarragona. The methodology developed here, combining data acquisition, historical analysis, and trend comparison, is adaptable for modeling other vector-borne pathogens, such as Zika, dengue, or various forms of encephalitis, thereby aiding in the development of targeted public health strategies.
In future work, we plan to explore the implications of canine leishmaniosis for human public health, a topic beyond the scope of the current study.
Human and canine leishmaniasis are primarily transmitted through the bite of infected female sandflies. While dogs cannot directly transmit the parasite to humans, they act as a primary reservoir host. An increase in canine cases raises the risk of human exposure.
There are important clinical differences: in dogs, leishmaniasis is often a chronic and severe disease, while in humans, it can range from self-healing skin lesions to serious visceral or mucosal forms. Nevertheless, the growing reservoir of infection in the dog population poses a tangible threat to human health, highlighting the need for a “One Health” approach that integrates veterinary and public health interventions. In the future, the model could also be adapted to include humans to be used as a tool for epidemiological modeling and regulation.
Supplemental Material
sj-zip-1-sci-10.1177_00368504261435089 - Supplemental material for Forecasting future trends in canine leishmaniasis through dynamic modeling
Supplemental material, sj-zip-1-sci-10.1177_00368504261435089 for Forecasting future trends in canine leishmaniasis through dynamic modeling by Xènia Fonseca i Llopis, Nerea Lázaro Hernandez and Pau Fonseca i Casas in Science Progress
Footnotes
Acknowledgements
The authors wish to thank Can Flix for providing us with data. The personal experience of one research team member, whose dog was recently diagnosed with leishmaniasis, served as an initial inspiration for undertaking this work. We would also like to thank Theo, the dog with leishmaniasis, who gave us the idea to do this work in the first place and who has provided us with support throughout work.
Ethical statement
This study did not require ethical approval from an institutional review board as it did not involve human or animal subjects. The research was conducted in accordance with relevant ethical guidelines.
Informed consent/patient consent
Not applicable.
Authors’ contribution
Xenia Fonseca i Llopis: Methodology; Conceptualization; Conducted the research; Data interpretation; Data analysis; Implementation; Validation; Writing final draft.
Nerea Lázaro Hernández: Methodology; Conducted the research; Data interpretation; Data analysis.
Pau Fonseca i Casas: Writing, Original draft; Organized content; Data interpretation; Data analysis; Validation; Writing final draft.
Funding
The authors received no financial support for the research, authorship, and/or publication of this article.
Declaration of conflicting interests
The authors declared no potential conflicts of interest with respect to the research, authorship, and/or publication of this article.
Data availability statement
The data obtained on the study are added as Data extracted from other studies (1985–1994): REGISTRE LEISHMANIOSI RECERCA.xlsx Data from:.
44
Data extracted from the animal shelter (2018–2022): REGISTRE LEISHMANIOSI PROTECTORA.xlsx Data from: Can Flix Total leishmaniasis data with temperature: REGISTRE TEMPERATURA TARRAGONA.xlsx![]() .
.
Supplemental material
Supplemental material for this article is available online.
Annex
References
Supplementary Material
Please find the following supplemental material available below.
For Open Access articles published under a Creative Commons License, all supplemental material carries the same license as the article it is associated with.
For non-Open Access articles published, all supplemental material carries a non-exclusive license, and permission requests for re-use of supplemental material or any part of supplemental material shall be sent directly to the copyright owner as specified in the copyright notice associated with the article.