
Abstract
Solar energy is a promising renewable technology to secure energy security and reduce emissions. While there are several solar energy studies, the intensified climate change has altered the climate pattern such as regional sunny hours and the strength of solar radiation. To investigate the impact of climate change on the regional solar energy potential, this study analyses the average sunny hour and solar radiation from monthly data from Jan. 2009 to Apr. 2021 and applies the ARIMA and ARDL models to predict the potential changes of these factors for the period of May 2021 to Dec. 2025. The results show the impact of climate change on solar energy generation potential is geographically different. Based on the historical data, the estimated electricity generation potential from conventional PV, PV/PCM, and PVT/PCM technologies are 2,636, 2,747, and 2868 kWh per m2, respectively. However, under climate impacts, their power potential will be greatly reduced to 2,422, 2,525, and 2636 kWh per m2. Specifically, the future power potential will decline up to 8%, and thus the policymakers should incorporate the climate influence on solar energy development and application to minimize power fluctuation.
Introduction
Energy is an important factor in the development of any country or society. Global energy demand is rising continuously with each passing year1,2 while energy gain is mostly from fossil fuels so energy production from fossil fuels raises the level of CO2 emission in the atmosphere which leads to global warming, air pollution, and climate change. 3 According to the Paris agreement, the target is to limit the increase in temperature below 2.0 C. Therefore, there is a need to transform the current energy structure into low-carbon and environmentally friendly sources including solar energy, wind power, bioenergy, and hydropower. 4
The global capacity of renewable sources of energy is 2357 GW in 2019 with a rise of 176 GW from 2018. Among them, solar energy is dominant with a total installed capacity of 623 GW in 2019 and 55% of the newly installed capacity of all renewable sources. 5 Power generation from Solar Photovoltaic (PV) is solely dependent on meteorological conditions like rainy days, solar radiation, precipitation cloud covering, and wind speed, all of which are subject to climate-induced impacts. 6 Climate change is likely to influence future meteorological conditions such as solar radiation, cloud cover, and regional temperature, and thus the output of solar power will alter in line with these changes. Since solar energy also mitigates climate change by reducing the use of fossil fuels and total emissions, understanding the climate impacts on solar energy development would benefit in terms of a more accurate estimation of power generation and emission reduction. 7
Since the solar power plants have to bear and withstand over a long period, along with the long-term climate influences, there is a need to incorporate the uncertainty induced by the change in climate conditions. Given this situation, analysing how climate change confluences the energy output of the solar PV system helps design a sustainable energy system that has low carbon intensity and smoothly supplies energy for a long period. 8 In this study, we aim to predict the variations of solar power generation potential under climate change in Jiangxi province, China. Specifically, this study analyses how environmental changes will affect factors such as sunny hours and radiation strength that are most crucial in solar energy prediction and generation. A successive time-series regression model is designed and applied to estimate the city-wide sunny hours and radiation strength for the years between 2021 and 2025. With these estimates, we then implement the lifecycle assessment to investigate to what extent climate change would alter regional solar power potential.
With the completion of the tasks, this study will make the following contributions. First, by predicting the potential climate-induced impacts on sunny hours and radiation strength, the results explore the solar power potential in the face of altered climate patterns, which might be useful to decision-makers to formulate renewable energy policies. Second, this study will be beneficial for the investors to obtain a more precise profit measure and make efficient decisions in the development of solar energy. Third, this study illustrates how the distribution of installation of the solar systems may be altered when each city is unevenly impacted by climate change. This further provides information about equity and efficiency when dealing with renewable energy development.
Power generations from fossil fuel-based power plants are recent threads and great concerns for the world environment for which use has been continuously raising the level of carbon emission and causing global warming. Therefore, there is a need to deal with this issue and replace fossil fuels with clean and renewable sources.9,10 Additionally, the development of power plants involves long-term and substantial investments. The life span of the power generating lasts decades and in the face of climate change adversely affecting the environment, it is necessary to incorporate the environmental changes and impacts on efficiency and net power generation output analysis.
Many studies have not keenly focused on the climate impacts on solar photovoltaic performance. According to the output and efficiency of the solar photovoltaic cell are greatly influenced by the temperature, wind speed, relative humidity, and insulation. 11 The capacity factor of solar photovoltaics was 13.8% in 2010, and it has been improved to 18% due to the improvement in technologies of photovoltaic efficiency. 4 It was predicted in some studies that output from solar photovoltaics will decline in the future because temperatures will continuously rise and irradiation will decline, both of which reduce the efficiency of the solar photovoltaic cell. However, in some areas of Europe, Australia, and China, output is predicted to increase. 12
The efficiency of solar panels declines rapidly due to changes in other factors like relative humidity and the degradation rates of crystalline. In recent years, solar panels use a waterproof coating to prevent water into solar panels, but the coating cannot completely prevent factors such as moisture ingress, wind patterns, and cloud cover. 13
The study 14 showed that the solar electrical output would improve with the use of phase change material (PCM) and fins under different climate conditions because of several reasons. First, efficiency still improves under moderate climate impacts. Second, under extreme events, the efficiency of the PV/PCM panel is likely to reduce. Third, under warmer weather conditions the output of the PV/PCM panel improves. Study further pointed out that the irradiation level of the solar and global horizon will decrease by 20% from 2035 to 2039. 15
Renewable sources of energy mostly depend on climate or weather conditions. For example, solar energy depends on solar irradiation, and in the face of global warming, future electricity generation from solar photovoltaic systems may be significantly affected. Surface air temperature and wind velocity will also affect the panel efficiency and thus alter the power generation from the solar PV systems.12,16,17
Climate change will probably change the solar power generation for the next 80 years due to the changes in clouds and aerosols proprieties; however, such influences will vary across regions. For example, the output of solar power plants will probably increase significantly in Europe but decrease in the Middle East and the western part of America. Study also illustrated that climate change will affect the output of solar power plants, and thus there is a need for investors, policymakers, and planners to incorporate and consider the impact of climate changes to improve the decision-making process by taking the use of alternative solar technology, location, and the size of solar power plants into account. 16
Another issue associated with the development of solar energy is its capability for emission reduction. For this reason, solar energy generation has had remarkable growth in the last decades, especially in China. 1 The technological innovation in the photoelectric cell improves the efficiency particularly the conversion efficiency by about 15% to 19% and reduces the development costs significantly. Therefore, the profitability measure should be taken into account to assess the long-term benefits of the development of solar energy.
Cumulative solar PV capacity worldwide
The installed capacity of the solar PV system was very limited before the year 2000, the total installed capacity was merely 1288 MW in the entire world. This is probably due to high development costs, lack of innovative technologies, and low cell efficiency. Afterward, the installation has been rapidly rising to 633,700 MW in 2019. China is the leading producer of solar energy and has more than 30% of the newly installed capacity, which is displayed in Figure 1.

Cumulative installed solar PV capacity worldwide from 2000 to 2019 In (MW). 18
The application of solar is going popular all across the world. Figure 2 illustrates the cumulative installed capacity of solar energy in leading top ten countries. It shows that 86% of the solar PV capacity is installed in these economies while the share of other counties in the world was only 14 percent. The total installation of solar PV is approximately 502 GW in 2019 and this figure is still rising. 19

Recent solar panels and innovative technologies
There are many types of solar panels used worldwide to produce electricity. In this study, we discuss the three most popular modules of solar panels (i.e. conventional solar PV, PV/PCM, and PVT/PCM) and analyse the electricity production from their applications.
Conventional Solar PV
The Sun is the greatest energy source which proves solar irradiation to the earth. After the development of the solar cell and a rapid decline in the cell cost, solar power receives greater attention from most countries because its application is likely to meet national energy demand with a lower impact on the environment.
21
Solar energy was firstly discovered by Edmond Becquerel in 1839 and the first effectively working solar cell was designed by Charles Fritts in 1882. The application of solar PV was limited scale in 1954 because the conversion efficiency from solar to energy was less than 4%,
22
causing the per kWh cost extremely high.
In recent years many varieties of solar panels are available and their efficiencies have been greatly enhanced. In general, the conversion of solar to electricity is dependent on the module type, operating efficiency, and local climate conditions. The overall conversion efficiency is approximately 15 to 20%, but note that the unutilized radiation would produce heat that ultimately reduces the efficiency of the energy conversion process. For example, if the heat raises the temperature of the solar panel to more than 40 °C, a significant variation in the systematic efficiency would be expected.23,24 To overcome this problem, a more advanced module called PV/PCM is considered.
(2) PV/PCM Photovoltaic Phase Change Material
Phase change material (PCM) was firstly explored by Stultz and Wen in 1977. This material is used for cooling the photovoltaic system because, with the temperature rise, cell efficiency declines rapidly.
25
conclude that the utilization of PCM in the cooling of the system is very useful to improve the efficiency of the solar panel because excessive heat produced from the photovoltaic module can be captured.
Research
26
investigated the application of paraffin-based PCM in a very hot climate and concludes that the performance of the solar energy system can be relatively stable during the entire year. Study
27
further points out that by the application of PCM material it will improve electrical output by up to 5.9% under hot climate conditions because of the improved operating effacing of this innovative cooling technique. The panel performance and efficiency with the PCM module are also superior in terms of energy storage density and silence.
25
(3) PVT/PCM Photovoltaic Thermal Phase Change Material
Photovoltaic thermal (PVT) is the most developed energy conversion system which consists of a combination of PV modules and thermal components. A PVT incorporates a thermal collector with the solar PV and thermal collector attached under the panel to transfer the heat to the heat collecting system. This system can simultaneously produce electrical energy and thermal heat.
The difference of the PVT/PCM is the more efficient use of the heat that has not been converted into electrical generation, which may be possibly utilized in drying of fish, dehumidification, heating of buildings, and the textile industry. The hybrid system has the following advantages over the conventional PV system such as the improvement of the efficiency of solar panels and the supply of useful heat energy, and 28 shows that the installation of the heat-transfer system will only take a little extra cost and space.25,28 point out that with the utilization of this innovation, another 5%- 6% of the energy output can be expected.
Methodology
Climate-induced impacts on solar energy
Power plants need long-term investment and huge capital costs. The life span of the power generating sites up to decades and Climate change adversely affects the environment so it is needed to incorporate the environmental changes and their impact on efficiency and net power generation output. Basically, three aspects are considered for incorporation of climate change and its impacts like financial planning, technology, and future output. Many studies do not keenly focus on climate change's impact on solar photovoltaic performance and output. According to study 11 output and efficiency of the solar photovoltaic cell are greatly influenced by majorly following factors firstly air temperature secondly by wind speed 3rdly by relative humidity fourthly by insulation. in the face of climate change (or global warming), the distribution of precipitation has been changed substantially, implying a considerable alteration of regional rainfall, and consequently the number of raining days. The capacity factor of solar photovoltaic was 13.8% in 2010 while due to improvements in technologies of Photovoltaic, efficiency improve up to 18.0% in 2019. 4 It was predicted in some studies that output from solar photovoltaic will decline in the future in many parts of the world. Specifically, in Asia, North Africa, and America Because temperature will rise in the future and irradiation level will decline which reduced the efficiency of the solar photovoltaic cell while many parts of Europe, Australia, and the southeastern part of china it is predicted that solar radiation will further increase which helpful to the solar output. 12
The efficiency of solar panel decline rapidly due to climate change many factors like rising temperature and relative humidity severely effect on the solar panel and it accelerates degradation rates for crystalline latest solar panels using the waterproof coating to prevent the water in solar panels. While this coating does not completely prevent moisture ingress another factor also affects the solar panel efficiency and output like changes in wind patterns and cloud cover and changes in sunny hours and radiation strength predicted due to some conditions affected by climate change. 13
Renewable sources like solar are intensively increasing in every country to meet its energy need while solar energy output will also dependent on climate variables so the influence of meteorological variables on solar energy yield must be considered. Power generation from solar resources depends on solar radiation and wind speed, wind speed and efficiency of the solar panel used. estimated expected changes from the current climate to the end of the century lie in the range(14%,-2%), with a large decline expected in northern countries while a positive trend is expected in southern countries. only a slight decrease is expected in European countries. 17
Studied the impact of climate change on PV output in Fukushima, Japan and concludes that energy generation varies according to the change in climate variables like solar radiation strength, clouds cover, wind speed, and temperature. It is predicted that in the future solar panel output will increase in some areas and decrease in some area Although renewable energy resource helps to mitigate climate they are also vulnerable to climate change. It is predicted that the expected rise in annual solar power generation will be 1.7%, 3.9%, and 4.95 in 2030, 2050, and 2070, respectively because of climate change. Policymakers have to incorporate the environmental changes during the installation of solar panels so smooth energy will be available in the future and japan is prepared for future climate change impacts. 8 The impact of these climate variables on sunny hours and solar radiation and how these variables impact future solar power generation from different technologies are described below.
Data source and data collection
This study used secondary monthly data from the period 2009 January to April 2021 (148 observations) of all the eleven cities of Jiangxi province. Data of all the variables are taken from the world weather online database. This study firstly applies the Auto ARIMA (auto repressor integrated moving average) model for the individual cities and forecasts the series and then after that applies the ARDL (auto repressor distributed lag) and analysis the impact of climate change variable on sunny hours and forecast the sunny hours under climate change variable which are described in below table (Table 1) (1) for the period May 2021 to the December 2025 (56 months). Secondly, we regressed the solar radiation with the application of the ARDL model and forecast the future value of solar radiation from the period May 2021 to 2025 December.
Description of the variable.

Model specifications
ARIMA for identification of control variables
The ARIMA model is widely used in the research field for the forecasting of single time series data. The ARIMA model is developed by two economists Box and Jenkins in the 1970s. The model consists of AR (autoregressive model), I (integration indicating the order of single integer), and MA (moving average model). ARIMA model is applied on the stationary series firstly there is the need to test the stationary of the data. The unit root test is used to check the stationary of the data if the series is nonstationary there is the requirement to convert the non-stationary into the stationary series, with a difference operation. The number of the difference taken from the series is called the order of differencing of a single integer. ARIMA (p, D, q) model consists of a combination of differencing which represent by ‘D’ARMA (p, q) model. By the differencing operation, a non-stationary I (D) series is converted into stationary series by taking the D number of differences. The number of differences is take called or the order of difference. The process of making the non-stationary to stationary is called difference-stationary or unit root processes. Normally the A series that can be modelled as a stationary ARMA (p,q) process after being differenced D times is denoted by ARIMA(p,D,q).
The ARIMA (p,D,q) model is generally specified as follows:

The presence of a periodic pattern in the time series is called seasonality. Seasonality in a time series is expressed by its span, S. For example, monthly solar energy generation has higher values in summer months, so S = 12 in this case.
ARIMA models can be used to forecast seasonal time series data, just like non-seasonal time series data A multiplicative model, including both the non-seasonal and seasonal fluctuations, is used to represent the seasonal ARIMA model. Seasonal ARIMA is generally expressed in the following way


ARDL (auto aggressor distributed lag model) model for forecasting
The autoregressive distributed lag (ARDL)1 model is being used for decades to model the relationship between (economic) variables in a single-equation time series setup Its popularity also stems from the fact that co-integration of non-stationary variables is equivalent to an error correction (EC) process, and the ARDL model has a parameterization in EC form.33,34
The existence of a long-run/co-integrating relationship can be tested based on the EC representation. A bound testing procedure is available to draw conclusive inference without knowing whether the variables are integrated of order zero or one, I(0) or I(1), respectively. 35 The ARDL / EC model is useful for forecasting and to dissent angle long-run relationships from short-run dynamics.
ARDL (p, q, . . ., q) model:
ARDL model specification of sunny hours
We have taken the sunny hours as the dependent variable and climate variables like rainy days, clouds, UV index, average temp, and wind speed is taken as the dependent variable and then forecast the sunny hour.
ARDL model specification for solar radiation
In this model, we have taken the UVI as the dependent variable and Rainy days (RD), clouds, average wind speed (AWS), and an average temp as the independent variable.
Results
In this study, we have forecasted the sunny hours and solar radiation from May 2021 to December 2025 by the application of two econometrics models. The results are displayed in Table 2.
Summary of forecasting performance (discussion).

RMSE (Root Means Square Error), MAE (Mean absolute error), MAPE (Mean abs percentage error), Theil inequality coefficient.
Power potential under various solar PV systems
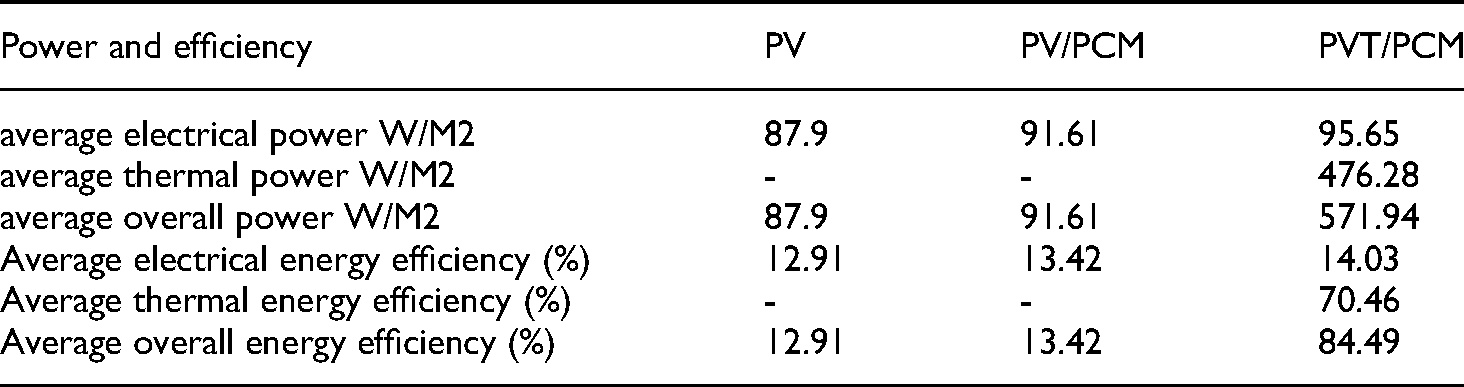
Table 3 presents the potential electricity generation from different technologies. The average electrical power from PV, PV/PCM, and PVT/PCM is 87.9, 91.61, and 95.65 w/m2, respectively. In terms of overall energy efficiency, about 12.91%, 13.42%, and 84.49% of solar radiation can be properly utilized. However, it merits discussing that the PVT/PCM is considered to have the highest electrical and thermal efficiency because it can simultaneously convert solar radiation into electricity and thermal heat.
Power potential under various solar PV systems. 14
Average sunny hours
Table 4 illustrates the average real and forecasted values of sunny hours in each city of Jiangxi province from Jan 2009 to Dec 2021 and May 2021 to Dec 2025, values in parenthesis represent the forecasted value while the values without parenthesis show real values of average sunny hours. This table shows that the average sunny hours in some cities will rise and in some cities will decline, The changes in the predicted values vary across regions, and in general, the overall sunny hours are likely to decline by about 7% from 29,986.90 to (27,867.20) hours in entire Jiangxi province. Average sunny hours of Ganzhou and Pingxiang will be increased further while in many other cities like Jian, Jingdezhen, Nanchang, Xinyu, Yichun, and Yingtan average sunny hours will decline. The only minor change observes in Fuzhou, Jiujiang, and Shangrao in forecasted and real average sunny hours. Shangrao, Yichun, and Yingtan are having the highest average sunny hour and their forecasted values are (3372.40), (2667.00) and, (3062.60) respectively. February has lower average sunny hours of 1818.30 among all the months while august is the month which is having the highest value of sunny hours at 3635.00. Similarly, Table 5 indicates the potential change in average solar radiation for the same period.
Average sunny hours (real and forecasted) for each city of Jiangxi (hours).

Average solar radiation (real and forecasted) for each city of Jiangxi.

Average solar radiation
Table 5 illustrates the average value of solar radiation in Jiangxi province. The average value of solar radiation is 2.9 in January while it is predicted to be 3.1. The average value of the solar radiation is 3.3 while the predicted value is 3.7 in February and thus we may distinguish the changes in solar radiation between different months.
Electricity generation potential
To estimate solar energy potential from alternative technologies, we have to multiply the sunny hours with the solar energy conversion rate. Specifically, the monthly solar PV potential of all cities and entire province collectively is estimated by the following equation:
Table 6 describes the electricity generation potential from different technologies. For the conventional PV, it collectively produces 2636 kWh/m2 for the entire province, among which Shangrao has the highest energy generation potential of 299 kWh/m2 and Pingxiang has the lowest energy generation potential of about 208 kWh/m2. The power potential of PV/PCM and PVT/PCM technology are about 2747 and 2868 kWh/m2, respectively. PVT/PCM is considered to result in the largest energy generation. Since the climate pattern is determined, Shangrao and Pingxiang still have the largest and lowest electrical potential.
Electricity potential from 2009 Jan to 2021 April (kWh/m2).

Forecasted electricity generation potential
To estimate monthly solar PV potential under climate change, we need to multiply the sunny hours by the energy conversion rates of alternative PV systems and the ratio of real and forecasted solar radiation. Specifically, the regional monthly solar PV potential is estimated by the following equation:
Table 7 describes the solar energy generation potential under climate change with alternative solar PV technologies. Shangrao has the highest energy generation potential under all three technologies. It is predicted that Shangrao can potentially produce 305, 318, and 332 kWh/m2 from PV, PV/PCM, and PVT/PCM, respectively. The power potential in Jian and Xinyu are much more vulnerable to climate change and thus their power potential is relatively lower than other cities. Total energy generation from the entire Jiangxi province will be 2,422, 2,525, and 2636 under alternative technologies. It is apparent that PVT/PCM has the greatest energy generation potential for another two modules.
Electricity potential from 2021 may to 2025 Dec (kWh/m2).

Solar energy potential under various technologies
Table 8 describes the energy potential of alternative solar energy technologies under climate change. The value without parenthesis is the value calculated from the average of real sunny hours and the real potential of solar energy generation. Shangrao, Yingtan, and Yichun could produce 298.5, 281.1, and 279.7 kWh/m2 from conventional PV, which are relatively higher than other cities. However, under clime change, the power potential will change to 305.3, 270.2, and 227.4 kWh/m2, respectively.
Solar energy potential under various technologies (kWh/m2).

Shangrao, Ganzhou, and Pingxiang show that energy generation potential will be increase in the future, but a decline is predicted for all other cities. In Shangrao, the predicted energy generation will increase by 2.22%, while Jian, Jingdezhen, and Jiujiang perform a lower solar energy generation. Collectively, by the application of the conventional PV, PV/PCM, and PVT/PCM, real solar energy potential is 2,636, 2747, and 2868 kWh/m2, respectively. While the energy potential is 4.2% higher by the application of PV/PCM instead of conventional PV under climate change, 8.8%. higher with PVT/PCM, an 8.1% decline in energy generation potential is expected due to climate-induced impacts.
Figure 3 shows the power potential of each technology under real and forecasted patterns. In general, power potential in most of the cities will decrease and thus the result will be lower power generation, even with a substantial increase in Shangrao. Therefore, before the large-scale development of solar energy is scheduled, the regional characteristics should be carefully examined.

Solar energy potential under various technologies (kWh/m2).
Economics aspects
Power generation by the application of PVT/PCM based system is higher and more efficient if we compare it with conventional PV system with the average rise of almost 13.77% if we talk about the overall efficiency (electrical and thermal) 28.86% higher than conventional PV, the payback period for the PVT-PCM system is up to 6 years which is 11.26% earlier than the conventional PV. 36
According to 37 annual electricity generation from PV/PCM is higher if we compare it with conventional PV while PV/PCM is still not an economically viable option because of higher initial investment and higher prices of PCM although PV/PCM system produces higher electrical output it did not cover PCM cost easily, so research and development can helps to increase electricity generation and reduce the cost of PCM. The use of PCM with PV will be an attractive option may be in the future if the price of PCM material decline further. 38 PV/PCM analysed economic viability in two climate conditions Ireland and Pakistan and concludes that it is not a viable option in Ireland while it is an economically viable option in the context of Pakistan's climate. 39 The PCM-based cooling technique is having a lower maintenance cost and also study concludes that PV/PCM will be an attractive and economically viable option compared to the PV system in long run. PVT /PCM is economically beneficial for household use in water heating. Total installed capacity rise to 500GW due to declining solar panels cost and installation cost of panels declined up to $0.26/W in July 2018. 38
According to Simón-Allué et al., 40 the photo voltaic thermal system is more efficient than conventional PV with a lower cost and an increased amount of energy per unit area because of electrical performance and better cooling of the panel.
Hamzat et al. studied the economic viability of a hybrid solar power generation system for thermal management of PV systems. PCM and thermal techniques are used for cooling. This experiment represents that energy generation, thermal and electrical efficiency was 12.7 watts, 72.0%, and 13.7, respectively and the cost for energy, annual capacity factor and the payback period was 0.125USD/kWh, 22.03%, and 5–6 years. 41
The cost of the module lies between $1.75–$1.41 while with the rising capacity of PV across the region cost further decline in 2020 up to $0.85–$0.73, PV system has a higher capital cost while operating cost is lower if we compare it with traditional fossil-based power generation and it will decline further in the future, additionally, the output of solar panels is based on solar radiation and sunshine in a specific area. Energy output changed with the change in the strength of solar radiation. 42
Policy implications
Based on the results and discussion provided above, several useful policy suggestions could be derived for decision-makers to design or promote more appropriate policies so that the local characteristics can be well embedded to improve solar energy development and also incorporate the environmental impact on future solar power generation.
Discussion
This study investigates the potential solar electricity generation under climate change in Jiangxi. We accommodate monthly data of climate variables like rainy days, clouds percentage, wind speed, temp, and solar radiation to forecast the possible future climate pattern. First, we predict the values of each variable from May 2021 to Dec 2025 and by the application of ARDL and ARIMA models, we estimate the sunny hours and solar radiation during the same period. Afterward, we evaluate which solar energy system is likely to be more efficient under such a climate pattern.
The results show that the ARDL model is appropriate, and thus we take the monthly average for the observed and predicted value of sunny hours and solar radiation to estimate the net power potential. We find that per m2 kWh electricity generation from the conventional PV is likely to reduce from 2636 to 2422 kWh, a reduction of about 8.1%. Since the PV/PCM and PVT/PCM are considered more efficient technologies, the power potential from these two modules decline slightly from 2747 to 2525 and 2868 to 2636 kWh/m2, respectively.
In the face of climate impacts, investors and solar panel producers have to incorporate the environmental changes so they can meet the changes in electricity generation and fulfil electricity demand. It is also important to work on the improvement of technologies to harness maximum energy from sunlight with lower cost and higher efficiency. PVT/PCM might be an attractive option because it converts radiation more efficiently and has a much lower production cost.
Footnotes
Acknowledgments
The authors thank Dr Chih-Chun Kung for his modelling assistance and comments.
Authors’ contributions
Dr Muhammad Aftab Rafiq designed the study and conducted the analysis. Dr Qin Zhang collected and analysed the data and Dr Liguo Zhang drafted the article.
Declaration of conflicting interests
The author(s) declared no potential conflicts of interest with respect to the research, authorship, and/or publication of this article.
Funding
The author(s) disclosed receipt of the following financial support for the research, authorship, and/or publication of this article: This work was supported by the National Natural Science Foundation of China, (grant number 72073054)